CW3E s Atmospheric River Monitoring and Forecast Product Development: Water Year 2018 S2S and AR Recon Highlights
|
|
|
- Penelope Hoover
- 5 years ago
- Views:
Transcription
1 CW3E s Atmospheric River Monitoring and Forecast Product Development: Water Year 2018 S2S and AR Recon Highlights F. Martin Ralph Director, Center for Western Weather and Water Extremes (CW3E) Scripps Institution of Oceanography University of California San Diego Thank you to our Sponsors USACE CA DWR NASA Scripps NOAA USBR SCWA OCWD USAF

2
3 CW3E Advances in Atmospheric River Science, Observations, and Tools Visualizations, Monitoring and Analysis: Monitoring and Prediction Tools strength and location tracking; watershed scale products; regular outlooks decision support Forecasts: Example of significant forecast error in 2018 Week 2 and 3 AR outlooks West-WRF performance assessment relative to global models Observations: Atmospheric River Reconnaissance


4 A few large storms (or their absence) account for a disproportionate amount of California s precipitation variability WHETHER A YEAR WILL BE WET OR DRY IN CALIFORNIA IS MOSTLY DETERMINED BY THE NUMBER AND STRENGTH OF ATMOSPHERIC RIVERS STRIKING THE STATE. Total precipitation All Other Days LARGE STORM CONTRIBUTION 85% of interannual variability results from how wet the 5% wettest days are each year. These days are mostly atmospheric river events. Dettinger and Cayan Drought and the Delta A Matter of Extremes San Francisco Estuary and Watershed Science, April 2014

5 Distribution of Landfalling Atmospheric Rivers on the U.S. West Coast During Water Year 2018 Through April AR Strength AR Count Weak 16 Moderate 16 Strong 10 Extreme 2 Exceptional 0 44 Atmospheric Rivers made landfall on the West Coast during the 2018 water year through April For California DWR s AR Program Ralph/CW3E AR Strength Scale Weak: IVT= kg m 1 s 1 Moderate: IVT= kg m 1 s 1 Strong: IVT= kg m 1 s 1 Extreme: IVT= kg m 1 s 1 Location of landfall represents position where AR was strongest at landfall. Many ARs move down the coast over time. This map does not show these areas. Exceptional: IVT>1250 kg m 1 s 1 Provided by C. Hecht and F.M. Ralph Experimental 3
6 AR Strength by Month 2018 AR Strength Oct Nov Dec Jan Feb Mar Apr Weak Mod Strong Extreme Excep Number of AR occurrences by state/region Washington Oregon NorCal SoCal Total Provided by C. Hecht and F.M. Ralph Experimental 4

7 WY 2018 Compared to WY 2017 The record breaking WY 2017 experienced a total of 68 landfalling ARs over the U.S. West Coast 60 of the total 68 ARs occurred through April 2017, compared to 44 experienced this WY through April Water Year 2017 Water Year 2018 For California DWR s AR Program For California DWR s AR Program When compared to WY 2017, a larger proportion of landfalling ARs during WY 2018 made landfall over the Pacific Northwest Provided by C. Hecht and F.M. Ralph Experimental 5


8 Northern California Analysis AR Count by Strength Over Northern California weak or mod. ARs occurred over Northern CA during WY 2017, compared to 25 during WY 2018 WY 2017 also experienced 14 strong or extreme ARs compared to only 6 strong ARs during WY 2018 The differences in frequency and strength of landfalling ARs resulted in large differences in WY precipitation over the Northern Sierra 8-Station Index The index received ~56 more ins. of precipitation during WY 2017 than WY 2018 to date (94.7 in. vs in.) Provided by C. Hecht and F.M. Ralph Experimental 6


9 Atmospheric Rivers by Month Cumulative AR Count by Month AR Landfall During February 2018 H For California DWR s AR Program WY 2017 experienced several more AR landfalls per month when compared to WY 2018 Feb was also dominated by persistent ridging and high pressure over the Eastern Pacific All ARs that made landfall during Feb were westerly/northwesterly oriented and over the Pacific Northwest likely leading to small impacts and leaving California dry Provided by C. Hecht and F.M. Ralph Experimental 7
10 AR Forecasts at S2S Lead Times 21
, Dan")


11 CW3E Partnership Week-3 AR CW3E for Week 2-3 Outlooks CW3E S2S Advisory Panel: Marty Ralph (PI; Chair), Dan Cayan, Duane Waliser, Bruce Cornuelle, Art Miller, Elizabeth Barnes For California DWR s AR Program CW3E-SIO Team: Aneesh Subramanian (Lead), Sasha Gershunov, Zhenhai Zhang, Kristen Guirguis, Will Chapman, Tamara Shulgina, Anna Wilson, Minghua Zheng, Brian Kawzenuk JPL: Duane Waliser, Bin Guan, Mike DeFlorio, Alex Goodman Plymouth State University PSU: Jay Cordeira Colorado State University CSU: Elizabeth Barnes, Kyle Nardi Data and collaborations from WCRP / WWRP S2S Project Provided by A. Subramanian 22

12 Predictability of horizontal water vapor transport relative to precipitation: Enhancing situational awareness for forecasting western U.S. extreme precipitation and flooding David A. Lavers, Duane E. Waliser, F. Martin Ralph, Michael D. Dettinger, Geophys. Res. Lett Applying the potential predictability concept to NCEP global ensemble reforecasts, across 31 winters, IVT is found to be more predictable than precipitation in the region N, W. The greatest IVT forecast uncertainty at 7-day lead time along the US West Coast is associated with large IVT and negative 500 hpa height anomalies offshore, i.e., AR conditions. Composite mean of the 500 hpa geopotential height anomalies at the analysis time (shading, in meters) and of the ensemble mean IVT forecast anomalies (contours, dashed where less than climatology) during the 140 largest ensemble spreads on forecast day 7. Colored and contoured regions indicate areas where the composite mean is different from zero at the 90% significance level.
13 Global Assessment of Atmospheric River Prediction Skill DeFlorio, Waliser, Guan, Lavers and Ralph (JHM 2018) Uses ECMWF forecasts and Guana and Waliser (2015) AR Catalog No Skill 1000 km No Skill 500 km In Cool Season there is some AR forecast skill for 500 km distance threshold out to 10 days for 1000 km distance threshold out to 12 days
14 AR Landfall tool for week-1 3 hourly probability values for IVT > 250 kg/m/s in week-1 J. Cordeira and F.M. Ralph Provided by A. Subramanian 23

15 AR Landfall tool extended to week-2 Daily probability values for IVT > 250 kg/m/s in week-2 J. Cordeira and F.M. Ralph Provided by A. Subramanian 24
16 AR Landfall tool extended to week-3 Weekly probability values for IVT > 250 kg/m/s in week-3 J. Cordeira and F.M. Ralph Provided by A. Subramanian 25
 Week-1: 3-h probability for IVT>250 kg m 1 s 1 Week-2: Daily probability for IVT>250 kg m 1 s 1 Week-3: Weekly")

17 AR Landfall tool extended to week-3 Week-3 Week-3 S2S version of AR Landfall Tool (Cordeira et al.) Week-1: 3-h probability for IVT>250 kg m 1 s 1 Week-2: Daily probability for IVT>250 kg m 1 s 1 Week-3: Weekly probability values for IVT proxy >250 kg m 1 s 1 S2S AR Landfall Tool minus climatology Probability relative to MERRA climo Experimental AR Forecasting Research Activity sponsored by California DWR Contact: J. Cordeira (jcordeira@ucsd.edu) Provided by J. Cordeira 26

18 AR Probability maps: week-2 2 ECMWF : 51 ensemble members Provided by A. Subramanian 27


19 AR Probability maps: week-3 Provided by A. Subramanian 28

20 7-day Integrated Vapor Transport (kg/m) Week-3 Integrated Vapor Transport Env. Canada subseasonal forecast of IVT A. Subramanian, Z. Zhang et al. Provided by A. Subramanian 29
21 Week-3 AR Activity (6 hr periods) Env. Canada subseasonal forecast of ARs AR Scale defined in Ralph et al., (2018, accepted) A. Subramanian, Z. Zhang et al. Provided by A. Subramanian 30

22 Mundhenk et al. (2018) introduced an empirical model for predicting anomalous AR activity at S2S leads based on the phase of the MJO and QBO. Results showed the potential for skillful forecasts of opportunity at leads greater 2 weeks, the point beyond which dynamical models provide little additional skill. Image from Mundhenk et al. (2018) Provided by K. Nardi 31


 HSS for IVT Forecasts CA")

23 The empirical model has been modified to forecast anomalous water vapor transport. This model is also being modified to make precipitation forecasts. HSS for AR Count Forecasts CA (EQBO) HSS for AR Count Forecasts CA (EQBO) HSS for AR Count Forecasts CA (QBO Independent) AR Counts HSS for IVT Forecasts CA (EQBO) HSS for IVT Forecasts CA (WQBO) HSS for IVT Forecasts CA (QBO Independent) IVT Provided by K. Nardi 32
 Figure from M. Dettinger 33")
24 Odds of Reaching Water Year Normal Evolution of the 2018 water year in terms of the odds of reaching 100% of normal precipitation by the end of the water year (30 Sep, 2018) Figure from M. Dettinger 33
25 AR Forecasting at Short-Term Lead Times 34


26 AR Monitoring and Prediction Tools CW3E maintains a growing number of AR monitoring & prediction tools Expanding to include more decision support tools, interactive analyses and forecast, watershed-scale tools, pre-event outlooks, and post-event analyses Not just ARs Provided by J. Cordeira 13

27 AR Monitoring and Prediction Tools Outlook by Hecht, Ralph, and Kawzenuk 2 April 2018 Provided by J. Cordeira and F.M. Ralph 14

28 AR Monitoring and Prediction Tools Outlook by Kawzenuk, Ralph, and Hecht 3 April 2018 Provided by J. Cordeira and F.M. Ralph 15


29 AR Monitoring and Prediction Tools Interactive 21 st century California Observing Network data portal (data provided by multiple sources, including NOAA) Interactive watershed-by-watershed GFS precipitation forecasts and NWS/CNRFC hydrologic analyses Provided by J. Cordeira 16

30 AR Rain-Snow Forecast Tool Terrain above rain-snow level Terrain below rainsnow level Watershedaveraged values are calculated Provided by Brian Henn 17


31 Freezing level height AR Rain-Snow Forecast Tool Forecasts by HUC-8 watershed GEFS rain-snow level members and ensemble mean WPC 6-hourly precipitation amounts and rain-snow fractions Provided by Brian Henn Freezing level height expressed as fraction of watershed below rain-snow level 18
32 Rain-snow level April 6-7 Atmospheric River Forecast Forecast for warm AR with 4 precipitation in Sierra Nevada and >12kft rain-snow level Provided by Brian Henn 19


33 Rain-snow level April 6-7 Atmospheric River Forecast Forecast for warm AR with 4 precipitation in Sierra Nevada and >12kft rain-snow level Observed rain-snow level nearly 13kft at New Exchequer radar 14k 13k 12k 11k 10k 9k 8k 7k 6k 5k 4k 3k 2k Rain-snow level (ft) Provided by Brian Henn esrl.noaa.gov/psd/data/obs/datadisplay AR rain-snow level forecast verified; warm temperatures associated with heavy precipitation, snowmelt, and flooding in Sierra Nevada

34 Evaluation of Atmospheric River Predictions by the WRF Model Using Aircraft and Regional Mesonet Observations of Orographic Precipitation and Its Forcing Andrew Martin, F Martin Ralph, Reuben Demirdjian, Laurel DeHaan, Rachel Weihs, John Helly, David Reynolds, Sam Iacobellis. Journal of Hydrometeorology, IWV (mm) 15 aircraft transects of AR were used to measure skill in West-WRF and GFS forecasts. The data, comprising 191 dropsondes in total, were provided by the CalWater experiments of (Ralph et al Bull. Amer. Meteor. Soc.) Martin et al., 2018
35 Evaluation of Atmospheric River Predictions by the WRF Model Using Aircraft and Regional Mesonet Observations of Orographic Precipitation and Its Forcing Andrew Martin, F Martin Ralph, Reuben Demirdjian, Laurel DeHaan, Rachel Weihs, John Helly, David Reynolds, Sam Iacobellis. Journal of Hydrometeorology, GFS Skill vs. Climatology West-WRF Skill vs. Climatology West-WRF Skill vs. GFS Model spin-up error Forecasts above the line are skillful compared to the reference West-WRF adds value to GFS forecasts for key AR variables: 500 hpa geopotential, IVT, IWV for lead times up to 5 days From 15 dropsonde cross sections offshore using 191 dropsondes from aircraft during CalWater and Martin et al., 2018
36 Evaluation of Atmospheric River Predictions by the WRF Model Using Aircraft and Regional Mesonet Observations of Orographic Precipitation and Its Forcing The simulated relationship between AR upslope-directed vapor flux and precipitation was compared to the observed relationship for 10 moderate AR between GFS and West-WRF were evaluated. This same evaluation has been made for other high-res models (e.g. NAM 3km and 12 km) for select recent AR. West-WRF consistently performs best at preserving this first-order driver of orographic precip. West-WRF Forecasts are more skillful in orographic precipitation during landfalling AR 3-4 day lead Normalized Combined Error in Storm- Total Precipitation and Upslope Flux Lead Time (days) West-WRF GFSRe This, along with the previous finding, demonstrate that West-WRF better simulates AR properties offshore and the orographic component of precipitation onshore. Martin et al.,

37 West-WRF Performance in AR Landfalls kg m -1 s -1 CW3E has implemented NCAR s MODE software to detect ARs as objects in NWP forecasts and analyses. An example of paired AR objects from a GFS forecast and analysis is above. Landfalling AR Forecast skill can then be measured and compared across models. For select models and recent AR events, the results are displayed in near-real-time at cw3e.ucsd.edu Martin et al.,

38 km kg/m/s West-WRF Performance in AR Landfalls Landfall Position Error By error in landfall position and intensity at landfall, West-WRF outperforms the other models shown up to 7 days lead time hour 48 hour 72 hour 96 hour 120 hour 144 hour 168 hour 24 hour 48 hour 72 hour 96 hour 120 hour 144 hour 168 hour Intensity Error Magnitude WestWRF WestWRF GFS NAM GEFS CMCENS WestWRF WestWRF GFS NAM GEFS CMCENS MODE The MODE object-based methodology AR Landfall can separately Verification evaluate has been the propagation used to measure and intensity forecast of skill features in a suite like of an models AR. during WY These results, though preliminary, suggest that object-based verification may alleviate the phase error penalty imposed on high res. models by traditional point or grid-to-grid verification. DeHaan and Martin, in prep 38
 Stage-IV QPE (mm) Observed (contours) CW3E is also using MODE to evaluate NWP precipitation forecasts")

39 Object-Based Precipitation Verification West-WRF QPF (mm) All Fields Valid for the 24 hr ending 12 UTC Objects Areas exceeding 50 mm 24 hr: West-WRF (shaded) Stage-IV QPE (mm) Observed (contours) CW3E is also using MODE to evaluate NWP precipitation forecasts during high-impact AR events. The above example shows the spatial relationship between 50 mm 24 hr -1 precipitation forecasted by West-WRF and analyzed by WPC Stage-IV. Similar analysis for recent events and for other NWP models can be found at cw3e.ucsd.edu Provided by A. Martin 39
40 AR Forecast Challenges at Short Lead Times 34

41 Global Assessment of Atmospheric River Prediction Skill DeFlorio, Waliser, Guan, Lavers and Ralph (JHM 2018) Uses ECMWF forecasts and Guana and Waliser (2015) AR Catalog 50% chance of AR forecast to be within 250 km of observed at 2 days lead time No Skill 1000 km No Skill 500 km In Cool Season there is some AR forecast skill for 500 km distance threshold out to 10 days for 1000 km distance threshold out to 12 days
 Moderate Strong Extreme Oroville Dam Spillway Damaged Init: 12Z/5")

, ensemble member minimum (blue), ensemble mean (green), ensemble")
. Time advances from left to right.")

42 NCEP GEFS dprog/dt Example from February 2017 Oroville Case (dam spillway issue) Moderate Strong Extreme Oroville Dam Spillway Damaged Init: 12Z/5 Feb Init: 12Z/6 Feb Init: 12Z/7 Feb Image Description: 7-day forecasts of the NCEP GEFS IVT [kg m 1 s 1 ] at 38N, 123W. The following is indicated at each forecast time: ensemble member maximum (red), ensemble member minimum (blue), ensemble mean (green), ensemble control (black), ensemble standard deviation (white shading), and each individual member (thin gray). Time advances from left to right. Key: Variability in north-south shift of ARs result in increases or decreases in IVT magnitude at the coast. In this case the ARs ultimately ended up stronger. F. M. Ralph (mralph@ucsd.edu) and J. Cordeira 8
 Valid 5 AM PDT 21")
 indicated that")

43 AR Outlook: 22 March 2018 CNRFC 24-hr QPF issued 20 March valid 5 AM PDT 21 to 5 AM 22 March 2018 CNRFC 24-hr QPE valid 5 AM PDT 21 to 5 AM 22 March 2018 CNRFC 24-hr Verification (QPF QPE) Valid 5 AM PDT 21 to 22 March 2018 The 24-hr accumulated precipitation forecast for the period ending at 5 am PDT 22 March had a maximum accumulation of The 24-hr quantitative precipitation estimate (QPE) indicated that ~6 inches fell along the Coastal Mts. and ~2 inches fell over the Santa Ynez Mts. The QPE accumulations resulted in a over forecast of ~3 in. over the Santa Ynez Mts. and an under forecast of ~3 in. over Big Sur 9

44 AR Outlook: 22 March day lead-time forecast Actual landfall position km error in AR landfall position: Big Sur vs Santa Barbara 48-hr AR Forecast Actual AR position Landfall position error The errors in the precipitation forecasts were partly driven by errors in weather model forecast of AR landfall location The forecast issued at 5 PM PT on Mon. 19 March predicted that the core of the AR 2 days later would be located just west of Santa Barbara at 5 PM PT Wed. 21 March, and would have produced up to 10 inches of rain in the mountains above Santa Barbara However, the observations (GFA analysis) showed that the core of the AR was instead over Big Sur (~ km from the predicted position). Big Sur did receive up to 9-10 inches of rain, while mountains above Santa Barbara 4-5 inches 10


45 AR Forecast Evaluation: 22 March 2018 Big Sur Observed Max AR rainfall km landfall position forecast error Santa Barbara Predicted Max AR rainfall Precipitation forecast error pattern was a dipole, representing mostly a position error in the location of the heavy precipitation 11

46 F. M. Ralph, C. Hecht Mesoscale Frontal Wave was key source of AR landfall position error
47 Airborne AR Recon 34
 00Z 13 February (Final Time 12Z 14")
 Color contours show the forecast sensitivity to 850 mb water vapor (grey shading) uncertainty at analysis time 00Z 13 Feb 2014 for a 36-h")
48 Atmospheric River Reconnaissance FM Ralph (Scripps/CW3E), V Tallapragada (NWS/NCEP), J Doyle (NRL) Water managers, transportation sector, agriculture, etc require improved atmospheric river (AR) predictions AR Forecast skill assessment establishes a performance baseline New Adjoint includes moisture and finds AR is prime target 36-h Sensitivity (Analysis) 00Z 13 February (Final Time 12Z 14 February 2014) J. Doyle, C. Reynolds, C. Amerault, F.M. Ralph (International Atmospheric Rivers Conference 2016) Color contours show the forecast sensitivity to 850 mb water vapor (grey shading) uncertainty at analysis time 00Z 13 Feb 2014 for a 36-h forecast over NorCal valid 12Z 14 Feb error 400 km AR Landfall position forecast error at 3-day lead time Forecast improvement area Wick, G.A., P.J. Neiman, F.M. Ralph, and T.M. Hamill, 2013: Evaluation of forecasts of the water vapor signature of atmospheric rivers in operational numerical weather prediction models. Wea. Forecasting, 28, Moisture sensitivity is strongest along AR axis; located > 2000 km upstream Moisture sensitivity substantially larger than temp. or wind sensitivity.


49 2016 Atmospheric River Reconnaissance Flights IVT

 6 storms in 2018 Air Force C-130 Aircraft Weather Recon NOAA G-IV 3 storms in 2018 Each aircraft has a range of about")
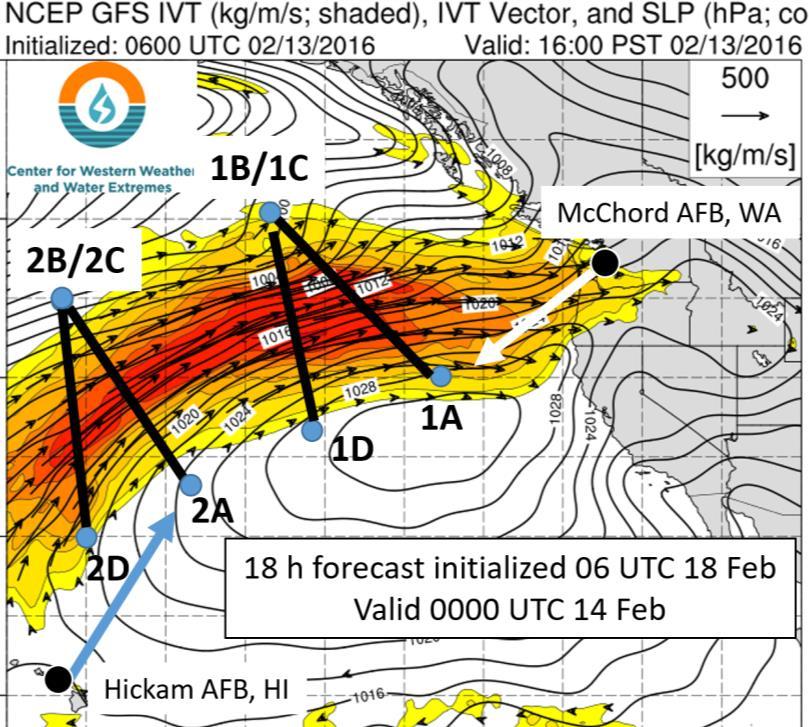
50 60N 55N 50N 3.5 h 3.0 h 2.0 h Upper-level trough/pv anomaly G-IV Ferry time from Seattle (black numbers) 1.0 h 2018 Atmospheric River Reconnaissance Flight Strategies Center time: 0000 UTC Dropsonde deployment window: UTC 45N Example of a target for 40N the NOAA G-IV 35N Example of 30N Atmospheric River target for AF C-130s (color fill: IVT) 160W 150W AF C-130 AF C h 6 h 4 h 3 h 140W 130W 120W On-station time for G-IV (red text) 6 storms in 2018 Air Force C-130 Aircraft Weather Recon NOAA G-IV 3 storms in 2018 Each aircraft has a range of about 3500 nm F.M. Ralph (AR Recon PI) and AR Recon Team
51 Planning Data and Flight Summaries AR Recon 2018 Flight Operations Planning and Execution NWS Co-PI V. Tallapragada (NCEP) Co-PI A. Edman (NWS WR) Co-PI AR Recon PI and Mission Director F.M. Ralph (SIO/CIMEC & CW3E) J. Doyle (NRL) Alternate Coordinators: A. Wilson, J. Kalansky, F. Cannon (CW3E) Flight Execution Major A. Lundry (AF C-130s) J. Parrish (NOAA G-IV) Flight Directors C-130 & G-IV Crews; CARCAH AR Core Target Planning Two C-130s J. Rutz (NWS WR) Primary J. Cordeira (Plym. St.) Alternate AR Core Target - Advisors C. Reynolds (NRL) - backup C. Smallcomb (NWS) D. Lavers (ECMWF) R. Demirdjian (SIO/CW3E) iterate *Meetings led by either Cordeira, Rutz, Lavers, or alternate Moist Adjoint Team C. Reynolds (NRL) Primary J. Doyle (NRL) Alternate R. Demirdjian (SIO/CW3E) - Support Flight Summaries TBD - (SIO/CW3E) PDocs/GrStud Flight Track Assessment Air Force Navigator NOAA (Parrish/Cowan) Coordinator: F. Cannon (CW3E) Daily Forecasts, Flight Summaries and Planning 800 AM PT* AR Recon Forecasting Team J. Cordeira (Plymouth St.) Primary D. Lavers (ECMWF) Alternate J. J. Rutz (NWS WR) Alternate C. Hecht (SIO/CW3E) - Alternate B. Kawzenuk (SIO/CW3E) K. Howard (NCEP), Other TBD iterate Secondary Target Planning NOAA G-IV C. Davis (NCAR) Primary T. Galarneau (U.AZ) Alternate Secondary Target - Advisors J. Doyle (NRL) L. Bosart (SUNY Albany) R. Demirdjian (SIO/CW3E) TBD *Attended by primary and alternate from each group (not by all members of each group) Modeling and Data Assimilation Team A. Subramanian (SIO/CW3E) Primary V. Tallapragada (NCEP) Alternate J. Doyle (NRL), TBD (ECMWF), C. Davis (NCAR), N. Baker (NAVGEM) Zheng, Murphy, Haase, Co (SIO/CW3E) Chen (UC Davis), Galarneau (UA) Key dates 19 January: commit where to deploy the 2nd C Jan - 10 Feb: G-IV is available for 3 storm flights from Seattle 25 Jan - 27 Feb: two C- 130s available for 6 storm flts from Hawaii, Seattle, Travis AFB or San Diego
 Mission Director: F.")

52 AR Recon 2018: IOP 1 on Jan 2018 Key sponsors include US Army Corps of Engineers, NOAA and California Dept. of Water Resources Center time for dropsondes: 0000 UTC 27 Jan 2018 Number of dropsondes planned: 27, 26, 36 (C-130 H, C-130 C, G-IV) Mission Director: F. Martin Ralph (PI; Scripps/CW3E) Co-PIs: Vijay Tallapragada (NWS/NCEP), Andy Edman (NWS/Western Region) C-130 Flight Planning lead: Jon Rutz (NWS) G-IV Flight Planning Lead: Chris Davis (NCAR) Forecasting Lead: Jay Cordeira (Plymouth St. Univ.) Moist Adjoint Lead: Jim Doyle/Carolyn Reynolds (NRL) GPS sensor lead: Jennifer Haase (Scripps/IGPP and CW3E) AR Recon Coordinator: Anna Wilson (Scripps/CW3E) Flight Track Coordinator: Forest Cannon (Scripps/CW3E) Air Force C-130 Flight Director: Ashley Lundry (AF/53rd Weather Recon) NOAA G-IV Flight Director: Jack Parrish (NOAA/AOC) Air Force C-130 Aircraft Weather Recon Squadron NOAA G-IV Modeling Partners NWS/NCEP US NAVY ECMWF NCAR Forecaster Chad Hecht (Scripps/CW3E) Moist Adjoint support Reuben Demirdjian (CW3E) Forecaster David Lavers (ECMWF) Flight Planning ( alternate ) Tom Galarneau (Univ. AZ) Forecaster Philippe Papin (NRL) Onboard Scientist Jon Rutz (NWS) Forecaster Aneesh Subramanian (Scripps/CW3E) Onboard Scientist Reuben Demirdjian (CW3E) Onboard Scientist (GPS) Bing Cao (Scripps/IGPP)


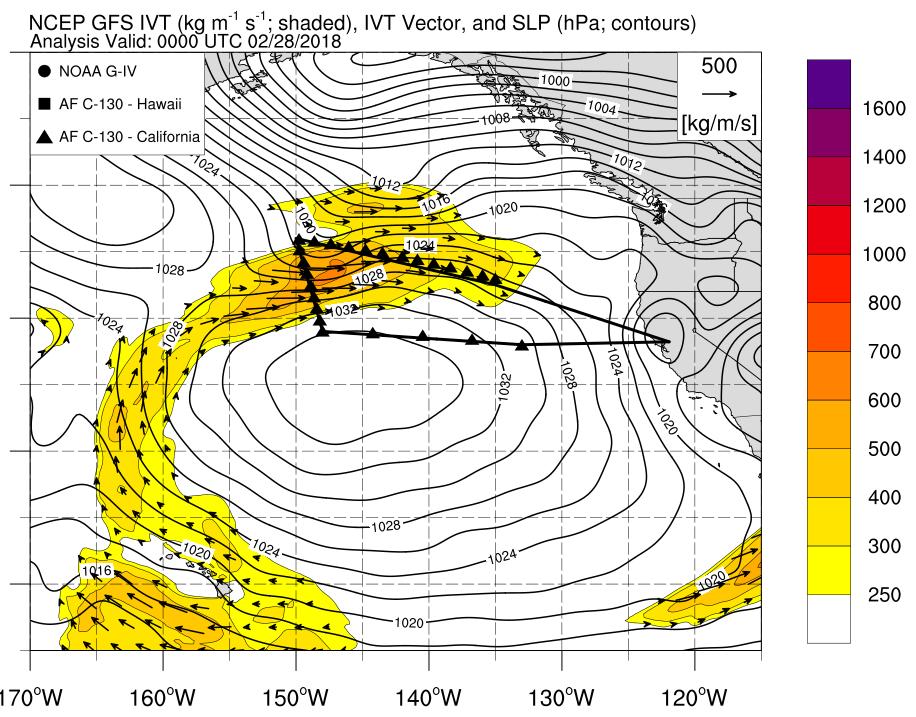
53 IOP2 Jan 29, Z IOP1 Jan 27, Z IOP3 Feb 1, Z G-IV G-IV C-130 C-130 C-130 C-130 C-130 C-130 IOP4 Feb 3, Z IOP5 Feb 26, Z IOP6 Feb 28, Z G-IV C-130 C-130 C-130 C-130


54 C-130 CA Lat Lon Travis AFB A B Day-0 Plan for first AR Recon IOP to fly on Jan C D C-130 HI Lat Lon HI. AFB A B Inches over 3 days 2C 3C 3B 2B NOAA G-IV 3A 3E 1C 1B 2C D G-IV Lat Lon SEA >10 inches of rain predicted in Pacific NW 2D 2A Air Force C-130 3D 1D 1A Air Force C-130 3A B C D E F.M. Ralph and the AR Recon 2018 team
 3C 3B 2B 2A IVT (gray fill) 850 hpa Heights (gray contour) and Winds (vectors) 850")
55 C-130 CA Lat Lon Travis AFB A B C D C-130 HI Lat Lon HI. AFB A B C D G-IV Lat Lon SEA A B C D E C 2D COAMPS Adjoint Sensitivity Valid at 00Z 27 January (42h) 3C 3B 2B 2A IVT (gray fill) 850 hpa Heights (gray contour) and Winds (vectors) 850 hpa Water Vapor Sensitivity (blue/red) Response Function is 12-h Accumulated Precipitation (114 to 126h) 3E 3A 3D 1C 1D 1A 1B provided by J. Doyle and C. Reynolds 43

56 ECMWF Soundings Assimilated from AR Recon 2018 IOP 1 centered on 0000 UTC 27 Jan AR Recon dropsondes assimilated 10% of all radiosondes or dropsondes globally AR Recon dropsondes From 2 Air Force C-130s and the NOAA G-IV US Navy
 V.")
 F. Pappenberger (ECMWF) A.")
57 Atmospheric River Reconnaissance 2016 Contacts: F.M. Ralph V. Tallapragada (NCEP) J. Doyle (NRL) C. Davis (NCAR) F. Pappenberger (ECMWF) A. Subramanian (UCSD)
58 AR Recon 2019: Requesting 3 Aircraft to Sample 9 Storms Two Air Force C-130s and NOAA s G-IV Feb 2016: 3 Storms (2 aircraft per storm) Jan-Feb 2018: 6 Storms (3 aircraft per storm in 3 storms; 2 aircraft in 1 storm; 1 aircraft in 2 storms) o Jan-Mar 2019 (Requested): 9 storms (3 aircraft per storm) o Target total number of cases: 18 storms, with 1, 2 or 3 aircraft sampling each storm Interagency, International Steering Committee in place Carry out assessments Refine data assimilation methods Create appropriate evaluation metrics Provide impact results in peer-reviewed publications Contacts F. M. Ralph (mralph@ucsd.edu) V. Tallapragada (vijay.tallapragada@noaa.gov) 47


59 AR Forecast Tools Extreme Event Summaries Unique Observations Are available at CW3E.UCSD.EDU Contact:

, A.")


60 S2S Outlooks Supporting Water Goal: Develop week-2 and week-3 outlooks for AR activity on the US West Coast. Evaluate and improve understanding of outlooks on these timescales. Scripps Institution of Oceanography: F.M. Ralph (PI), A. Subramanian JPL : Duane Waliser, Mike DeFlorio, Bin Guan, Alex Goodman PSU : Jay Cordeira CSU : Elizabeth Barnes Data : WCRP / WWRP S2S Project Supported by CA Dept. of Water Resources Proposed working with NWS/NCEP/CPC AR probability maps (DeFlorio & Waliser) contact: M. DeFlorio Landfall tool extended to week-2 and week-3 (Cordeira & Ralph) Plymouth State University Colorado State University AR scale probabilities for coastal locations (Subramanian & Ralph)


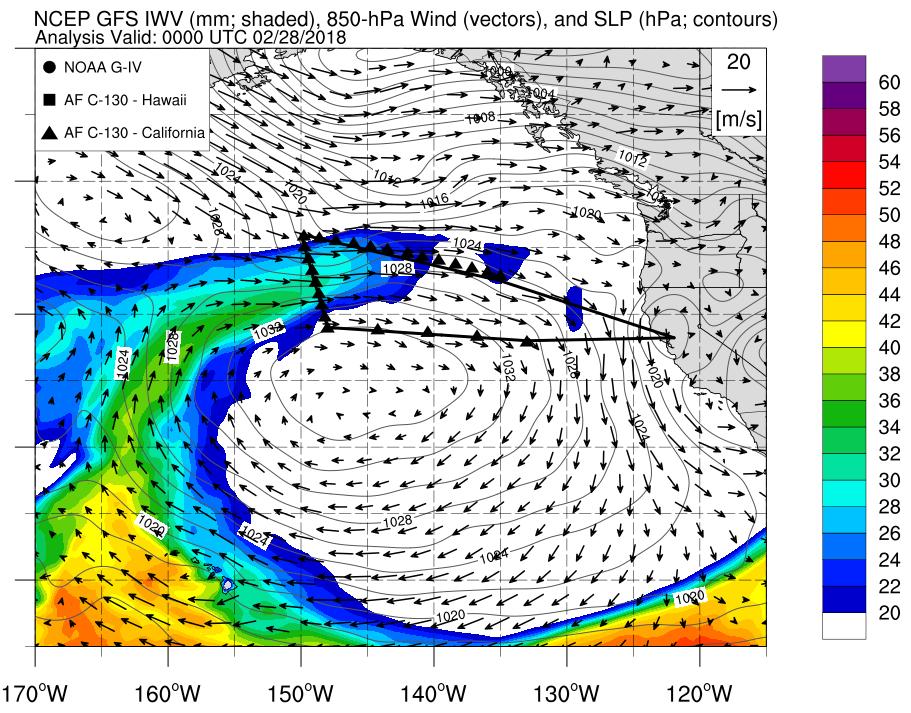
61 IOP1 Jan 27, Z IOP2 Jan 29, Z IOP3 Feb 1, Z G-IV G-IV C-130 C-130 C-130 C-130 C-130 C-130 IOP5 Feb 26, Z IOP4 Feb 3, Z IOP6 Feb 28, Z G-IV C-130 C-130 C-130 C-130
Atmospheric River Reconnaissance
 Air Force C 130 Aircraft Weather Recon Squadron NOAA G IV Atmospheric River Reconnaissance F. Marty Ralph Forest Cannon FMA Annual Conference 6 Sep. 2018 Reno NV Atmospheric River Reconnaissance FM Ralph
QPF? So it s a Land-falling Atmospheric River, Can That Help the Forecaster Make a Better. David W. Reynolds
 So it s a Land-falling Atmospheric River, Can That Help the Forecaster Make a Better QPF? David W. Reynolds Cooperative Institute for Research in Environmental Sciences Boulder, CO Brian Kawzenuk Center
Anticipating Extreme Precipitation Events: Atmospheric Rivers and Scripps/CW3E Weather Modeling for the Bay Area
 16 inches of rain in 1 day in Central California Anticipating Extreme Precipitation Events: Atmospheric Rivers and Scripps/CW3E Weather Modeling for the Bay Area F. Martin Ralph Center for Western Weather
Atmospheric Rivers. F. Martin Ralph Center for Western Weather and Water Extremes UC San Diego/Scripps Institution of Oceanography
 Atmospheric Rivers F. Martin Ralph Center for Western Weather and Water Extremes UC San Diego/Scripps Institution of Oceanography WRPI San Jose State University, CA, 6 April 2017 Outline What is an atmospheric
Experimental Research in Subseasonal Forecasting of Atmospheric Rivers
 Experimental Research in Subseasonal Forecasting of Atmospheric Rivers Mike DeFlorio 1, Duane Waliser 2,3, F. Martin Ralph 1, Luca Delle Monache 1, Bin Guan 2,3, Alexander Goodman 2, Aneesh Subramanian
Experimental Short-term Forecasting of Atmospheric Rivers
 Experimental Short-term Forecasting of Atmospheric Rivers Mike DeFlorio 1, Duane Waliser 2,3, F. Martin Ralph 1, Luca Delle Monache 1, Bin Guan 2,3, Alexander Goodman 2, Aneesh Subramanian 1, Zhenhai Zhang
Atmospheric Rivers: Western U.S. Rainmakers and Key to Forecast-Informed Reservoir Operations
 Atmospheric Rivers: Western U.S. Rainmakers and Key to Forecast-Informed Reservoir Operations F. Martin Ralph UC San Diego/Scripps Institution of Oceanography A New Frontier in Water Operations: Atmospheric
Opportunities for Improving S2S Forecasting in the West: Extreme Precipitation and Atmospheric Rivers
 Opportunities for Improving S2S Forecasting in the West: Extreme Precipitation and Atmospheric Rivers F. Martin Ralph UC San Diego/Scripps Institution of Oceanography Sub-Seasonal and Seasonal Precipitation
Experimental Subseasonal Forecasting Of Atmospheric River Variations For The Western U.S. Winters and
 International Conferences on Subseasonal to Decadal Prediction 17-21 September, 2018 NCAR, Boulder, CO Experimental Subseasonal Forecasting Of Atmospheric River Variations For The Western U.S. Winters
CW3E Atmospheric River Update Outlook
 CW3E Atmospheric River Update Outlook Two systems expected to produce precipitation over the U.S. West Coast in the next week - AR conditions (IVT >250 kg m -1 s -1 and IWV >20 mm) are expected over most
CW3E Atmospheric River Post Event Summary
 CW3E Atmospheric River Post Event Summary CW3E Atmospheric River Post Event Summary Strong AR recently made landfall over northern California - The AR reached its strongest magnitude of ~ 750 kg m -1 s
How do Spectrally Vast AR Thwart Attempts to Skillfully Forecast their Continental Precipitation?
 How do Spectrally Vast AR Thwart Attempts to Skillfully Forecast their Continental Precipitation? International Atmospheric Rivers Conference Modeling and Methods Session 1 August 9, 2016 Andrew Martin
Outlook provided by B. Kawzenuk, J. Kalansky, and F.M. Ralph; 11 AM PT Monday 8 January 2018
 Outlook provided by B. Kawzenuk, J. Kalansky, and F.M. Ralph; 11 AM PT Monday 8 January 2018 CW3E Atmospheric River Update Outlook AR conditions currently bringing precipitation to U.S. West Coast - The
Recent Developments in Atmospheric River Science, Prediction and Applications
 Recent Developments in Atmospheric River Science, Prediction and Applications F. Martin Ralph Center for Western Weather and Water Extremes UC San Diego/Scripps Institution of Oceanography NOAA G-IV NOAA
Outlook provided by B. Kawzenuk, J. Kalansky, and F.M. Ralph; 3 PM PT Wednesday 3 January 2018
 Outlook provided by B. Kawzenuk, J. Kalansky, and F.M. Ralph; 3 PM PT Wednesday 3 January 2018 CW3E Atmospheric River Update Outlook Two systems expected to produce precipitation over the U.S. West Coast
CW3E Atmospheric River Summary
 CW3E Atmospheric River Summary A strong AR made landfall over southern California this week - The atmospheric river made initial landfall over Big Sur around 1800 UTC Wednesday, 20 March 2018 - AR conditions
CW3E Atmospheric River Outlook Update on the Multiple ARs forecast to Impact California this Week - Forecast confidence in the onset, duration, and
 CW3E Atmospheric River Outlook Update on the Multiple ARs forecast to Impact California this Week - Forecast confidence in the onset, duration, and magnitude of AR conditions has increased since the last
CW3E Atmospheric River Update Outlook
 Outlook provided by B. Kawzenuk, J. Kalansky, and F.M. Ralph; 12 PM PT Wednesday 7 March 2018 CW3E Atmospheric River Update Outlook Weak Atmospheric River expected to impact the U.S. West Coast this week
CW3E Atmospheric River Outlook
 CW3E Atmospheric River Outlook For California DWR s AR Program Potential for Atmospheric River Activity over California Next Week - Multiple systems are currently forecasted to potentially bring AR conditions
CW3E Atmospheric River Update and Outlook
 Summary by C. Hecht and F.M. Ralph 3 PM PT Thurs 19 Jan. 2017 CW3E Atmospheric River Update and Outlook Update on 3 ARs Forecast to Impact the West Coast Over Next Several Days - AR 1 made landfall over
CW3E Atmospheric River Outlook
 CW3E Atmospheric River Outlook For California DWR s AR Program Update on the ARs forecast to Impact California this Week - Forecast confidence within the GEFS has continued to increase for the two ARs
CW3E Atmospheric River Outlook
 CW3E Atmospheric River Outlook For California DWR s AR Program Update on the ARs Currently Impacting and Forecast to Impact the U.S. West Coast - Precip. has begun in association with AR 1, where as much
Assessing the Climate-Scale Variability and Seasonal Predictability of Atmospheric Rivers Affecting the West Coast of North America
 Assessing the Climate-Scale Variability and Seasonal Predictability of Atmospheric Rivers Affecting the West Coast of North America Alexander Gershunov, Tamara Shulgina, Marty Ralph, David Lavers CW3E
CW3E Atmospheric River Outlook Update on Atmospheric River Forecast to Impact California This Week - Light to moderate precipitation has begun
 CW3E Atmospheric River Outlook Update on Atmospheric River Forecast to Impact California This Week - Light to moderate precipitation has begun falling over portions of California - GFS Ensemble members
CW3E Atmospheric River Outlook
 CW3E Atmospheric River Outlook Update on Atmospheric River Forecast to Impact California This Week - Precipitation continues to fall across portions of California - The AR will begin to propagate southward
Mesoscale Frontal Waves Associated with Landfalling Atmospheric Rivers
 Mesoscale Frontal Waves Associated with Landfalling Atmospheric Rivers FIRO Science Task Group Workshop May 30, 2017 Andrew Martin, Brian Kawzenuk, Julie Kalansky, Anna Wilson, F. Martin Ralph Contacts:
Lake Mendocino Forecast Informed Reservoir Operations
 Lake Mendocino Forecast Informed Reservoir Operations F. Martin Ralph Center for Western Weather and Water Extremes UC San Diego/Scripps Institution of Oceanography California Extreme Precipitation Symposium
CW3E Atmospheric River Outlook
 CW3E Atmospheric River Outlook For California DWR s AR Program Multiple ARs Forecast to impact the USWC in the coming Week - A shift into an active flow pattern may result in the landfall of successive
CW3E Atmosphere River Update - Summary
 CW3E Atmosphere River Update - Summary Two Atmospheric Rivers (ARs) made landfall over the Pacific Northwest over the previous four days These events combined to produce >400 mm of precipitation in southern
CW3E Atmospheric River Update
 CW3E Atmospheric River Update Update on Late Season AR Forecast to Impact West Coast Later This Week - Little change from yesterday s forecast - Ensemble GFS members are still in good agreement of the
CW3E Atmospheric River Update Outlook Strong AR forecast to impact California this weekend - A strong AR with IVT as high as 1000 kg m -1 s -1 is
 CW3E Atmospheric River Update Outlook Strong AR forecast to impact California this weekend - A strong AR with IVT as high as 1000 kg m -1 s -1 is forecast make landfall over the West Coast this Weekend
DWR Investments in Improving Forecasts at all Time Scales
 DWR Investments in Improving Forecasts at all Time Scales Dr. Michael Anderson, State Climatologist WEF Water Year 2019: Feast or Famine? December 5, 2018 Talk Overview Drought, Flood, and Atmospheric
Forecasting Challenges
 Forecasting Challenges 2017-18 Alex Tardy- NWS San Diego Alexander.Tardy@noaa.gov CW3E meetings April 2018 Atmospheric Rivers Climate Forecast System by NOAA 100-h fuel moisture all-time low for South
National Weather Service-Pennsylvania State University Weather Events
 National Weather Service-Pennsylvania State University Weather Events Abstract: West Coast Heavy Precipitation Event of January 2012 by Richard H. Grumm National Weather Service State College PA 16803
CW3E Atmospheric River Update
 CW3E Atmospheric River Update Update on AR Currently Impacting CA, OR, and WA Precipitation continues to fall over portions of Northern California, Washington, and Oregon 6 10 inches of precipitation has
CW3E Atmospheric River Outlook
 CW3E Atmospheric River Outlook Update on Atmospheric River Forecast to Impact California Next Week - The terminus of the atmospheric river plume is approaching coastal CA and precipitation will begin today
Talk Overview. Concepts. Climatology. Monitoring. Applications
 Atmospheric Rivers Talk Overview Concepts Climatology Monitoring Applications Satellite View Where is the storm? Where is the impact? Atmospheric Rivers Plume or fire hose of tropical moisture Heavy precipitation
Benjamin J. Moore. Education. Professional experience
 Benjamin J. Moore Department of Atmospheric and Environmental Sciences University at Albany, State University of New York 1400 Washington Avenue Albany, New York, 12222 phone: +1 507 398 7427 email: bjmoore@albany.edu
CW3E Atmospheric River Update
 CW3E Atmospheric River Update Update on ARs Currently Impacting and Forecast to Impact West Coast Precipitation continues to fall over a majority of California The Transverse Mountains (north of Santa
AMERICAN METEOROLOGICAL SOCIETY
 AMERICAN METEOROLOGICAL SOCIETY Bulletin of the American Meteorological Society EARLY ONLINE RELEASE This is a preliminary PDF of the author-produced manuscript that has been peer-reviewed and accepted
New Zealand Heavy Rainfall and Floods
 New Zealand Heavy Rainfall and Floods 1. Introduction Three days of heavy rainfall associated with a deep upper-level low (Fig. 1) brought flooding to portions of New Zealand (Fig. 2). The flooding was
Southern California Storm of July 2015
 Southern California Storm of 18-20 July 2015 Discussion Former Hurricane Dolores moved north through the northeast Pacific along the Mexican and California coasts The tropical air mass associated with
Landfalling Impacts of Atmospheric Rivers: From Extreme Events to Long-term Consequences
 Landfalling Impacts of Atmospheric Rivers: From Extreme Events to Long-term Consequences Paul J. Neiman 1, F.M. Ralph 1, G.A. Wick 1, M. Hughes 1, J. D. Lundquist 2, M.D. Dettinger 3, D.R. Cayan 3, L.W.
Recent Updates to Objective Atmospheric Detection Techniques and Resulting Implications for Atmospheric River Climatologies
 Recent Updates to Objective Atmospheric Detection Techniques and Resulting Implications for Atmospheric River Climatologies Gary Wick NOAA ESRL PSD With help from: P. Neiman, M. Ralph, D. Jackson, D. Reynolds,
Climate Change and Water Supply Research. Drought Response Workshop October 8, 2013
 Climate Change and Water Supply Research Drought Response Workshop October 8, 2013 DWR Photo Oroville Reservoir, 2009 Talk Overview Expectations History Atmospheric Rivers and Water Supply Current Research
Climate Impacts to Southwest Water Sector. Dr. Dave DuBois New Mexico State Climatologist
 Climate Impacts to Southwest Water Sector Dr. Dave DuBois New Mexico State Climatologist Presented at EPA Extreme Events and Climate Adaptation Planning Workshop June 3, 2015 Water Year Precip. % of Average
CalWater-2015 Update 26 January 2015
 CalWater-2015 Update 26 January 2015 Marty Ralph (UCSD/Scripps), Kim Prather (UCSD/Scripps), Allen White (NOAA/PSD), Ruby Leung (DOE/PNNL), Ryan Spackman (NOAA & STC), Daniel Rosenfeld (Hebrew Univ. of
El Niño, Climate Change and Water Supply Variability
 El Niño, Climate Change and Water Supply Variability Talk Overview El Niño and California California Climate Variability and Change Water Management in the Face of Change California s topography affects
2. Methods and data. 1 NWS Reno, NV report circulated in the LA Times story maximum wind was observed at 0900 AM 8 January 2017.
 The California Extreme Precipitation Event of 8-10 January 2017 By Richard H. Grumm and Charles Ross National Weather Service State College, PA 16803 1. Introduction A strong Pacific jet and a surge of
Northeastern United States Snowstorm of 9 February 2017
 Northeastern United States Snowstorm of 9 February 2017 By Richard H. Grumm and Charles Ross National Weather Service State College, PA 1. Overview A strong shortwave produced a stripe of precipitation
Cooperative Institute for Research in Environmental Sciences (CIRES) CU-Boulder 2. National Oceanic and Atmospheric Administration
 CU-Boulder 2. National Oceanic and Atmospheric Administration") Moisture transport during the inland penetrating atmospheric river of early November 006 in the Pacific Northwest: A high-resolution model-based study Michael J. Mueller 1 and Kelly Mahoney 1 Cooperative
Moisture transport during the inland penetrating atmospheric river of early November 006 in the Pacific Northwest: A high-resolution model-based study Michael J. Mueller 1 and Kelly Mahoney 1 Cooperative
National Weather Service-Pennsylvania State University Weather Events
 National Weather Service-Pennsylvania State University Weather Events Abstract: Tropical Storm Debbie, standardized anomalies and heavy rainfall by Richard H. Grumm National Weather Service State College
Impacts of the April 2013 Mean trough over central North America
 Impacts of the April 2013 Mean trough over central North America By Richard H. Grumm National Weather Service State College, PA Abstract: The mean 500 hpa flow over North America featured a trough over
Activities of NOAA s NWS Climate Prediction Center (CPC)
") Activities of NOAA s NWS Climate Prediction Center (CPC) Jon Gottschalck and Dave DeWitt Improving Sub-Seasonal and Seasonal Precipitation Forecasting for Drought Preparedness May 27-29, 2015 San Diego,
Activities of NOAA s NWS Climate Prediction Center (CPC) Jon Gottschalck and Dave DeWitt Improving Sub-Seasonal and Seasonal Precipitation Forecasting for Drought Preparedness May 27-29, 2015 San Diego,
SEPTEMBER 2013 REVIEW
 Monthly Long Range Weather Commentary Issued: October 21, 2013 Steven A. Root, CCM, President/CEO sroot@weatherbank.com SEPTEMBER 2013 REVIEW Climate Highlights The Month in Review The average temperature
Climate Variability and Change, and Southern California Water San Gabriel Valley Water Forum, Pomona, CA, October 2, 2014
 Climate Variability and Change, and Southern California Water San Gabriel Valley Water Forum, Pomona, CA, October 2, 2014 Dan Cayan (with Mike Dettinger, David Pierce, Suraj Polade, Mary Tyree, Alexander
National Weather Service-Pennsylvania State University Weather Events
 National Weather Service-Pennsylvania State University Weather Events Heavy Rain 7-8 December 2011 by Richard H. Grumm National Weather Service State College PA 16803 Abstract:. A mid-level short-wave
Pre-Christmas Warm-up December 2013-Draft
 Pre-Christmas Warm-up 21-23 December 2013-Draft By Richard H. Grumm National Weather Service State College, PA 1. Overview A large ridge over the west-central Atlantic (Fig.1) and trough moving into eastern
Heavy Rainfall Event of June 2013
 Heavy Rainfall Event of 10-11 June 2013 By Richard H. Grumm National Weather Service State College, PA 1. Overview A 500 hpa short-wave moved over the eastern United States (Fig. 1) brought a surge of
Tropical Storm Hermine: Heavy rainfall in western Gulf By Richard H. Grumm National Weather Service Office State College, PA 16803
 Tropical Storm Hermine: Heavy rainfall in western Gulf By Richard H. Grumm National Weather Service Office State College, PA 16803 1. INTRODUCTION Tropical storm Hermine, the eighth named tropical system
Early May Cut-off low and Mid-Atlantic rains
 Abstract: Early May Cut-off low and Mid-Atlantic rains By Richard H. Grumm National Weather Service State College, PA A deep 500 hpa cutoff developed in the southern Plains on 3 May 2013. It produced a
Water Year 2019 Wet or Dry?? Improving Sub-seasonal to Seasonal Precipitation Forecasting Jeanine Jones, Department of Water Resources
 Water Year 2019 Wet or Dry?? Improving Sub-seasonal to Seasonal Precipitation Forecasting Jeanine Jones, Department of Water Resources Sub-Seasonal to Seasonal (S2S) Precipitation Forecasting Operational
West Coast Multi-Day heavy Precipitation Event 28 November-2 December 2012-Draft
 West Coast Multi-Day heavy Precipitation Event 28 November-2 December 2012-Draft By Richard H. Grumm and Charles Ross National Weather Service State College, PA 16803 Contributions by the Albany MAP and
What Determines the Amount of Precipitation During Wet and Dry Years Over California?
 NOAA Research Earth System Research Laboratory Physical Sciences Division What Determines the Amount of Precipitation During Wet and Dry Years Over California? Andy Hoell NOAA/Earth System Research Laboratory
Projected Impacts of Climate Change in Southern California and the Western U.S.
 Projected Impacts of Climate Change in Southern California and the Western U.S. Sam Iacobellis and Dan Cayan Scripps Institution of Oceanography University of California, San Diego Sponsors: NOAA RISA
Investigating Mechanisms of Cool Season Upper Colorado River Basin Precipitation
 Investigating Mechanisms of Cool Season Upper Colorado River Basin Precipitation Benjamin Hatchett 1,2, Nina Oakley 1,2, John Abatzoglou 3, and Jon Rutz 4 1 Division of Atmospheric Sciences, Desert Research
A Synoptic Climatology of Heavy Precipitation Events in California
 A Synoptic Climatology of Heavy Precipitation Events in California Alan Haynes Hydrometeorological Analysis and Support (HAS) Forecaster National Weather Service California-Nevada River Forecast Center
Mesoscale Predictability of Terrain Induced Flows
 Mesoscale Predictability of Terrain Induced Flows Dale R. Durran University of Washington Dept. of Atmospheric Sciences Box 3516 Seattle, WA 98195 phone: (206) 543-74 fax: (206) 543-0308 email: durrand@atmos.washington.edu
Uncertainty in Operational Atmospheric Analyses. Rolf Langland Naval Research Laboratory Monterey, CA
 Uncertainty in Operational Atmospheric Analyses 1 Rolf Langland Naval Research Laboratory Monterey, CA Objectives 2 1. Quantify the uncertainty (differences) in current operational analyses of the atmosphere
291. IMPACT OF AIRS THERMODYNAMIC PROFILES ON PRECIPITATION FORECASTS FOR ATMOSPHERIC RIVER CASES AFFECTING THE WESTERN UNITED STATES
 291. IMPACT OF AIRS THERMODYNAMIC PROFILES ON PRECIPITATION FORECASTS FOR ATMOSPHERIC RIVER CASES AFFECTING THE WESTERN UNITED STATES Clay B. Blankenship, USRA, Huntsville, Alabama Bradley T. Zavodsky
Jessica Lundquist 1, Paul Neiman 3, Brooks Martner 2,3, Allen White 2,3, Dan Gottas 2,3, Marty Ralph 3
 PRELIMINARY STUDY RESULTS Rain versus Snow in the Sierra Nevada, CA: Comparing free-air observations of melting level with surface measurements Jessica Lundquist 1, Paul Neiman 3, Brooks Martner 2,3, Allen
Hydrologic Research Laboratory Department of Civil and Environmental Engineering University of California, Davis
 Physically-Based Estimation of Maximum Precipitation: Preliminary Results on Application to American River Basin for the December,1996-January,1997 Flood Event Hydrologic Research Laboratory Department
Weather and Climate Summary and Forecast Winter
 Weather and Climate Summary and Forecast Winter 2016-17 Gregory V. Jones Southern Oregon University February 7, 2017 What a difference from last year at this time. Temperatures in January and February
Extreme precipitation events in the. southeast U.S.
 Extreme precipitation events in the Southeast US A preliminary investigation of operational forecast challenges related to moisture sources and transport TN flooding May 2010 Asheville, NC 2004 State Climate
Spring Water Supply and Weather Outlook How about that near Miracle March?
 Spring Water Supply and Weather Outlook How about that near Miracle March? tim.bardsley@noaa.gov NWS Reno 4.10.18 1 Out the Window March and early April have been Boom not Bust Key Points Up Front Wet
Snow, freezing rain, and shallow arctic Air 8-10 February 2015: NCEP HRRR success story
 Snow, freezing rain, and shallow arctic Air 8-10 February 2015: NCEP HRRR success story By Richard H. Grumm National Weather Service State College, PA 1. Overview A short-wave (Fig. 1) moved over the strong
Weather and Climate Summary and Forecast Summer 2017
 Weather and Climate Summary and Forecast Summer 2017 Gregory V. Jones Southern Oregon University August 4, 2017 July largely held true to forecast, although it ended with the start of one of the most extreme
Flood Risk Assessment
 Flood Risk Assessment February 14, 2008 Larry Schick Army Corps of Engineers Seattle District Meteorologist General Assessment As promised, La Nina caused an active winter with above to much above normal
S2S Research Activities at NOAA s Climate Program Office (CPO)
") S2S Research Activities at NOAA s (CPO) Dan Barrie, Program Manager, NOAA September 2016 MAPP Program: Annarita Mariotti (director), Heather Archambault (program manager), Will Chong (program assistant),
S2S Research Activities at NOAA s (CPO) Dan Barrie, Program Manager, NOAA September 2016 MAPP Program: Annarita Mariotti (director), Heather Archambault (program manager), Will Chong (program assistant),
NOAA MAPP Program S2S Activities Focus on select products/capabilities/metrics
 NOAA MAPP Program S2S Activities Focus on select products/capabilities/metrics Annarita Mariotti, Dan Barrie, Ali Stevens and Emily Read NOAA OAR/Climate Program Office MAPP Mission and Priority Areas
Mid-West Heavy rains 18 April 2013
 Abstract: Mid-West Heavy rains 18 April 2013 By Richard H. Grumm and Charles Ross National Weather Service State College, PA The relatively wet conditions during the first 16 days of April 2013 set the
CW3E Atmospheric River Update
 CW3E Atmospheric River Update Update on ARs Currently Impacting and Forecast to Impact West Coast As much as 6.5 inches of precipitation has fallen over the high elevations of CA over the previous 48 hours
2016 INTERNATIONAL ATMOSPHERIC RIVERS CONFERENCE SAN DIEGO, CA 8-11 August 2016
 ATMOSPHERIC RIVERS AND ENHANCED INTEGRATED VAPOR TRANSPORT EPISODES: THEIR ROLE IN DAMAGING FRONTAL PASSAGES IN SOUTHERN CALIFORNIA WITH AN EMPHASIS ON STRONG WINDS 2016 INTERNATIONAL ATMOSPHERIC RIVERS
Forecasting Precipitation Distributions Associated with Cool-Season 500-hPa Cutoff Cyclones in the Northeastern United States
 Forecasting Precipitation Distributions Associated with Cool-Season 500-hPa Cutoff Cyclones in the Northeastern United States Melissa Payer, Lance F. Bosart, Daniel Keyser Department of Atmospheric and
Weather and Climate Summary and Forecast October 2018 Report
 Weather and Climate Summary and Forecast October 2018 Report Gregory V. Jones Linfield College October 4, 2018 Summary: Much of Washington, Oregon, coastal California and the Bay Area and delta region
Enhanced Predictability During Extreme Winter Flow Regimes
 Enhanced Predictability During Extreme Winter Flow Regimes Ryan N. Maue (WeatherBELL Analytics - Atlanta) maue@weatherbell.com ECMWF UEF 2016 Reading, UK June 6 9, 2016 Where does forecast verification
Hurricane Alex: Heavy rainfall and anomalous precipitable water By Richard H. Grumm National Weather Service Office State College, PA 16803
 Hurricane Alex: Heavy rainfall and anomalous precipitable water By Richard H. Grumm National Weather Service Office State College, PA 16803 1. INTRODUCTION Hurricane Alex ambled across the Gulf of Mexico
Weather and Climate Summary and Forecast November 2017 Report
 Weather and Climate Summary and Forecast November 2017 Report Gregory V. Jones Linfield College November 7, 2017 Summary: October was relatively cool and wet north, while warm and very dry south. Dry conditions
Presentation Overview. Southwestern Climate: Past, present and future. Global Energy Balance. What is climate?
 Southwestern Climate: Past, present and future Mike Crimmins Climate Science Extension Specialist Dept. of Soil, Water, & Env. Science & Arizona Cooperative Extension The University of Arizona Presentation
Capturing Atmospheric Rivers: Alpha Jet Atmospheric experiment (AJAX) Flights in support of CalWater/El Nino Rapid Response 2016
 Flights in support of CalWater/El Nino Rapid Response 2016") Capturing Atmospheric Rivers: Alpha Jet Atmospheric experiment (AJAX) Flights in support of CalWater/El Nino Rapid Response 2016 Ju-Mee Ryoo 1, Laura Iraci 1, Warren Gore 1, Emma Yates 1, Josette Marrero
Capturing Atmospheric Rivers: Alpha Jet Atmospheric experiment (AJAX) Flights in support of CalWater/El Nino Rapid Response 2016 Ju-Mee Ryoo 1, Laura Iraci 1, Warren Gore 1, Emma Yates 1, Josette Marrero
PRELIMINARY VIABILITY ASSESSMENT OF LAKE MENDOCINO FORECAST INFORMED RESERVOIR OPERATIONS MCRRFC & WCID
 PRELIMINARY VIABILITY ASSESSMENT OF LAKE MENDOCINO FORECAST INFORMED RESERVOIR OPERATIONS 2017 MCRRFC & WCID STEERING COMMITTEE CO-CHAIRS Jay Jasperse, Sonoma County Water Agency F. Martin Ralph, Center
Precipitation Structure and Processes of Typhoon Nari (2001): A Modeling Propsective
: A Modeling Propsective") Precipitation Structure and Processes of Typhoon Nari (2001): A Modeling Propsective Ming-Jen Yang Institute of Hydrological Sciences, National Central University 1. Introduction Typhoon Nari (2001) struck
Precipitation Structure and Processes of Typhoon Nari (2001): A Modeling Propsective Ming-Jen Yang Institute of Hydrological Sciences, National Central University 1. Introduction Typhoon Nari (2001) struck
SENSITIVITY OF SPACE-BASED PRECIPITATION MEASUREMENTS
 SENSITIVITY OF SPACE-BASED PRECIPITATION MEASUREMENTS JP7.2 TO CHANGES IN MESOSCALE FEATURES Joseph Hoch *, Gregory J. Tripoli, Mark Kulie University of Wisconsin, Madison, Wisconsin 1. INTRODUCTION The
IDI/Research IT Showcase: Research Application: Big Data and Earth Sciences
 IDI/Research IT Showcase: Research Application: Big Data and Earth Sciences Scott L. Sellars scottsellars@ucsd.edu May 17, 2017 Team: Phu Nguyen 2, John Graham 3, Joulien Tatar 3, Tom DeFanti 3,Larry Smarr
Multi-scale Predictability Aspects of a Severe European Winter Storm
 1 Multi-scale Predictability Aspects of a Severe European Winter Storm NASA MODIS James D. Doyle, C. Amerault, P. A. Reinecke, C. Reynolds Naval Research Laboratory, Monterey, CA Mesoscale Predictability
H. LIU AND X. ZOU AUGUST 2001 LIU AND ZOU. The Florida State University, Tallahassee, Florida
 AUGUST 2001 LIU AND ZOU 1987 The Impact of NORPEX Targeted Dropsondes on the Analysis and 2 3-Day Forecasts of a Landfalling Pacific Winter Storm Using NCEP 3DVAR and 4DVAR Systems H. LIU AND X. ZOU The
Northwest Outlook October 2016
 Northwest Outlook October 2016 Rainfall Opportunities and Challenges Rainfall over the month of September presented some challenges for the fall harvest while other producers benefitted. Figure 1a shows
Monthly Long Range Weather Commentary Issued: APRIL 18, 2017 Steven A. Root, CCM, Chief Analytics Officer, Sr. VP,
 Monthly Long Range Weather Commentary Issued: APRIL 18, 2017 Steven A. Root, CCM, Chief Analytics Officer, Sr. VP, sroot@weatherbank.com MARCH 2017 Climate Highlights The Month in Review The average contiguous
National Weather Service-Pennsylvania State University Weather Events
 National Weather Service-Pennsylvania State University Weather Events New Zealand heavy rain and flood event-draft by Richard H. Grumm National Weather Service State College PA 16803 Abstract:. A record
Observational analysis of storms and flooding events in the Pacific Northwest. Introduction
 Observational analysis of storms and flooding events in the Pacific Northwest Jake Crouch UNCA ATMS Class of 2007 April 18, 2009 Cloud and Precipitation Processes and Patterns Group Introduction Average