Recent Developments in Atmospheric River Science, Prediction and Applications
|
|
|
- Shanon Morton
- 6 years ago
- Views:
Transcription


 Seminar at the Water Resources Research Center (WRRC)")
1 Recent Developments in Atmospheric River Science, Prediction and Applications F. Martin Ralph Center for Western Weather and Water Extremes UC San Diego/Scripps Institution of Oceanography NOAA G-IV NOAA P-3 DOE G-1 Research Aircraft at McClellan Airfield, Sacramento, CA For the CalWater-2015 Interagency Field Campaign 25 January 2015 Photo by Marty Ralph (UCSD/Scripps/CW3E) Seminar at the Water Resources Research Center (WRRC) Tucson, Arizona, 12 February 2018


2 Atmospheric Rivers are like rivers in the sky Rivers of water vapor These color images represent satellite observations of atmospheric water vapor over the oceans. Warm colors = moist air Cool colors = dry air ARs can be detected with these data due to their distinctive spatial pattern. In the top panel, the AR hit central California and produced 18 inches of rain in 24 hours. From Ralph et al. 2011, Mon. Wea. Rev. In the bottom panel, the AR hit the Pacific Northwest and stalled, creating over 25 inches of rain in 3 days. Dettinger and Ingram Scientific American2013 One AR transports as much water as 25 Mississippi Rivers, but as vapor rather than liquid (from Ralph et al. 2017)

 a) Scientific literature discussing ARs b) Locations of studies and scientists at IARC Number of")
3 Atmospheric Rivers Emerge as a Global Science and Applications Focus A Summary of the 1 st International Atmospheric Rivers Conference F. M. Ralph, M. Dettinger, D. Lavers, I. V. Gorodetskaya, A. Martin, M. Viale, A. B. White, N. Oakley, J. Rutz, J. R. Spackman, H. Wernli and J. Cordeira, Bull. Amer. Meteorol. Soc (in press) a) Scientific literature discussing ARs b) Locations of studies and scientists at IARC Number of Publications (per year) Year

4 Dropsonde Observations of Total Integrated Water Vapor Transport within North Pacific Atmospheric Rivers F.M. Ralph, S. Iacobellus, P.J. Neiman, J. Cordeira J.R. Spackman, D. Waliser, G. Wick, A.B. White, C. Fairall J. Hydrometeor., 2017 July 2017
, 4 from WISPAR (2011), 12 from CalWater (2014, 2015), 4 from AR Recon (2016) NASA GLOBAL")

 applied during the 2003-2012 cool seasons (November-February).")
5 This study uses 21 AR cases observed in with full dropsonde transects 1 from Ghostnets (2005), 4 from WISPAR (2011), 12 from CalWater (2014, 2015), 4 from AR Recon (2016) NASA GLOBAL HAWK Uses a total of 304 dropsondes: Average of 14 per transect, and 80 km dropsonde spacing AIR FORCE C-130 Location of the dropsonde transects listed in Table 1. The background image denotes weekly AR frequency calculated using the AR Detection Tool of Wick et al (2013) applied during the cool seasons (November-February). AR frequency data west of 160 W was not available.
6 (a) Atmospheric River: Plan View higher latitude A Average characteristics 850-km wide 3-km deep kg s 1 flux Cross section 2.0 cm 1000 km IVT (kg m 1 s 1 ) 3.0 A cm IWV From Ralph et al. 2017, J. Hydrometeor.
7 (b) Altitude (km, (MSL) 12 km 10 km 8 km 6 km 4 km Upper-level jet stream Frontal zone Atmospheric River: Vertical Cross-section Very dry Strong horizontal water vapor flux 20 m s 1 Tropopause 2 km 0 km Water vapor mixing ratio LLJ A A 250 km Atmospheric river Averages: 850 km wide, 3-km deep, kg s 1 total water vapor flux (a.k.a. transport) Higher latitude Adapted from Ralph et al and Cordeira et al Cool, Dry Warm, Humid 25 5 g kg 1 9 Lower latitude From Ralph et al. 2017, J. Hydrometeor.


8 Flooding on California s Russian River: Role of atmospheric rivers Ralph, F.M., P. J. Neiman, G. A. Wick, S. I. Gutman, M. D. Dettinger, D. R. Cayan, A. White (Geophys. Res. Lett., 2006) SSM/I satellite data shows atmospheric river Stream gauge data show regional extent of high stream flow covers 500 km of coast ARs can CAUSE FLOODS and PROVIDE WATER SUPPLY Russian River floods are associated with atmospheric rivers - all 7 floods over 8 years. Atmospheric Rivers, Floods and the Water Resources of California Mike Dettinger, M. Ralph,, T. Das, P. Neiman, D. Cayan (Water, 2011) 8
9 Was the Oroville Incident Related to an AR? Yes. An extreme AR hit the area.

10 A few large storms (or their absence) account for a disproportionate amount of California s precipitation variability WHETHER A YEAR WILL BE WET OR DRY IN CALIFORNIA IS MOSTLY DETERMINED BY THE NUMBER AND STRENGTH OF ATMOSPHERIC RIVERS STRIKING THE STATE. Total precipitation All Other Days LARGE STORM CONTRIBUTION 85% of interannual variability results from how wet the 5% wettest days are each year. These days are mostly atmospheric river events. Dettinger and Cayan Drought and the Delta A Matter of Extremes San Francisco Estuary and Watershed Science, April 2014
. Coefficient of variation for annual precipitation 1950-2008 Dettinger, M.D., Ralph, F.M., Das, T., Neiman, P.J.")
11 Variability of Annual Precipitation CA has the largest year to year precipitation variability in the US. CA variability is on the order of half the annual average. The year to year variability in CA is largely caused by the wettest days (ARs). Coefficient of variation for annual precipitation Dettinger, M.D., Ralph, F.M., Das, T., Neiman, P.J., and Cayan, D., 2011: Atmospheric rivers, floods, and the water resources of California. Water, 3,

12 Analysis from COOP daily precipitation observations. -Each site uses at least 30 years of data -The top 10 daily precip dates are found -The season for which most of these top-10 dates occurred at that site is color coded. Ralph et al, 2014, UCOWR -The affect of the southwest Monsoon is seen in yellow dots in AZ, CA, UT, NM, and CO (yellow sites in the Great Plains are not monsoon dominated) -The affect of atmospheric rivers is highlighted by blue and red dots, including almost all of each coastal state, plus inland penetration of AR impacts into AZ, Western CO, SW and Central UT, and ID. -Great Plains convective events focus in spring (light blue dots) and summer (yellow). -Colorado front range is mostly spring. -Nevada is a mixture.

13 Schematic illustration of regional variations in the primary weather phenomena that lead to extreme precipitation, flooding and contribute to water supply in the Western U.S. Atmospheric Rivers (fall and winter)


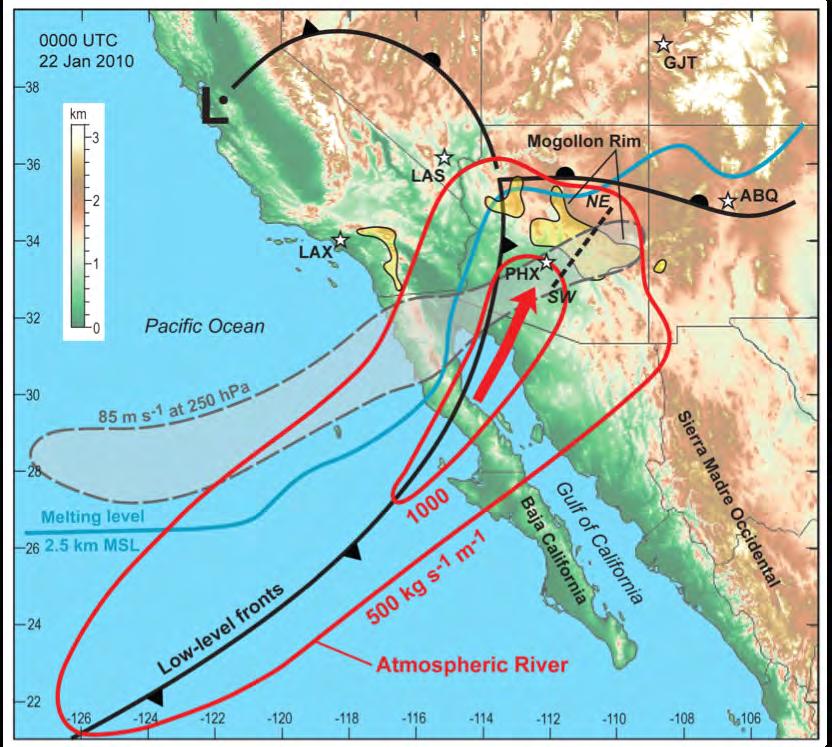
14 SSM/I IWV satellite imagery Jan depicts a strengthening AR making landfall 24-h precip ending 12Z 22 Jan. 2010: Advanced Hydrological Prediction Services atmospheric river atmospheric river 12Z 22-Jan-2010 cm
15 COOP precip on Jan. 2010: Rank relative to all January pairs of days between for gauges with >25 Januarys of data. USGS streamflow on Jan for unregulated channels: Rank relative to all January pairs of days between for gauges with >25 Januarys of data.
16
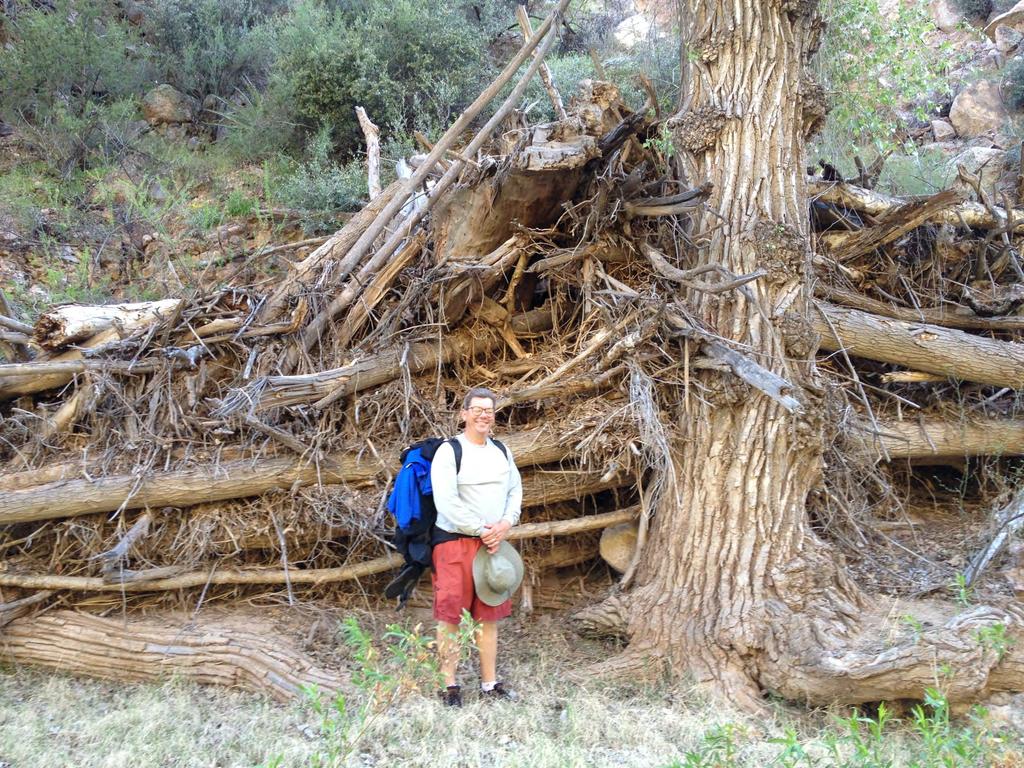
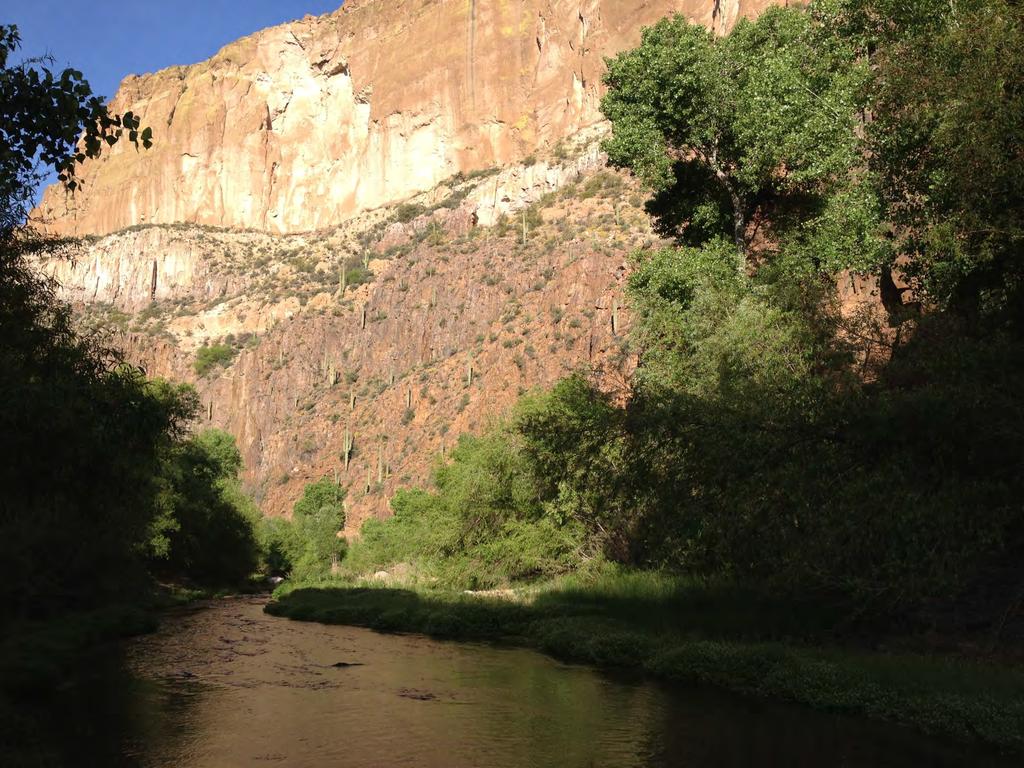
17 Catchment basin characteristics, local meteorology, and implications for flooding The Salt River basin is typical of those draining the south side of the Mogollon Rim
 deep moist neutral layer 75% of water vapor transport in lowest 3.")
18 Ideal conditions for creating heavy orographic rain on the Mogollon Rim and associated mountains 2.5 km (AGL) deep moist neutral layer 75% of water vapor transport in lowest 3.3 km AGL Summary schematic for Jan 2010 case presented by Neiman et al. (in preparation)
19


20 The Inland Penetration of Atmospheric Rivers over Western North America: A Lagrangian Analysis J.J. Rutz, J. W. Steenburgh and F.M. Ralph Mon. Wea. Rev., 2015 Climatological Characteristics of Atmospheric Rivers and Their Inland Penetration over the Western United States J.J. Rutz, J. W. Steenburgh and F.M. Ralph Mon. Wea. Rev.,

 Center for Western Weather and Water")


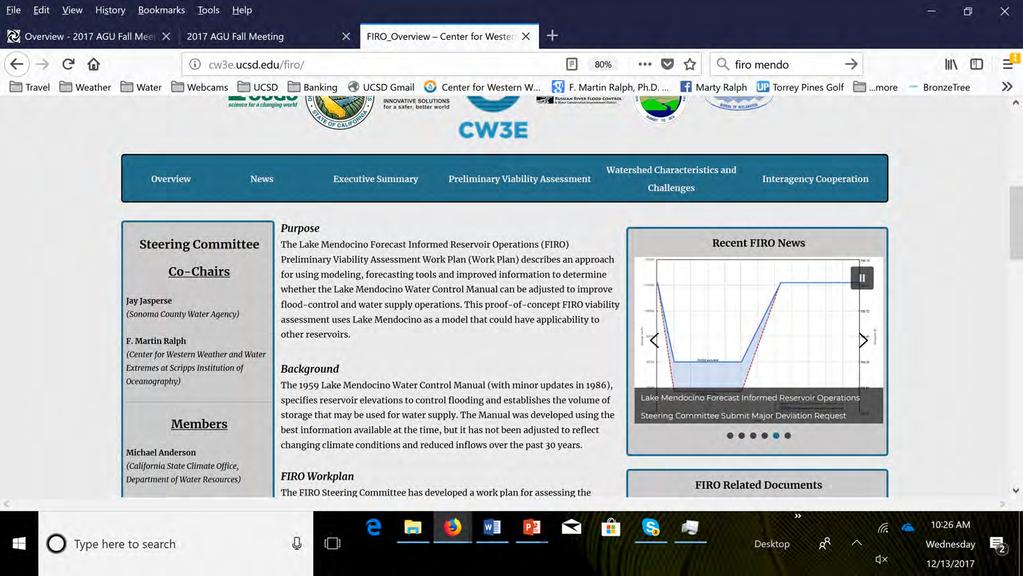
21 Forecast Informed Reservoir Operations: Bringing Science and Decision-Makers Together to Explore Use of Hydrometeorological Forecasts to Support Future Reservoir Operations F. Martin Ralph (Presenter) Center for Western Weather and Water Extremes UC San Diego/Scripps Institution of Oceanography Jay Jasperse Sonoma County Water Agency Acknowledgments to the FIRO Steering Committee US Army Corps of Engineers/ERDC and CA DWR AR Programs Science to Action: Towards More Effective Decision Maker Scientist Partnerships AGU Fall 2017, New Orleans, LA
 Operations Dictated by Storage")
 Flood Control Pool:136,000 AF Water Supply Pool: 245,000 AFF (Nov.")
22 Russian River Reservoirs are Dual Purpose Flood protection in a flood-prone watershed (US Army Corp of Engineers) Lake Mendocino Water supply for 600,000 people and agriculture (Sonoma County Water Agency) Operations Dictated by Storage Levels Relative to Rule Curve Lake Mendocino (Coyote Valley Dam) Flood Control Pool (empty space): 48,100 AF Water Supply Pool: 68,400 A Lake Sonoma Lake Sonoma (Warm Springs Dam) Flood Control Pool:136,000 AF Water Supply Pool: 245,000 AFF (Nov. 1 March 1)


23 The Issue: Lake Mendocino s Water Supply Is Not Reliable Lake Mendocino, July 2014 Drought in 2014 Some Reasons For Low Water Supply Reliability: Relatively small storage capacity Relatively unproductive watershed Reduced inflow from Potter Valley Project (Eel River) Highly variable precipitation patterns - Almost 50% rainfall from atmospheric rivers Future growth & climate change will likely further reduce reliability Russian River near Monte Rio, 9 Feb 2014 (M. Ralph) Flood in 2014
24 Lake Mendocino Vulnerability Need to Update WY 2013 Rainfall


25 Lake Mendocino FIRO Steering Committee Co-Chairs Jay Jasperse Sonoma County Water Agency F. Martin Ralph UCSD / SIO / CW3E Members Michael Anderson California DWR Levi Brekke USBR Mike Dillabough USACE / SPN Michael Dettinger USGS Project Partners Joe Forbis USACE / SPK Alan Haynes NOAA / NWS Patrick Rutten NOAA / NMFS Cary Talbot USACE / ERDC Robert Webb NOAA / OAR A Comprehensive Work Plan to Evaluate FIRO for Lake Mendocino Viability Assessment Process Evaluation Framework Benefits Assessment Implementation Strategies Technical and Scientific Support 25


26 Forecast-Informed Reservoir Operations (FIRO) for Lake Mendocino Feasibility Assessment Planning Workshop August 2014 Scripps Seaside Forum UCSD/Scripps Institution of Oceanography (Sponsored by SCWA and CW3E)
27 Lake Mendocino Forecast-Informed Reservoir Operations Concept Hypothetical estimate of extra water retained unless an atmospheric river storm is predicted to hit the watershed; requires reliable AR prediction at 5-day lead time Lake Mendocino Water Supply Storage (acre-feet) Due to Atmospheric river storms Potential FIRO-Enabled Additional Water Supply Reliability (Enough for 20,000 homes for a year) Max Allowable Storage 10-Year Average Descent into drought Water Year 2013
28 FIRO Viability Assessment Process 28
29 Selected results of FIRO-motivated science Established forecast skill requirements, e.g., 3-5 day lead time on heavy precipitation and runoff forecasts ARs are the main weather phenomenon that causes extremes AR landfall forecasts have useful skill out to a few days Mesoscale frontal waves are key source of forecast busts AR Recon offers potential to improve AR landfall prediction Prediction of no AR landfall has skill beyond 1 week Probabilistic streamflow predictions are key; developing thresholds based on ensemble methods Exploring roles of distributed, physics-based steamflow models
30 Hypothetical Impacts of FIRO on Water Supply and Flood Risk Water Supply Flood Risk 20,000 AF greater water supply reliability in about 50% of the years ü Substantial gains in water storage over existing operations by leveraging information in streamflow forecasts üdownstream flood control benefits are not impacted 30

31 FIRO Viability Assessment Process Preliminary Viability Assessment Concluded that YES! FIRO is viable for Lake Mendo, and that greater AR, precip and streamflow forecast skill could yield greater benefits Steering Committee report finalized July


32 Congressional Staff Briefing on July 13, 2016 A New Frontier in Water Operations: Atmospheric Rivers, Subseasonalto-Seasonal Predictions and Weather Forecasting Technology An interagency, cross-disciplinary team of experts convened in Washington to provide Congressional staff with a briefing on atmospheric rivers, subseasonal-toseasonal precipitation prediction needs, and the benefits of enhanced predictive forecasting technology to the future of water management. Summary available at CW3E.UCSD.EDU


33 Wide range of water levels at Oroville Dam: From drought, to normal, to flood and damage Drought Normal/full Flood Damage

34 Was the Oroville Incident Related to an AR? Yes. An extreme AR hit the area.

![[kg m 1 s 1 ] at 38N, 123W.](/docs-images/77/76640187/images/35-1.jpg "The following is indicated at each forecast time: ensemble member maximum (red),")
, and each individual member (thin")

35 NCEP GEFS dprog/dt Examples from January and February 2017 Init: 12Z/5 Feb Init: 12Z/6 Feb Init: 12Z/7 Feb Image Description: 7-day forecasts of the NCEP GEFS IVT [kg m 1 s 1 ] at 38N, 123W. The following is indicated at each forecast time: ensemble member maximum (red), ensemble member minimum (blue), ensemble mean (green), ensemble control (black), ensemble standard deviation (white shading), and each individual member (thin gray). Time advances from left to right. Key: Variability in north-south shift of ARs result in increases or decreases in IVT magnitude at the coast. In this case the ARs ultimately ended up stronger. J. Cordeira/M. Ralph
.")

36 NCEP GEFS dprog/dt Examples from January and February 2017 Shifts in IVT Envelope over time Image Description: Shading represents the NCEP GEFS probability that IVT will exceed 250 kg m 1 s 1 at 0.5- degree grid locations along the U.S. West Coast (dots). Each panel represents a 24-h forecast that verifies during the 24-h period starting at the time listed above the color bar. The lead time of that forecast period increases from right-to-left. For example, the left-most panel is a 15-to-16-day forecast whereas the right-most panel is the 0-to-1-day forecast. J. Cordeira
 Precipitation over 3 days at 4-day lead time Feather River Drainage Lake Oroville")

 over Feather River: 5.")
37 Observed Vs Predicted Precipitation over Feather River Basin for 6-9 Feb 2017 Predicted (CNS) Precipitation over 3 days at 4-day lead time Feather River Drainage Lake Oroville Max > 8 Observed Precipitation over 3 days ending 1200 UTC 9 Feb Feather River Drainage Max > 12 Lake Oroville Streamflow Flood stage Fcst Obs 72 hr MAP Feather Basin 12z 6-9 Feb CONS GFS NAM12 MOS WPC RFC WestWrf OBS MAP (inches) OBSERVED Mean Area Precip (MAP) over Feather River: 5.5 inches Lead Time (hours)
 00Z 13 February (Final Time 12Z 14")
38 Atmospheric River Reconnaissance FM Ralph (Scripps/CW3E), V Tallapragada (NWS/NCEP), J Doyle (NRL) Water managers, transportation sector, agriculture, etc require improved atmospheric river (AR) predictions AR Forecast skill assessment establishes a performance baseline New Adjoint includes moisture and finds AR is prime target 36-h Sensitivity (Analysis) 00Z 13 February (Final Time 12Z 14 February 2014) J. Doyle, C. Reynolds, C. Amerault, F.M. Ralph (International Atmospheric Rivers Conference 2016) Color contours show the forecast sensitivity to 850 mb water vapor (grey shading) uncertainty at analysis time 00Z 13 Feb 2014 for a 36-h forecast over NorCal valid 12Z 14 Feb observed predicted error 400 km AR Landfall position forecast error at 3-day lead time Forecast improvement area Wick, G.A., P.J. Neiman, F.M. Ralph, and T.M. Hamill, 2013: Evaluation of forecasts of the water vapor signature of atmospheric rivers in operational numerical weather prediction models. Wea. Forecasting, 28, Moisture sensitivity is strongest along AR axis; located > 2000 km upstream Moisture sensitivity substantially larger than temp. or wind sensitivity.
 Verification Time Optimal Water Vapor Perturbation valid at 12 Z 29 Jan. Moist adjoint product from J. Doyle, C.")
39 AR Recon 2016 Using Two Air Force C-130s COAMPS 36-h sensitivity with 36-h lead time Target time 00Z 28 Jan 2016, Verification time 12Z 29 Jan. 72-h precipitation sensitivity to 36-h water vapor 700 hpa (q v shown in gray) Verification Time Optimal Water Vapor Perturbation valid at 12 Z 29 Jan. Moist adjoint product from J. Doyle, C. Reynolds of NRL-Monterey Note large increase in water vapor available for precipitation at final time.
. Black line marks the cross-section baseline.")

40 Cross-section of an AR observed using dropsondes Ralph, F. M., P. J. Neiman, G. N. Kiladis, K. Weickman, and D. W. Reynolds, 2011, Mon. Wea. Rev. The atmospheric river as seen in SSM/I integrated water vapor (IWV). Black line marks the cross-section baseline. Horizontal along-front water vapor flux ( 10 5 kg s -1 ; shading: > kg s -1 ) Dropsonde measurements can improve AR position and characteristics offshore for numerical weather prediction Note sharp horizontal gradient in water vapor mixing ratio over km Grey shaded area is the core area of water vapor transport in the AR 40
 J. Doyle (Navy/NRL) J. Talbot (U.S.")
41 C-130 Atmospheric River Reconnaissance in February 2016 A joint effort of Scripps/CW3E, NOAA/NWS, Air Force FM Ralph (Lead; Scripps Inst. Of Oceanography) M. Silah (NOAA/NWS) V. Tallapragada (NCEP/EMC) J. Doyle (Navy/NRL) J. Talbot (U.S. Air Force) C-130 C-130 Landfall of AR caused heavy rain and high river flows in WA state 1st C-130 AR Recon Mission Feb 2016 Dropsondes released for the 0000 UTC 14 Feb 2016 GFS data assimilation window Observed IWV from SSM/I Satellite passes from 13 Z Z 14 Feb Showing atmospheric river signature Satellite image from NOAA/ESRL/PSD 14 Feb 2016 Locations of C-130 AR Recon dropsondes received and successfully decoded into NCEP's production bufr data tanks for assimilation into NCEP/GFS Air Force C-130 Aircraft Weather Recon Squadron NWRFC flood forecast map as of 1500 UTC 15 Feb showing several rivers predicted to reach flood stage on Feb (red dots)
42 AR Recon Field Campaigns and Modeling Year 1 (2016): 3 storms flown with 2 aircraft over 2 weeks Year 2 (2018): target 6 storms with two aircraft over 6 weeks Year 3 (2019): target 9 storms with three aircraft over 10 weeks Years 1-3: Data denial analyses of 18 storms at NCEP, NRL, CW3E


43 Upper-level trough/pv anomaly 60N 2018 Atmospheric River Reconnaissance Flight Strategies 1h NOAA G-IV 8h 2h 55N 3h 6h 50N Center time: 0000 UTC Dropsonde deployment window: UTC 3.5 h 4h 3h 45N 6 storms in 2018 Air Force C-130 Aircraft Weather Recon 40N AF C N Atmospheric River (color fill: IVT) 30N Each aircraft has a range of about 3500 nm AF C W 150W 140W NOAA G-IV 3 storms in W 120W F.M. Ralph (AR Recon PI) and AR Recon Team

44 C-130 CA Lat Lon Inches Travis over 3 AFB days 1A B C D C-130 HI Lat Lon HI. AFB A >10 inches of rain 2B 41.5 predicted in Pacific NW 2C D G-IV Lat Lon SEA A B C D E C 2D Day-0 Plan for first AR Recon IOP to fly on Jan C 3B 2B 2A 3E Air Force C-130 NOAA G-IV 3A 3D 1C Atmospheric River 1D 1A 1B Air Force C-130 F.M. Ralph (PI) and the AR Recon 2018 team


45 Dropsondes Assimilated AR Recon-2018, IOP- 2 ECMWF Model US Navy Model


46 1 oz Grey Goose Vodka + 1 oz Hpnotiq Liquer + 1 oz Cointreau, top off with Sweet and Sour with 7-Up; blend with ice and serve in sugar-rimmed, chilled martini glass.
 Co-Organizer of Art Show WEATHER ON STEROIDS: THE ART OF CLIMATE CHANGE SCIENCE LA JOLLA HISTORICAL")
47 Photo and slide Courtesy of Dr. Sasha Gershunov (Scripps) Co-Organizer of Art Show WEATHER ON STEROIDS: THE ART OF CLIMATE CHANGE SCIENCE LA JOLLA HISTORICAL SOCIETY FEBRUARY 11 MAY 21 SAN DIEGO PUBLIC LIBRARY JUNE 10 SEPTEMBER 3 Atmospheric Rivers by Oscar Romo

48 2 March 2017
, Douglas Alden (CW3E), Steve Turnbull (ERDC) Maryam Lamjiri (CW3E),")


49 Updates on the 2018 CW3E Field Campaign Supporting FIRO Anna Wilson Marty Ralph, PI Brian Henn (CW3E), Douglas Alden (CW3E), Steve Turnbull (ERDC) Maryam Lamjiri (CW3E), Leah Campbell (CW3E) Primary sponsors: US Army Corps of Engineers, California Dept. of Water Resources, Sonoma County Water Agency Postdoc Leah Campbell at Bodega Bay, 8 Jan 2018 Postdoc Brian Henn at Potter Valley North, 21 Jan 2018 Graduate student Will Chapman and postdoc Brian Henn at Perry Creek, 22 Jan January 2018 FIRO Steering Committee Meeting
 AR Strength AR Count* Weak 15 Moderate 23 Strong 13 Extreme 3 Ralph/CW3E AR Strength Scale Weak: IVT=250 500 kg m 1 s 1 54 Atmospheric Rivers have made")
50 Distribution of Landfalling Atmospheric Rivers on the U.S. West Coast (From 1 Oct 2016 to 1 May 2017) AR Strength AR Count* Weak 15 Moderate 23 Strong 13 Extreme 3 Ralph/CW3E AR Strength Scale Weak: IVT= kg m 1 s 1 54 Atmospheric Rivers have made landfall on the West Coast thus far during the 2017 water year (1 Oct. 12 April 2017) This is much greater than normal 1/3 of the landfalling ARs have been strong or extreme Water year 2017 AR landfall locations through April 2017 Moderate: IVT= kg m 1 s 1 Strong: IVT= kg m 1 s 1 Extreme: IVT>1000 kg m 1 s 1 *Radiosondes at Bodega Bay, CA indicated the Jan AR was strong (noted as moderate based on GFS analysis data) and 7 8 Feb AR was extreme (noted as strong) Location of landfall represents position where AR was strongest at landfall. Many ARs move down the coast over time. This map does not show these areas. By F.M. Ralph, B. Kawzenuk, C. Hecht, J. Kalansky
51 Thank you!
52 For more information cw3e.ucsd.edu/firo/


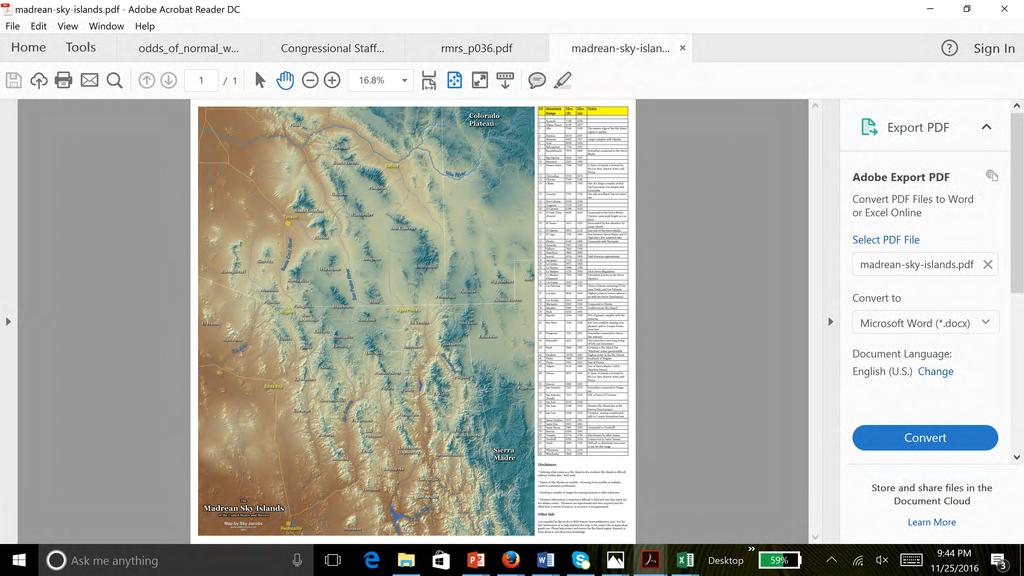
53 A Key Terrain Gap Exists, Apparently Unnamed CA Pacific Ocean AZ Gulf of California NM Mexico TX Gulf of Mexico Chiricahua Mountains Chiricahua Gap m NOAA NCEI ETOPO1 1 Arc-Minute Terrain Height and Bathymetry (m) The name Chiricahua Gap is proposed here, reflecting both the name of a key mountain range near the gap, and the region s Native American history Ralph and Galarneau, JHM,
 of rain events moderate bursts heavy bursts defined as 90th percentile (4.")
54 Climatology of IVT in the Chiricahua Gap and SE Arizona Monsoon Bursts in Distribution of Daily Rainfall (mm) in 2009 and 2010 light burst days defined as upper quartile (2.3 mm) of rain events moderate bursts heavy bursts defined as 90th percentile (4.5 mm) of rain events Day defined here as 24-h period ending at 1200 UTC Define monsoon season as 16 Jun 15 Oct SE AZ rain region Gap region SE Arizona defined as N; W Gap defined as N; W
55 Climatology of IVT in the Chiricahua Gap and SE Arizona Monsoon Bursts in Daily Rainfall (mm) versus IVT (!" $ %& ' %& ) on Day 1 Easterly Westerly Top Decile of all 174 daily rain events heavy burst moderate light 55% (71/130) of light rain events have easterly IVT 65% (17/26) of moderate bursts have easterly IVT 94% (17/18) of heavy bursts have easterly IVT 55
56 56
Atmospheric Rivers: Western U.S. Rainmakers and Key to Forecast-Informed Reservoir Operations
 Atmospheric Rivers: Western U.S. Rainmakers and Key to Forecast-Informed Reservoir Operations F. Martin Ralph UC San Diego/Scripps Institution of Oceanography A New Frontier in Water Operations: Atmospheric
Lake Mendocino Forecast Informed Reservoir Operations
 Lake Mendocino Forecast Informed Reservoir Operations F. Martin Ralph Center for Western Weather and Water Extremes UC San Diego/Scripps Institution of Oceanography California Extreme Precipitation Symposium
Atmospheric Rivers. F. Martin Ralph Center for Western Weather and Water Extremes UC San Diego/Scripps Institution of Oceanography
 Atmospheric Rivers F. Martin Ralph Center for Western Weather and Water Extremes UC San Diego/Scripps Institution of Oceanography WRPI San Jose State University, CA, 6 April 2017 Outline What is an atmospheric
Atmospheric River Reconnaissance
 Air Force C 130 Aircraft Weather Recon Squadron NOAA G IV Atmospheric River Reconnaissance F. Marty Ralph Forest Cannon FMA Annual Conference 6 Sep. 2018 Reno NV Atmospheric River Reconnaissance FM Ralph
Opportunities for Improving S2S Forecasting in the West: Extreme Precipitation and Atmospheric Rivers
 Opportunities for Improving S2S Forecasting in the West: Extreme Precipitation and Atmospheric Rivers F. Martin Ralph UC San Diego/Scripps Institution of Oceanography Sub-Seasonal and Seasonal Precipitation
Anticipating Extreme Precipitation Events: Atmospheric Rivers and Scripps/CW3E Weather Modeling for the Bay Area
 16 inches of rain in 1 day in Central California Anticipating Extreme Precipitation Events: Atmospheric Rivers and Scripps/CW3E Weather Modeling for the Bay Area F. Martin Ralph Center for Western Weather
QPF? So it s a Land-falling Atmospheric River, Can That Help the Forecaster Make a Better. David W. Reynolds
 So it s a Land-falling Atmospheric River, Can That Help the Forecaster Make a Better QPF? David W. Reynolds Cooperative Institute for Research in Environmental Sciences Boulder, CO Brian Kawzenuk Center
CW3E s Atmospheric River Monitoring and Forecast Product Development: Water Year 2018 S2S and AR Recon Highlights
 CW3E s Atmospheric River Monitoring and Forecast Product Development: Water Year 2018 S2S and AR Recon Highlights F. Martin Ralph Director, Center for Western Weather and Water Extremes (CW3E) Scripps
Benjamin J. Moore. Education. Professional experience
 Benjamin J. Moore Department of Atmospheric and Environmental Sciences University at Albany, State University of New York 1400 Washington Avenue Albany, New York, 12222 phone: +1 507 398 7427 email: bjmoore@albany.edu
CW3E Atmospheric River Update and Outlook
 Summary by C. Hecht and F.M. Ralph 3 PM PT Thurs 19 Jan. 2017 CW3E Atmospheric River Update and Outlook Update on 3 ARs Forecast to Impact the West Coast Over Next Several Days - AR 1 made landfall over
PRELIMINARY VIABILITY ASSESSMENT OF LAKE MENDOCINO FORECAST INFORMED RESERVOIR OPERATIONS MCRRFC & WCID
 PRELIMINARY VIABILITY ASSESSMENT OF LAKE MENDOCINO FORECAST INFORMED RESERVOIR OPERATIONS 2017 MCRRFC & WCID STEERING COMMITTEE CO-CHAIRS Jay Jasperse, Sonoma County Water Agency F. Martin Ralph, Center
Mesoscale Frontal Waves Associated with Landfalling Atmospheric Rivers
 Mesoscale Frontal Waves Associated with Landfalling Atmospheric Rivers FIRO Science Task Group Workshop May 30, 2017 Andrew Martin, Brian Kawzenuk, Julie Kalansky, Anna Wilson, F. Martin Ralph Contacts:
Landfalling Impacts of Atmospheric Rivers: From Extreme Events to Long-term Consequences
 Landfalling Impacts of Atmospheric Rivers: From Extreme Events to Long-term Consequences Paul J. Neiman 1, F.M. Ralph 1, G.A. Wick 1, M. Hughes 1, J. D. Lundquist 2, M.D. Dettinger 3, D.R. Cayan 3, L.W.
Talk Overview. Concepts. Climatology. Monitoring. Applications
 Atmospheric Rivers Talk Overview Concepts Climatology Monitoring Applications Satellite View Where is the storm? Where is the impact? Atmospheric Rivers Plume or fire hose of tropical moisture Heavy precipitation
Presentation Overview. Southwestern Climate: Past, present and future. Global Energy Balance. What is climate?
 Southwestern Climate: Past, present and future Mike Crimmins Climate Science Extension Specialist Dept. of Soil, Water, & Env. Science & Arizona Cooperative Extension The University of Arizona Presentation
Experimental Short-term Forecasting of Atmospheric Rivers
 Experimental Short-term Forecasting of Atmospheric Rivers Mike DeFlorio 1, Duane Waliser 2,3, F. Martin Ralph 1, Luca Delle Monache 1, Bin Guan 2,3, Alexander Goodman 2, Aneesh Subramanian 1, Zhenhai Zhang
Assessing the Climate-Scale Variability and Seasonal Predictability of Atmospheric Rivers Affecting the West Coast of North America
 Assessing the Climate-Scale Variability and Seasonal Predictability of Atmospheric Rivers Affecting the West Coast of North America Alexander Gershunov, Tamara Shulgina, Marty Ralph, David Lavers CW3E
Experimental Research in Subseasonal Forecasting of Atmospheric Rivers
 Experimental Research in Subseasonal Forecasting of Atmospheric Rivers Mike DeFlorio 1, Duane Waliser 2,3, F. Martin Ralph 1, Luca Delle Monache 1, Bin Guan 2,3, Alexander Goodman 2, Aneesh Subramanian
Recent Updates to Objective Atmospheric Detection Techniques and Resulting Implications for Atmospheric River Climatologies
 Recent Updates to Objective Atmospheric Detection Techniques and Resulting Implications for Atmospheric River Climatologies Gary Wick NOAA ESRL PSD With help from: P. Neiman, M. Ralph, D. Jackson, D. Reynolds,
DWR Investments in Improving Forecasts at all Time Scales
 DWR Investments in Improving Forecasts at all Time Scales Dr. Michael Anderson, State Climatologist WEF Water Year 2019: Feast or Famine? December 5, 2018 Talk Overview Drought, Flood, and Atmospheric
CW3E Atmospheric River Update Outlook
 CW3E Atmospheric River Update Outlook Two systems expected to produce precipitation over the U.S. West Coast in the next week - AR conditions (IVT >250 kg m -1 s -1 and IWV >20 mm) are expected over most
CW3E Atmospheric River Post Event Summary
 CW3E Atmospheric River Post Event Summary CW3E Atmospheric River Post Event Summary Strong AR recently made landfall over northern California - The AR reached its strongest magnitude of ~ 750 kg m -1 s
Preliminary Viability Assessment (PVA) for Lake Mendocino Forecast Informed Reservoir Operations (FIRO)
 for Lake Mendocino Forecast Informed Reservoir Operations (FIRO)") Preliminary Viability Assessment (PVA) for Lake Mendocino Forecast Informed Reservoir Operations (FIRO) Rob Hartman Consultant to SCWA and CW3E May 30, 2017 Why Conduct a PVA? Key Questions for the PVA
Preliminary Viability Assessment (PVA) for Lake Mendocino Forecast Informed Reservoir Operations (FIRO) Rob Hartman Consultant to SCWA and CW3E May 30, 2017 Why Conduct a PVA? Key Questions for the PVA
Outlook provided by B. Kawzenuk, J. Kalansky, and F.M. Ralph; 11 AM PT Monday 8 January 2018
 Outlook provided by B. Kawzenuk, J. Kalansky, and F.M. Ralph; 11 AM PT Monday 8 January 2018 CW3E Atmospheric River Update Outlook AR conditions currently bringing precipitation to U.S. West Coast - The
National Weather Service-Pennsylvania State University Weather Events
 National Weather Service-Pennsylvania State University Weather Events Abstract: West Coast Heavy Precipitation Event of January 2012 by Richard H. Grumm National Weather Service State College PA 16803
Climate Change and Water Supply Research. Drought Response Workshop October 8, 2013
 Climate Change and Water Supply Research Drought Response Workshop October 8, 2013 DWR Photo Oroville Reservoir, 2009 Talk Overview Expectations History Atmospheric Rivers and Water Supply Current Research
CW3E Atmosphere River Update - Summary
 CW3E Atmosphere River Update - Summary Two Atmospheric Rivers (ARs) made landfall over the Pacific Northwest over the previous four days These events combined to produce >400 mm of precipitation in southern
AMERICAN METEOROLOGICAL SOCIETY
 AMERICAN METEOROLOGICAL SOCIETY Bulletin of the American Meteorological Society EARLY ONLINE RELEASE This is a preliminary PDF of the author-produced manuscript that has been peer-reviewed and accepted
Forecasting Challenges
 Forecasting Challenges 2017-18 Alex Tardy- NWS San Diego Alexander.Tardy@noaa.gov CW3E meetings April 2018 Atmospheric Rivers Climate Forecast System by NOAA 100-h fuel moisture all-time low for South
Cooperative Institute for Research in Environmental Sciences (CIRES) CU-Boulder 2. National Oceanic and Atmospheric Administration
 CU-Boulder 2. National Oceanic and Atmospheric Administration") Moisture transport during the inland penetrating atmospheric river of early November 006 in the Pacific Northwest: A high-resolution model-based study Michael J. Mueller 1 and Kelly Mahoney 1 Cooperative
Moisture transport during the inland penetrating atmospheric river of early November 006 in the Pacific Northwest: A high-resolution model-based study Michael J. Mueller 1 and Kelly Mahoney 1 Cooperative
Climate Variability and Change, and Southern California Water San Gabriel Valley Water Forum, Pomona, CA, October 2, 2014
 Climate Variability and Change, and Southern California Water San Gabriel Valley Water Forum, Pomona, CA, October 2, 2014 Dan Cayan (with Mike Dettinger, David Pierce, Suraj Polade, Mary Tyree, Alexander
CalWater-2015 Update 26 January 2015
 CalWater-2015 Update 26 January 2015 Marty Ralph (UCSD/Scripps), Kim Prather (UCSD/Scripps), Allen White (NOAA/PSD), Ruby Leung (DOE/PNNL), Ryan Spackman (NOAA & STC), Daniel Rosenfeld (Hebrew Univ. of
CW3E Atmospheric River Update
 CW3E Atmospheric River Update Update on Late Season AR Forecast to Impact West Coast Later This Week - Little change from yesterday s forecast - Ensemble GFS members are still in good agreement of the
CW3E Atmospheric River Update Outlook Strong AR forecast to impact California this weekend - A strong AR with IVT as high as 1000 kg m -1 s -1 is
 CW3E Atmospheric River Update Outlook Strong AR forecast to impact California this weekend - A strong AR with IVT as high as 1000 kg m -1 s -1 is forecast make landfall over the West Coast this Weekend
Water Year 2019 Wet or Dry?? Improving Sub-seasonal to Seasonal Precipitation Forecasting Jeanine Jones, Department of Water Resources
 Water Year 2019 Wet or Dry?? Improving Sub-seasonal to Seasonal Precipitation Forecasting Jeanine Jones, Department of Water Resources Sub-Seasonal to Seasonal (S2S) Precipitation Forecasting Operational
SEPTEMBER 2013 REVIEW
 Monthly Long Range Weather Commentary Issued: October 21, 2013 Steven A. Root, CCM, President/CEO sroot@weatherbank.com SEPTEMBER 2013 REVIEW Climate Highlights The Month in Review The average temperature
CW3E Atmospheric River Update Outlook
 Outlook provided by B. Kawzenuk, J. Kalansky, and F.M. Ralph; 12 PM PT Wednesday 7 March 2018 CW3E Atmospheric River Update Outlook Weak Atmospheric River expected to impact the U.S. West Coast this week
CW3E Atmospheric River Outlook
 CW3E Atmospheric River Outlook For California DWR s AR Program Multiple ARs Forecast to impact the USWC in the coming Week - A shift into an active flow pattern may result in the landfall of successive
International Snow Science Workshop
 FLOOD FIGHT: THE PINEAPPLE EXPRESS AND FLOODING IN WESTERN WASHINGTON Larry Schick * U.S. Army Corps of Engineers, Seattle, Washington ABSTRACT: Major flood risk, in Western Washington, typically begins
CW3E Atmospheric River Outlook
 CW3E Atmospheric River Outlook For California DWR s AR Program Update on the ARs Currently Impacting and Forecast to Impact the U.S. West Coast - Precip. has begun in association with AR 1, where as much
Experimental Subseasonal Forecasting Of Atmospheric River Variations For The Western U.S. Winters and
 International Conferences on Subseasonal to Decadal Prediction 17-21 September, 2018 NCAR, Boulder, CO Experimental Subseasonal Forecasting Of Atmospheric River Variations For The Western U.S. Winters
A Synoptic Climatology of Heavy Precipitation Events in California
 A Synoptic Climatology of Heavy Precipitation Events in California Alan Haynes Hydrometeorological Analysis and Support (HAS) Forecaster National Weather Service California-Nevada River Forecast Center
CW3E Atmospheric River Outlook Update on the Multiple ARs forecast to Impact California this Week - Forecast confidence in the onset, duration, and
 CW3E Atmospheric River Outlook Update on the Multiple ARs forecast to Impact California this Week - Forecast confidence in the onset, duration, and magnitude of AR conditions has increased since the last
Outlook provided by B. Kawzenuk, J. Kalansky, and F.M. Ralph; 3 PM PT Wednesday 3 January 2018
 Outlook provided by B. Kawzenuk, J. Kalansky, and F.M. Ralph; 3 PM PT Wednesday 3 January 2018 CW3E Atmospheric River Update Outlook Two systems expected to produce precipitation over the U.S. West Coast
CW3E Atmospheric River Update
 CW3E Atmospheric River Update Update on AR Currently Impacting CA, OR, and WA Precipitation continues to fall over portions of Northern California, Washington, and Oregon 6 10 inches of precipitation has
How do Spectrally Vast AR Thwart Attempts to Skillfully Forecast their Continental Precipitation?
 How do Spectrally Vast AR Thwart Attempts to Skillfully Forecast their Continental Precipitation? International Atmospheric Rivers Conference Modeling and Methods Session 1 August 9, 2016 Andrew Martin
WSWC/NOAA Workshops on S2S Precipitation Forecasting
 WSWC/NOAA Workshops on S2S Precipitation Forecasting San Diego, May 2015 Salt Lake City at NWS Western Region HQ, October 2015 Las Vegas at Colorado River Water Users Association, December 2015 College
Climate Impacts to Southwest Water Sector. Dr. Dave DuBois New Mexico State Climatologist
 Climate Impacts to Southwest Water Sector Dr. Dave DuBois New Mexico State Climatologist Presented at EPA Extreme Events and Climate Adaptation Planning Workshop June 3, 2015 Water Year Precip. % of Average
Impacts of the April 2013 Mean trough over central North America
 Impacts of the April 2013 Mean trough over central North America By Richard H. Grumm National Weather Service State College, PA Abstract: The mean 500 hpa flow over North America featured a trough over
National Weather Service-Pennsylvania State University Weather Events
 National Weather Service-Pennsylvania State University Weather Events Abstract: Tropical Storm Debbie, standardized anomalies and heavy rainfall by Richard H. Grumm National Weather Service State College
New Zealand Heavy Rainfall and Floods
 New Zealand Heavy Rainfall and Floods 1. Introduction Three days of heavy rainfall associated with a deep upper-level low (Fig. 1) brought flooding to portions of New Zealand (Fig. 2). The flooding was
2. Methods and data. 1 NWS Reno, NV report circulated in the LA Times story maximum wind was observed at 0900 AM 8 January 2017.
 The California Extreme Precipitation Event of 8-10 January 2017 By Richard H. Grumm and Charles Ross National Weather Service State College, PA 16803 1. Introduction A strong Pacific jet and a surge of
NIDIS Intermountain West Regional Drought Early Warning System February 7, 2017
 NIDIS Drought and Water Assessment NIDIS Intermountain West Regional Drought Early Warning System February 7, 2017 Precipitation The images above use daily precipitation statistics from NWS COOP, CoCoRaHS,
David W. Reynolds * National Weather Service WFO San Francisco Bay Area Monterey, CA
 3.2 THE MADDEN JULIAN OSCILLATION: ITS POTENTIAL FOR WEEK TWO FLOOD OUTLOOKS AND RESERVOIR MANAGEMENT DECISIONS IN CALIFORNIA David W. Reynolds * National Weather Service WFO San Francisco Bay Area Monterey,
A Survey of Hydrological and Ecological Effects of Landfalling Atmospheric Rivers
 A Survey of Hydrological and Ecological Effects of Landfalling Atmospheric Rivers Mike Dettinger, USGS/CW3E David Lavers, ECMWF Impacts of ARs Atmospheric determinants of the impactfulness of ARs Landscape
FORECAST-BASED OPERATIONS AT FOLSOM DAM AND LAKE
 FORECAST-BASED OPERATIONS AT FOLSOM DAM AND LAKE 255 237 237 237 217 217 217 200 200 200 0 163 131 Bridging the Gap163Conference 255 0 132 255 0 163 122 The Dana on Mission Bay San Diego, CA January 28,
El Niño, Climate Change and Water Supply Variability
 El Niño, Climate Change and Water Supply Variability Talk Overview El Niño and California California Climate Variability and Change Water Management in the Face of Change California s topography affects
CW3E Atmospheric River Outlook
 CW3E Atmospheric River Outlook For California DWR s AR Program Potential for Atmospheric River Activity over California Next Week - Multiple systems are currently forecasted to potentially bring AR conditions
2016 INTERNATIONAL ATMOSPHERIC RIVERS CONFERENCE SAN DIEGO, CA 8-11 August 2016
 ATMOSPHERIC RIVERS AND ENHANCED INTEGRATED VAPOR TRANSPORT EPISODES: THEIR ROLE IN DAMAGING FRONTAL PASSAGES IN SOUTHERN CALIFORNIA WITH AN EMPHASIS ON STRONG WINDS 2016 INTERNATIONAL ATMOSPHERIC RIVERS
CW3E Atmospheric River Outlook
 CW3E Atmospheric River Outlook For California DWR s AR Program Update on the ARs forecast to Impact California this Week - Forecast confidence within the GEFS has continued to increase for the two ARs
NIDIS Intermountain West Drought Early Warning System February 12, 2019
 NIDIS Intermountain West Drought Early Warning System February 12, 2019 Precipitation The images above use daily precipitation statistics from NWS COOP, CoCoRaHS, and CoAgMet stations. From top to bottom,
National Weather Service-Pennsylvania State University Weather Events
 National Weather Service-Pennsylvania State University Weather Events Heavy Rain 7-8 December 2011 by Richard H. Grumm National Weather Service State College PA 16803 Abstract:. A mid-level short-wave
DEVELOPMENT OF A LARGE-SCALE HYDROLOGIC PREDICTION SYSTEM
 JP3.18 DEVELOPMENT OF A LARGE-SCALE HYDROLOGIC PREDICTION SYSTEM Ji Chen and John Roads University of California, San Diego, California ABSTRACT The Scripps ECPC (Experimental Climate Prediction Center)
Verification of the Seasonal Forecast for the 2005/06 Winter
 Verification of the Seasonal Forecast for the 2005/06 Winter Shingo Yamada Tokyo Climate Center Japan Meteorological Agency 2006/11/02 7 th Joint Meeting on EAWM Contents 1. Verification of the Seasonal
CW3E Atmospheric River Update
 CW3E Atmospheric River Update Update on ARs Currently Impacting and Forecast to Impact West Coast As much as 6.5 inches of precipitation has fallen over the high elevations of CA over the previous 48 hours
Atmospheric rivers as triggers for post-fire debris flows in the Transverse Ranges of Southern California
 Atmospheric rivers as triggers for post-fire debris flows in the Transverse Ranges of Southern California International Atmospheric Rivers Conference,10 August 2016 Nina Oakley, Jeremy Lancaster, Mike
The Properties of Convective Clouds Over the Western Pacific and Their Relationship to the Environment of Tropical Cyclones
 The Properties of Convective Clouds Over the Western Pacific and Their Relationship to the Environment of Tropical Cyclones Principal Investigator: Dr. Zhaoxia Pu Department of Meteorology, University
United States Streamflow Probabilities based on Forecasted La Niña, Winter-Spring 2000
 United States Streamflow Probabilities based on Forecasted La Niña, Winter-Spring 2000 contributed by Michael D. Dettinger 1, Daniel R. Cayan 1, and Kelly T. Redmond 2 1 U.S. Geological Survey, Scripps
CW3E Atmospheric River Update
 CW3E Atmospheric River Update Update on ARs Currently Impacting and Forecast to Impact West Coast Precipitation continues to fall over a majority of California The Transverse Mountains (north of Santa
Use of the Combined Pacific Variability Mode for Climate Prediction in North America
 Use of the Combined Pacific Variability Mode for Climate Prediction in North America Christopher L. Castro,, Stephen Bieda III, and Francina Dominguez University of Arizona Regional Climate Forum for Northwest
Missouri River Basin Water Management
 Missouri River Basin Water Management US Army Corps of Engineers Missouri River Navigator s Meeting February 12, 2014 Bill Doan, P.E. Missouri River Basin Water Management US Army Corps of Engineers BUILDING
Oregon Water Conditions Report April 17, 2017
 Oregon Water Conditions Report April 17, 2017 Mountain snowpack continues to maintain significant levels for mid-april. By late March, statewide snowpack had declined to 118 percent of normal after starting
A Review of the 2007 Water Year in Colorado
 A Review of the 2007 Water Year in Colorado Nolan Doesken Colorado Climate Center, CSU Mike Gillespie Snow Survey Division, USDA, NRCS Presented at the 28 th Annual AGU Hydrology Days, March 26, 2008,
Assessment of Ensemble Forecasts
 Assessment of Ensemble Forecasts S. L. Mullen Univ. of Arizona HEPEX Workshop, 7 March 2004 Talk Overview Ensemble Performance for Precipitation Global EPS and Mesoscale 12 km RSM Biases, Event Discrimination
Folsom Dam Water Control Manual Update Joint Federal Project, Folsom Dam
 Folsom Dam Water Control Manual Update Joint Federal Project, Folsom Dam Public Workshop May 28, 2015 Library Galleria 828 I Street, Sacramento, CA US Army Corps of Engineers BUILDING STRONG WELCOME &
NIDIS Intermountain West Drought Early Warning System December 11, 2018
 NIDIS Drought and Water Assessment NIDIS Intermountain West Drought Early Warning System December 11, 2018 Precipitation The images above use daily precipitation statistics from NWS COOP, CoCoRaHS, and
Mesoscale Predictability of Terrain Induced Flows
 Mesoscale Predictability of Terrain Induced Flows Dale R. Durran University of Washington Dept. of Atmospheric Sciences Box 3516 Seattle, WA 98195 phone: (206) 543-74 fax: (206) 543-0308 email: durrand@atmos.washington.edu
The Impact of Horizontal Resolution and Ensemble Size on Probabilistic Forecasts of Precipitation by the ECMWF EPS
 The Impact of Horizontal Resolution and Ensemble Size on Probabilistic Forecasts of Precipitation by the ECMWF EPS S. L. Mullen Univ. of Arizona R. Buizza ECMWF University of Wisconsin Predictability Workshop,
NIDIS Intermountain West Drought Early Warning System May 23, 2017
 NIDIS Drought and Water Assessment NIDIS Intermountain West Drought Early Warning System May 23, 2017 Precipitation The images above use daily precipitation statistics from NWS COOP, CoCoRaHS, and CoAgMet
Investigating Mechanisms of Cool Season Upper Colorado River Basin Precipitation
 Investigating Mechanisms of Cool Season Upper Colorado River Basin Precipitation Benjamin Hatchett 1,2, Nina Oakley 1,2, John Abatzoglou 3, and Jon Rutz 4 1 Division of Atmospheric Sciences, Desert Research
CW3E Atmospheric River Outlook Update on Atmospheric River Forecast to Impact California This Week - Light to moderate precipitation has begun
 CW3E Atmospheric River Outlook Update on Atmospheric River Forecast to Impact California This Week - Light to moderate precipitation has begun falling over portions of California - GFS Ensemble members
Precipitation. Standardized Precipitation Index. NIDIS Intermountain West Drought Early Warning System September 5, 2017
 9/6/2017 NIDIS Drought and Water Assessment NIDIS Intermountain West Drought Early Warning System September 5, 2017 Precipitation The images above use daily precipitation statistics from NWS COOP, CoCoRaHS,
2015 Fall Conditions Report
 2015 Fall Conditions Report Prepared by: Hydrologic Forecast Centre Date: December 21 st, 2015 Table of Contents Table of Figures... ii EXECUTIVE SUMMARY... 1 BACKGROUND... 2 SUMMER AND FALL PRECIPITATION...
NIDIS Intermountain West Drought Early Warning System September 4, 2018
 NIDIS Drought and Water Assessment NIDIS Intermountain West Drought Early Warning System September 4, 2018 Precipitation The images above use daily precipitation statistics from NWS COOP, CoCoRaHS, and
Drought Impacts in the Southern Great Plains. Mark Shafer University of Oklahoma Norman, OK
 Drought Impacts in the Southern Great Plains Mark Shafer University of Oklahoma Norman, OK Causes of Drought: Large-Scale, Stationary High Pressure Air rotates clockwise around high pressure steers storms
Applications/Users for Improved S2S Forecasts
 Applications/Users for Improved S2S Forecasts Nolan Doesken Colorado Climate Center Colorado State University WSWC Precipitation Forecasting Workshop June 7-9, 2016 San Diego, CA First -- A short background
Utilizing Ensemble-based Anomalies to Anticipate Significant Events A New Display Tool
 Utilizing Ensemble-based Anomalies to Anticipate Significant Events A New Display Tool Randy Graham 1, Rich Grumm 2, Nanette Hosenfeld 1, Trevor Alcott 3 1 NOAA/NWS Salt Lake City UT 2 NOAA/NWS State College
Missouri River Basin Water Management Monthly Update
 Missouri River Basin Water Management Monthly Update Participating Agencies 255 255 255 237 237 237 0 0 0 217 217 217 163 163 163 200 200 200 131 132 122 239 65 53 80 119 27 National Oceanic and Atmospheric
Weather and Climate Summary and Forecast Summer 2017
 Weather and Climate Summary and Forecast Summer 2017 Gregory V. Jones Southern Oregon University August 4, 2017 July largely held true to forecast, although it ended with the start of one of the most extreme
Extreme Rainfall in the Southeast U.S.
 Extreme Rainfall in the Southeast U.S. David F. Zierden Florida State Climatologist Center for Ocean Atmospheric Prediction Studies The Florida State University March 7, 2016 Causes of Extreme Rainfall
Weather and Climate of the Rogue Valley By Gregory V. Jones, Ph.D., Southern Oregon University
 Weather and Climate of the Rogue Valley By Gregory V. Jones, Ph.D., Southern Oregon University The Rogue Valley region is one of many intermountain valley areas along the west coast of the United States.
Precipitation. Standardized Precipitation Index. NIDIS Intermountain West Regional Drought Early Warning System January 3, 2017
 1/3/2017 NIDIS Drought and Water Assessment NIDIS Intermountain West Regional Drought Early Warning System January 3, 2017 Precipitation The images above use daily precipitation statistics from NWS COOP,
DEPARTMENT OF GEOSCIENCES SAN FRANCISCO STATE UNIVERSITY. Metr Fall 2012 Test #1 200 pts. Part I. Surface Chart Interpretation.
 DEPARTMENT OF GEOSCIENCES SAN FRANCISCO STATE UNIVERSITY NAME Metr 356.01 Fall 2012 Test #1 200 pts Part I. Surface Chart Interpretation. Figure 1. Surface Chart for 1500Z 7 September 2007 1 1. Pressure
Chiang Rai Province CC Threat overview AAS1109 Mekong ARCC
 Chiang Rai Province CC Threat overview AAS1109 Mekong ARCC This threat overview relies on projections of future climate change in the Mekong Basin for the period 2045-2069 compared to a baseline of 1980-2005.
Forecasting of Optical Turbulence in Support of Realtime Optical Imaging and Communication Systems
 Forecasting of Optical Turbulence in Support of Realtime Optical Imaging and Communication Systems Randall J. Alliss and Billy Felton Northrop Grumman Corporation, 15010 Conference Center Drive, Chantilly,
David R. Vallee Hydrologist-in-Charge NOAA/NWS Northeast River Forecast Center
 David R. Vallee Hydrologist-in-Charge NOAA/NWS Northeast River Forecast Center Record flooding along the Shawsheen River during the 2006 Mother s Day Floods Calibrate and implement a variety of hydrologic
Cold air outbreak over the Kuroshio Extension Region
 Cold air outbreak over the Kuroshio Extension Region Jensen, T. G. 1, T. Campbell 1, T. A. Smith 1, R. J. Small 2 and R. Allard 1 1 Naval Research Laboratory, 2 Jacobs Engineering NRL, Code 7320, Stennis
Southern California Storm of July 2015
 Southern California Storm of 18-20 July 2015 Discussion Former Hurricane Dolores moved north through the northeast Pacific along the Mexican and California coasts The tropical air mass associated with
Doug Kluck NOAA Kansas City, MO National Center for Environmental Information (NCEI) National Integrated Drought Information System (NIDIS)
 National Integrated Drought Information System (NIDIS)") National Integrated Drought Information System (NIDIS) for the Missouri River Basin Drought Early Warning Information System (DEWS) & Runoff Trends in the Missouri Basin & Latest Flood Outlook Doug Kluck
National Integrated Drought Information System (NIDIS) for the Missouri River Basin Drought Early Warning Information System (DEWS) & Runoff Trends in the Missouri Basin & Latest Flood Outlook Doug Kluck
Integrating Weather Forecasts into Folsom Reservoir Operations
 Integrating Weather Forecasts into Folsom Reservoir Operations California Extreme Precipitation Symposium September 6, 2016 Brad Moore, PE US Army Corps of Engineers Biography Brad Moore is a Lead Civil