National Weather Service-Pennsylvania State University Weather Events
|
|
|
- Domenic White
- 5 years ago
- Views:
Transcription
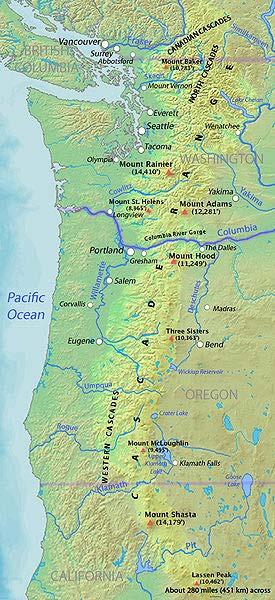
1 National Weather Service-Pennsylvania State University Weather Events Abstract: West Coast Heavy Precipitation Event of January 2012 by Richard H. Grumm National Weather Service State College PA A deep trough over northern western North America and a ridge over the eastern Pacific brought a strong 250 hpa jet and a surge of deep Pacific moisture into the western United States from January Reports of over 16 inches of precipitation were observed in the mountains of southern Oregon. Many areas of California had heavy rain or snowfall. The combination of the cold air over western Canada and Alaska and the surge of moisture produced snow in Washington State. Before the ice storm began, the Seattle area had 10-20cm of snowfall. Heavy snow impacted the higher elevations. Farther south and at lower elevations heavy rain dominated. Strong Pacific jets and moisture surges are often associated with El Niño conditions. However, such events can and clearly do occur during El Niña winters. This event was observed during a La Niña winter. This paper will document the West Coast heavy precipitation event of January The NCEP GEFS precipitation forecasts show that the GEFS did well in predicting the potential for heavy rainfall and the impact of the Pacific moisture plume into the mountains of the western United States.
2 1. INTRODUCTION A strong Pacific jet (Fig. 1) brought several surges of high precipitable water (PW) air into the West Coast of North America from 18 to 22 January 2012 (Fig. 2). Strong Pacific Jets and surges of high PW air are common features associated with many West Coast heavy rainfall events (Junker et al. 2009; Junker et. al 2008). The surges of high PW air, often termed atmospheric rivers (AR: Neiman et al. 2008, Ralph et al 2006, Ralph et al. 2005; Ralph et al. 2004) have been shown to be important in heavy rainfall events in California and along the West Coast in general. Grumm and Hart (2001) and Graham and Grumm (2010) demonstrated how standardized anomalies could be used to identify significant or high impact weather events. Junker et al. (2008) specifically showed the value of standardized anomalies in identifying heavy rainfall patterns in the western United States and the mountains of northern California. They identified the key pattern to include a deep trough off the coast and a strong ridge to the south. The height anomalies in the trough were generally -2 to - 3σ and the anomalies in the ridge were typically on the order of +1σ above normal. The key parameters however were the anomalies in the PW field and the 850 hpa moisture flux anomalies (MFLUX). Junker et al. (2009) showed how forecasts of anomalies provided forecasters additional confidence in predicting heavy rainfall in the western United States. The total liquid equivalent precipitation (QPE) in 48 hour periods from 1200 UTC 16 January through 1200 UTC 24 January (Fig. 3) show the enduring nature of this precipitation event. These data show that the heavy precipitation moved southward in time as the PW plume impinging upon the West Coast moved southward (Fig. 2). Clearly, the heaviest precipitation fell between 1200 UTC January 2012 when in excess of 256 mm (10 inches) fell in southern Oregon. Total QPE in this area during the height of the event exceeded 450 mm (18 inches) during the total time of the event (Fig. 4). A key issue is forecasting heavy precipitation events. Probabilistic forecasts offer the best tools to predict an event like this. Junker et al. (2009) showed the value of forecasts and ensemble forecasts of heavy rainfall events in the western United States. The value of re-analysis climate data (R-Climate) in the forecast process has been demonstrated by Grumm (2011) and Stuart and Grumm (2006). These studies show how forecasts of significant departures of key parameters can aid in predicting high end weather events, such as Russian heat wave of 2010 (Grumm 2011), East Coast Winter Storms (Stewart and Grumm 2006), and record rainfall events (Grumm 2011). This paper will document the pattern and the R-climate anomalies associated with the historic West Coast precipitation event of January The focus is on the R- Climate based standardized anomalies as a tool to both analyze and predicted this and similar events. The forecast section of this paper will show the value of using climate data and internal ensemble prediction system climate data to better anticipate and predict extreme weather events. 2. Methods and Data
3 The NCEP GFS is used to re-produce the conditions associated with the event to include the large scale pattern. The standardized anomalies are displayed in standard deviations from normal as in Hart and Grumm (2001) and are computed using the climatology from the NCEP/NCAR global reanalysis data (Kalnay et al. 1996). The focus is on the pattern and anomalies associated with the storm. The value of EFS and anomalies with EFS data are presented. Ensemble data shown here are from the NCEP Global Ensemble forecast system which is run at 75km in horizontal resolution. A comparison of the NCEP GEFS 55km QPF products will be shown here. These data show the value of higher resolution in the spatial distribution of QPF and the role model resolution plays in the amount of QPF produced by a forecast system. The emphasis here is on products which may aid in predicting heavy rainfall events. The overall pattern is described using the 27.5km NCEP GFS 00-hour forecasts. The pattern and standardized anomalies followed the methods outlined in Hart and Grumm (2001) and the GFS 00-hour forecasts were used to establish the pattern and standardized anomalies. The term R-Climate is used in reference to analysis and forecast which use re-analysis climate data to diagnose or forecast the departures from normal. Rainfall and precipitation estimates were in gridded form using the Stage-IV data (Lin et al. 2005) in 6-hourly increments. This facilitated examining 6, 12, 24, 48 and storm total amounts in any desired time window. Hourly data were available but were not used in this study. For brevity times are presented as day and hour in the format 17/1200 UTC and 18/0000 UTC which would be 1200 UTC 17 January 2012 and 0000 UTC 18 January 2012 respectively. Fully qualified dates are limited to comparative data from times outside of January Large scale pattern i. The large scale pattern The 500 hpa pattern over the western Pacific and western North America (Fig. 5) shows the anomalous trough over southwestern Canada (Fig. 5a) and the strong ridge over southwestern Mexico as the event developed. This pattern is generally similar to the composite 700 hpa pattern for northern California heavy rain events shown by Junker et al. (2008:Fig.4a). During the peak period of heavy rainfall (Fig. 3b&c) a deep trough developed off the West Coast with a ridge to the east (Fig. 5d-f), similar to the 700 hpa composite pattern for heavy rain along the West Coast shown by Junker et al. (2008:Fig. 4d). The 250 hpa jet (Fig. 1) developed in the strong gradient shown between the relatively high heights to the south and lower heights to the north. Unlike the 500 hpa heights (Fig. 5), the 250 hpa heights (not shown) had a ridge over the southwestern Pacific though most of the event with +1σ anomalies over the eastern Pacific and most of the intermountain west, east of the trough axis. The strong Pacific jet (Fig. 2) developed in this strong gradient between the ridge to the south and the trough to the north. Initially, the strong 250 hpa jet (Fig. 1a-b) came ashore in Washington State. The second strong jet came ashore farther south (Fig. 1d-f) mainly in southern Oregon and northern California.
4 The strong flow about the ridge over the eastern Pacific brought a plume of high PW air into western North America. The deep moisture with +2 to +3s PW anomalies was located well west of the Coast at 17/1200 UTC (Fig. 2a) and raced eastward with the strong westerly flow, impacted the coastal zone by 18/1200 UTC (Fig. 2b). Despite PW values in the mm range, the PW anomalies were on the order of +2 to +3σ in Washington and Oregon. The PW surge to south on 20/1200 UTC showed +3 to +4σ anomalies in that region. By 22/1200 UTC relatively dry air was present over most of the western United States. ii. Regional pattern The regional view of the PW and PW anomalies into the West Coast from 18/1200 UTC through 19/1800 UTC (Fig. 6) show the focused plume of high PW air into the region. The 850 hpa winds peaked near 5σ above normal at 18/1200 UTC (not shown) off the Oregon coast. The high winds and high values of moisture produced high values of 850 hpa moisture flux (Fig. 7) and moisture flux anomalies near the higher 850 hpa winds peaked over 6s above normal along the Oregon Coast at 18/1200 UTC (Fig. 7a). Though difficult to view, moisture flux anomalies of 4-5σ were present most of the time and at times 850 hpa moisture flux anomalies peaked over 5σ above normal. The heavy rains in California were also accompanied by a surge of high PW air (Fig. 2) and this resulted in very high values of 850 hpa moisture flux with moisture flux anomalies well over 6s above normal at 21/0600 UTC (Fig. 8f). As the Pacific energy and moisture came ashore, there was an abnormally cold air mass located of western North America. The 850 hpa temperatures (Fig. 9) and 700 hpa temperatures (not shown) indicated a deep cold column of air with below 0C temperatures and -1 to -2σ temperature anomalies. This led to snow early in the event in Washington and Oregon. The Seattle area had cm of snow fall before the event transitioned to a freezing rain event. At lower elevations, snow was observed in Portland Oregon, though temperatures rapidly rose above freezing in northern Oregon between 18/1200 and 19/0000 UTC (Figs. 9b-d). The 6-hourly data (not shown) indicated a rapid rise of temperatures shortly after 18/1800 UTC over much of northern Oregon and southern Washington. The Pacific air overwhelmed the cold air which eventually limited snowfall to the higher elevations of California, Oregon and Washington. iii. Forecasts The QPFs from the 17/0000 and 17/1200 UTC GEFS at 75 km resolution and the forecast from the 55km GEFS-PARA for 75mm and 100mm of QPF in 48 and 72 hours are shown in Figures 10 & 11 respectively. These data show that resolution matters the higher resolution GEFS produces higher probabilities of both 75 and 100 mm of QPF and generally higher QPF. Note the 100mm probability in southern Washington in the 55km GEFS which is smaller in the 75km GEFS. The finer resolution clearly shows the impact of terrain, thus the QPF maximum near terrain features is more focused. Similar forecasts from 18 January 2012 are shown in Figures 12 & 13. These data show higher probabilities in the 75 and 100 mm QPFs from the coarser GEFS, especially for 100mm of QPF. The coarser resolution GEFS produced a large area of higher QPFs. Similar data from January were examined and showed the same basic trend for terrain focused heavy rainfall in all GEFS 75 and 55 km cycles. The 16 January
5 forecasts are shown as a longer range forecast example. These data show the consistent probability of heavy rainfall along the West Coast and the more focused areas of heavy rainfall in the higher resolution GEFS55 initialized at 16/0000 UTC (Fig. 14). iv. Observations The precipitation pattern in 48-hour windows was shown in Figure 3 and an event total estimate was shown in Figure 4. Viewed in 24 hour windows (Fig. 15) the distinct terrain focus and the periods of heavy accumulation are quite evident. Over 256mm of precipitation fell in southwestern Oregon between 28/1200 and 29/1200 UTC (Fig. 15a) with around 128mm in the following 24 hour period (Fig. 15b). The focus of the heavy precipitation moved south and westward for the period ending at 21/1200 UTC (Fig. 15c) and the final period showed a dramatic decrease in the precipitation across the region. These data show the favored locations of the precipitation (Figs. 3, 4&15) with the terrain. As indicated by the GEFS and GEFS55 there was a local maximum in southern Washington near Mount Adams, the second tallest peak in Washington State. The GEFS55 likely resolves this feature better than the GEFS at 75km and thus may explain the more localized maximum in many of its forecasts in southern Washington. In northern California the heavier QPE amounts (Fig. 4) were focused in the Cascades around Mt Shasta and Mt Eddy. Secondary maximum ran down the northern portions of the Coastal Range and into the Sierras. The secondary maximum in the Sierra appeared focused along the Nevada border from near White Mountain to Mt. Whitney (Fig. 15c). Several GEFS55 runs attempted to show secondary maximum inland implying higher resolution terrain impacted the precipitation forecasts (for example Fig. 14c&f). 4. Conclusions A strong Pacific jet (Fig. 1) brought several surges of high precipitable water (PW) air into the West Coast of North America from 18 to 22 January 2012 (Fig. 2). Strong Pacific Jets and surges of high PW air are common features associated with many West Coast heavy rainfall events (Junker et al. 2009; Junker et. al 2008). The surges of high PW air, often termed atmospheric rivers (AR: Neiman et al. 2008, Ralph et al 2006, Ralph et al. 2005; Ralph et al. 2004) have been shown to be important in heavy rainfall events in California and along the West Coast in general. In this case the surge of high PW air brought some extremely heavy rainfall and snowfall to the mountains of the West Coast. The data shown here reinforce the concepts demonstrated by Grumm and Hart (2001) and Graham and Grumm (2010) in identifying potential high impact weather events. The anomalous PW plume with 2 to 3σ above normal PW anomalies moving into the West Coast is often a good signal for heavy rainfall. The large, often 4 to 6σ 850 hpa moisture flux anomalies (Fig. 8) are another strong signal associated with record precipitation events (Bodner et al. 2011; Junker et al. 2008). This event clearly had some very high 850 hpa moisture flux anomalies. These large anomalies combined with the high probability of 75 and 100mm of QPF in the NCEP GEFS are good reinforcing data to aid in predicting high impact precipitation events. Junker et al. (2009) suggested using the QPF along with anomalies to gain confidence in predicting heavy rainfall events and
6 potentially record heavy rainfall events. This case shows the value of using these two methods to confidently predict higher end precipitation events. The NCEP GEFS probability of 75 and 100 mm of QPF were shown from the operational GEFS at 75km and several runs of the GEFS55. The GEFS55, with higher resolution, appeared to produce the heavier QPF values over smaller regions and more focused toward the terrain features. The implications here are that the 20km difference in resolution allows the forecast system to better resolve some of the key terrain features. Thus, in northern California the GEFS55 focused the higher QPF amounts closer to the higher terrain while the GEFS tended to show heavy rainfall focused along most of the length of the Cascades. Near the higher terrain, the GEFS55 produced 175mm of QPF in northern California (Fig. 16) while the coarser GEFS produced about 150 mm (Fig. 17). These data imply the importance of resolution on the impacts of both model resolution and terrain. One could theorize that the operational GEFS if replaced by the GEFS55 would show smaller but more focused regions of heavy rainfall and might produce locally higher QPF amounts. 5. Acknowledgements Albany MAP for discussions on the event in the T+8 to T-2 days time period. 6. References Bodner,M.J., N.W. Junker, R.H. Grumm, and R.S.Schumacher 2011: Comparison of atmospheric circulation patterns during the 2008 and 1993 historic Midwest floods. NWA Digest, accepted for publication Sept Graham, Randall A., and R H. Grumm, 2010: Utilizing Normalized Anomalies to Assess Synoptic-Scale Weather Events in the Western United States. Wea. Forecasting, 25, Grumm, R.H. 2011: New England Record Maker rain event of March NWA, Electronic Journal of Operational Meteorology, EJ4. Grumm, R.H 2011: The Central European and Russian Heat Event of July-August 2010.BAMS, 92, Grumm, R.H. and R. Hart. 2001: Standardized Anomalies Applied to Significant Cold Season Weather Events: Preliminary Findings. Wea. and Fore., 16, Hart, R. E., and R. H. Grumm, 2001: Using normalized climatological anomalies to rank synoptic scale events objectively. Mon. Wea. Rev., 129, Junker, N.W, M.J.Brennan, F. Pereira,M.J.Bodner,and R.H. Grumm, 2009:Assessing the Potential for Rare Precipitation Events with Standardized Anomalies and Ensemble Guidance at the Hydrometeorological Prediction Center. Bulletin of the American Meteorological Society,4 Article: pp Junker, N. W., R. H. Grumm, R. Hart, L. F. Bosart, K. M. Bell, and F. J. Pereira, 2008: Use of standardized anomaly fields to anticipate extreme rainfall in the mountains of northern California. Wea. Forecasting,23, Lin, Y. and K.E. Mitchell, 2005: The NCEP Stage II/IV hourly precipitation analyses: development and applications. Preprints, AMS 19 th Conference on Hydrology, San Diego, CA. Paper 1.2.
7 Neiman, P.J., F.M. Ralph, G.A. Wick, J. D. Lundquist, and M. D. Dettinger, 2008: Meteorological characteristics and overland precipitation impacts of atmospheric rivers affecting the west coast of North America based on eight years of SSMI/satellite observations. J. Hydrometeor., 9, Ralph, F. M., G. A. Wick, S. I. Gutman, M. D. Dettinger, C. R. Cayan, and A. B. White, 2006: Flooding on California s Russian River: The role of atmospheric rivers. Geophys.Res. Lett., 33, L13801, doi: /2006gl Ralph, F. M., P. J. Neiman, and G. A. Wick, 2004: Satellite and CALJET aircraft observations of atmospheric rivers over the eastern North Pacific Ocean during the winter of 1997/98. Mon. Wea. Rev., 132, Ralph, F. M., P. J. Neiman, and R. Rotunno, 2005: Dropsonde observations in low-level jets over the northeastern Pacific Ocean from CALJET-1998 and PACJET-2001: Mean verticalprofile and atmospheric-river characteristics. Mon. Wea. Rev., 133, Stuart N. A., and R. H. Grumm, 2006: Using wind anomalies to forecast east coast winter storms. Wea. and Forecasting, 21,
 and 250 hpa wind anomalies in 24 hour")
8 Figure 1. GFS 00-hour forecasts of 250 hpa winds (kts) and 250 hpa wind anomalies in 24 hour periods from a) 1200 UTC 17 through f) 1200 UTC 22 January Return to text.

9 Figure 2. As in Figure 1 except for GFS 00-hour precipitable water (mm) and precipitable water anomalies. Return to text.
10 Figure 3. Stage-IV rainfall data showing the total liquid equivalent precipitation (mm) in 48 hour periods including the periods ending at 1200 UTC a) 18 January, b) 20 January, c) 22 January, and d) 24 January Contours as per the color bar. Return to text.

11 Figure 4. As in Figure 3 except for total liquid equivalent for the period of 1200 UTC January Return to text.
 and")
12 Figure 5. As in Figure 1 except for 500 hpa heights (m) and height anomalies in 24 hour periods. Return to text.

13 Figure 6. As in Figure 2 except for GFS precipitable water and precipitable water anomalies in 6-hour increments from a) 1200 UTC 12 January through f) 1800 UTC 19 January Return to text.

14 Figure 7. As in Figure 6 except for GFS 850 hpa moisture flux and moisture flux anomalies in 6-hour increments from a) 1200 UTC 18 January through f) 1800 UTC 19 January Return to text.

15 Figure 8. As in Figure 6 except for GFS 850 hpa moisture flux and moisture flux anomalies in 6-hour increments from a) 0000 UTC 20 January through f) 2100 UTC 19 January Return to text.
16

17 Figure 9. As in Figure 8 except for 850 hpa temperatures and temperature anomalies in 12 hour increments from a) 0000 UTC 18 January 2012 through d) 1200 UTC 20 January Return to text.
18 Figure 10. GEFS forecasts of quantitative precipitation (QPF) showing in upper panels, the probability of 75mm or more QPF in 48 hours ending at 1200 UTC 21 January 2012 and the ensemble mean 75mm contour. Lower panels show the ensemble mean QPF and each members 75mm contour. Data from NCEP a & d) NCEP 75km GEFS initialized at 0000 UTC 17 January 2012, b &e) NCEP 75km GEFS initialized at 1200 UTC 17 January 2012, and c &f) NCEP 55km parallel GEFS initialized at 1200 UTC 17 January Percentages as per the color key in the upper panels. Shaded QPF is in the color bar. Return to text.
19 Figure 11. As in Figure 11 except for 100 mm in the 72 hour period ending at 1200 UTC 22 January Return to text.
 NCEP 75km GEFS initialized at 0000 UTC 18 January 2012, b &e) NCEP 75km GEFS initialized at 1200 UTC 18 January 2012, and c &f)")
20 Figure 12. As in Figure 11 except for forecasts from a & d) NCEP 75km GEFS initialized at 0000 UTC 18 January 2012, b &e) NCEP 75km GEFS initialized at 1200 UTC 18 January 2012, and c &f) NCEP 55km parallel GEFS initialized at 1200 UTC 18 January Percentages as per the color key in the upper panels. Shaded QPF is in the color bar. Return to text.
21 Figure 13. As in Figure 12 except for 72 hour accumulations for the period ending at 1200 UTC 22 January Return to text.
22 Figure 14. As in Figure 13 except for forecasts from a & d) NCEP 75km GEFS initialized at 0000 UTC 16 January 2012, b &e) NCEP 75km GEFS initialized at 1200 UTC 16 January 2012, and c &f) NCEP 55km parallel GEFS initialized at 0000 UTC 16 January Percentages as per the color key in the upper panels. Shaded QPF is in the color bar. Return to text.
 1200 UTC 19 January")
23 Figure 15. As in Figure 3 except for Stage-IV 24 hour accumulated precipitation for the 4 periods ending at a) 1200 UTC 19 January 2012, b) 1200 UTC 20 January 2012, c) 1200 UTC 21 January 2012, and d) 1200 UTC 22 January Return to text.
24 Figure 16. NCEP GEFS55 initialized at 1200 UTC 17 January 2012 showing QPF ending at 1200 UTC 20 January 2012 including a) probability of 6mm in 6 hours, b) probability of 12mm in 12 hours, c) probability of 25mm in 24 hours and d) the probability of 50mm ending in 24hours. Probabilities as in the color key, ensemble mean QPF contours every 25mm. Return to text.

25 Figure 17. As in Figure 16 except for operational 75km GEFS. Return to text.
26
27
National Weather Service-Pennsylvania State University Weather Events
 National Weather Service-Pennsylvania State University Weather Events Abstract: Tropical Storm Debbie, standardized anomalies and heavy rainfall by Richard H. Grumm National Weather Service State College
National Weather Service-Pennsylvania State University Weather Events
 National Weather Service-Pennsylvania State University Weather Events New Zealand heavy rain and flood event-draft by Richard H. Grumm National Weather Service State College PA 16803 Abstract:. A record
National Weather Service-Pennsylvania State University Weather Events
 National Weather Service-Pennsylvania State University Weather Events Heavy Rain 7-8 December 2011 by Richard H. Grumm National Weather Service State College PA 16803 Abstract:. A mid-level short-wave
Pre-Christmas Warm-up December 2013-Draft
 Pre-Christmas Warm-up 21-23 December 2013-Draft By Richard H. Grumm National Weather Service State College, PA 1. Overview A large ridge over the west-central Atlantic (Fig.1) and trough moving into eastern
2. Methods and data. 1 NWS Reno, NV report circulated in the LA Times story maximum wind was observed at 0900 AM 8 January 2017.
 The California Extreme Precipitation Event of 8-10 January 2017 By Richard H. Grumm and Charles Ross National Weather Service State College, PA 16803 1. Introduction A strong Pacific jet and a surge of
Tropical Storm Hermine: Heavy rainfall in western Gulf By Richard H. Grumm National Weather Service Office State College, PA 16803
 Tropical Storm Hermine: Heavy rainfall in western Gulf By Richard H. Grumm National Weather Service Office State College, PA 16803 1. INTRODUCTION Tropical storm Hermine, the eighth named tropical system
2 July 2013 Flash Flood Event
 2 July 2013 Flash Flood Event By Richard H. Grumm and Charles Ross National Weather Service State College, PA 1. Overview A retrograding 500 hpa cyclone and anticyclone (Fig. 1) set up deep southerly flow
The Deep South snowfall of February 2010 By Richard H. Grumm National Weather Service Office, State College, PA 16803
 The Deep South snowfall of 11-13 February 2010 By Richard H. Grumm National Weather Service Office, State College, PA 16803 1. INTRODUCTION A surface cyclone tracked across Mexico and the Gulf of Mexico
New Zealand Heavy Rainfall and Floods
 New Zealand Heavy Rainfall and Floods 1. Introduction Three days of heavy rainfall associated with a deep upper-level low (Fig. 1) brought flooding to portions of New Zealand (Fig. 2). The flooding was
Southern Heavy rain and floods of 8-10 March 2016 by Richard H. Grumm National Weather Service State College, PA 16803
 Southern Heavy rain and floods of 8-10 March 2016 by Richard H. Grumm National Weather Service State College, PA 16803 1. Introduction Heavy rains (Fig. 1) produced record flooding in northeastern Texas
Northeastern United States Snowstorm of 9 February 2017
 Northeastern United States Snowstorm of 9 February 2017 By Richard H. Grumm and Charles Ross National Weather Service State College, PA 1. Overview A strong shortwave produced a stripe of precipitation
Alaskan heat episode of June 2013-Draft
 Alaskan heat episode of 16-19 June 2013-Draft Abstract: By Trevor Alcott National Weather Service Western Region, Salt Lake City UT And Richard H. Grumm National Weather Service State College, PA A strong
1995 and 1980 (exact dates would be useful). 1. INTRODUCTION
. 1. INTRODUCTION") Alaskan Autumn Storm of 22-24 November 2010 By Richard Grumm National Weather Service State College, PA 16803 and Rick Thoman and James A. Nelson National Weather Service Alaska Region 1. INTRODUCTION
Alaskan Autumn Storm of 22-24 November 2010 By Richard Grumm National Weather Service State College, PA 16803 and Rick Thoman and James A. Nelson National Weather Service Alaska Region 1. INTRODUCTION
New England Record Maker Rain Event of March 2010
 National Weather Association, Electronic Journal of Operational Meteorology, 2011-EJ4 New England Record Maker Rain Event of 29-30 March 2010 RICHARD H. GRUMM National Weather Service, State College, PA
The southern express: Winter storm of January 2010 By Richard H. Grumm National Weather Service
 The southern express: Winter storm of 28-30 January 2010 By Richard H. Grumm National Weather Service 1. INTRODUCTION A storm system of Pacific origin tracked across the southern United States from 27-31
1. INTRODUCTION. March. Local time used in text to define dates. 1 Due to UTC time the went passed 0000 UTC 31
 New England Record Maker Rain Event of 29-30 March 2010 By Richard H. Grumm National Weather Service Contributions by Frank Nocera National Weather Service Office Taunton, MA 1. INTRODUCTION The second
National Weather Service-Pennsylvania State University Weather Events
 National Weather Service-Pennsylvania State University Weather Events Heavy rainfall of 23 November 2011 by Richard H. Grumm National Weather Service State College PA 16803 Abstract:. A fast moving mid-tropospheric
Impacts of the April 2013 Mean trough over central North America
 Impacts of the April 2013 Mean trough over central North America By Richard H. Grumm National Weather Service State College, PA Abstract: The mean 500 hpa flow over North America featured a trough over
Memorial Day Weekend 2013: Snow and Cold
 Abstract: Memorial Day Weekend 2013: Snow and Cold By Richard H. Grumm National Weather Service State College, PA A slow moving 500 hpa low and associated unseasonably cold air in the lower troposphere
This paper will document the pattern which produced the record rainfall of 30 September The goal is to show the pattern the
 The Historic Synoptic-Hybrid rainfall event 30 September 2010 By Richard Grumm And Michael Kozar National Weather Service State College, PA 16803 1. INTRODUCTION A slow moving north-south oriented frontal
National Weather Service-Pennsylvania State University Weather Events
 National Weather Service-Pennsylvania State University Weather Events Eastern United States Winter Storm and Severe Event of 28-29 February 2012 by Richard H. Grumm National Weather Service State College
Early May Cut-off low and Mid-Atlantic rains
 Abstract: Early May Cut-off low and Mid-Atlantic rains By Richard H. Grumm National Weather Service State College, PA A deep 500 hpa cutoff developed in the southern Plains on 3 May 2013. It produced a
Eastern United States Wild Weather April 2014-Draft
 1. Overview Eastern United States Wild Weather 27-30 April 2014-Draft Significant quantitative precipitation bust By Richard H. Grumm National Weather Service State College, PA and Joel Maruschak Over
Winter Storm of 15 December 2005 By Richard H. Grumm National Weather Service Office State College, PA 16803
 Winter Storm of 15 December 2005 By Richard H. Grumm National Weather Service Office State College, PA 16803 1. INTRODUCTION A complex winter storm brought snow, sleet, and freezing rain to central Pennsylvania.
Southern United States Heavy rain and flood event 6-8 April 2014
 Southern United States Heavy rain and flood event 6-8 April 2014 By Richard H. Grumm National Weather Service State College, PA 1. Overview Heavy rainfall (Fig. 1) affected the southern United States from
Southern Plains Heavy rain and Flooding
 Abstract: Southern Plains Heavy rain and Flooding By Richard H. Grumm National Weather Service State College, PA A severe weather event affected the southern Plains on 31 May 2013. The severe weather event
The Devastating Western European Winter Storm February 2010 By Richard H. Grumm National Weather Service
 The Devastating Western European Winter Storm 27-28 February 2010 By Richard H. Grumm National Weather Service 1. INTRODUCTION A strong late winter storm, called Xynthia 1, raced across Western Europe
Snow, freezing rain, and shallow arctic Air 8-10 February 2015: NCEP HRRR success story
 Snow, freezing rain, and shallow arctic Air 8-10 February 2015: NCEP HRRR success story By Richard H. Grumm National Weather Service State College, PA 1. Overview A short-wave (Fig. 1) moved over the strong
Heavy rains and precipitable water anomalies August 2010 By Richard H. Grumm And Jason Krekeler National Weather Service State College, PA 16803
 Heavy rains and precipitable water anomalies 17-19 August 2010 By Richard H. Grumm And Jason Krekeler National Weather Service State College, PA 16803 1. INTRODUCTION Heavy rain fell over the Gulf States,
Heavy Rainfall Event of June 2013
 Heavy Rainfall Event of 10-11 June 2013 By Richard H. Grumm National Weather Service State College, PA 1. Overview A 500 hpa short-wave moved over the eastern United States (Fig. 1) brought a surge of
Minor Winter Flooding Event in northwestern Pennsylvania January 2017
 1. Overview Minor Winter Flooding Event in northwestern Pennsylvania 12-13 January 2017 By Richard H. Grumm National Weather Service State College, PA A combination of snow melt, frozen ground, and areas
West Coast Multi-Day heavy Precipitation Event 28 November-2 December 2012-Draft
 West Coast Multi-Day heavy Precipitation Event 28 November-2 December 2012-Draft By Richard H. Grumm and Charles Ross National Weather Service State College, PA 16803 Contributions by the Albany MAP and
National Weather Service-Pennsylvania State University Weather Events
 National Weather Service-Pennsylvania State University Weather Events Historic Ohio Valley January Severe weather and Tornado Event by Richard H. Grumm National Weather Service State College PA 16803 and
NWS-PSU Case Study Site 2010 Severe Weather Case
 NWS-PSU Case Study Site 2010 Severe Weather Case New Years Eve Severe Weather Event of 31 December 2010 by Richard H. Grumm National Weather Service State College PA 16083 Abstract: A surge of warm humid
Hurricane Alex: Heavy rainfall and anomalous precipitable water By Richard H. Grumm National Weather Service Office State College, PA 16803
 Hurricane Alex: Heavy rainfall and anomalous precipitable water By Richard H. Grumm National Weather Service Office State College, PA 16803 1. INTRODUCTION Hurricane Alex ambled across the Gulf of Mexico
The Big Chill of November 2013
 The Big Chill of November 2013 Value of anomalies for situational awareness By Richard H. Grumm National Weather Service State College, PA Trevor Alcott National Weather Service, Salt Lake City UT 1. Overview
East Coast Heavy Rainfall of January 2010 By Richard H. Grumm National Weather Service
 1. INTRODUCTION A strong storm moved across the United States from 21 January through 25 January 2010 (Fig. 1). This storm produced record rainfall and snowfall in the western United States from 20-22
Convective Heavy rainfall event of 23 July 2013
 Convective Heavy rainfall event of 23 July 2013 By Richard H. Grumm and Charles Ross National Weather Service State College, PA Abstract: A record rain event affected southern Lebanon County on 23 July
Southern United States Winter Storm of 28 January 2014-v1. High Impact Snow on Edge of Forecast Precipitation Shield
 Southern United States Winter Storm of 28 January 2014-v1 High Impact Snow on Edge of Forecast Precipitation Shield by Richard H. Grumm National Weather Service State College, PA 16803 and 1. Introduction
Heat wave ending severe events of July 2010 By Richard H. Grumm National Weather Service Office State College, PA 16803
 Heat wave ending severe events of 23-25 July 2010 By Richard H. Grumm National Weather Service Office State College, PA 16803 1. INTRODUCTION A strong subtropical ridge (Fig. 1a) dominated the eastern
The high latitude blocking and impacts on Asia
 The high latitude blocking and impacts on Asia By Richard H. Grumm National Weather Service Office State College, PA 16803 1. INTRODUCTION An episode of high latitude blocking during the month of December
Eastern United States Ice Storm of December 2008 By Richard H. Grumm National Weather Service State College, PA 16803
 Eastern United States Ice Storm of 11-12 December 2008 By Richard H. Grumm National Weather Service State College, PA 16803 1. INTRODUCTION A significant ice storm affected the eastern United States on
Mid-West Heavy rains 18 April 2013
 Abstract: Mid-West Heavy rains 18 April 2013 By Richard H. Grumm and Charles Ross National Weather Service State College, PA The relatively wet conditions during the first 16 days of April 2013 set the
The Devastating Mid-Mississippi Valley Floods of 1-2 May 2010 By Richard H. Grumm National Weather Service
 The Devastating Mid-Mississippi Valley Floods of 1-2 May 2010 By Richard H. Grumm National Weather Service 1. INTRODUCTION A devastating heavy rainfall event affected the Mid-Mississippi Valley (MMV) from
Anticipating record events using patterns and pattern forecast: Mid-Mississippi Valley floods of April 2011
 Anticipating record events using patterns and pattern forecast: Mid-Mississippi Valley floods of April 2011 Richard H. Grumm National Weather Service State College, PA Abstract: A persistent pattern produced
Deep Cyclone and rapid moving severe weather event of 5-6 June 2010 By Richard H. Grumm National Weather Service Office State College, PA 16803
 Deep Cyclone and rapid moving severe weather event of 5-6 June 2010 By Richard H. Grumm National Weather Service Office State College, PA 16803 1. INTRODUCTION A rapidly deepening surface cyclone raced
National Weather Service-Pennsylvania State University Weather Events
 National Weather Service-Pennsylvania State University Weather Events The February Thaw 17-19 February 2011 by Richard H. Grumm National Weather Service State College PA 16803 Abstract: After a cold January
Early Summer Heat Waves of 2013
 Early Summer Heat Waves of 2013 Abstract: By Richard H. Grumm National Weather Service State College, PA And Trevor Alcott National Weather Service, Salt Lake City Utah From late June into mid-july large
Mid-Atlantic Ice Storm 4 March 2015
 1. Overview Mid-Atlantic Ice Storm 4 March 2015 By Richard H. Grumm National Weather Service State College, PA A large 500 hpa ridge over the southern United States (Fig. 1a-e)) built into the Mid-Atlantic
Orographically enhanced heavy rainfall of 23 May 2010 By Richard H. Grumm National Weather Service Office State College, PA 16803
 Orographically enhanced heavy rainfall of 23 May 2010 By Richard H. Grumm National Weather Service Office State College, PA 16803 1. INTRODUCTION During the overnight hours and into the early morning of
Record snow blankets the United Kingdom 5-6 January 2010
 1. INTRODUCTION Record snow blankets the United Kingdom 5-6 January 2010 By Richard H. Grumm National Weather Service Office State College, PA 16803 A rare winter storm brought heavy snow the United Kingdom
National Weather Service-Pennsylvania State University Weather Events
 National Weather Service-Pennsylvania State University Weather Events The southern Express: High Impact Spring Storm of 14-17 April 2011 by Richard H. Grumm National Weather Service State College PA 16803
Multi-day severe event of May 2013
 Abstract: Multi-day severe event of 18-22 May 2013 By Richard H. Grumm and Charles Ross National Weather Service State College, PA A relatively slow moving Trough over the western United States and a ridge
Hurricane Harvey the Name says it all. by Richard H. Grumm and Charles Ross National Weather Service office State College, PA
 Hurricane Harvey the Name says it all by Richard H. Grumm and Charles Ross National Weather Service office State College, PA 16803. 1. Overview Hurricane Harvey crossed the Texas coast (Fig. 1) as a category
A summary of the heat episodes of June 2017
 A summary of the heat episodes of June 2017 By Richard H. Grumm and Elissa A. Smith National Weather Service State College, PA 1. Overview Over 1800 record high temperatures were set or tied during the
National Weather Service-Pennsylvania State University Weather Events
 National Weather Service-Pennsylvania State University Weather Events The high latitude Eurasian Anticyclone of January-February 2012 by Richard H. Grumm National Weather Service State College PA 16803
1. INTRODUCTION. For brevity times are referred to in the format of 20/1800 for 20 August UTC. 3. RESULTS
 Heavy rains and precipitable water anomalies 20-23 August 2010-Draft By Jason Krekeler And Richard Grumm National Weather Service State College, PA 16803 1. INTRODUCTION Heavy rain fell across the central
National Weather Service-Pennsylvania State University Weather Events
 National Weather Service-Pennsylvania State University Weather Events Southern Express 18-19 February 2012: Probabilities, Potentials and uncertainty by Richard H. Grumm National Weather Service State
09 December 2005 snow event by Richard H. Grumm National Weather Service Office State College, PA 16803
 09 December 2005 snow event by Richard H. Grumm National Weather Service Office State College, PA 16803 1. INTRODUCTION A winter storm produced heavy snow over a large portion of Pennsylvania on 8-9 December
The Historic Storm of October 2010 By Richard H. Grumm National Weather Service
 The Historic Storm of 24-26 October 2010 By Richard H. Grumm National Weather Service 1. INTRODUCTION An historic storm impacted much of the United States from 24-26 October 2010. Though the cyclone was
Eastern United States Winter Storm of 1-2 February 2015-DRAFT Northeast Ground Hog Storm
 Eastern United States Winter Storm of 1-2 February 2015-DRAFT Northeast Ground Hog Storm By Richard H. Grumm National Weather Service State College, PA 1. Overview A major Winter Storm brought precipitation
1. INTRODUCTION. The super storm of March 1993 produced severe weather and tornadoes as it s trailing cold front pushed through Florida (Kocin eta 1l
 1. INTRODUCTION Super Tuesday and awful Wednesday: the 5-6 February 2008 Severe Weather Outbreak By Richard H. Grumm National Weather Service State College, PA And Seth Binau National Weather Service,
Winter Storm of February 2008 By Richard H. Grumm National Weather Service Office State College PA 16803
 1. INTRODUCTION Winter Storm of 11-13 February 2008 By Richard H. Grumm National Weather Service Office State College PA 16803 A potent winter storm brought snow, sleet, freezing rain, and rain to the
Mid Atlantic Severe Event of 1 May 2017 Central Pennsylvania QLCS event By Richard H. Grumm National Weather Service, State College, PA 16803
 1. Overview Mid Atlantic Severe Event of 1 May 2017 Central Pennsylvania QLCS event By Richard H. Grumm National Weather Service, State College, PA 16803 A strong upper-level wave (Fig.1) moving into a
National Weather Service-Pennsylvania State University Weather Events
 National Weather Service-Pennsylvania State University Weather Events Western Windstorm of 1-2 December 2011-Draft by Richard H. Grumm National Weather Service State College PA 16803 Abstract:. A strong
This storm was associated with strong low-level easterly winds at 850 and 925 hpa. Stuart and Grumm (2006) document the value of using u-wind
 document the value of using u-wind") The Historic Mid-Atlantic Snow storm of 5-6 February 2010-Draft By Richard H. Grumm and John LaCorte National Weather Service Office, State College, PA 16803 1. INTRODUCTION A strong storm moved across
The Historic Mid-Atlantic Snow storm of 5-6 February 2010-Draft By Richard H. Grumm and John LaCorte National Weather Service Office, State College, PA 16803 1. INTRODUCTION A strong storm moved across
Historic Eastern United States Winter Storm of January 2016: Record snow along the megalopolitan corridor 1. Introduction
 Historic Eastern United States Winter Storm of 22-24 January 2016: Record snow along the megalopolitan corridor by Richard H. Grumm National Weather Service State College, PA 16803 1. Introduction An historic
Thanksgiving Eve snow of November 2014
 1. Overview Thanksgiving Eve snow of 26-27 November 2014 By Richard H. Grumm National Weather Service State College, PA An early season east coast winter storm (ECWS: DeGaetano et al. 2002) brought snow
Heavy Rainfall and Flooding of 23 July 2009 By Richard H. Grumm And Ron Holmes National Weather Service Office State College, PA 16803
 Heavy Rainfall and Flooding of 23 July 2009 By Richard H. Grumm And Ron Holmes National Weather Service Office State College, PA 16803 1. INTRODUCTION Heavy rains fall over Pennsylvania and eastern New
The high latitude blocking and low arctic oscillation values of December 2009
 The high latitude blocking and low arctic oscillation values of December 2009 By Richard H. Grumm National Weather Service Office State College, PA 16803 1. INTRODUCTION An episode of high latitude blocking
The enduring Louisiana rain and flooding of August 2016 by Richard H. Grumm National Weather Service State College, PA 16803
 1. Introduction The enduring Louisiana rain and flooding of August 2016 by Richard H. Grumm National Weather Service State College, PA 16803 Historic flooding impacted Louisiana on 12-15 August 2016 (TWC
Mid Atlantic Heavy rainfall event 1. Overview 2. Methods and Data 3. Pattern
 1. Overview Mid Atlantic Heavy rainfall event With an inertial gravity wave? By Richard H. Grumm National Weather Service, State College, PA 16803 Contributions from the Albany MAP An unseasonably strong
Arkansas Flash Floods and heavy rainfall-draft By Richard H. Grumm National Weather Service State College PA 16803
 Arkansas Flash Floods and heavy rainfall-draft By Richard H. Grumm National Weather Service State College PA 16803 1. INTRODUCTION Training convection associated with deep moisture and a strongly southerly
The Spring Storm of April 2007 By Richard H. Grumm National Weather Service Office State College PA 16803
 The Spring Storm of 13-16 April 2007 By Richard H. Grumm National Weather Service Office State College PA 16803 1. INTRODUCTION A major spring storm struck the eastern United States from 13 through 16
Low-end derecho of 19 August 2017
 Low-end derecho of 19 August 2017 By Richard H. Grumm and Charles Ross National Weather Service State College, PA 1. Overview A cluster of thunderstorms developed in eastern Ohio around 1800 UTC on 19
Patterns of Heavy rainfall in the Mid-Atlantic Region 1. INTRODUCTION
 5A.2 Patterns of Heavy rainfall in the Mid-Atlantic Region by Richard H. Grumm * And Ron Holmes National Weather Service Office State College, PA 16802 1. INTRODUCTION The patterns associated with heavy
5A.3 THE USE OF ENSEMBLE AND ANOMALY DATA TO ANTICIPATE EXTREME FLOOD EVENTS IN THE NORTHEASTERN U.S.
 5A.3 THE USE OF ENSEMBLE AND ANOMALY DATA TO ANTICIPATE EXTREME FLOOD EVENTS IN THE NORTHEASTERN U.S. Neil A. Stuart(1), Richard H. Grumm(2), John Cannon(3), and Walt Drag(4) (1)NOAA/National Weather Service,
NCEP Short-Range Ensemble forecasts of an historic rainfall event: The June 2006 East Coast Floods 1. INTRODUCTION
 NCEP Short-Range Ensemble forecasts of an historic rainfall event: The 23-27 June 2006 East Coast Floods By Richard H. Grumm National Weather Service Office, State College PA 16803 And Norman W. Junker
Indiana County Flash Flood of 22 June 2017
 Indiana County Flash Flood of 22 June 2017 By Richard H. Grumm National Weather Service State College, PA 1. Overview Slow moving thunderstorms brought 3 to 4 inches of rainfall to Indiana County, PA during
Talk Overview. Concepts. Climatology. Monitoring. Applications
 Atmospheric Rivers Talk Overview Concepts Climatology Monitoring Applications Satellite View Where is the storm? Where is the impact? Atmospheric Rivers Plume or fire hose of tropical moisture Heavy precipitation
The North American Heat Wave of July 2011-Draft
 The North American Heat Wave of July 2011-Draft By Richard H. Grumm And Jason Krekeler 328 Innovation Blvd Suite 330 National Weather Service Office State College, PA 16803 The meteorological conditions
Flooding and Severe weather of 27 June 2013
 Flooding and Severe weather of 27 June 2013 By Richard H. Grumm National Weather Service State College, PA 1. Overview Flooding and severe weather affected Pennsylvania on 27 June 2013 (Fig 1). The severe
National Weather Service-Pennsylvania State University Weather Events
 National Weather Service-Pennsylvania State University Weather Events March Madness: The 2 March 2012 super outbreak-draft by Richard H. Grumm National Weather Service State College PA 16803 and Kyle Imhoff
Warm Episode over Indian Sub-continent March 2010 By Richard Grumm National Weather Service State College Contributions by Lance Bosart SUNY Albany
 Warm Episode over Indian Sub-continent March 2010 By Richard Grumm National Weather Service State College Contributions by Lance Bosart SUNY Albany 1. INTRODUCTION A massive subtropical ridge formed over
Utilizing Ensemble-based Anomalies to Anticipate Significant Events A New Display Tool
 Utilizing Ensemble-based Anomalies to Anticipate Significant Events A New Display Tool Randy Graham 1, Rich Grumm 2, Nanette Hosenfeld 1, Trevor Alcott 3 1 NOAA/NWS Salt Lake City UT 2 NOAA/NWS State College
Forecasting Challenges
 Forecasting Challenges 2017-18 Alex Tardy- NWS San Diego Alexander.Tardy@noaa.gov CW3E meetings April 2018 Atmospheric Rivers Climate Forecast System by NOAA 100-h fuel moisture all-time low for South
1. INTRODUCTION. In addition to the severe weather, the
 Anomalous Low and its weather impacts 10-12 May 2008 By Richard Grumm National Weather Service Office State College, PA And Al Cope National Weather Service Office Mount Holly, NJ 1. INTRODUCTION An unusually
Southeastern Texas historic rain of 18 April 2016 by Richard H. Grumm and Charles Ross National Weather Service State College, PA 16803
 Southeastern Texas historic rain of 18 April 2016 by Richard H. Grumm and Charles Ross National Weather Service State College, PA 16803 1. Introduction Extremely heavy rainfall across southeastern Texas
Eastern United States Anafrontal Snow 4-5 March 2015-Draft
 Eastern United States Anafrontal Snow 4-5 March 2015-Draft By Richard H. Grumm National Weather Service State College, PA 1. Overview A 500 hpa ridge over the western Atlantic (Fig. 1) and an approaching
Ensemble Forecasts of the Blizzard of January 2005 By Richard H. Grumm National Weather Service State College Pennsylvania
 Ensemble Forecasts of the Blizzard of 22-23 January 2005 By Richard H. Grumm National Weather Service State College Pennsylvania 1. Introduction A fast moving upper-level disturbance produced a wide area
In recent years, the use of tropospheric anomalies to
 Anticipating a Rare Event Utilizing Forecast Anomalies and a Situational Awareness Display The Western U.S. Storms of 18 23 January 2010 by Randy Graham, Trevor Alcott, Nanette Hosenfeld, and Richard Grumm
Landfalling Impacts of Atmospheric Rivers: From Extreme Events to Long-term Consequences
 Landfalling Impacts of Atmospheric Rivers: From Extreme Events to Long-term Consequences Paul J. Neiman 1, F.M. Ralph 1, G.A. Wick 1, M. Hughes 1, J. D. Lundquist 2, M.D. Dettinger 3, D.R. Cayan 3, L.W.
A Synoptic Climatology of Heavy Precipitation Events in California
 A Synoptic Climatology of Heavy Precipitation Events in California Alan Haynes Hydrometeorological Analysis and Support (HAS) Forecaster National Weather Service California-Nevada River Forecast Center
Cooperative Institute for Research in Environmental Sciences (CIRES) CU-Boulder 2. National Oceanic and Atmospheric Administration
 CU-Boulder 2. National Oceanic and Atmospheric Administration") Moisture transport during the inland penetrating atmospheric river of early November 006 in the Pacific Northwest: A high-resolution model-based study Michael J. Mueller 1 and Kelly Mahoney 1 Cooperative
Moisture transport during the inland penetrating atmospheric river of early November 006 in the Pacific Northwest: A high-resolution model-based study Michael J. Mueller 1 and Kelly Mahoney 1 Cooperative
National Weather Service-Pennsylvania State University Weather Events
 National Weather Service-Pennsylvania State University Weather Events The record eastern United States Severe Weather event of 3-4 April 2011-Draft by Richard H. Grumm National Weather Service State College
CW3E Atmospheric River Update Outlook
 CW3E Atmospheric River Update Outlook Two systems expected to produce precipitation over the U.S. West Coast in the next week - AR conditions (IVT >250 kg m -1 s -1 and IWV >20 mm) are expected over most
The Pennsylvania Observer
 The Pennsylvania Observer April 2, 2010 March 2010 Pennsylvania Weather Recap Prepared by: Katelyn Johnson March did come in as a lion cub this year. The 1 st proved to be a calm day; however most of Pennsylvania
Atmospheric Rivers: Western U.S. Rainmakers and Key to Forecast-Informed Reservoir Operations
 Atmospheric Rivers: Western U.S. Rainmakers and Key to Forecast-Informed Reservoir Operations F. Martin Ralph UC San Diego/Scripps Institution of Oceanography A New Frontier in Water Operations: Atmospheric
Mid-Atlantic Severe Weather Event of 23 June 2015
 Mid-Atlantic Severe Weather Event of 23 June 2015 By Richard H. Grumm National Weather Service State College, PA 1. Overview A widespread severe weather event occurred in the eastern United States on 23
Cold frontal Rainband and Mid-Atlantic Severe Weather Event 28 September 2006 by Richard H. Grumm And Ron Holmes
 Cold frontal Rainband and Mid-Atlantic Severe Weather Event 28 September 2006 by Richard H. Grumm And Ron Holmes 1. INTRODUCTION A strong cold front moved across central Pennsylvania and the Mid-Atlantic