PLOTTED DATA AROUND STATION CIRCLE ON SURFACE ANALYSIS CHART TYPE OF HIGH CLOUD TYPE OF WIND SPEED MIDDLE CLOUD SEA-LEVEL PRESSURE
|
|
|
- Thomasine Doyle
- 5 years ago
- Views:
Transcription
1 WIND SPEED WIND DIRECTION TYPE OF HIGH CLOUD TYPE OF MIDDLE CLOUD SEA-LEVEL PRESSURE TOTAL AMOUNT OF SKY COVERED BY CLOUDS TEMPERATURE F VISIBILITY PRESENT WEATHER DEW POINT F TYPE OF LOW CLOUD BAROMETRIC CHANGE IN PAST 3 HOURS BAROMETRIC TENDENCY IN PAST 3 HOURS PAST WEATHER LAST 6 HRS. PLOTTED DATA AROUND STATION CIRCLE ON SURFACE ANALYSIS CHART
2 T-45 LESSON GUIDE CHANGE SUMMARY PAGE CHANGE DATE NUMBER ENTERED CHANGE DESCRIPTION INITIALS 1 9/99 Incorporated TSC 2 1/27/04 Incorporated FTSC (7-97) Change 2 i
3 THIS PAGE INTENTIONALLY LEFT BLANK. ii (7-97) Change 2
4 METRO List of Effective Pages LIST OF EFFECTIVE PAGES EFFECTIVE PAGES PAGE NUMBERS EFFECTIVE PAGES PAGE NUMBERS FRONT MATTER Change 2 i thru iv METRO-01 Change 1 Title page(s) Original 1-1 thru 1-20 Change Original 1-22 thru 1-38 METRO-02 Change 2 Title page(s) Original 2-1 thru 2-18 Change Original 2-20 Change Original 2-22 thru METRO-03 Change 2 Title page(s) Original 3-1 thru 3-13 Change Original 3-15 thru 3-33 Change Original 3-35 thru 3-57 (7-97) Change 2 iii
5 METRO List of Effective Pages THIS PAGE INTENTIONALLY LEFT BLANK. iv (7-97) Change 2
6 METRO List of Effective Pages LIST OF EFFECTIVE PAGES EFFECTIVE PAGES PAGE NUMBERS EFFECTIVE PAGES PAGE NUMBERS FRONT MATTER Change 2 i thru iv METRO-01 Change 1 Title page(s) Original 1-1 thru 1-20 Change Original 1-22 thru 1-38 METRO-02 Change 2 Title page(s) Original 2-1 thru 2-18 Change Original 2-20 Change Original 2-22 thru METRO-03 Change 2 Title page(s) Original 3-1 thru 3-13 Change Original 3-15 thru 3-33 Change Original 3-35 thru 3-57 (7-97) Change 2 iii
7 METRO List of Effective Pages THIS PAGE INTENTIONALLY LEFT BLANK. iv (7-97) Change 2
8
9
10
11
12
13
14 Surface Winds CUMULUS COLD Warm Air Lifted Aloft CIRROCUMULUS ALTOCUMULUS CUMULONIMBUS WARM COLD FRONT
15 CIRRUS Surface Winds WARM POSSIBLE EMBEDDED CBs ALTOSTRATUS NIMBOSTRATUS STRATUS COLD CIRROSTRATUS
16
17 Surface Winds WARM VARIOUS STRATUS CUMULONIMBUS COLD COOL STRATUS & STRATOCUMULUS
18 Surface Winds WARM COOL CUMULONIMBUS VARIOUS STRATUS COLD STRATUS & STRATOCUMULUS
19
20
21
22
23
24 DIRECTION OF MOVEMENT 10,000 HEIGHT 5,000 Impact -5 min Impact Impact +5 min 0 miles 1 <30 kt kt >40 kt
25 Strong Downdraft Increasing Tail Wind Increasing Head Wind Airspeed and AOA Increase Outflow AOA Low Airspeed Slow Airspeed and AOA Decrease Outflow
26
27
28 There is a program underway to install Doppler Radar at major airfields. Doppler Radar can provide early warning by detecting microbursts.
29 Metro-01 Review of Basic Meteorological Principles 3. Indications of microburst activity a. Blowing dust, dust devils, and gust fronts (downbursts will occasionally generate distinctive circular dust patterns) b. Thunderstorms in vicinity with visible areas of intense downdrafts indicated by rain or virga c. Sudden and unexplained increase in airspeed as noted on airspeed indicator accompanied by increased AOA indicative of rolling outflow d. Sudden increase in rate of descent accompanied by a lower AOA--indicative of entry into microburst core e. Extreme variations in wind velocity and direction in short time f. Significant differences between winds at 1,500 to 2,000 ft AGL surface winds g. LLWAS (Low-Level Windshear Alert System) alert NOTE: The LLWAS is comprised of a series of wind sensors located at various positions on the airport. The system senses windshear occurrences through comparison of readings from the various wind sensors. LLWASs are installed at several major airports around the U.S. Unfortunately, some microbursts are so small that they can fit between the sensors. Doppler radar has proven effective in detecting microbursts and is being installed at major airports. h. PIREP of windshear or airspeed gain or loss 4. Avoidance NOTE: Although PIREPs are important to alert other pilots of microbursts, microburst intensity can change rapidly, so even recent PIREPs may not reflect the true strength of a microburst listen to the aircraft ahead or ask for PIREP information from ATC. Report any airspeed fluctuations of 5 kts or more as soon as possible. a. Takeoff: delay departure b. Landing: delay approach or use alternate runway/approach or proceed to nearby alternate 5. Response during landing a. Execute a missed approach immediately response time is critical Page 1-20
30
31 Pitot and Static Port Icing Forward Visibility Impaired Reduced Communications Range Engine Damage from Ice Ingestion Increased Stall Speed GREATER DRAG Higher Angle of Attack Required GREATER WEIGHT STRUCTURAL ICING
32
33
34
35
36 SUBTROPICAL TROPOPAUSE TROPICAL TROPOPAUSE POLOR TROPOPAUSE 25,000 60,000 SUBTROPICAL JET STREAM (approx. 39,000 ) 60 POLAR JET STREAM (approx. 30,000 ) EQUATOR 30
37 Metro-01 Review of Basic Meteorological Principles ALTITUDE: THOUSANDS OF FEET TEMP. C ISOTACHS SUBTROPICAL TROPOPAUSE TEMP. C JET CORE 100 KNOTS POLAR TROPOPAUSE 75 KNOTS 50 KNOTS POLAR FRONT 25 KNOTS COOL AIR WARM AIR +10 SURFACE AVERAGE DISTANCE 200 NAUTICAL MILES +15 JET STREAM COLD FRONT Page 1-28 Figure 10: JET STREAM PROFILE
38 SUBTROPICAL TROPOPAUSE TROPICAL TROPOPAUSE POLOR TROPOPAUSE 25,000 60,000 SUBTROPICAL JET STREAM (approx. 39,000 ) 60 POLAR JET STREAM (approx. 30,000 ) EQUATOR 30 3,000-7,000 Ft Thick Miles Wide 1,000-3,000 Miles Long JET STREAM
39
40 WIND SPEED (In Knots) PLUS
41
42 Jet Stream Areas of Potential Clear Air Turbulence L
43 60, TURBULENCE ISOTACHS (lines of equal wind speed) ,000 JET CORE ,000 MAX TURBULENCE AREA NORTH SOUTH - 10
44 Standing Lenticular Clouds Cap Cloud Rotor Cloud Mountain Range Severe Turbulance Area
45
46
47
48 LESSON GUIDE COURSE/STAGE: Meteorology LESSON TITLE: LESSON IDENTIFIER: Metro-02 LEARNING ENVIRONMENT: Classroom ALLOTTED LESSON TIME: 2.3 hr TRAINING AIDS: * Figures Fig 1: Weather Minimums Required IAW OPNAVINST Fig 2: Surface Analysis Chart Fig 3: Standard Chart Symbols Fig 4: Major Station Model Symbols Fig 5: Weather Depiction Chart Fig 6: Radar Summary Chart Fig 7: Low-Level Prognostic Chart Fig 8: Winds Aloft Prognostic Chart Fig 9: METAR Fig 10: Terminal Aerodrome Forecast (TAF) Fig 11: METAR Abbreviations Fig 12: METAR (SPECI or Special Report) Fig 13: Area Forecast Coverage Fig 14: Area Forecast (FA) Fig 15: Winds Aloft Forecast (FD) Fig 16: Convective SIGMET (WST) Fig 17: SIGMET (WS) Fig 18: AIRMET (WA) Fig 19: Military Weather Advisory (MWA) (7-97) CHANGE 2 Page 2-i
49 TRAINING AIDS (cont.): Fig 20: The DD Fig 21: Weather Minima Criteria Flow Chart Fig 22: Data Sources Fig 23: Mission/Takeoff Section (Part I) Fig 24: Enroute Data Section (Part II) Fig 25: Terminal Forecast Section (Part III) Fig 26: Comments/Remarks Section (Part IV) Fig 27: Briefing Record Section (Part V) Fig 28: Interpreting the DD (Example 1) Fig 29: Interpreting the DD (Example 2) Fig 30: Interpreting the DD (Example 3) Fig 31: Interpreting the DD (Example 4) Fig 32: OPARS Kneeboard Output Fig 33: OPARS Request Form Fig 34: OPARS Request Form Fig 35: GOES Satellite Fig 36: GOES Coverage Fig 37: Visual Picture Fig 38: Infrared Picture Fig 39: Picture with Date/Time Data Fig 40: Satellite Picture of Jet Stream Fig 41: The GOES Mission Page 2-ii
50 STUDY RESOURCES: Meteorology Flight Planning Workbook II CNAT P-304-PAT LESSON PREPARATION: Complete: * CAI lesson for Metro-01 Read: * FLIP Flight Information Handbook, Section C * FLIP General Planning (GP) Chapter 8 REINFORCEMENT: N/A EXAMINATION: The objectives in this lesson will be tested in Meteorology 04X. Page 2-iii
51 THIS PAGE INTENTIONALLY LEFT BLANK. Page 2-iv
52 LESSON OBJECTIVES Determine weather minimums Recall weather minimums required IAW OPNAVINST Recall information contained/displayed on weather charts Interpret surface charts (analysis/prognostic) Interpret weather depiction charts Interpret radar summary charts Interpret prognostic charts Recall information contained in forecasts Recall information contained in METARs Recall information contained in terminal aerodrome forecasts Recall information contained in area forecasts Recall information provided in winds aloft forecasts Recall information contained in severe weather forecasts Page 2-1
53 Recall OPNAVINST severe weather restrictions Recall CNATRA severe weather restrictions Recall aviation in-flight weather advisories Recall information provided in AIRMETs Recall information provided in SIGMETs Recall requirements IAW OPNAVINST for obtaining DD Recall the five sections of the DD Interpret data contained on DD Recall enroute facilities/procedures for weather information and reporting Recall information provided in PIREPs Recall PIREP information to provide controlling agency Recall information provided by flight weather packet Recall information provided by Optimum Path Aircraft Routing System (OPARS) Recall information provided by satellite imagery Page 2-2
54 MOTIVATION For pilots, correctly interpreting weather information is as important as understanding weather phenomena. Understanding weather minimum requirements and visualizing the weather symbolized on charts, reports, and briefings are important flight planning skills that you must obtain and refine as you continue in your flying career. OVERVIEW After reviewing information concerning weather minimums and weather charts and reports, you will be able to interpret weather phenomena as they relate to flight planning. This lesson covers: * Weather minimums * Weather charts * Printed reports and forecasts * Flight weather briefing * Enroute procedures * Flight weather packets * OPARS * Satellite imagery Page 2-3
55 REFRESHER Recall the: * Characteristics of fronts and the wind changes and flight hazards associated with them * Meteorological hazards associated with thunderstorms, including turbulence, hail, squall lines, tornadoes, microbursts, windshear, and lightning * Types of structural icing, their formation, and their effects on aircraft performance * Hazards associated with fog formation * Hazards and probable location of clear air turbulence (CAT) * Hazards of wake turbulence and procedures to avoid it Page 2-4
56 PRESENTATION I. Weather minimums Sg 1, fr 3 Lesson Organization LESSON NOTES All projected graphics in this lesson are reproduced in the Lesson Guide, except for the projected graphics of a severe weather watch bulletin (WW) and a CNATRA severe weather warning (CAWW). A. OPNAVINST destination weather NOTE: Weather at ETA +/-1 hour dictates alternate weather requirements. 1. If destination is 0-0, up to but not including published minimums, then alternate must be 3,000-3 or better Sg 1, fr 4 Fig 1: Weather Minimums Required IAW OPNAVINST If destination is at published minimums, up to but not including 3,000-3 (single-piloted absolute minimums 200-1/2) a. Then for non-precision approaches, alternate must be published minimums plus b. Then for precision approaches, alternate must be published minimums plus 200-1/2 NOTE: ILS only authorized precision approach that can be used at an alternate, i.e., not a PAR. Page 2-5
57 DESTINATION WEATHER ETA plus and minus one (1) hour 0-0 up to but not including published minimums ALTERNATE WEATHER ETA plus and minus one (1) hour 3,000-3 or better Published minimums up to but not including 3,000-3 (single-piloted absolute minimums 200-1/2) NON- PRECISION PRECISION ILS PAR * Published minimums plus Published minimums plus 200-1/2 *Published minimums plus 200-1/2 3,000-3 or better No alternate required *In the case of single-piloted or other aircraft with only one operable UHF/VHF transceiver, radar approach minimums may not be used as the basis for selection of an alternate airfield. Figure 1: WEATHER MINIMUMS REQUIRED IAW OPNAVINST Page 2-6
58 NOTE: In the case of single-piloted aircraft, or other aircraft with only one operable UHF/VHF transceiver radar approach, minimums may not be used as the basis for selection of an alternate airfield. 3. If destination is 3,000-3 or better, no alternate is required NOTE: CNATRA requires an alternate be filed for all cross-country flights, regardless of destination weather. PROGRESS CHECK Question The weather at your destination is forecast to be greater than published minimums but less than 3, For a non-precision approach, what are your alternate airport weather requirements? ANSWER: above precision approach minimums II. Weather charts Sg 2, fr 3 Lesson Organization A. Observed-weather charts 1. Surface analysis charts a. Based on hourly observed weather information Sg 2, fr 4 Fig 2: Surface Analysis Chart b. Provide ready means of locating pressure systems, fronts, and stations with potentially poor weather conditions c. Disseminated every 3 hrs d. Symbology Fig 3: Standard Chart Symbols Page 2-7
59 NATIONAL WEATHER SERVICE 1500Z SAT AUG 13 19XX NO21. NMC SURFACE ANALYSIS ASUS Figure 2: SURFACE ANALYSIS CHART Page 2-8
60 COLOR SYMBOL DESCRIPTION Blue Red Blue Blue Red Red Red/Blue Purple Blue Red Red/Blue Blue Red Red/Blue Purple Purple Brown Black Black Black High pressure center Low pressure center Cold front Cold front aloft Warm front Warm front aloft Stationary front Occluded front Cold frontogenesis Warm frontogenesis Stationary frontogenesis Cold frontolysis Warm frontolysis Stationary frontolysis Occluded frontolysis Squall line Trough Ridge Isobar Intermediate isobar Figure 3: STANDARD CHART SYMBOLS Page 2-9
61 LESSON NOTES Point out the various chart symbols as they are discussed for each of the weather charts. (1) Standard symbols depict fronts (2) H or L and isobars denote pressure systems Sg 2, fr 5 Fig 4: Major Station Model Symbols (3) Station model includes information on sky coverage, wind direction and speed, temperature, dew point, precipitation, and other related information Sg 2, fr 6 Fig 2: Surface Analysis Chart LESSON NOTES On the chart, trace the course a flight would take from Chicago to Miami. PROGRESS CHECK Question Refer to the simplified surface analysis chart (Figure 2). You are planning a flight from Chicago to Miami. What type of weather are you likely to experience? ANSWER: A stationary front approximately halfway through the trip Page 2-10
62 WIND SPEED WIND DIRECTION TYPE OF HIGH CLOUD TYPE OF MIDDLE CLOUD SEA-LEVEL PRESSURE TOTAL AMOUNT OF SKY COVERED BY CLOUDS TEMPERATURE F VISIBILITY PRESENT WEATHER BAROMETRIC CHANGE IN PAST 3 HOURS BAROMETRIC TENDENCY IN PAST 3 HOURS DEW POINT F PAST WEATHER LAST 6 HOURS TYPE OF LOW CLOUD PLOTTED DATA AROUND STATION CIRCLE ON SURFACE ANALYSIS CHART SKY CONDITION PRESENT WEATHER PRESSURE TENDENCY CLOUDS CLEAR RAIN RAIN SHOWER RISING, THEN FALLING (+) St 1/10 OR LESS DRIZZLE HURRICANE RISING AND STEADY (+) Sc 2/10 TO 3/10 SNOW SQUALL RISING (+) Ns 4/10 ICE PELLETS FUNNEL CLOUD FALLING, THEN RISING (+) Cu 5/10 HAIL BLOWING SNOW STEADY Cb 6/10 THUNDERSTORM FOG FALLING, THEN RISING (-) Ac 7/10 TO 8/10 FREEZING DRIZZLE BLOWING DUST OR SAND FALLING, THEN STEADY (-) As (THIN) 9/10 FREEZING RAIN DUST DEVIL FALLING (-) Cl COMPLETE OVERCAST SNOW SHOWER SMOKE RISING, THEN FALLING (-) Cc OBSCURATION THUNDERSTORM AND RAIN HAZE (+) (-) HIGHER THAN 3 HOURS AGO LOWER THAN 3 HOURS AGO Cs MAJOR STATION MODEL SYMBOLS Figure 4: MAJOR STATION MODEL SYMBOLS Page 2-11
63 Sg 2, fr 7 Fig 5: Weather Depiction Chart 2. Weather depiction charts a. Compiled from hourly surface aviation reports b. Quickly identify positions of fronts and areas of VFR, marginal VFR (MVFR), and IFR weather (1) MVFR (marginal visual flight rules) weather between 1,000 ft ceiling/3 miles visibility and 3,000 ft ceiling/5 miles visibility (2) MVFR has no bearing on the civilian or military pilot but warns of poor flying conditions (3) Chart contains a legend for clarity c. Disseminated eight times a day, every 3 hrs starting at 0100Z d. Symbology (1) Standard symbols depict fronts (as on surface analysis chart) (2) Contoured unshaded areas indicate MVFR weather with ceilings of 1,000-3,000 ft AGL and/or visibilities of 3-5 sm (3) Contoured shaded areas indicate IFR weather with ceilings of less than 1,000 ft AGL and/or visibility of less than 3 sm (4) The weather depiction chart station model contains no wind, temperature, or pressure information. NOTE: The following items are depicted: sky coverage, height of lowest cloud layer (or ceiling height, if present) in ft AGL, visibility if 6 sm or less, and form of weather obscuring the visibility (as in Figure 5). Page 2-12
64 = = 3 1/4= = SHADED AREAS...IFR WITH CIGS LESS THAN 1,000 FT AND/OR VSBY LESS THEN 3 MI. 10Z MON 25 JULY 19XX 56. NMC WEATHER DEPICTION CONTOURED WITHOUT SHADING...MVFR AREAS WITH CIG GREATER THAN OR EQUAL TO 1,000 TO LESS THAN OR EQUAL TO 3,000 FT AND/OR VSBY GREATER OR EQUAL TO 3 MI LESS THAN OR EQUAL TO 5 MI. NO CONTOURS...VFR AREAS WITH CIG GREATER THAN 3,000 FT AND VSBY GREATER THAN 5 MI. Figure 5: WEATHER DEPICTION CHART Page 2-13
65 (5) Sky coverage symbols are different from those used for the surface analysis charts (6) Some weather symbols used on the surface analysis are used on the weather depiction chart LESSON NOTES For the following progress check, point to the station in South Dakota on the chart. Although the test question for this objective will require a response with only VFR, IFR, or MVFR conditions, we have presented additional information on station models for your use. PROGRESS CHECK Question Refer to the station in South Dakota (Figure 5). What are the weather conditions at this station? ANSWER: IFR. The station model depicts a 1/4-mile visibility, fog, and no ceiling Sg 2, fr 8 Fig 6: Radar Summary Chart 3. Radar summary charts a. Derived from radar returns from National Weather Service (NWS), terminal, and Air Route Traffic Control Center (ARTCC) weather radar stations across the U.S. (1) Weather radar used is primarily X-band (UHF), which is more sensitive to weather echoes Page 2-14
66 S- R- NE ZL- NA 310 RW RW+ LEWP 18 NA NE NE NA OM NA NA NE NA NA OM NE NE SLD NA HAIL TRW+ LM L NE R+ NA NA R+ NA RW NE NA HOOK SLD TRW+ 35 RW4 OM NA 24 RW4 LEGEND TRW SHADING--ECHO AREAS CONTOURS AT INTENSITIES TOPS 999--BASES S OF FT. MVMT--AREAS+LINES--PENNANTS MVMT--CELLS--ARROWS WITH SPEED PRECIP TYPE AND CHANGE OF INTENSITY + IS NEW OR INCRG. - IS DCRG WT064 WEATHER WATCH BOXES WT064 VALID UNTIL 1230Z MONDAY 0845 JUL 26 19XX RADAR SUMMARY Figure 6: RADAR SUMMARY CHART Page 2-15
67 (2) Computer-produced facsimile presentation from radar returns b. Identify general areas and movement of precipitation and thunderstorms for preflight planning purposes c. Disseminated once an hour, 35 minutes past the hour d. Symbology (1) Areas of echoes are marked with a solid outline and crosshatched (a) (b) (c) 6 different levels of intensity Only contours for levels 1,3,5 are plotted; levels 2,4,6 are interpolated between them Intensities i) Weak ii) iii) iv) Moderate (moderate to severe turbulence possible) Strong (severe turbulence possible and lightning) Very strong (severe turbulence probable and lightning) v) Intense (severe turbulence, lightning, hail likely, and organized wind gusts) vi) Extreme (severe turbulence, lightning, large hail, and extensive wind gusts and turbulence) (d) Line of echoes (such as a squall line) indicated by a solid line Page 2-16
68 (2) Display tops and bottoms of radar echoes, if known, in hundreds of feet NOTE: Actual cloud tops and/or bottoms may be several thousand feet higher or lower. (3) Direction arrows (a) (b) Arrows with barbs or flags indicate area or line movement Arrows with numbers indicate direction and speed of individual cell within a line or area NOTE: Arrows are oriented to eight cardinal points of compass. (4) Contractions and letters depict the type of surface weather associated with the echoes NOTE: A "+" (plus) symbol indicates the intensity of the echoes are increasing. A "-" (minus) symbol indicates decreasing intensity. (5) Dashed line box indicates a forecast weather watch (WW) area (a) (b) Valid time and ID number of WW displayed alongside "WT" denotes tornado watch, "WS" indicates severe thunderstorms NOTE: Only forecast information is on the RADAR Summary Chart; all other information is observed. Page 2-17
69 (6) If for any reason no echoes were observed, the following symbols are used to indicate why: (a) (b) "NE" - No Echo - echo information but none observed "NA" - Observation Not Available NOTE: If plotted with station call letters, a report is available but received too late to plot. (c) (d) "OM" - Equipment Out for Maintenance "ROBEPS" - Radar Operating Below Performance Standards PROGRESS CHECK Question Refer to the radar summary chart (Figure 6). Regarding the area of precipitation off the Florida coast, what information can be derived? ANSWER: The information presented on the chart includes: Radar echoes to 26,000 MSL, level 1 to 2 intensity, cell movement to the northwest at 24 kts. B. Prognostic charts NOTE: Remember to correlate forecast flight conditions. to scheduled flight time. Sg 2, fr 9 Fig 7: Low-Level Prognostic Chart 1. Low-Level Significant Weather Prognostic Chart Page 2-18
 Change 2 Page")
70 Figure 7: LOW-LEVEL PROGNOSTIC CHART (7-97) Change 2 Page 2-19
71 a. Manually produced facsimile prognostic charts providing depictions of various surface and low-level (up to 24,000 ft MSL) significant weather features out to 48 hrs b. The 12- and 24-hour forecasts are produced on one chart, 4 times a day NOTE: Separate panels depict the surface weather prognosis, and a second panel depicts the "significant weather" for each forecast time. c. The 36- and 48-hour forecasts are on a separate chart produced twice daily NOTE: A single panel depicts both surface features and significant weather. Underneath the panel, a forecast discussion about which guidance was used to prepare the chart, and why it was used, is written in plain language with many abbreviations. d. Chart intended for general flight planning, see specific TAFs for terminal aerodrome forecasts e. Chart shares some symbology and coloration with the Surface Analysis (SA) chart f. Frontal type and position shown using standard symbols (1) High- and low-pressure centers indicated by Hs and Ls with the pressure value (underlined) to the nearest whole millibar (2) Pressure center movement is indicated by an arrow for direction, and the forecast speed of movement at the valid time of the chart is entered in knots at the head of the arrow NOTE: The term "STNRY" is used to indicate little movement. Page 2-20
72 (3) Isobars will be depicted by a thin, solid line at an 8-millibar interval, labeled in tens and units of millibars g. Chart always contains a legend in the middle of the top two panels Sg 2, fr 10 Prognostic Chart Legend (1) Solid line indicates terminal areas with ceilings less than 1,000 ft and/or visibility less than 3 miles (IMC) - colored red (2) Scalloped line indicates terminal areas with ceiling between 1,000 ft but less than 3,000 ft and/or visibility greater than 3 miles but less than 5 miles (MVFR) - colored blue (3) Bold long-dashed lines indicate areas of moderate or greater turbulence NOTE: The chart does not depict light turbulence. Moderate turbulence is symbolized by an inverted V, severe turbulence uses the same inverted V with a second inverted V above. (a) The numbers to the left of a slash (/) indicate tops of forcasted turbulance, and numbers to the right indicate the base of the forcasted turbulance in hundreds of feet MSL (b) No figure to the right of the slash indicates turbulance from surface upward, while absence of a figure to the left of the slash indicates turbulance above the limits of the chart (24,000 feet MSL) (4) The surface 32-degree isotherm is depicted with a dotted line and is labeled (7-97) Change 2 Page 2-21
73 (5) Freezing level aloft indicated with a short dashed line and labeled in hundreds of feet MSL at 4,000-ft intervals NOTE: If an upper level freezing contour crosses the surface freezing line, multiple freezing levels aloft are indicated. NOTE: Areas of icing are not specifically outlined on the chart; however, a pilot should know that icing is implied in clouds or areas of precipitation above the freezing level. PROGRESS CHECK Question Refer to the low-level prognostic chart. Regarding the southeastern U.S., what information can be derived? ANSWER: The area is forecast to be dominated by IFR weather. 2. High-level significant weather prognostic above 24,000 ft MSL a. Manually prepared by NWS forecasters b. Display 12- and 24-hour forecasts for significant weather conditions c. Disseminated 4 times daily d. Symbology (1) Scalloped lines depict areas of widespread or embedded thunderstorms Page 2-22
74 (2) Broken lines display areas of CAT (3) Depicts location of weather hazards, including widespread sandstorms or dust storms, squall lines, and tropical storms (4) Arrows and wind flags show position and speed of jet stream (5) Square boxes show height of the tropopause NOTE: Meteorologists utilize the low-level significant Wx Prog chart more than the high-level. All high-level information is available from other sources, e.g., constant pressure charts. Many weather offices choose to not receive this facsimile from the National Weather Service. 3. Winds Aloft Prognostic charts a. Computer-prepared forecasts of wind speed and direction and outside air temperature (OAT) for true altitudes of 6,000 ft, 9,000 ft, and 12,000 ft Sg 2, fr 11 Fig 8: Winds Aloft Prognostic Chart NOTE: Charts are also available for the true altitudes of 18,000 ft (500 mbs), 24,000 ft (400 mbs), 30,000 ft (300 mbs), 34,000 ft (250 mbs), 39,000 ft (200 mbs), which approximate the constant pressure charts. b. Flight planning applications include computation of ground speed, time en route, and other performance figures NOTE: Although winds aloft prognostic charts are considered accurate for a quick ready reference, the winds aloft forecast (FA) teletype report is considered to be more accurate. Page 2-23
75 HR UPPER WIND PROG A178K 30,000 FT WINDS AND TEMPS 12HR FCST VALID 00Z 17 APR -27 NOTE: This is an 8-panel chart; however, only 1 panel is shown here for clarity. The 8 different panels give winds for 6,000, 9,000, 12,000, 18,000, 24,000, 30,000, 34,000, and 39,000 ft levels. Figure 8: WINDS ALOFT PROGNOSTIC CHART Page 2-24
76 c. Disseminated 2 times daily in 12-hour prognostics (1) 8-panel chart (2) Chart does not forecast winds and temperature for a given time but considered average winds for the period of the chart, for use until next chart received d. Symbology (1) Wind shaft - depicts the quadrant from which the wind is blowing (a) (b) To 8 cardinal points of compass Number near the end of the shaft indicates direction to nearest 10 degrees (2) Wind velocity indicated at top of shaft (a) (b) (c) (d) (e) Flag for 50 kts Barb for 10 kts Half barb for 5 kts Accuracy to nearest 5 kts If calm or light and variable, wind will be shown as "99" to the lower left corner of station model (3) Temperature depicted in degrees Celsius near base of wind flag Page 2-25
77 LESSON NOTES Point to the station in Florida (-29) and the station in northern Minnesota (-38) on the winds aloft chart. PROGRESS CHECK Question Refer to the winds aloft prognostic chart (Figure 8). When planning a flight from Florida to northern Minnesota, what wind pattern(s) should you for the most part expect? ANSWER: Tail winds (or southerly)? Using prognostic charts, how can you detect a forecast area of severe turbulence? ANSWER: On low- and high-level prognostic charts, broken lines enclose areas of turbulence. Sg 3, fr 3 Lesson Organization Sg 3, fr 4 Introduction to METAR/TAF Sg 3, fr 5 Figure 9: METAR III. Printed reports and forecasts A. METAR NOTE: METAR/TAF weather codes became effective July 1, 1996, at 0800 UTC. The following information is current as of April However, check the Aeronautical Information Manual and latest publications for more complete information and possible differences between the format and definitions presented here. Page 2-26
78 METAR (or SPECI for Special Report) KPIT Z (AUTO for automated observation) (COR for correction to observation) 22015G25KT 3/4 SM R28R/2600FT TSRA OVC010CB 18/16 A2992 RMK SLP013 T Figure 9: METAR Page 2-27
79 1. Beginning July 1, 1996, at 0800 UTC, the United States converted airport surface observations (SAs and SPs) and airport terminal weather forecasts to the International Civil Aviation Organization (ICAO) formats a. The surface observations and terminal forecast formats and coding changed b. Other weather products such as winds aloft (FD), area forecasts (FA), and pilot reports (PIREPs) changed little except to incorporate the new weather coding and station identifiers 2. The hourly surface observations (SA) are referred to as METAR (Aviation Routine Weather Report), and the airport terminal forecast are referred to as TAF (Aerodrome Forecast). Pilots will notice some differences in the sequence in which information is presented, formatted (e.g., winds and cloud cover), and the abbreviations used 3. With a little practice, pilots will find it easy to understand the new code and will find the additional information in the forecasts (TAF) very useful a. Those who use DUATs (Direct User Access Terminal) or commercially provided weather services will find that all have included a plain language interpreter just as before b. In flight service briefings, the sequence of information may be different, and the temperature and dew point will be in degrees Celsius NOTE: When METAR data is missing from the body of the report (e.g., dew point), it is simply omitted; the user must know the sequence to recognize this. Some exceptions apply in remarks such as RVRNO, or SLPNO, when RVR or SLP are normally reported but not currently available. Page 2-28
80 4. To help remember the sequence, think of 3 W's at the beginning -- Where, When, and Wind. This works for both METAR and TAF a. Where (1) KPIT is the ICAO station identifier b. When (a) 3-letter identifiers are preceded by a "K" for the contiguous United States (b) Alaska and Hawaii use 4-letter identifiers, beginning with "PA" and "PH," respectively (c) Changes are planned to incorporate alphabetic identifiers for those weather reporting stations where numbers and letters are now used (e.g., W10 to KHEF) (1) Z is the 20th day of the month (2) Z at 1955Z time c. Wind (1) 22015G25KT -- reported as the 3-digit true direction to the nearest 10 degrees NOTE: ATC towers, ATIS and airport advisory service report wind as magnetic. (2) 22015G25KT -- the 2- or 3-digit speed (3) 22015G25KT -- if the wind is gusting (4) 22015G25KT or 3-digit maximum speed and units NOTE: 00000KT -- calm winds. Page 2-29
81 (5) 22015KT 180V wind direction varies 60 degrees or more, and wind is greater than 6 kts (6) VRB -- wind direction is variable, and speed is less than or equal to 6 kts (7) RMK - peak wind is one element reported in the remarks section whenever the maximum instantaneous speed is greater than 25 kts /15 means a maximum instantaneous wind of 30 kts occurred 15 minutes past the hour from 220 degrees. PK WND 22030/15 d. Visibility (1) 3/4SM -- 3/4 statute mile visibility. Miles and fractions are also reported (e.g., 2 3/4SM for 2 and 3/4 sm visibility) (2) R28R/2600FT -- Runway Visual Range (RVR). Signifies that the runway visual range for runway 28 Right is 2,600 ft. The format is R(XXX) Runway Designator including (L)eft (C)enter or (R)ight/(XXXX) 4-digit visibility in ft (3) Some coding pilots may also see for RVR include: (a) (b) (c) M -- indicates that RVR is less than lowest reportable sensor value (e.g., M0600FT) P -- indicates RVR greater than highest reportable sensor value (e.g., P6000FT) V -- variable. If the RVR is variable between 2,000 and 4,000 ft for runway 6L: (R06L/2000V4000FT). May contain up to four RVR reports Page 2-30
82 e. Significant Present Weather (1) TSRA (Thunderstorm/Moderate Rain) Format is a 2-character descriptor (e.g., TS, SH, DR) sometimes followed by a 2-character weather phenomenon (e.g., RA, SN, FG) (2) Intensity or proximity of weather phenomenon: (a) (b) (c) (d) "-" -- Light "+" -- Heavy "no sign" -- Moderate "VC" -- in the vicinity f. Clouds (1) OVC010CB -- specifies cloud amount, height, and type. Overcast clouds are present at 1,000 ft consisting of cumulonimbus clouds (2) Cloud height is reported in hundreds of feet. When clouds are composed of towering cumulus or cumulonimbus, TCU or CB will follow cloud height (3) Clouds are categorized based on eighths (octas) of the sky (a) (b) (c) (d) (e) SKC -- Sky clear FEW -- >0-2 octas SCT octas BKN octas OVC -- 8 octas Page 2-31
83 (4) Vertical Visibility (VV) -- may be listed here for indefinite ceiling such as "VV004" for Vertical Visibility 400 ft (5) Temperature/Dew Point -- listed in degrees Celsius NOTE: When temperatures are below 0 degrees C, they are preceded by "M" for minus (e.g., 10/M06 for temperature 10 degrees C, dew point -6 degrees C). (6) Altimeter Setting -- (ex. A2992) "A" indicates setting in inches of mercury for United States. Consists of 4 digits: inches and hundredths (7) Remarks (RMK) come last (a) RMK SLP013 T Selected stations will contain SLP for sea level pressure reported as the last 3 digits in hectopascals (millibars) to the nearest tenth (e.g., is reported as SLP013) (b) RMK SLP013 T character code breaks down the temperature and dew point to the nearest 1/10th of a degree Celsius (selected stations) (i) (ii) The "T" stands for temperature The "0" means positive temperature (iii) A "1" in place of the "0" stands for negative temperature Page 2-32 (iv) Other temperature codes, such as 10142, 20012, or , may appear to document temperatures not related to aviation (selected stations)
84 B. METAR On ASOS/AWOS ASOS/AWOS reports will also use METAR/SPECI code formats. An ASOS/AWOS report can be identified by the term A01 or A02 in the remarks (RMK) section. Example: METAR KOFP Z AUTO 30008KT 10SM CLR 22/10 A3010 RMK AO2 SLP138 T Some ASOS/AWOS sites are attended a. The term AUTO is not included in the report (A01 or A02 remain) b. An attended site may contain information that has been manually provided by the observer 3. Only a fully automated site without human intervention will contain the word AUTO 4. When ASOS/AWOS reported sky condition is clear (CLR), it means no clouds at or below 12,000 ft C. TAF TAF contains a definitive forecast for specific time periods and will replace the terminal forecast Sg 3, fr 6 Fig 10: Terminal Aerodrome Forecast TAF (TAF AMD -- Amended Forecast, when included) KPIT Z KT 3SM -SHRA BKN020 FM G25KT 3SM SHRA OVC015 TEMPO /2SM TSRA OVC008CB FM KT 5SM -SHRA BKN020 OVC040 PROB KT 1SM -RA BR FM KT 5SM -SHRA OVC020 BECMG KT P6SM NSW SKC Page 2-33
85 KNQI TAF G28KT 8000 FEW015SCT025CB BKN040 BKN QNH2990INS VCTSSHRA TEMPO 1900 VRB20G35KT 3200 TSSHRA BKN 015CB OVC025 BECMG G22KT 9999 SCT020 SCT250 QNH2995INS BECMG KT 4800BR SCT010 SCT250 QNH3000INS TEMPO FG VV002 BECMG KT 9000 HZ SCT020 SCT100 BKN250 QNH2992INS Figure 10: TERMINAL AERODROME FORECAST (TAF) Page 2-34
86 2. Once you know how to pick out the TAF forecast time periods, the same logical sequence that we saw in METAR will follow. Below, a TAF is broken down to highlight its individual segments. Key words (and their definitions) indicating a new time period has started are in boldface TAF KPIT Z KT 3SM -SHRA BKN020 FM G25KT 3SM SHRA OVC015 WS015/30045KT TEMPO /2SM TSRA OVC008CB FM KT 5SM -SHRA BKN020 OVC040 PROB KT 1SM -RA BR FM KT 5SM -SHRA OVC020 BECMG KT P6SM NSW SKC 3. The Where, When, and Wind trick works with TAF; however, here's a little twist with the "when" TAF KPIT Z KT a. Where (1) KPIT is the ICAO station identifier. (2) The usual 3-letter identifiers are preceded by a "K" for the contiguous United States. (3) Alaska and Hawaii will use 4-letter identifiers beginning with "PA" and "PH" respectively. (4) Changes are planned to incorporate 3-letter identifiers for those weather reporting stations where numbers and letters are now used (e.g., W10 to KHEF) Page 2-35
87 b. When (1) Z -- the forecast for the 9th day of the month with an issuance time of 1730Z or UTC (2-digit date and 4-digit time) (2) the valid period with the first 2 digits containing the day of the month (09) (3) the second 2 digits specify the hour beginning the forecast period (1800Z) (4) the last 2 digits are the hour ending the forecast period (1800Z on the next day, the 10th) c. Wind (1) WS015/30045KT means at 1,500 ft, we expect wind to be 300 degrees at 45 kts. This indicates low-level wind shear not associated with convective activity d. Time Periods, Etc. (1) FM From 2030Z or UTC time (indicates hours and minutes) (2) TEMPO Temporary changes expected between 2000Z and 2200Z (3) FM From 2300Z (4) PROB There is a 40% probability of this condition occurring between 0400Z and 0700Z (5) FM From 1000Z (6) BECMG Conditions becoming as described between 1300Z and 1500Z Page 2-36
88 (7) Once the specific time periods can be discerned, the sequence of wind, visibility, significant weather, cloud cover and cloud height follows and is repeated for each time block (a) (b) The only exception is after qualifiers such as PROB40, TEMPO, and BECMG, some of the components may be omitted if these are not expected to change Notice that after TEMPO 2022, there is no wind given, and after PROB , there is no cloud cover listed D. METAR/TAF , International Differences NOTE: When no significant weather (NSW) appears, it only indicates obstruction to visibility or precipitation previously noted has ended. a. Pilots and operators who fly to international destinations are cautioned to be alert to differences between U.S. METAR/TAF and international METAR/TAF. The following are some key differences: (1) Altimeter Setting (a) (b) The United States reports the altimeter setting in inches of mercury (e.g., A2992) Internationally, it will reported in hectopascals (millibars) (e.g., Q1016) Page 2-37
89 (2) Wind (a) Internationally, wind may be reported in kts (KT), kilometers per hour (KMH), or meters per second (MPS). Appropriate units are indicated on both METAR and TAF (3) Wind Shear (a) Low-level wind shear, not associated with convective activity (e.g., WS015/30045KT, see TAF) will appear in TAFs in the United States, Canada, and Mexico only (4) Visibility (a) (b) (c) Internationally, visibility is reported in 4 digits, using meters, with the direction of the lowest visibility sector (e.g., 6000SW -- meaning visibility is lowest at 6,000 meters to the southwest) In the United States, we use prevailing visibility in statute miles, not the lowest visibility, so the same conditions would be reported differently International visibility reports also contain a trend, such as: i) D -- Down ii) iii) U -- Up N -- No change iv) V -- Variable Page 2-38
90 2. Other a. Remarks (RMK) included in U.S. METAR are transmitted to only Canada and Mexico and no other international stations b. Pilots may also see the following notation on International METAR/TAF: CAVOK (Ceiling and Visibility OK) (1) CAVOK is used to replace weather and clouds if visibility is 10 km or more, and there are no clouds below 1,500 meters (5,000 ft) or below the highest minimum air traffic control sector altitude, whichever is greater (2) Also, there must be no other significant weather. NSC means no significant clouds c. International TAFs may include temperature, turbulence, and icing forecasts Fig 11: METAR Abbreviations Fig 12: METAR (SPECI or Special Report) E. Area Forecast (FA) General - provides overview of aviation weather conditions over the United States and adjacent coastal waters Sg 3, fr 7 Fig 13: Area Forecast Coverage a. Used for flight planning and a weather briefing aid b. Intended for use by General Aviation pilots, Civil and Military operations, National Weather Service (NWS), and Federal Aviation Administration (FAA) briefers c. Consists of two sections: (1) HAZARDS/FLIGHT PRECAUTIONS (2) SYNOPSIS AND VFR CLOUDS/ WEATHER Page 2-39
91 AO1 AO2 AMD BECMG BKN CLR COR FEW FM LDG M M NO NSW OVC P P6SM PK WND PROB40 R RMK RY/RWY SCT Automated Observation without precipitation discriminator (rain/ snow) Automated Observation with precipitation discriminator (rain/ snow) Amended Forecast (TAF) Becoming (expected between 2-digit beginning hour and 2-digit ending hour Broken 5-7 octas (eighths) cloud coverage Clear at or below 12,000 ft (ASOS/ AWOS report) Correction to the observation >0-2 octas (eighths) cloud coverage From (4-digit beginning time in hours and minutes) Landing In temperature field, means "minus" or below zero In RVR listing, indicates visibility less than lowest reportable sensor value (e.g., M0600) Not available (e.g., SLPNO, RVRNO) No Significant Weather NOTE: NSW only indicates obstruction to visibility or precipitation previously noted has ended. Low ceilings, wind shear, and other weather conditions may still exist. Overcast 8 octas (eighths) cloud coverage In RVR, indicates visibility greater than highest reportable sensor value (e.g., P6000FT) Visibility greater than 6 SM (TAF only) Peak wind Probability 40 percent Runway (used in RVR measurement) Remark Runway Scattered 3-4 octas (eighths) cloud coverage Sky Clear SKC SLP Sea Level Pressure (e.g., reported as 013) SM Statute mile(s) SPECI Special Report TEMPO Temporary changes expected (between 2-digit beginning hour and 2-digit ending hour) TKOF Takeoff T , 10142, and In Remarks -- examples of temperature information V Varies (wind direction and RVR) VC VRB VV WS Vicinity Variable wind direction when speed is less than or equal to 6 kts Vertical Visibility (Indefinite Ceiling) Wind shear (In TAFs, low-level and not associated with convective activity) DESCRIPTORS BC Patches BL Blowing DR Low Drifting FZ Supercooled/freezing MI Shallow PR Partial SH Showers TS Thunderstorm WEATHER PHENOMENA BR Mist DS Dust Storm DU Widespread Dust DZ Drizzle FC Funnel Cloud +FC Tornado/Water Spout FG Fog FU Smoke GR Hail GS Small Hail/Snow Pellets HZ Haze IC Ice Crystals PE Ice Pellets PO Dust/Sand Whirls PY Spray RA Rain SA Sand SG Snow Grains SN Snow SQ Squall SS Sandstorm UP Unknown Precipitation (Automated Observations) VA Volcanic Ash CLOUD TYPES CB Cumulonimbus TCU Towering Cumulus INTENSITY VALUES - Light no sign Moderate + Heavy Figure 11: METAR ABBREVIATIONS Page 2-40
92 NOTE: When METAR data is missing (e.g., dew point), it is simply omitted, and the user must know the sequence to recognize this. Some exceptions apply in remarks such as RVRNO or SLPNO, when RVR or SLP are normally reported but not currently available. METAR KPIT Z 22015G25KT 3/4SM R28R/2600FT TSRA OVC010CB 18/16 A2992 RMK SLP013 T Where: KPIT When: Z 20th day of month at 1955Z Wind: 22015G25KT 220 degrees at 15 gusting to 25 kts V: Variable direction, e.g., 20015KT 220V280 VRB: Variable direction, when speed is less than or equal to 6 kts Visibility: 3/4SM 3/4 statute miles; typical: 2 3/4 SM, 1 SM RVR R28R/2600FT Runway 28 Right visibility 2,600 ft M: Used for RVR less than lowest reportable sensor value (e.g., M0600FT) P: Used for RVR greater than highest reportable sensor value (e.g., P6000FT) V: Variable Significant Weather: TSRA -- thunderstorm/moderate rain Sky Condition: OVC010CB -- overcast clouds at 1,000 ft consisting of cumulonimbus Typical: SCK, FEW, SCT, BKN, VV004 indefinite ceiling (Vertical Visibility) 400 ft Temperature/Dew Point: 18/ degrees Celsius/dew point 16 degrees Celsius (M=Minus or below zero) Altimeter: A2992 inches of mercury and preceded by an "A" RMK SLP013 T At selected stations, sea level pressure is reported as the last 3 digits in hectopascals (millibars) (e.g., is reported as SLP013). Codes such as T and are climate temperature information. TAF (TAF AMD is Amended Forecast when included) KPIT Z KT 3SM -SHRA BKN020 WS015/30045KT FM G25KT 3SM SHRA OVC015 TEMPO /2 TSRA OVC008CB FM KT 5SM -SHRA BKN020 OVC040 PROB KT 1SM -RA BR FM KT 5SM -SHRA OVC020 BECMG KT P6SM NSW SKC Where: KPIT When: Z --issuance day and time (9th day at 1730Z) valid period (9th day at 1800Z to next day, 10th at 1800Z Wind: 22020KT degrees at 20 kts Visibility: 3SM -- 3 statute miles, typical - 2 3/4SM, 1SM P6SM: Greater than 6 statute miles Significant Wx: -SHRA light rain showers Sky Condition: BKN broken clouds at 2,000 ft Typical: FEW, SCT, BKN, OVC VV004 indefinite ceiling (Vertical Visibility) 400 ft. CB and TCU clouds noted when present.. Wind Shear: WS015/30045KT --Low-level wind shear at 1,500 ft forecast to be 300 degrees at 45 kts (only nonconvective, low-level, wind shear is forecast) Sequence of Wind, Visibility, Significant Weather and Sky Condition repeats preceded by: FM2030: From 2030Z TEMPO 2022: Temporarily between 2000Z and 2200Z FM2300: From 2300Z PROB : There is a 40% probability between 0400Z and 0700Z FM1000: From 1000Z BECMG 1315: Becoming between 1300Z and 1500Z NOTE: Weather conditions such as wind and sky condition may be omitted after PROB40, TEMPO, and BECMG, if no change is expected from those same conditions given in the previous time block. Figure 12: METAR (SPECI OR SPECIAL REPORT) Page 2-41
93 ME CA SFO OR WA San Francisco NV ID UT SLC Salt Lake City MT WY CO ND SD MN NE IA Kansas City KS LS WI MO LM CHI Chicago IL MI IN TN LH OH KY VT NH Boston MA NY RI CT PA NJ MD DE WV VA NC SC BOS AZ NM OK DFW Dallas/Ft. Worth AR LA MS AL GA FL MIA Miami TX Figure 13: AREA FORECAST COVERAGE Page 2-42
94 d. Communications headers contain unique information for routing purposes, as well as allowing individual sections to be replaced, rather than appended e. In-flight advisories (AIRMETs, SIGMETs, Convective SIGMETs) amend or update the FA; however, the appropriate section of the FA should be amended or corrected as soon as practical 2. Responsibility - Issued by the National Aviation Weather Advisory Unit (NAWAU) in Kansas City, Missouri, for the conterminous United States and coastal waters a. Pacific Coast (SFO) b. Rocky Mountain (SLC) c. North-Central (CHI) d. Northeast (BOS) e. South-Central (DFW) f. Southeast (MIA) g. Four additional FAs issued by the Weather Service Forecast Offices (WSFO) in Anchorage, Fairbanks, and Juneau for Alaska and in Honolulu for Hawaii h. A specialized FA for the Gulf of Mexico shall be issued by the National Hurricane Center in Miami (1) Combines aviation and marine information in support of offshore helicopter operations (2) Addresses an area including the coastal plains and coastal waters from Appalachicola, Florida, to Brownsville, Texas, and the Gulf west of 85W and north of 27N Page 2-43
95 3. Issuance and Valid Times a. Prepared 3 times a day in the contiguous states and Alaska, 4 times a day in Hawaii b. Valid beginning the hour after the scheduled issue time c. The Gulf FA is prepared twice daily Sg 3, fr 8 Fig 14: Area Forecast (FA) 4. Preparation of the Area Forecast a. Only authorized contractions (see FAA Handbook ) should be used NOTE: Observed weather abbreviations (R, S, F, etc.), 2-letter state and Great Lake designators and location identifiers should be used. b. All times stated in whole hours (2 digits), using UCT and qualifiers such as BY, UNTIL, AFT, THRU, BYD c. Visibilities in statute miles, all other distances in nautical miles, speeds in knots d. Commas or colons in a sentence indicated by three dots (...) 5. Hazards/Flight Precautions section a. Covers 12-hour period beginning with one valid time b. Section depicts weather impacting the area or a negative report c. Section serves only as a flag alerting user that conditions are meeting, or are expected to meet, AIRMET, SIGMET, or convective SIGMET criteria NOTE: Detail needed for preflight or flight resides in the appropriate in-flight advisory. Page 2-44
96 som (start of message indicator) SFOH FA HAZARDS VALID UNTIL WA OR CA AND CSTL WTRS * FLT PRCTNS...MTN OBSCN...WA OR CA * TSTMS IMPLY PSBL SVR OR GRT TURBC SVR ICG LLWS AND IFR CONDS. NON MSL HGTS ARE DENOTED BY AGL OR CIG. eom (end of message indicator) SFOC FA SYNOPSIS AND VFR CLOUDS/WX SYNOPSIS VALID UNTIL CLDS/WX VALID UNTIL OTLK VALID * SYNOPSIS...WEAK CDFNT ALG CSTL SXNS MOVG TO CASCDS AND BCHG STNRY. WK HI PRES BLDG INTO CSTL SXNS BY 02Z. ALF...MOIST WLY FLOW WL CONT OVER WA OR AND GENLY WK SWLY FLOW OVER CA. * WA OR CASCDS WWD SEE AIRMET SIERRA FOR MTN OBSCN. WA NRN OR SCT-BKN BKN-OVC WDLY SCT RW-. 17Z-20Z BCHG 20 SCT-BKN 50 BKN WDLY SCT RW-. TOPS 180. OTLK...VFR. SRN OR...CLR. OTLK...VFR. * WA OR E OF CASCDS WA SCT 120 SCT. WRN SXNS WDLY SCT RW-. TOPS 180. OTLK...VFR. OR...CLR. OTLK...VFR. * CA SEE AIRMET SIERRA FOR MTN OBSCN. CSTL SXNS OF NRN CA BKN 25. AFT 21Z...CLR. OTLK...VFR. LAX BASIN...15 BKN 25. VSBYS 3-5FH. AFT 16Z...CLR. VSBYS LAX BASIN 3-5FH. OTLK...MVFT CIG F. RMNDR AREA...CLR. OTLK...VFR. * WA OR CA CSTL WTRS ALG CST SCT-BKN 30 OTHERWISE CLR. OTLK...MVFR CIG F. eom Figure 14: AREA FORECAST (FA) Page 2-45
97 d. Hazards section always has a Flight Precautions entry; if none expected, "NONE EXPT" shall be stated e. Every HAZARDS section will conclude with the statement "TSTMS IMPLY PSBL SVR OR GTR TURBC ICG LLWS AND IFR CONDS" f. The reference plane within the FA sections is mean sea level (MSL) unless otherwise noted NOTE: The statement "NON MSL HGTS DENOTED BY AGL OR CIG" shall be included in the hazards section. 6. Synopsis and VFR Clouds/Weather section a. Section contains an 18-hour synopsis, consisting of a 12-hour specific forecast, followed by a 6-hour categorical outlook giving a total forecast period of 18 hrs b. All or parts of the SYNOPSIS AND VFR CLOUDS/WEATHER section may be delayed if the forecaster determines that available information is inadequate to support a quality FA product c. The following specific items, if applicable, should by included for each 12-hour specific forecast in the SYNOPSIS AND VFR CLOUDS/ WEATHER section (1) Sky condition (cloud height, amount, and tops) if bases are at or below 18,000 ft MSL (2) Surface visibilities and associated obstructions when visibility is between 3 and 6 miles (if coverage is 3,000 square miles or greater) (3) Weather (precipitation, including thunderstorms, fog, haze, blowing dust, etc.), if it results in surface visibilities of 3 to 6 miles Page 2-46
98 (4) Thunderstorms, if expected to be more than isolated (5) Surface wind if sustained winds of 20 kts or more (a) Wind directions use 8-point compass (b) Gusts are reported if expected to be 10 kts over sustained speed 7. OUTLOOK - 6-hour categorical forecast to follow 12-hour specific clouds and weather forecasts a. As a minimum "IFR," "MVFR," or "VFR" b. If IFR or MVFR due to ceiling, use "CIG" c. If due to visibility, use standard weather and obstruction to visibility symbols d. VFR should stand alone except for wind (WND), thunderstorms (TRW), and precipitation (without intensities) LESSON NOTES For the following progress check, the turbulence forecast (answer) is located near the center of the area forecast. Page 2-47
99 PROGRESS CHECK Question Refer to the area forecast (Figure 14). Using the Area Forecast (FA), what is the altitude of the top of the clouds in Washington, Oregon, and the Cascades? ANSWER: 18,000 ft Sg 3, fr 9 Fig 15: Winds Aloft Forecast (FD) F. Winds Aloft Forecast (FD) Teletype report, based on observed (balloon) information transmitted twice a day a. Teletype identifier is "FD" b. The total forecast is usable for 15 hrs c. Broken into two segments with the forecast periods given at the beginning of each segment (1) Valid time indicates that these conditions should exist specifically at this time (2) "For use" times mean that these conditions should exist through this period as the average conditions 2. Wind and Temperature coding/decoding rules a. Wind normally given with a series of 4 digits (1) First 2 digits indicate direction wind is from (true) (2) Second 2 digits depict the wind speed in knots Page 2-48 b. Temperature follows wind information in degrees Celsius
100 FD WBC BASED ON 25000Z DATA VALID Z FOR USE 0600Z-1500Z. TEMPS NEG ABV FT XQP CAE ATL BHM JAN ZQP SHV DAL ABI ZPZ INK ELP TUS BLH Figure 15: WINDS ALOFT FORECAST (FD) Page 2-49
101 (1) Above or below 0 degrees indicated with a "+" or "-" (2) All temperatures above 24,000 ft MSL are below zero so the minus sign is dropped c. Exceptions (1) Variable winds indicated by "99" for direction (2) Forecast winds less than 5 kts indicated by "9900" and read as "light and variable" (3) If wind speeds exceed 100 kts, 100 is subtracted from the wind speed and 50 is added to the direction; e.g., a wind from 230 at 145 kts would be encoded as 7345 (4) Wind speeds in excess of 200 kts would be encoded at 199 kts; e.g., 7399 would be 230 degrees at 199 kts 3. Temperature decoding/encoding rules a. Temperature and wind are sometimes omitted from the forecast (1) Wind information is never forecast for altitudes within 1,500 ft of the surface (2) Temperature information is never forecast at any altitude within 2,500 ft of the surface (3) Temperature information is never forecast for the 3,000 ft level 4. Interpolation--Often the wind information will not be forecast for the altitude which the pilot wishes to file. In this case, they must interpolate for the desired information Page 2-50
102 PROGRESS CHECK Question For what period is the winds aloft forecast in Figure 15 valid? ANSWER: 0600Z to 1500Z. Question Appearing on a winds aloft forecast, what does the code mean? ANSWER: Wind is from 150 degrees at 69 kts; temperature is -12 degrees Celsius. G. National Weather Service (NWS) Severe Weather Reports and Forecasts NOTE: Flight is not specifically prohibited in the areas where convective outlooks, AIRMETs, SIGMETs, and convective SIGMETs are active, but common sense and experience should help determine your flight decision making. However, Severe Weather Watch bulletins (WW) and CNATRA Weather Warnings (CAWW) do prohibit flight in the areas covered. 1. Convective Outlooks (AC) a. Issued by the National Severe Storm Forecast Center (NSSFC) in Kansas City b. Outlines potential general thunderstorm activity and areas where thunderstorm intensity may approach severe limits c. Disseminated 3 times daily (2 times daily between September 1 and January 31) hr forecast period Page 2-51
103 d. Format - Narrative presents affected region and rationale of the forecast NOTE: ACs can alert a pilot several hours in advance of possible severe or widespread convective activity. Sg 3, fr 10 Severe Weather Watch Bulletin (WW) 2. Severe Weather Watch bulletin (WW) a. Issued by the NSSFC in Kansas City b. Defines areas of possible severe thunderstorms and tornadoes; describes level of intensity, hail size, wind speeds, CB tops, estimated cell movement, cause of severe weather, and updates convective outlooks (AC) c. Disseminated as needed d. Format - Report contains the type and location of severe weather expected e. Hazards (1) Thunderstorms with surface winds of 50 kts or more (2) Thunderstorms containing hail 3/4-inch diameter or greater at surface (3) Tornadoes f. Flight restrictions as stated in OPNAVINST (1) Navy pilots will not file into or fly through WW areas (2) Exceptions to OPNAVINST severe weather restrictions (a) Operational necessity Page 2-52
104 (b) Research/weather reconnaissance (c) Emergencies (d) Storm development has not progressed as forecast and when flight i) Remains in VFR conditions, or ii) If in IFR conditions, aircraft has operable weather radar (e) Aircraft capable of flying above existing or developing severe storms 3. CNATRA Weather Warning (CAWW) a. Issued by forecasters at the Chief of Naval Air Training (CNATRA) Sg 3, fr 11 CNATRA Weather Warning (CAWW) b. Defines areas of hazardous weather pertinent to all Naval Air Training Command activities c. Disseminated as needed d. Format - Report lists hazards and affected areas e. Hazards (1) Severe thunderstorms (wind gusts 50 kts or more or hail 3/4" diameter or larger) (2) Embedded thunderstorms (3) Line of thunderstorms (4) Severe or extreme turbulence (5) Severe icing (6) Widespread sandstorms or dust storms limiting visibility to 2 sm or less Page 2-53
105 f. Flight restrictions (1) Training activities suspended in CAWW area (2) Exceptions to CNATRA severe weather restrictions (same as OPNAVINST ) (a) Operational necessity (b) Research/weather reconnaissance (c) Emergencies (d) Storm development has not progressed as forecast and when flight i) Remains in VFR conditions, or ii) If in IFR conditions, aircraft has operable weather radar (e) Aircraft capable of flying above existing or developing severe storms H. National Weather Service (NWS) Aviation In-flight Weather Advisories , , Provides information for enroute aircraft 2. Designed to serve both civilian and military pilots 3. Types a. Significant Meteorological (SIGMET) Advisories (1) Convective SIGMETs (WST) (2) Nonconvective SIGMETs (WS) b. Airman's Meteorological (AIRMET) Advisories (WA) Page 2-54
106 4. Latest revisions to program designed to meet overlapping requirements of large versus small aircraft, aircraft operating under visual flight rules (VFR) and instrument flight rules (IFR), small aircraft operating higher, and larger aircraft sometimes operating lower 5. Responsibility for Issuance - The National Aviation Weather Advisory Unit (NAWAU) in Kansas City, Missouri, has the responsibility for issuing WAs, WSTs, and WSs for the conterminous United States a. Designated forecaster(s) maintain watch on weather developments using weather radar, surface observations, PIREPs, and satellite image information b. Additional information used consists of information from the National Meteorological Center (NMC), products from the NMC National Severe Storms Forecast Center, Hurricane advisories, and forecasts from Weather Service Field Offices (WSFO) 6. Standardizations - The following standardizations shall apply to all In-Flight Advisories a. All heights or altitudes shall be stated with reference to mean sea level (MSL), except in the case of low ceilings which shall be referenced to "above ground level" and indicated by "CIGS," e.g., CIGS BLO 10 b. Domestic In-Flight Advisories shall describe designated weather conditions up to and including 45,000 ft (150 millibars) c. Any abbreviations or contractions used in the advisories shall conform with FAA Contractions Handbook d. Weather and obstructions to visibility shall be indicated by using the weather abbreviations used for METARs (see FLIP GP Chapter 8) Page 2-55
107 Sg 3, fr 12 Fig 16: Convective SIGMET (WST) 7. Convective SIGMETs (WST) at 55 minutes past the hour (H+55) a. Issued hourly (1) As thunderstorms are likely to be accompanied by severe or greater turbulence, severe icing, and low-level wind shear, these conditions shall not be specified in the advisory (2) "NONE" shall be used as the text if appropriate (3) Valid for up to 2 hrs or until superseded by the next hourly issuance (4) Special WSTs as required (5) Three bulletins issued for eastern (E), central (C), and western (W) regions (a) Boundaries at 87 and 107 degrees west b. WSTs shall be issued when either of the following occurs and/or is forecast to occur for more than 30 minutes of the valid period, regardless of the size of the area affected (i.e., including isolated) (1) Severe thunderstorms (a) May include specific information on tornadoes and/or hail 3/4-inch or greater and/or wind gusts of 50 kts or greater (2) Embedded thunderstorms (a) Occurring within and obscured by haze, stratiform clouds, or precipitation from stratiform clouds Page 2-56
108 MKCC WST CONVECTIVE SIGMET 20C VALID UNTIL 2055Z ND SD FROM 90W MOT-GFK-ABR-90W MOT INTSFYG AREA SVR TSTMS MOVG FROM TOPS ABV 450. WIND GUSTS TO 60 KT RPRTD. TORNADOES...HAIL TO 2 IN...WIND GUSTS TO 65 KT PSBL ND PTN. CONVECTIVE SIGMET 21C VALID UNTIL 2055Z TX 50SE CDS ISOLD SVR TSTM D30 MOVG FROM TOP ABV 450. HAIL TO 2 IN...WIND GUSTS TO 65 KT PSBL. OUTLOOK VALID AREA 1...FROM INL-MSP-ABR-MOT-INL SVR TSTMS CONT TO DVLP IN AREA OVR ND. AREA IS XPCD TO RMN SVR AND SPRD INTO MN AS STG PVA MOVS OVR VERY UNSTBL AMS CHARACTERIZED BY -12 LIFTED INDEX. AREA 2...FROM CDS-DFW-LRD-ELP-CDS ISOLD STG TSTMS WILL DVLP OVR SWRN AND WRN TX THRUT FCST PD AS UPR LVL TROF MOVS NEWD OVR VERY UNSTBL AMS. LIFTED INDEX RMNS IN THE -8 TO -10 RANGE. DRY LINE WILL BE THE FOCUS OF TSTM DVLPMT. Figure 16: CONVECTIVE SIGMET (WST) Page 2-57
109 (b) Intended to alert pilots that avoidance by visual or radar detection could be difficult or impossible (3) A line of thunderstorms (a) At least 60 miles long with thunderstorms affecting at least 40% of the length (4) An area of active thunderstorms affecting at least 3,000 square miles (a) Thunderstorms having a reflectivity intensity (VIP LVL) of 4 or greater and/or having significant satellite signature affecting at least 40% of the area outlined 8. Special Convective SIGMETs - A WST special shall be issued at any time when either of the following criteria are met and/or forecast to be met for more than 30 minutes of the scheduled WST's valid period a. Tornado, hail 3/4-inch or greater, or wind gusts to 50 kts or greater reported to the NAWAU forecaster or indicated when previous WST did not mention severe thunderstorms b. Indications of rapidly changing conditions if in the forecaster's judgment, not sufficiently described in existing SIGMET Sg 3, fr 13 Fig 17: SIGMET (WS) 9. Nonconvective SIGMETs (WS) a. Not issued on a regular scheduled basis b. Issued whenever any of the following weather phenomena occur or are forecast to occur and affect an area of at least 3,000 square miles Page 2-58
110 DFWP UWS SIGMET PAPA 1 VALID UNTIL AR LA MS FROM MEM TO 30N MEI TO BTR TO MLU TO MEM MDT TO OCNL SVR ICG ABV FRZLVL XPCD. FRZLVL 80 E TO 120 W. CONDS CONTG BYD 2100Z. SFOX WS SIGMET XRAY 2 VALID UNTIL OR WA FROM SEA TO PDX TO EUG TO ONP TO HQM TO SEA MDT TO OCNL SVR TURBC BTWN 280 AND 350 XPCD DUE TO WINDSHEAR ASSOCD WITH JTSTR. CONDS BGNG AFT 0200Z CONTG BYD 0530Z AND SPRDG OVR CNTRL ID BY 0400Z. Example of a multi-area issuance SIGMET: CHIO WS SIGMET OSCAR 2 VALID UNTIL KS FROM PWE TO OSW TO 40W LBL TO PWE OCNL SVR TURBC BLO 60. CONDS DUE TO STG NWLY FLOW BHD CDFNT AND XPCD TO CONT BYD 2100Z. DFWO WS SIGMET OSCAR 2 VALID UNTIL OK FROM OSW TO ADM TO 40W LBL TO OSW OCNL SVR TURBC BLO 60. CONDS DUE TO STG NWLY FLOW BHD CDFNT AND XPCD TO CONT BYD 2100Z. Example of a multi-area issuance SIGMET cancelled in one area and continued in another: CHIO WS CANCEL SIGMET OSCAR 2. CONDS HAVE DMSHD. DFWO WS SIGMET OSCAR 3 VALID UNTIL FROM OSW TO TXK TO SPS TO GAG TO OSW OCNL SVR TURBC BLO 60. CONDS XPCD TO GRDLY DMSH AFT 00Z. Figure 17: SIGMET (WS) Page 2-59
111 (1) Severe or extreme turbulence or clear air turbulence (CAT) not associated with thunderstorms (see Turbulence Reporting Tables in FLIP Flight Information Handbook (FIH) Section C) (2) Severe icing not associated with thunderstorms (see Icing Tables in FLIP FIH Section C) (3) Widespread dust storms, sandstorms, or volcanic ash lowering surface and/or in-flight visibilities to less than 3 miles (4) Volcanic Eruption Sg 3, fr 14 Fig 18: AIRMET (WA) 10. AIRMETs (WA) a. Issued on a scheduled basis every 6 hrs (beginning at 0200 UTC) NOTE: Scheduled issuance times are 15 minutes prior to valid time. b. Unscheduled amendments and corrections issued as necessary and are valid beginning at the time of issuance c. Issued by NAWAU using the Area Forecast (FA) designators (SFO, SLC, CHI, DFW, BOS, MIA) to denote the area covered, not the issuing office d. AIRMET bulletins shall contain details of conditions within their designated geographical areas when one or more of the following conditions occur or are expected to occur, and affect an area of at least 3,000 square miles: (1) Moderate icing (2) Moderate turbulence Page 2-60 (3) Sustained surface wind of 30 kts or more
112 ZCZC MKCWA4Z ALL WAUS1 KDFW DFWZ WA AIRMET ZULU FOR ICG AND FRZLVL VALID UNTIL * NO SGFNT ICG XPCD. * FRZLVL E OF DYR-MSL-ATL LN SLPG TO OVR RMNDR. **** NNNN ZCZC MKCWA4T ALL WAUS1 KDFW DFWT WA AIRMET TANGO FOR TURBC...STG SFC WNDS AND LLWS VALID UNTIL * AIRMET TURBC...OK TX FROM OSW TO LRD TO PEQ TO 40W LBL TO OSW OCNL MDT TURBC BLO 60 DUE TO STG AND GUSTY LOW LVL WINDS. CONDS CONTG BYD 2000Z. * AIRMET STG SFC WINDS...TX FROM CDS TO DFW TO SAT TO MAF TO CDS AFT 18Z...SUSTAINED SFC WINDS GTR THAN 30 KTS XPCD. CONDS CONTG BYD 20000Z. * LLWS BLO 20 AGL DUE TO STG WINDS DMSHG BY 16-18Z. * OTLK VALID Z...OK TX AR MDT TURBC BLO 60 CONTG OVER OK/TX AND SPRDG INTO AR BY Z CONTG ENTR AREA BYD 0200Z. **** NNNN ZCZC MKCWA5S ALL WAUS1 KSLC SLCS WA AIRMET SIERRA FOR IFR AND MTN OBSCN VALID UNTIL * AIRMET IFR...WY CO FROM 70ENE GCC TO GLD TO FMN TO 60N JAC TO 70ENE GCC OCNL CIGS BLO 10 AND OR FSBYS BLO 3 IN PCPN AND F. CONDS CONTG BYD 2000Z AND GRDLY DMSHG. * AIRMET MTN OBSCN...MT WY CO FROM YXC TO YXH TO AKO TO TBE TO FMN TO LKT TO YXC MTNS OCNL OBSCD IN CLDS/PCPN. CONDS CONTG BYD 2000Z. * OTLK VALID Z...MTN OBSCN MT WY CO CONDS CONTG BYD 0200Z IN WY/CO BUT ENDING IN MT BTWN Z. **** NNNN Figure 18: AIRMET (WA) Page 2-61
113 (4) Ceilings less than 1,000 ft and/or visibility less than 3 miles affecting over 50% of an area at any one time (5) Extensive mountain obscuration precluding VFR flight e. AIRMET message texts (1) Text portion of each AIRMET message within a bulletin shall contain the available details about the phenomenon conditions which have met or are expected to meet AIRMET or significance criteria (2) Details shall include whether conditions are occurring or forecast to occur, their causes, their vertical extent, any changes expected during the AIRMET valid period, and remarks concerning the time of onset and/or cessation of conditions Sg 3, fr 15 Fig 19: Military Weather Advisory (MWA) 11. Military Weather Advisory (MWA) a. Prepared and issued by the Air Force Global Weather Center (AFGWC) b. Transmitted twice a day with a 12-hour Military Weather Advisory, which is a forecast of possible severe weather c. Two versions produced (1) Teletype (2) Facsimile d. The forecast is coded as follows: (1) Red - tornadoes, waterspouts, or funnel clouds Page 2-62
114 MWA NR 15C VALID Z TO Z PARA A GREEN VALID ENTIRE PERIOD MAX TOPS 450 SCATTERED TSTMS F FF F FF F FF FF FF F F F F F F F F C C CCC C C CCC C CC C C EEEEEEEE D D DD F D DDD EE F B F D EEEEEE E EEE E B B B B B B D D B BB B D D D B D D B E B B B B BB D BB B E EEE B D D D DD C E B A AA AA BB BBB C B CC C C C E C E E CCC CCCC BB A B BBBB B C CCC A C A A A A C C A C C A AA AAAAA C C C C C C C AAA C C C C C C C C C C C C C C C C C C C CCC C CC C C C C C C FF FFF FF F F F F FF F F F F F FF F F FF PARA C ORANGE VALID ENTIRE PERIOD MAX TOPS 420 ISOLATED TSTMS PARA E HATCHED PURPLE VALID ENTIRE PERIOD 4-6 INCHES LCLLY 12 INCHES PARA B ORANGE VALID ENTIRE PERIOD MAX TOPS 320 FEW TSTMS HATCHED PURPLE VALID ENTIRE PERIOD 2-4 INCHESLCLLY 6 INCHES PARA D BLACK VALID 1600Z TO 2300Z GUSTS TO 40 KNOTS HATCHED PURPLE VALID ENTIRE PERIOD 2-4 INCHES PARA F HATCHED PURPLE VALID ENTIRE PERIOD 2-4 INCHES LCLLY 6 INCHES Figure 19: MILITARY WEATHER ADVISORY (MWA) Page 2-63
115 (2) Blue - severe thunderstorms (maximum wind gusts of 50 kts or greater and/or hail, if any, 3/4-inch or greater in diameter) and locally damaging windstorms (3) Green - moderate thunderstorms (maximum wind gusts of 35 kts or greater, but less than 50 kts; and/or hail, if any, 1/2-inch or greater in diameter, but less than 3/4-inch in diameter) (4) Orange - thunderstorms (maximum wind gusts less than 35 kts and/or hail, if any, less than 1/2-inch in diameter) (5) Black - strong surface winds (35 kts or more and not associated with thunderstorms) (6) Purple - heavy rain (2 inches or more in 12 hrs or less) (7) Hatched purple - heavy snow (2 or more inches in 12 hrs or less) (8) Brown - freezing precipitation e. Other abbreviations (1) MIC (maximum instantaneous coverage) - the percent of the area which will be covered by thunderstorm cells at time of maximum activity (2) TAA (total area affected) - the percent of the area which will experience one or more thunderstorms during the applicable valid period (3) EP (entire period) - used if the phenomena are expected for the entire period instead of a particular time period Page 2-64
116 f. Maximum thunderstorm tops (1) The percentages of MIC and TAA will be entered in the thunderstorm areas as MIC/TAA (such as 3/25) (2) The advisory areas will be enclosed by solid lines with a letter designator within the area (3) Forecast areas depict the worst conditions expected during period noted g. Teletype bulletin - This bulletin contains information identical to the facsimile product NOTE: It also serves to amend and correct both the facsimile and teletype product. h. Using the chart (1) Use the contents of this advisory strictly as a preflight aid to help plan your route of flight to avoid possible severe weather (2) Compare the MWA forecast with the existing or latest weather in the available weather charts and teletype reports Page 2-65
117 PROGRESS CHECK Question , What are the exceptions to the OPNAVINST restriction prohibiting flight in WW and CAWW areas? ANSWER: 1. Operational necessity 2. Research/weather reconnaissance 3. Emergencies 4. Storm development has not progressed as forecast, and a. when flight remains in VFR conditions, or b. operable weather radar is installed in the aircraft 5. The aircraft is capable of flying above the hazard Question , Aside from the exceptions laid forth in OPNAVINST , what areas are you prohibited from filing into or flying through? ANSWER: Severe weather watch (WW) and CNATRA weather watch (CAWW) areas. Sg 4, fr 3 Lesson Organization IV. Flight weather briefing (DD-175-1) A. Responsibility for brief (OPNAV series) 1. Ultimate responsibility for reviewing and becoming familiar with weather conditions for the area in which the flight is contemplated rests with the pilot-in-command 2. Where Naval Oceanographic Services are available, weather briefings shall be conducted by a qualified meteorological forecaster 3. Briefings can be conducted in person, via telephone, autograph, or weather vision Page 2-66
118 B. Preflight Weather Brief 1. VFR flights utilizing a DD-175 must either have a completed DD (weather briefing form) certifying that the flight can be conducted under VFR conditions, or the forecaster can use a special VFR stamp on the DD-175 Sg 4, fr 4 Fig 20: DD NOTE: The brief can be conducted no more than 2 hrs prior to the ETD with a void time no more than 30 minutes after the ETD. 2. All flights to be conducted in IMC, or on an IFR flight plan, will have a flight weather briefing and a DD will be completed a. The forecaster will complete the form if the briefing is in person or via autograph b. It is the pilot's responsibility to complete the form for telephone or weather vision briefings C. Requesting the Weather Brief 1. Prebrief - Pilot should avail himself of any and all information available prior to requesting the formal brief a. Pilots planning an IFR flight are primarily interested in ceiling and visibility conditions at point of departure, destination, and possible alternates, as well as enroute weather pertaining to icing, turbulence and winds aloft b. VFR flight primarily concerned with ceiling and visibility so he can see and be seen by other aircraft 2. Provide forecaster with completed DD If brief is to be conducted via telephone, be prepared to provide the briefer: a. Name of person calling Page 2-67
119 DATE SFC WIND M T ACFT TYPE/NO CLIMB WINDS REMARKS/TAKEOFF ALTN FCST FLIGHT WEATHER BRIEFING PART I - MISSION/TAKEOFF DATA DEP PT/ETD RUNWAY TEMP DEWPOINT TEMP DEV PRESSURE ALT DENSITY ALT Z o F/C o F/C o C FT LOCAL WEA WRNG/MET WATCH ADV RCR FT FLT LEVEL FLT LEVEL WINDS/TEMP PART II - ENROUTE DATA CLOUDS AT FLT LEVEL MINIMUM VISIBILITY AT FLT LEVEL OUTSIDE CLOUDS MILES DUE TO YES NO IN AND OUT SMOKE DUST HAZE FOG PRECIPITATION NO OBSTRUCTION MINIMUM CEILING LOCATION MAXIMUM CLOUD TOPS LOCATION MINIMUM FREEZING LEVEL LOCATION FT AGL FT MSL FT MSL THUNDERSTORMS TURBULENCE ICING PRECIPITATION MWA/WW NO. NONE ISOLATED 1-2% FEW 3-15% SCATTERED 16-45% NUMEROUS - MORE THAN 45% HAIL, SVR., TURB., SEVERE, ICING, PRECIPITATION AND LIGHTNING EXPECTED IN AND NEAR TSTMS. LOCATION CAT ADVISORY AREA LINE NONE IN CLEAR IN CLOUD LIGHT MOD SVR EXTREME LEVELS LOCATION Z NONE TRACE LIGHT MOD SVR LEVELS LOCATION RIME MIXED CLEAR NONE DRIZ RAIN SNOW SLEET LT MOD HVY SHWRS FRZG LOCATION PART III - TERMINAL FORECASTS AIRDROME CLOUD LAYERS VSBY/WEA SFC WIND ALTIMETER DEST/ALTN INS DEST/ALTN INS DEST/ALTN INS DEST/ALTN INS DEST/ALTN INS DEST/ALTN INS DEST/ALTN INS DEST/ALTN INS PART IV - COMMENTS/REMARKS BRIEFED ON LATEST RCR FOR DESTN AND ALTN YES NOT AVAILABLE REQUEST PIREP AT VALID TIME Z TO Z TO Z TO Z TO Z TO Z TO Z TO Z TO Z Z Z Z Z Z Z Z PART V - BRIEFING RECORD WEA BRIEFED FLIMSY BRIEFING NO. FORECASTER'S SIGNATURE OR INITIALS Z VOID TIME EXTENDED TO WEA REBRIEFED AT FORECASTER'S INIT NAME OF PERSON RECEIVING BRIEFING Z Z Z DD Form 175-1, FEB 87 Figure 20: THE DD Page 2-68
120 b. Aircraft identification (call sign), and type of aircraft c. Departure point, destination and proposed alternate d. Type of flight plan (IFR/VFR) and proposed altitude e. ETD, ETE, and ETE to alternate f. Intended route g. Enroute stops, or delay en route, if applicable, with appropriate ETA and ETD of enroute delay 4. Some airfields do not provide 24-hour forecaster service NOTE: Most civilian airfields do not have NWS briefers. Military pilots can either call the nearest military facility or a tie-in FSS. NOTE: The FLIP Flight Information Handbook provides a list of tie-in military weather stations with autovon and/or commercial (call collect) telephone numbers. D. Content of the Weather Briefing - The following list of key items should be checked: NOTE: Aircrew should not be hesitant to ask the person giving the briefing about any particular item. 1. Weather at Takeoff: a. Bases and tops of cloud layers b. Visibility and obstructions to vision c. Type and intensity of precipitation d. Freezing level Page 2-69
121 e. Temperature and climb winds up to flight altitude f. Runway temperature, wind, and pressure/ density altitude g. Condition of runway (if affected by weather) 2. Weather En Route a. Bases, tops, types, and amount of each cloud layer b. Visibility at the surface and aloft c. Type, location, intensity, and directions/speed of fronts d. Freezing level e. Areas of severe weather (thunderstorms, icing, turbulence) f. Areas of good weather 3. Weather at Destination and Alternate a. Bases, tops, types, and amount of each cloud layer b. Visibility and obstructions to vision c. Type and intensity of precipitation, and icing d. Freezing level e. Turbulence f. Surface wind direction and velocity g. Condition of runways (if affected by weather) Page 2-70
122 4. If no forecaster is available at the departure point, but current charts and teletype are displayed, the aircrew member should: a. Look around and see what information is available b. Read and plan. Look over the charts (1) Look for weather hazards and low ceilings -- observed and forecast (2) Read your destination current and forecast weather (3) Determine if an alternate is required and, if so, where would be suitable (4) Check the wind charts for your planned route (5) Plan the flight NOTE: You should be weatherwise enough to select your route, destination, and alternate and figure your ETD, ETEs, and ETAs to alternate(s). c. Call the nearest weather facility NOTE: Provide the forecaster with the previously mentioned information and have a blank DD at the ready to be completed during the brief. d. Listen and ask! (1) Listen to what the forecaster has to say (2) Ask questions during the brief (3) Make sure you have "the big picture" Page 2-71
123 Sg 4, fr 5 Fig 21: Weather Minima Criteria Flow Chart E. DD Requirement and Description In accordance with OPNAV , DD Form Flight Briefing shall be completed for all flights to be conducted in instrument flight conditions 2. This briefing may be accomplished in person by a meteorological forecaster, when available, or by autographic, telephonic, or weather vision systems when no forecasters are immediately available Sg 4, fr 6 DD The weather briefing form, DD-175-1, is divided into five separate parts: a. Mission/takeoff data b. Enroute data c. Terminal forecast d. Comments/remarks e. Briefing record NOTE: Parts are divided by a solid triangle in the margin. 4. The DD is not completed in the same order as it is shown on the form a. Flight level not chosen until information on thunderstorms, turbulence, icing, and winds has been investigated b. Determinations concerning icing require first investigating cloud layers, freezing levels, and RADAT data Page 2-72
124 WEATHER MINIMA CRITERIA FLOW CHART AIRCRAFT: # PILOTS, # RADIOS, NAV EQUIP, CATEGORY DESTINATION APPROACHES: PRECISION, NONPRECISION BELOW PUB MINS Wx at DESTINATION ETA + 1 HR 3,000/3 or BETTER ALTERNATE WEATHER 3,000/3 ETA + 1 HR ALTERNATE WEATHER NO ALTERNATE REQUIRED PUB MINS UP TO BUT NOT INCLUDING 3,000/3 NONPRECISION ALTERNATE APPROACHES PRECISION ALTERNATE WEATHER PUB MINS + 300/1 ETA + 1 HR ALTERNATE WEATHER PUB MINS + 200/1/2 ETA + 1 HR MPSR SP MPSR SP ASR/PAR APP. MINS MAY NOT BE USED FOR ALTERNATE SELECTION ASR/PAR APP. MINS MAY NOT BE USED FOR ALTERNATE SELECTION MPSR - Multi-Piloted, Single Radio aircraft SP - Single-Piloted aircraft Figure 21: WEATHER MINIMA CRITERIA FLOW CHART Page 2-73
125 Sg 4, fr 7 Fig 22: Data Sources Sg 4, fr 8 Fig 23: Mission/ Takeoff Section (Part I) F. Explanation of Data Sources/Uses 1. Mission/Takeoff section (Part I) a. First three boxes specify date (local), aircraft type(s) and bureau number(s), departure point and ETD b. Remaining boxes specify forecast conditions for takeoff and climb out NOTE: Meteorologist normally will not fill in this information, unless the pilot indicates he needs or desires this information. c. Local Weather Warnings such as WWs, CAWWs, thunderstorm conditions, or MET Watch advisories (MWAs, AIRMETs, SIGMETs, Convective SIGMETs) are always entered Sg 4, fr 9 Fig 24: Enroute Data Section (Part II) 2. Enroute data (Part II) a. Before checking any other information, check first for any valid Aviation Severe Weather Watch Bulletins (WWs) or any Met Watch Advisories (MWAs), because severe weather may cause a change in route b. Information entered is expected weather conditions within a minimum of 25 nm of the intended route, 5,000 ft above or below the intended flight altitude, and destination let down conditions NOTE: 25 nm and 5,000 ft are guidelines only. c. Minimum ceilings - usually the first block marked (1) First check the Weather Depiction Chart for a pictorial presentation, then cross-check observed information by referring the Area Forecasts (FA) Page 2-74
126 DATA SOURCES/USES REPORT FACSIMILE TELETYPE TELETYPE IDENTIFIER OBSERVED FORECAST USE IN FLIGHT PLANNING SURFACE ANALYSIS CHART X X LOCATIONS OF PRESSURE SYSTEMS & FRONTS SEVERE WEATHER WATCH BULLETIN X WW X TORNADOES & SEVERE THUNDERSTORMS (NO-FLY AREAS) RADAR SUMMARY CHART X X THUNDERSTORMS & MAXIMUM CLOUD TOPS WEATHER DEPICTION CHART X X IFR/VFR AREAS & MINIMUM CEILINGS EN ROUTE AREA FORECAST X FA X PREFLIGHT PLANNING FOR EN ROUTE PORTION OF FLIGHT IN-FLIGHT WEATHER ADVISORY X WA WS/WST X EN ROUTE PLANNING FOR HAZARDOUS WEATHER PILOT REPORT X UUA UA X SUPPLEMENT GROUND STATIONS' WEATHER OBSERVATIONS WINDS ALOFT FORECAST X FD X WINDS & TEMPERATURES INSIDE CONTINENTAL U.S. WINDS ALOFT PROGNOSTIC CHART X X WINDS & TEMPERATURES INSIDE CONTINENTAL U.S. CONSTANT PRESSURE CHART X X WIND, TEMPERATURE, DEW POINT, ICING, PRESSURE METAR X METAR X DESTINATION AND ALTERNATE OBSERVED WEATHER TERMINAL AERODROME FORECAST (TAF) X TAF X DESTINATION AND ALTERNATE FORECAST WEATHER LOW LEVEL SIGNIFICANT WEATHER PROGNOSTIC CHART X X FORECAST OF PRESSURE SYSTEMS, FRONTS, SIGNIFICANT WEATHER, TURBULENCE, FREEZING LEVELS, & IFR/MVFR AREAS Figure 22: DATA SOURCES Page 2-75
127 FLIGHT WEATHER BRIEFING DATE 31 Oct XM 1210 T SFC WIND REMARKS/TAKEOFF ALTN FCST ACFT TYPE/NO (2) A CLIMB WINDS 2520 PART I - MISSION/TAKEOFF DATA DEP PT/ETD RUNWAY TEMP DEWPOINT TEMP DEV PRESSURE ALT DENSITY ALT Z o F/C o F/C o C FT NPA/ x 68 LOCAL WEA WRNG/MET WATCH ADV x TSTM COND I TIL 18Z ISOL CBs LOCATED NW-N OF NPA, MOVG 5 KT RCR FT MISSION/TAKEOFF DATA ENTRY DATE AFCT TYPE/NO DEP PT/ETD RUNWAY TEMP DEW POINT TEMP DEV PRESSURE ALT DENSITY ALT SFC WIND CLIMB WINDS LOCAL WEA WRNG/MET WATCH ADV RCR REMARKS/TAKEOFF ALTN FCST SOURCE DD-175 DD-175 DD-175 Forecaster and current conditions Winds Aloft Charts and Teletype Winds Aloft Forecasts (FD), AIRMETs (WA) AND SIGMETs (WS), AND Weather Warnings (WW) & (CAWW) Terminal Aerodrome Forecasts Figure 23: MISSION/TAKEOFF SECTION (PART I) Page 2-76
128 FLT LEVEL CLOUDS AT FLT LEVEL X NBE NZY X FLT LEVEL WINDS/TEMP 3120/ /-55 ELSW YES NO IN AND OUT PART II - ENROUTE DATA LIT; 2235/-25 ABI; 2565/-55 MINIMUM VISIBILITY AT FLT LEVEL OUTSIDE CLOUDS SMOKE DUST HAZE MINIMUM CEILING LOCATION MAXIMUM CLOUD TOPS 004 FT AGL LIT 430 FT MSL TUL;2450/-25 INK;3040/-55 OK,TX FOG X 7 NBE NKX PRECIPITATION MILES DUE TO XCPT1/2 NO OBSTRUCTION LOCATION MINIMUM FREEZING LEVEL 120 FT MSL TUL NBE LOCATION THUNDERSTORMS TURBULENCE ICING PRECIPITATION MWA/WW NO. 31C/WW*136 CAT ADVISORY Z NONE NONE AREA LINE NONE IN CLEAR IN CLOUD X X X ISOLATED 1-2% FEW 3-15% SCATTERED 16-45% NUMEROUS - MORE THAN 45% HAIL, SVR., TURB., SEVERE, ICING, PRECIPITATION AND LIGHTNING EXPECTED IN AND NEAR TSTMS. LOCATION X X ISOL - LA & AR LIGHT MOD SVR EXTREME LEVELS LOCATION X SFC X X SCTD - OK & TX TUL NBE TRACE LIGHT MOD SVR LEVELS LOCATION RIME MIXED CLEAR X = NPA - NBE X = NBE/TIK NONE LT MOD HVY SHWRS FRZG LOCATION DRIZ RAIN SNOW SLEET X X X X X = NPA LIT X = LIT NBE ENROUTE DATA ENTRY FLT LEVEL FLT LEVEL WINDS/TEMP CLOUDS AT FLT LEVEL MINIMUM VISIBILITY AT FLT LEVEL OUTSIDE CLOUDS MINIMUM CEILING/LOCATION MAXIMUM CLOUD TOPS/LOCATION MINIMUM FREEZING LVL/LOCATION THUNDERSTORMS TURBULENCE ICING PRECIPITATION SOURCE DD-175 Winds Aloft Forecasts (FT) High Level Significant Weather Prognostic Chart High Level Significant Weather Prognostic Chart Surface Weather Depiction Chart Radar Summary Chart "Icing Section" of the Area Forecasts (FA) and Freezing Level Chart Radar Summary Chart and Area Forecast (FA) High Level Significant Weather Prognostic Chart, PIREPs (UA), and Inflight Weather Advisories (WA/WS) "Icing Section" of the Area Forecasts (FA) and the Constant Pressure Chart From most of the charts except the Winds Aloft Charts and Winds Aloft Forecast (FD) Figure 24: ENROUTE DATA SECTION (PART II) Page 2-77
129 (2) Always check for in-flight advisories (AIRMETs and SIGMETs) anytime you check the area forecasts d. Maximum Cloud Tops - Significant cloud tops (excluding thunderstorms) along the route and their location (1) Refer to the Radar Summary Chart for observed data and Area Forecasts for forecast information (2) Check In-flight Weather Advisories for updates to the FA, and PIREPs if available e. Thunderstorms - While checking for thunderstorms, also look for maximum cloud tops associated with them (1) Check Radar Summary Chart for a pictorial view of thunderstorm and precipitation location, cross-checked with Area Forecasts and Convective SIGMETs for forecast conditions (2) On the "MWA/WW No." line, list any current WW, MWA, or Convective SIGMET that applies (3) Amplify these in the remarks section (4) If more than one area of thunderstorms is applicable, they should be indicated f. Precipitation - Area Forecasts and Weather Depiction Charts should provide the required information; however, any of the weather products with the exception of Winds Aloft and Constant Pressure Charts can provide useful information g. Turbulence - Since turbulence is found in all thunderstorms, this section deals with turbulence not associated with thunderstorms Page 2-78
130 (1) The Area Forecast is a good source of forecast teletype information supplemented by SIGMETs and AIRMETs (2) Low-Level Significant Weather Prognostic Chart is a good facsimile source (3) PIREPs are an excellent source of observed information (4) Any CAT advisory DTG should be entered h. Minimum Freezing Level - Numerous sources: (1) Winds Aloft Forecast (2) Low-Level Significant Weather Prognosis Chart (3) Winds Aloft Prognosis Chart (4) Constant Pressure Charts (5) RADAT reports attached to the Aviation Weather Hourly Reports i. Icing - From the nonconvective SIGMET reports, with supporting information from the Constant Pressure Charts NOTE: Look for shaded station models, which indicate a temperature/dew point spread of 5 degrees or less. If temperatures are in the icing range, supercooled moisture is probable. NOTE: Another good source would be PIREPs, if available. j. Selecting Flight Level - Analyzing the information you have determined up to this point, you now have information on: (1) Minimum ceilings Page 2-79
131 (2) Maximum cloud tops (3) Thunderstorms (4) Turbulence (5) Minimum freezing level (6) Icing (7) Precipitation NOTE: Considering all the hazards associated with the forgoing conditions, you are now ready to select an altitude or altitudes, as appropriate, which EXCLUDE as many of these hazards as possible. k. Flight Level Winds/Temperatures - Considering only the altitudes determined to be free of the most hazardous weather, and considering the FAA cruising altitudes for direction of flight, select an altitude which provides the most favorable winds NOTE: Wind sources include the Winds Aloft Forecast (FD), the Winds Aloft Prognostic Charts, and the Constant Pressure Charts (especially for possible jet streams along your path). The Constant Pressure Charts provide information for overwater flights. If requested far enough in advance, OPARS is an excellent source of information. All these charts will also provide temperature information at altitude. NOTE: Enter as many increments of winds and temperature as are necessary to accurately describe the enroute wind and temperature conditions. Computer-generated flight plans (with winds) may be requested via OPARS (Optimum Path Aircraft Routing System). In this case the entry will be "OPARS #" in place of the specific wind data. Page 2-80
132 l. Clouds and visibility at flight level - Clouds and minimum visibility at flight level will generally be apparent from the overall weather picture NOTE: This information may be supplemented with PIREPs if available. NOTE: A check in the "IN AND OUT" box represents a forecast of between 1% and 45% of the flight through clouds while the "NO" box indicates less than 1%. The "YES" box indicates more than 45%. If it would be more practical to check more than one block to better represent cloud conditions, then enter locations above the additional blocks. 3. Terminal Forecast Section (Part III) a. Provides space for information on forecast weather at your destination and alternate, plus any intermediate points on a stopover flight plan Sg 4, fr 10 Fig 25: Terminal Forecast Section (Part III) b. Can be completed any time during the brief but if done early on it will indicate the feasibility of planned destination and the necessity of an alternate c. Terminal Aerodrome Forecasts (TAFs) will provide the required information for 1 hour prior to 1 hour after the planned ETA d. Any change groups (TEMPO, GRADU, INTERMITTENT, etc.) applicable to the valid time will be entered on the next line preceded by the change group indicator e. Although not required by the weather briefing form, a study of the existing weather from the METAR will indicate the reliability of the Terminal Aerodrome Forecast by comparing existing weather with forecast conditions Page 2-81
133 AIRDROME DEST/ALTN NBE DEST/ALTN TEMPO DEST/ALTN TIK DEST/ALTN TEMPO DEST/ALTN NZY DEST/ALTN NKX DEST/ALTN DEST/ALTN SCTD - OK & TX X = NBE/TIK PART III - TERMINAL FORECASTS CLOUD LAYERS VSBY/WEA SFC WIND ALTIMETER VALID TIME 5 SCT 10 BKN 15 OVC 4RW 3415/ BKN 10 OVC 1/2TRW G45 10 SCT 20 OVC 5RW 3412/ BKN 10 OVC 1TRW G40 25 BKN 250 BKN 5H SCT 250 BKN 5H INS INS INS INS INS INS INS INS Z TO Z TO Z TO Z TO Z TO Z TO Z TO Z TO Z Z Z Z Z Z Z Z TERMINAL FORECAST ENTRY AIRDROME CLOUD LAYERS VSBY/WEA SFC WIND ALTIMETER VALID TIME SOURCE DD-175 Terminal Aerodrome Forecasts (TAFs) Terminal Aerodrome Forecasts (TAFs) Terminal Aerodrome Forecasts (TAFs) Terminal Aerodrome Forecasts (TAFs) Terminal Aerodrome Forecasts (TAFs) Figure 25: TERMINAL FORECAST SECTION (PART III) Page 2-82
134 4. Comments/Remarks (Part IV) can include: a. Latest braking action code b. Pertinent PIREPs Sg 4, fr 11 Fig 26: Comments/ Remarks Section (Part IV) c. Latest METAR of first destination d. Any significant data not covered elsewhere, i.e., SIGMETs/AIRMETs/warnings, low-level windshear, and runway conditions 5. Briefing Record (Part V) a. Actual time of brief b. Flimsy briefing number (2-digit month code followed by sequential number of this briefing) Sg 4, fr 12 Fig 27: Briefing Record Section (Part V) c. Signature of forecaster (legible) d. Void time: Two and a half hours from the time of the brief but cannot exceed 30 minutes after your "Expected Time of Departure (ETD)" e. Extensions: new time based on a new ETD f. Forecaster's initials and name of the person being briefed LESSON NOTES Use each of the following Figures (28-31) to highlight critical information as required. These may also be used in a manner analogous to progress checks. G. Interpreting data contained on DD Page 2-83
135 PART IV - COMMENTS/REMARKS BRIEFED ON LATEST RCR FOR DESTN AND ALTN YES NOT AVAILABLE REQUEST PIREP AT X TUL NBE NBE 1400Z 12 SCT 30 SCT EBO 250 OVC / **WW #136 - DTG 31/1400Z VALID TIL 1800Z TUL INK DIVERT TO N OF TRACK RECOMMENDED COMMENTS/REMARKS ENTRY BRIEFED REQUEST PIREP AT SOURCE Forecaster to include any significant information not covered in the regular areas of the DD Forecaster based on necessity Figure 26: COMMENTS/REMARKS SECTION (PART IV) Page 2-84
136 PART V - BRIEFING RECORD WEA BRIEFED FLIMSY BRIEFING NO. FORECASTER'S SIGNATURE OR INITIALS 1440 Z AG1 W. W. FORECASTER VOID TIME EXTENDED TO WEA REBRIEFED AT FORECASTER'S INIT NAME OF PERSON RECEIVING BRIEFING 1630 Z 1700 Z 1610 Z WWF/JJF LT FLYIT DD Form 175-1, FEB 87 BRIEFING RECORD ENTRY SOURCE WEA BRIEFED Forecaster (Time of forecast) FLIMSY BRIEFING # Forecaster, if flimsy briefing has been previously provided. VOID TIME Based on 2 hrs after actual weather briefing per OPNAVINST EXTENDED TO Forecaster per OPNAVINST WEA REBRIEFED AT Forecaster per OPNAVINST FORECASTER'S INIT Forecaster NAME OF PERSON BRIEFED DD-175 and pilot Figure 27: BRIEFING RECORD SECTION (PART V) Page 2-85
137 Fig 28: Interpreting the DD (Example 1) 1. EXAMPLE 1 turbulence and icing level: The flight plan states that your flight will be going from SPS to ABQ at FL350, departing at 1900Z. NOTE: Be aware that the plane could encounter icing from SPS to CDS at 1,000 ft AGL to 12,000 ft MSL on climbout and will encounter severe turbulence from TXO to ABQ between FL230 and FL390. These phenomena affect how you decide to proceed with your flight plan. Fig 29: Interpreting the DD (Example 2) 2. EXAMPLE 2 destination forecast requires an alternate: The flight plan states that your flight will be going from NQI to NPA with PAM as an alternate, departing at 1730Z and flying at FL370. NOTE: The alternate airfield is required because the weather at the primary is below 3,000-3, overcast at 500 and 1,400, thunderstorms and winds at 20 kts gusting to 45. Fig 30: Interpreting the DD (Example 3) 3. EXAMPLE 3 The proposed takeoff time very close to void time of 175-1: flight plan states that your flight will be going from NIR to ELP at FL350 departing at 0000Z. You have been delayed for maintenance. NOTE: Be aware that because your revised takeoff time of 0100Z will be after the VOID time, pilot(s) will need to contact METRO to extend the VOID time and perhaps receive a new briefing. In this case, the forecaster rebriefs the pilot(s) at 0030Z and sets a new void time of 0130Z. Fig 31: Interpreting the DD (Example 4) 4. EXAMPLE 4 route of flight has a severe weather warning (WW): The flight plan says your flight will be going from NIR to TIK at FL370 departing at 2200Z. NOTE: The pilot(s) should be aware that a severe weather warning (WW #25) is in effect between ALT and ADM and should divert a portion of the flight path west. Pilot(s) should ask forecaster about the extent of the warning. Page 2-86
138 FLIGHT WEATHER BRIEFING DATE 2 FEB XM 0407 T SFC WIND ACFT TYPE/NO CLIMB WINDS REMARKS/TAKEOFF ALTN FCST T45/ DEP PT/ETD PART I - MISSION/TAKEOFF DATA PART II - ENROUTE DATA FLT LEVEL FLT LEVEL WINDS/TEMP SPS 2895/ RUNWAY TEMP DEWPOINT TEMP DEV PRESSURE ALT DENSITY ALT Z o F/C o F/C o x x -5 C 600 FT 800 LOCAL WEA WRNG/MET WATCH ADV RCR SPS/ PTCHS OF ICE ON RWY WX ADV SVR ICG WR FT CLOUDS AT FLT LEVEL MINIMUM VISIBILITY AT FLT LEVEL OUTSIDE CLOUDS MILES DUE TO X YES NO IN AND OUT SMOKE DUST HAZE MINIMUM CEILING LOCATION MAXIMUM CLOUD TOPS 010 FT AGL SPS 130 FT MSL SPS FOG PRECIPITATION NO OBSTRUCTION LOCATION MINIMUM FREEZING LEVEL LOCATION 010 FT MSL SPS X THUNDERSTORMS TURBULENCE ICING PRECIPITATION MWA/WW NO. X NONE ISOLATED 1-2% FEW 3-15% SCATTERED 16-45% NUMEROUS - MORE THAN 45% HAIL, SVR., TURB., SEVERE, ICING, PRECIPITATION AND LIGHTNING EXPECTED IN AND NEAR TSTMS. LOCATION AIRDROME DEST/ALTN ABQ DEST/ALTN ELP DEST/ALTN DEST/ALTN DEST/ALTN DEST/ALTN DEST/ALTN DEST/ALTN CAT ADVISORY AREA LINE NONE IN CLEAR IN CLOUD LIGHT MOD SVR EXTREME LEVELS LOCATION CLOUD LAYERS PART III - TERMINAL FORECASTS PART IV - COMMENTS/REMARKS BRIEFED ON LATEST RCR FOR DESTN AND ALTN YES NOT AVAILABLE REQUEST PIREP AT WEA BRIEFED FLIMSY BRIEFING NO Z VOID TIME EXTENDED TO WEA REBRIEFED AT Z DD Form 175-1, FEB 87 ISOL - LA & AR SCTD - OK & TX 100 OVC 50 SCT 100 OVC Z X Z NONE TRACE LIGHT MOD SVR LEVELS LOCATION PART V - BRIEFING RECORD Z X FL TXO - ABQ RIME MIXED CLEAR X X NONE LT MOD HVY SHWRS FRZG LOCATION VSBY/WEA SFC WIND ALTIMETER FORECASTER'S SIGNATURE OR INITIALS FORECASTER'S INIT SFC X ABQ RCR - DRY WW # VALID UNTIL 2200Z FOR TX0 - ABQ RTE WW # IN EFFECT UNTIL 2200Z SVR RIME ICE AG1 R. LOUS RBL SPS INS INS INS INS INS INS INS INS DRIZ RAIN SNOW SLEET VALID TIME Z TO Z TO Z TO Z TO Z TO Z TO Z TO Z TO NAME OF PERSON RECEIVING BRIEFING X TXO D. BROWNING SPS - CDS Z Z Z Z Z Z Z Z Figure 28: INTERPRETING THE DD (EXAMPLE 1) Page 2-87
139 DATE 2 FEB XM 0410 T SFC WIND ACFT TYPE/NO CLIMB WINDS REMARKS/TAKEOFF ALTN FCST FLT LEVEL CLOUDS AT FLT LEVEL FLT LEVEL WINDS/TEMP YES NO IN AND OUT MINIMUM CEILING FT AGL NQI - NPA X T45/ DEP PT/ETD FLIGHT WEATHER BRIEFING PART I - MISSION/TAKEOFF DATA RUNWAY TEMP DEWPOINT TEMP DEV PRESSURE ALT DENSITY ALT Z o F/C o F/C o x x +10 C +200 FT 1280 FT LOCAL WEA WRNG/MET WATCH ADV RCR NQI/ LGT TURB SFC PART II - ENROUTE DATA SAT 3541/-56 LCH 2530/-56 MSY 2618/-52 MINIMUM VISIBILITY AT FLT LEVEL OUTSIDE CLOUDS SMOKE DUST HAZE LOCATION MAXIMUM CLOUD TOPS FT MSL TLH 2425/-50 MILES DUE TO FOG PRECIPITATION NO OBSTRUCTION LOCATION MINIMUM FREEZING LEVEL LOCATION X FT MSL THUNDERSTORMS TURBULENCE ICING PRECIPITATION MWA/WW NO. X NONE CAT ADVISORY AREA LINE NONE IN CLEAR IN CLOUD ISOLATED 1-2% FEW 3-15% TOPS 310 SCATTERED 16-45% NUMEROUS - MORE THAN 45% HAIL, SVR., TURB., SEVERE, ICING, PRECIPITATION AND LIGHTNING EXPECTED IN AND NEAR TSTMS. LOCATION AIRDROME DEST/ALTN NPA DEST/ALTN PAM DEST/ALTN DEST/ALTN DEST/ALTN DEST/ALTN DEST/ALTN DEST/ALTN X LCH - NPA LIGHT MOD SVR EXTREME LEVELS LOCATION CLOUD LAYERS 5 OVC 14 OVC 050 OVC LCH - NPA PART III - TERMINAL FORECASTS PART IV - COMMENTS/REMARKS BRIEFED ON LATEST RCR FOR DESTN AND ALTN YES NOT AVAILABLE REQUEST PIREP AT SJI - NPA OCNL C 0X1/2 TRWR+F X X X Z NONE TRACE LIGHT MOD SVR LEVELS LOCATION RIME MIXED CLEAR NONE LT MOD HVY SHWRS FRZG LOCATION VSBY/WEA SFC WIND ALTIMETER 2TRW 2R LCH X 2920G INS INS INS INS INS INS INS INS DRIZ RAIN SNOW SLEET X VALID TIME X X LCH - NPA Z TO Z TO Z TO Z TO Z TO Z TO Z TO Z TO Z Z Z Z Z Z Z Z PART V - BRIEFING RECORD WEA BRIEFED FLIMSY BRIEFING NO. FORECASTER'S SIGNATURE OR INITIALS 1630 Z AG1 RON THOMPSON VOID TIME EXTENDED TO WEA REBRIEFED AT FORECASTER'S INIT NAME OF PERSON RECEIVING BRIEFING Z Z Z 1800 DD Form 175-1, FEB 87 RPT B. MIDDLETON Figure 29: INTERPRETING THE DD (EXAMPLE 2) Page 2-88
140 FLIGHT WEATHER BRIEFING DATE 2 FEB XM 1210 T SFC WIND ACFT TYPE/NO CLIMB WINDS REMARKS/TAKEOFF ALTN FCST FLT LEVEL 350 T45/ FLT LEVEL WINDS/TEMP DEP PT/ETD PART I - MISSION/TAKEOFF DATA RUNWAY TEMP DEWPOINT TEMP DEV PRESSURE ALT DENSITY ALT Z o F/C o F/C o x x +15 C -300 FT 23 LOCAL WEA WRNG/MET WATCH ADV RCR NIR/ ISOL CBS ARE N-NE OF FST MOV 5 KT PART II - ENROUTE DATA SAT 3120/-48 FST 2535/-50 FT CLOUDS AT FLT LEVEL X YES NO IN AND OUT MINIMUM CEILING FT AGL MINIMUM VISIBILITY AT FLT LEVEL OUTSIDE CLOUDS X SMOKE DUST HAZE LOCATION MAXIMUM CLOUD TOPS MILES DUE TO FOG PRECIPITATION NO OBSTRUCTION LOCATION MINIMUM FREEZING LEVEL LOCATION FT MSL FT MSL 7 THUNDERSTORMS TURBULENCE ICING PRECIPITATION MWA/WW NO. X NONE ISOLATED 1-2% FEW 3-15% SCATTERED 16-45% NUMEROUS - MORE THAN 45% HAIL, SVR., TURB., SEVERE, ICING, PRECIPITATION AND LIGHTNING EXPECTED IN AND NEAR TSTMS. LOCATION FST CAT ADVISORY AREA LINE NONE IN CLEAR IN CLOUD LIGHT MOD SVR EXTREME LEVELS LOCATION X SAT - FST Z NONE TRACE LIGHT MOD SVR LEVELS LOCATION RIME MIXED CLEAR NONE DRIZ RAIN SNOW SLEET LT MOD HVY SHWRS FRZG LOCATION PART III - TERMINAL FORECASTS AIRDROME CLOUD LAYERS VSBY/WEA SFC WIND ALTIMETER VALID TIME 250 SCT DEST/ALTN ELP INS 0300 Z TO 0230 DEST/ALTN INS Z TO DEST/ALTN INS Z TO DEST/ALTN INS Z TO DEST/ALTN INS Z TO DEST/ALTN INS Z TO DEST/ALTN INS Z TO DEST/ALTN INS Z TO PART IV - COMMENTS/REMARKS BRIEFED ON LATEST RCR FOR DESTN AND ALTN YES NOT AVAILABLE REQUEST PIREP AT X Z Z Z Z Z Z Z Z PART V - BRIEFING RECORD WEA BRIEFED FLIMSY BRIEFING NO. FORECASTER'S SIGNATURE OR INITIALS 2315 Z AG2 SAMUEL MARTINEZ VOID TIME EXTENDED TO WEA REBRIEFED AT FORECASTER'S INIT NAME OF PERSON RECEIVING BRIEFING 0100 Z 0130 Z 0030 Z SRM J. BROWN DD Form 175-1, FEB 87 Figure 30: INTERPRETING THE DD (EXAMPLE 3) Page 2-89
141 FLIGHT WEATHER BRIEFING DATE 2 JUL XM 1415 T SFC WIND ACFT TYPE/NO CLIMB WINDS REMARKS/TAKEOFF ALTN FCST FLT LEVEL 2520 FLT LEVEL WINDS/TEMP DEP PT/ETD PART I - MISSION/TAKEOFF DATA RUNWAY TEMP DEWPOINT TEMP DEV PRESSURE ALT DENSITY ALT Z o F/C o F/C o x x 23 C +160 FT 2950 LOCAL WEA WRNG/MET WATCH ADV RCR NIR/ LGT TURBC SFC ISOL CB'S LOCATED NW-N OF AUS MOVG 10 KT 370 T45/ PART II - ENROUTE DATA AUS 2025/-38 ADM 2735/-55 DFW 2540/-45 FT CLOUDS AT FLT LEVEL MINIMUM VISIBILITY AT FLT LEVEL OUTSIDE CLOUDS MILES DUE TO YES NO IN AND OUT SMOKE DUST HAZE MINIMUM CEILING LOCATION MAXIMUM CLOUD TOPS 500 FT AGL X DFW FL500 FT MSL FOG PRECIPITATION NO OBSTRUCTION LOCATION MINIMUM FREEZING LEVEL LOCATION OK, TX 120 FT MSL TUL THUNDERSTORMS TURBULENCE ICING PRECIPITATION MWA/WW NO. X NONE ISOLATED 1-2% FEW 3-15% SCATTERED 16-45% NUMEROUS - MORE THAN 45% HAIL, SVR., TURB., SEVERE, ICING, PRECIPITATION AND LIGHTNING EXPECTED IN AND NEAR TSTMS. LOCATION AIRDROME DEST/ALTN DEST/ALTN DEST/ALTN DEST/ALTN DEST/ALTN DEST/ALTN DEST/ALTN CAT ADVISORY AREA LINE NONE IN CLEAR IN CLOUD LIGHT MOD SVR EXTREME LEVELS LOCATION CLOUD LAYERS PART III - TERMINAL FORECASTS PART IV - COMMENTS/REMARKS BRIEFED ON LATEST RCR FOR DESTN AND ALTN YES NOT AVAILABLE REQUEST PIREP AT Z NONE TRACE X X LIGHT X X MOD X X X SVR LEVELS LOCATION PART V - BRIEFING RECORD RIME MIXED CLEAR NONE LT MOD HVY SHWRS FRZG LOCATION VSBY/WEA SFC WIND ALTIMETER INS INS INS INS INS INS INS DRIZ RAIN SNOW SLEET VALID TIME DEST/ALTN TIK INS 2210 Z TO 0110 Z DFW DYS WEA BRIEFED FLIMSY BRIEFING NO Z VOID TIME EXTENDED TO WEA REBRIEFED AT 2230 Z DD Form 175-1, FEB 87 TX and OK ALT ADM 30 SCT 100 OVC 5 BKN 10 OVC 25 BKN 250 BKN Z VCTY OF CBS Z 1/2TRW 5H FORECASTER'S SIGNATURE OR INITIALS AG1 ROBERT FITZIMONS FORECASTER'S INIT RPF VCTY OF CBS Z TO Z TO Z TO Z TO Z TO Z TO Z TO NAME OF PERSON RECEIVING BRIEFING MOLETTA X X ALT DFW ALT ADM 2915G50 TIK RCR - DRY WW # 25 IN EFFECT TIL 0300Z FOR ACT ADM RTE DIVERSION WEST OF PLANNED ROUTE RECOMMENDED Z Z Z Z Z Z Z Figure 31: INTERPRETING THE DD (EXAMPLE 4) Page 2-90
142 V. Enroute procedures Sg 5, fr 3 Lesson Organization? Once you are airborne, where can you get current weather information? ANSWER: 1. Pilot-to-Metro facilities 2. Flight Watch facilities (EFAS) 3. Flight Service Stations 4. ARTCC (center) 5. Transcribed Weather Broadcasts A. Sources of in-flight weather information NOTE: The sources below are listed in the order in which they should be used. 1. Pilot-to-Metro Service (PMSV) Sg 5, fr 4 (7 Overlays) Pilot-to-Metro Service a. Operated out of NASs, MCASs, and USAF bases call name example: Kingsville Metro or Metro b. Normally, pilots can directly access weather forecasters (1) In some cases, USN or USMC forecasting has been centralized to support outlying satellite detachments during off-peak hours when a forecaster is not on duty (2) Most USN and USMC stations are manned 24 hrs with observers maintaining a basic weather watch NOTE: Observers can provide basic services, e.g., read latest field conditions or read a TAF (terminal) report. Page 2-91
143 (3) For forecaster services, e.g., DD updates or extensions, the observer can act as an intermediary with the Sub-Regional Forecast Center (SRFC) forecaster or advise the pilot who to call (4) Advise forecaster/observer of ETA when terminal weather is requested (5) A listing of the SRFC can be found in FLIP Flight Information Handbook c. Operates on UHF frequencies d. Listed in the FLIP Flight Information Handbook and the Enroute Supplement under "Metro" Overlay 1 Enroute Flight Advisory Service 2. Enroute Flight Advisory Service (EFAS) a. Operated by FAA call name example: San Antonio Flight Watch or Flight Watch b. Provides updated enroute weather information (1) Not intended for preflight weather brief or random weather reports and forecast, contact nearest FSS for this information (2) Specifically designed to provide enroute aircraft with timely and meaningful weather advisories pertinent to the type of flight intended, route of flight, and altitude c. Usually accessible anywhere over continental US above 5,000 ft AGL, generally 6:00 am to 10:00 pm; however, hours of operation are expanding at some facilities d. Operates on VHF frequencies e. Also available on specific frequencies reserved for high altitude traffic (for aircraft flying above 18,000 ft) Page 2-92
144 3. Flight Service Station (FSS) Overlay 2 Flight Service Station NOTE: The FSS system has recently been consolidated into approximately one facility per state. Regional FSS denoted on FLIP High Altitude Charts with a shadow box. a. Operated by FAA call name example: San Angelo Radio b. Provides enroute weather information as part of its service NOTE: FSS operators can read METARs, Area and Terminal Aerodrome Forecasts, PIREPs, AIRMETs and SIGMETs, but they are not trained forecasters. c. FSS available frequencies are 255.4, 122.2, selected discrete frequencies and emergency and NOTE: When calling Metro, Flight Watch, or FSS, advise the service of your approximate location to receive transmissions from the proper remote transmitter. At the completion of the dialogue, the service often appreciates a PIREP including aircraft type, altitude/flight level, and conditions of flight. 4. Air Route Traffic Control Center (ARTCC) a. Can provide weather information and updating as requested, but weather dissemination is not a primary service Overlay 3 Air Route Traffic Control Center b. Can provide real-time weather avoidance assistance through use of current ATC radar and weather radar NOTE: ARTCC will not routinely provide updated weather briefings for route, as provided by Metro and Flight Watch. Page 2-93
145 Overlay 4 Transcribed Weather Broadcasts 5. Transcribed Weather Broadcasts (TWEB) a. Recorded weather information transmitted over selected NDB and VOR stations b. Amount and type of weather information vary from station to station, but can include local weather, route weather, winds aloft, and terminal aerodrome forecasts Overlay 5 Hazardous In-flight Weather Advisory Service Overlay 6 Automated Weather Observation System 6. Hazardous In-flight Weather Advisory Service (HIWAS) a. Broadcasts continuously over selected VOR stations b. Contains summary of any AIRMETs, SIGMETs, convective SIGMETs, CWAs and PIREPs 7. Automated Weather Observation System (AWOS) a. AWOS is a real-time system consisting of various sensors, a processor, a computergenerated voice subsystem, and transmitter to broadcast local minute-by-minute weather directly to the aircraft (1) AWOS observations derived from an automated system will include the prefix "AWOS" (2) Some AWOS locations will be augmented by certified observers who will provide weather and obstruction to visibility information in the remarks of the report when the reported visibility is less than 3 miles. Augmentation is identified as "OBSERVER WEATHER" (3) The reported visibility is derived from a sensor near the touchdown of the primary instrument runway Page 2-94
146 NOTE: The AWOS visibility is reported as a runway visibility range and may differ from the prevailing visibility. (4) The reported sky condition/ceiling is derived from the ceilometer located next to the visibility sensor and may differ from the observed sky condition, because the AWOS is totally dependent on clouds over the sensor site b. There are four operational levels of AWOS (1) AWOS-A - reports only altimeter setting (2) AWOS-1 - reports altimeter setting, wind data, temperature, dew point, and density altitude (3) AWOS-2 - reports information in AWOS-1 plus visibility (4) AWOS-3 - reports information in AWOS-2 plus cloud and ceiling data (5) AWOS information is transmitted over a discrete frequency or the voice portion of a local NAVAID NOTE: The system transmits a 20- to 30-second weather message each minute. The messages are updated each minute and are receivable within 25 nm of the AWOS site, at or above 3,000 ft AGL. c. AWOS broadcasts phraseology generally follows that used in other weather broadcasts. The following are explanations of exceptions: (1) The word "TEST" is added when the system is not in commissioned status (2) The phrase "TEMPORARILY INOPERATIVE" is added when the system is inoperative Page 2-95
147 (3) Ceiling is announced as either "CEILING" or "INDEFINITE CEILING" NOTE: All automated ceiling heights are measured ceilings except indefinite ceilings. (4) The word "CLEAR" is not used in AWOS due to limitations in height ranges of the sensors NOTE: No clouds detected is announced as "NO CLOUDS BELOW" or "CLEAR BELOW." (5) "SKY CONDITION MISSING" is announced only if the system level is able to report ceiling/sky condition, and the data is not available NOTE: Ceiling/sky conditions are not announced if the system level is not able to report them. (6) "VISIBILITY LESS THAN ONE QUARTER" is the lowest visibility reported NOTE: "VISIBILITY MISSING" is announced only if the system level is able to report visibility, and the data is not available. Visibility is not announced if the system level is not able to report it. (7) If remarks are included, the word "REMARKS" is announced after the altimeter setting in the following priority: (a) Automated remarks i) Density altitude ii) Variable visibility Page 2-96 iii) Variable wind direction
148 (b) Manual remarks (prefaced with "OBSERVER WEATHER") i) Type and intensity of precipitation ii) Direction and intensity of thunderstorms iii) Obstructions to visibility when 3 miles or less 8. Automatic Terminal Information Service (ATIS) NOTE: ATIS frequencies are incorporated on individual FLIP Terminal Instrument Approach Procedures and aerodrome listings in the Enroute Supplement. Where this service is available, listing will be found on the COMMUNICATIONS line, e.g., (ATIS 276.2). Pilots will be expected to listen to ATIS broadcasts, when in operation, to obtain essential but routine terminal information. Overlay 7 Automatic Terminal Information Service a. ATIS broadcasts are recorded, and the pilot should notify controllers that he has received the broadcast by repeating the alphabetical code word appended to the broadcast. Example: "INFORMATION ECHO RECEIVED" b. When the pilot acknowledges that he has received the ATIS broadcast, controllers may omit those items contained on the broadcast if they are current NOTE: Rapidly changing conditions will be issued by Air Traffic Control, and the ATIS will contain words as follows: "LATEST CEILING/ VISIBILITY/ALTIMETER/(OTHER CONDITIONS) WILL BE ISSUED BY APPROACH CONTROL/TOWER." c. The absence of a sky condition/ceiling and/or visibility on ATIS indicates a sky condition/ ceiling of 5,000 ft or above and visibility of 5 miles or more Page 2-97
149 NOTE: A remark may be made in the broadcast, "THE WEATHER IS BETTER THAN 5,000 AND 5," or the existing weather may be broadcast. d. Controllers will automatically issue pertinent information to pilots who do not acknowledge receipt of the ATIS broadcast or who acknowledge receipt of a broadcast which is not current Sg 5, fr 12 (3 Overlays) Pilot Weather Reports Overlay 1 B. Pilot weather reports (PIREPs) , Issued by pilot to ATC or weather disseminating agencies (PMSV, EFAS, FSS, etc.) 2. Reports filed when a. Requested b. Unusual and unforecast weather is encountered (mandatory voice report) c. Weather conditions on IFR approach differ from latest observation (mandatory voice report after landing) d. Missed approach is executed due to weather e. Hazardous or potentially hazardous weather is encountered (windshear, microburst, icing, severe turbulence, etc.) particularly on arrival or departure Overlay 2 Overlay 3 3. Relay time-critical information directly to ATC 4. All PIREPs can be given to Metro, Flight Watch, or other weather dissemination agencies on the frequency of the outlet closest to the aircraft position. See your Flight Information Handbook. 5. Format (also available in FLIP Flight Information Handbook) Page 2-98
150 a. Aircraft location or area of occurrence b. Time (UTC) c. Altitude (MSL) d. Type aircraft e. Sky cover (bases, tops, amount) f. Temperature g. Wind h. Turbulence (see turbulence tables in FIH) i. Icing (see icing tables in FIH) j. Remarks NOTE: Pilots should use standardized terminology as indicated in the FLIP Flight Information Handbook when making a pilot report (e.g., trace, light, moderate, or heavy icing ). Also, use "frequency" table as appropriate. VI. Flight Weather Packet NOTE: OPNAV encourages the use of flight weather packets for extended flights. A. Should be requested at least 2 hrs prior to the weather brief, preferably 24 to 48 hrs prior Sg 8, fr 3 Lesson Organization Sg 8, fr 4 (2 Overlays) Flight Weather Packet 1. Can be prepared in less than 2 hrs, but probably will not be as complete B. Contents Overlay 1 Contents 1. Folder 2. Horizontal Weather Depiction Chart Page 2-99
151 a. Prepared for your proposed flight time and path b. Depicts atmospheric conditions from surface to 5,000 ft above the proposed flight level for the entire route and includes: (1) Areas of 5/8 or more of cloud coverage (2) All areas of cumulonimbus (CB), towering cumulus (TCU), in eighths coverage, along with tops and bottoms (3) Heights of freezing level (4) Fronts and pressure centers with movements (5) Significant weather and obstructions to visibility (6) Hazards to flight (7) Proposed route of flight (8) Any miscellaneous entries deemed operationally significant 3. Completed DD a. Pilot shall receive a verbal briefing as well as the weather briefing form Overlay 2 Use C. Use 4. Upper wind charts for proposed flight level(s) or OPARS customized flight plan 1. Folder contents serve as reminders of weather expected to encounter en route and stopover terminals 2. Pilot should note any deviations from weather Page 2-100
152 3. Pilots should turn in folder at final destination and if possible debrief with the forecaster actual conditions encountered in flight VII. Optimum Path Aircraft Routing System (OPARS) Sg 9, fr 3 Lesson Organization A. General 1. Primary purpose of OPARS is to provide computerprepared flight planning service to the Naval Aviation community Sg 9, fr 4 (1 Overlay) Fig 32: OPARS Kneeboard Output (1 of 2) 2. Service provides customized flight plan which can be used in many different ways a. Amount of fuel required to arrive with a specific reserve b. Maximum cargo/stores that can be carried for a particular flight/mission c. Amount of fuel required to "top off" for in-flight refueling d. Maximum time on station e. Mandatory overwater reporting positions for overseas flights f. Fuel usage for a specific route and/or altitude g. Other options available due to crew requirements and/or recommendations B. Program Description 1. Data bases Overlay 1 Fig 32: OPARS Kneeboard Output (2 of 2) a. Aircraft performance data from appropriate NATOPS manual for over 80 different Navy and Marine aircraft Page 2-101
153 OPTION: 2KB - KNEEBOARD 2 FLIGHT PLAN FOR JOHNSON COMPUTED 1849Z BASED UPON WEATHER DATA LEG01 STANDARD KNQI TO KMAF 20 JUL 96 ACFT TYPE T45FNF DRAG: 0 EFF: 100 PLANNED FOR ETD 1900Z INITIAL CRUISE FLIGHT LEVEL 190 FUEL TIME DIST ARRIVE RAMP LAND CARGO OPNLWT POA / Z ALT... RES /24 TOT /30 FUEL BIAS: 200 DBIAS: 0 ABIAS: 0 IBIAS: 0 ROUTING USED FOR THIS LEG KNQI.. CRIMP J25 SAT J2 JCT J15 LOWGO.. KMAF CPT F/L TMP WIND T/C T/H M/H TAS G/S ZD CD ETE ETR EFU EFR KNQI ***** *** *** /01 01/ KNQI N27304W CRIMP 320 P *** *** /11 00/ CRIMP N28265W *TOC* 390 P *** *** /04 00/ *TOC* N28444W SAT 390 P /43 00/ SAT N29386W JCT 390 P /13 00/ JCT N30359W *SDP* 390 P /05 00/ *SDP* N30498W LOWGO 145 P *** *** /17 00/ LOWGO N31260W KMAF 29 P *** *** /08 00/ KMAF N31565W *TOC* = TOP OF CLIMB *SDP* = START DESCENT POINT TOTAL WIND FACTOR 11KTS ====================================================================================== Figure 32: OPARS KNEEBOARD OUTPUT Page 2-102
154 NOTE: Several sets of data for one aircraft may be entered for different drag conditions, e.g., TA4 with drop tanks and without drop tanks. (1) Climb (usually normal rate of climb) (2) Cruise (usually maximum range) (3) Descent (usually flight idle) b. Forecast winds and temperatures derived by computer at the Fleet Numerical Oceanography Center (FNOC) located at Monterey, CA (1) Input includes land and shipboard surface and upper wind data (2) Computer analyzes on the basis of historical data and current information which produces wind and temperature forecasts for the next 48 hrs (3) Forecast model is run and OPARS data is updated every 12 hrs c. High altitude airways, NAVAIDs, and waypoints, along with all airfields with 5,000 ft or longer is entered for the entire Northern Hemisphere and updated every 4 weeks d. ADIZ zones, international boundaries, and prohibited airspace is entered C. Request Procedures 1. Computer terminals located at Naval Oceanography Command Detachments and facilities (NOCD or NOCF) and some squadron/wing operations spaces (mostly VP squadrons/wings) NOTE: Found in NOCD/NOCF and Marine weather offices from Japan to Spain. Page 2-103
155 a. Lead time of 2-3 hrs normally required; actual process, however, only takes ten minutes or less b. Best service provided if requested a day in advance of flight 2. Secondary method is through DOD message system (AUTODIN) a. This method allows access at any military base or aircraft carrier b. Message process takes 8-10 hrs (minimum) from the time the request is sent Sg 9, fr 7 (3 Overlays) Fig 33 & 34: OPARS Request Form (Top front) Overlay 1 (Bottom front) Overlay 2 (Top back) Overlay 3 (Bottom back) D. For a single leg flight plan (no intermediate stops), the following input data is required NOTE: Examples for a flight from NAS Kingsville to Hill AFB are included in the following: 1. Pilot/unit - (optional entry) 2. Leg - 1 (no intermediate stops) 3. POD - KNQI (ICAO for Point Of Departure) NOTE: In CONUS, "NQI" would be sufficient. 4. POA - CUS (Point Of Arrival, Hill AFB) 5. Routing a. $J (computer select best jet route) b. $R (fly jet routes or direct legs) c. $C (canned tracks, i.e., IR routes) d...., OLM, J126, RBL, J1, OAK,... (route desired by pilot) Page 2-104
156 OPARS FLIGHT PLANNING ALL ENTRIES ARE LIMITED TO ONE LINE AND MUST BEGIN IMMEDIATELY FOLLOWING THE PROMPT. REFER TO SECTION 2 OF THE OPARS USER'S MANUAL FOR A DETAILED DESCRIPTION OF EACH DATA ITEM. NOTES * 17 DC REQUIRED ONLY ON CERTAIN AIRCRAFT TYPES. * 19 SPERF REQUIRES 5 PARAMETERS. * 21 SPERF ALT CAN ACCEPT UP TO 3 PARAMETERS. REQUIRED INPUT LEG PILOT/UNIT 11 LEG 12 POD 44 POA 24 ROUTING 13 TOD/TOA 51 TOG 08 OMODE 05 ACTYPE 14 OPWT 18 CARGOCH 15 FUEL/RES 49 REFUEL 17 DC * > > > > > > > > > > > > > > SPECIAL PERFORMANCE (SPERF) * 19 SPERF 20 SPERF BIAS * 21 SPERF ALT > > > LEG - 2 LEG POA 24 ROUTING > > 44 POA 24 ROUTING > > 13 TOD/TOA 51 TOG 18 CARGOCH 15 FUEL/RES 49 REFUEL * 17 DC REQUEST TAKEN BY > > > > > > * 13 TOD/TOA 18 CARGOCH 15 FUEL/RES 17 DC > > > > REQUEST TRANSMITTED BY RECEIVED (DTG (Z)) JOB NAME NASKINGS 3140/18 (Rev 3-89) Figure 33: OPARS REQUEST FORM (Over) Page 2-105
157 OPTIONAL INPUT LEG - 1 LEG - 2 LEG DATE 06 EFF 09 WARNPT 10 FLTDATE 16 BIAS * 17 DC 25 RTARND 26 UPPRALT 27 LOWRALT 28 INCRUALT 29 INFLTRF1 30 INFLTRF2 31 INFLTRF3 32 DBIAS 33 ABIAS 34 OVERA 35 OVERB 36 OVERC 37 OVERD 38 OVERE 43 IBIAS 6 MBF 47 ATALT 48 ALTRNAT > > > > > > > > > > > > > > > > > > > > > > > > REQUIRED INPUT - MISSION LEG 53 EOM > 55 INALT > 56 OUTALT > OPTIONAL INPUT - MISSION LEG 52 BOM 54 FUELCH > > 57 LOM 58 TIMEIN > > 59 TIMEOUT 60 MINENG > > ADDITIONAL REMARKS NASKINGS 3140/18 (Rev 3-89) (Back) Figure 34: OPARS REQUEST FORM Page 2-106
158 e. Several other options 6. TOD/TOA (Time Of Departure. Time Of Arrival could be entered if desirous of arriving at a specified time) 7. OMOD - 1KB ( 1 Kneeboard output format) NOTE: Ten formats available, kneeboard is the most common request. 8. AC Type - T45A (aircraft type and model) 9. OPWT (no fuel, no cargo weight in lbs) 10. CARGOCH - 0 (cargo weight in lbs) 11. Fuel/Reserve (desire 600 lbs fuel reserve at POA) NOTE: OPARS will calculate amount of fuel to load at POD. VIII. Satellite imagery Sg 10, fr 3 Lesson Organization A. Background and introduction 1. U.S. Congress established system in 1961 a. Operated by National Oceanic and Atmospheric Administration (NOAA) b. Utilizes "Geostationary Operational Environmental Satellites" (GOES) and others that operate in a similar manner Sg 10, fr 4 Fig 35: GOES Satellite (1) First one launched 5 May 1974; by 1983, seven had been launched NOTE: By 1992, at least two had ceased to function. (2) GOES satellites now provide virtual worldwide coverage Page 2-107
159 Figure 35: GOES SATELLITE Page 2-108
160 (3) CONUS covered by GOES-East located at 75 degrees west and GOES-West at 135 degrees west Sg 10, fr 5 Fig 36: GOES Coverage NOTE: A third satellite, GOES-Central, is located at 107 degrees west and is used for weather facsimile broadcasts. (4) Scanners provide information on reflected visible light and thermal infrared portions of the spectrum B. Visual pictures Fig 37: Visual Picture 1. Resemble standard black and white photographs a. Reconstructed on Earth by line processing similar to television, from digital data collected by the satellite sensors b. Picture is the result of reflected sunlight (1) Clouds are an excellent reflector of sunlight (2) Neither the Earth's atmosphere nor empty space reflects sunlight; therefore, the background will always be black (3) Reflectivity table: (thick clouds appear white, thin clouds appear darker) (a) Cumulonimbus - 92% (b) Thick Cirrostratus - 74% (c) Thick Stratocumulus - 68% (d) Thin Stratus - 42% (e) Sand, No Foliage - 27% (f) Sand and Brushwood - 17% (g) Water Surfaces - 9% Page 2-109
161 Latitude Useful Cloud Information Overlapping Coverage Longitude Figure 36: GOES COVERAGE Page 2-110

162 Figure 37: VISUAL PICTURE Page 2-111
163 NOTE: Terrain has intermediate to low reflectivity and will appear as some shade of grey. Water appears almost black. Land/water contrast will normally be good. C. Infrared pictures Fig 38: Infrared Picture 1. Everything with a temperature above absolute zero radiates energy 2. Wave length of energy varies with temperature 3. GOES measures energy level at specific wave lengths 4. Earth receivers convert energy measurements to temperatures a. IR imagery portrays different temperatures as black (very warm), white (very cold), or some shade of grey b. High clouds are very cold, so they appear white; mid-level clouds are warmer, so they appear as some shade of grey; low clouds and/ or fog often are the same temperature as the surrounding terrain and cannot be distinguished at all 5. Enhanced IR Pictures a. Meteorologist has the option of assigning shades of grey to specific temperatures which allows specific items, i.e., thunderstorms, to be highlighted b. Operationally enhanced IR used quite often Page 2-112

164 Figure 38: INFRARED PICTURE Page 2-113
165 Fig 39: Picture with Date/Time Data D. Date/Time data 1. As with all weather products, checking the currency of the product can be important 2. Some weather briefing facilities can provide real-time CRT imagery, direct from the appropriate satellite 3. Printed product will display DTG legend a. First four numbers UCT (Z) time - indicates time of picture transmission start b. Second group calendar day, month, year c. Last group indicates sector E. Use of the pictures 1. Low-pressure areas and fronts a. Primary characteristic is "question mark" or "comma" shaped cloud pattern b. Center of low pressure located near center of vortex c. Tail of the "comma" denotes the location of the cold front d. Warm fronts often hard to define without the use of surface data e. Enhanced IR very helpful in determining locations of thunderstorms in the cloud pattern 2. Mountain Wave Turbulence a. Caused by winds in excess of 25 kts blowing perpendicular to rough or mountainous terrain causing moderate to severe turbulence Page 2-114

166 Figure 39: PICTURE WITH DATE/TIME DATA Page 2-115
167 b. Satellite imagery of wavy cloud pattern NOTE: The tighter the waves, the more severe the turbulence. Fig 40: Satellite Picture of Jet Stream 3. Jet Streams a. Indicated by narrow bands of cirrus clouds b. Almost always marked by very sharp northern and southern boundaries 4. Fog and Low Clouds a. Show up on visual pictures only (reflective sunlight) b. Not enough contrast to show on IR Sg 10, fr 6 Fig 41: The GOES Mission F. Other uses of the GOES 1. IR radiation in any of several bands 2. Atmospheric temperature sounding capability 3. Solar X-ray emissions and the near earth space environment 4. Provides selected data for research-oriented environmental scientists Page 2-116

168 Metro-02 Figure 40: SATELLITE PICTURE OF JET STREAM Page 2-117


169 GOES SUN SEM Day: IR and Visible Night: IR VAS DCS Relay Data from Remote Areas Communications WEFAX Observe Hurricanes, Storms, and Regional Weather L Collect, Assimilate, Analyze, and Predict Transmit Facsimile Information Figure 41: THE GOES MISSION Page 2-118
170 SUMMARY Sg 7, fr 3 Review Menu This lesson has focused on the following topics: * Weather minimums * Weather charts * Printed reports and forecasts * Flight weather briefing * Enroute procedures * Flight weather packets * OPARS * Satellite imagery CONCLUSION Reviewing the different weather charts, reports, and advisories will increase your ability to predict weather phenomena that can affect your planned flight. Page 2-119
171
172
173
174
175
176
177
178
179
180 Surface Winds CUMULUS COLD Warm Air Lifted Aloft CIRROCUMULUS ALTOCUMULUS CUMULONIMBUS WARM COLD FRONT
181
182 CIRRUS Surface Winds WARM POSSIBLE EMBEDDED CBs ALTOSTRATUS NIMBOSTRATUS STRATUS COLD CIRROSTRATUS
183 Surface Winds WARM VARIOUS STRATUS CUMULONIMBUS COLD COOL STRATUS & STRATOCUMULUS
184
185 Surface Winds WARM COOL CUMULONIMBUS VARIOUS STRATUS COLD STRATUS & STRATOCUMULUS
186
187 Strong Downdraft Increasing Tail Wind Increasing Head Wind Airspeed and AOA Increase Outflow AOA Low Airspeed Slow Airspeed and AOA Decrease Outflow
188
189
190
191 Pitot and Static Port Icing Forward Visibility Impaired Reduced Communications Range Engine Damage from Ice Ingestion Increased Stall Speed GREATER DRAG Higher Angle of Attack Required GREATER WEIGHT
192
193 Jet Stream Areas of Potential Clear Air Turbulence L
194 60, TURBULENCE ISOTACHS (lines of equal wind speed) ,000 JET CORE ,000 MAX TURBULENCE AREA NORTH SOUTH - 10
195 Standing Lenticular Clouds Cap Cloud Rotor Cloud Mountain Range Severe Turbulance Area
196
197
198
199 DESTINATION WEATHER ETA plus and minus one (1) hour 0-0 up to but not including published minimums ALTERNATE WEATHER ETA plus and minus one (1) hour 3,000-3 or better Published minimums up to but not including 3,000-3 (single-piloted absolute minimums 200-1/2) NON- PRECISION PRECISION ILS PAR * Published minimums plus Published minimums plus 200-1/2 *Published minimums plus 200-1/2 3,000-3 or better No alternate required *In the case of single-piloted or other aircraft with only one operable UHF/VHF transceiver, radar approach minimums may not be used as the basis for selection of an alternate airfield.
200
201 NATIONAL WEATHER SERVICE 1500Z SAT AUG 13 19XX NO21. NMC SURFACE ANALYSIS ASUS
202 = = 3 1/4= = SHADED AREAS...IFR WITH CIGS LESS THAN 1,000 FT AND/OR VSBY LESS THEN 3 MI. 10Z MON 25 JULY 19XX 56. NMC WEATHER DEPICTION CONTOURED WITHOUT SHADING...MVFR AREAS WITH CIG GREATER THAN OR EQUAL TO 1,000 TO LESS THAN OR EQUAL TO 3,000 FT AND/OR VSBY GREATER OR EQUAL TO 3 MI LESS THAN OR EQUAL TO 5 MI. NO CONTOURS...VFR AREAS WITH CIG GREATER THAN 3,000 FT AND VSBY GREATER THAN 5 MI.
203
204 S- R- NE ZL- NA 310 RW RW+ LEWP 18 NA NE NE NA OM NA NA NE NA OM NA NE NE SLD NA HAIL TRW+ LM L NE R+ NA NA R+ NA RW NE NA HOOK SLD TRW+ 35 RW4 OM NA 24 RW4 LEGEND TRW 28 WT SHADING--ECHO AREAS CONTOURS AT INTENSITIES TOPS 999--BASES S OF FT. MVMT--AREAS+LINES--PENNANTS MVMT--CELLS--ARROWS WITH SPEED PRECIP TYPE AND CHANGE OF INTENSITY + IS NEW OR INCRG. - IS DCRG 500 WEATHER WATCH BOXES WT064 VALID UNTIL 1230Z MONDAY 0845 JUL 26 19XX RADAR SUMMARY
205
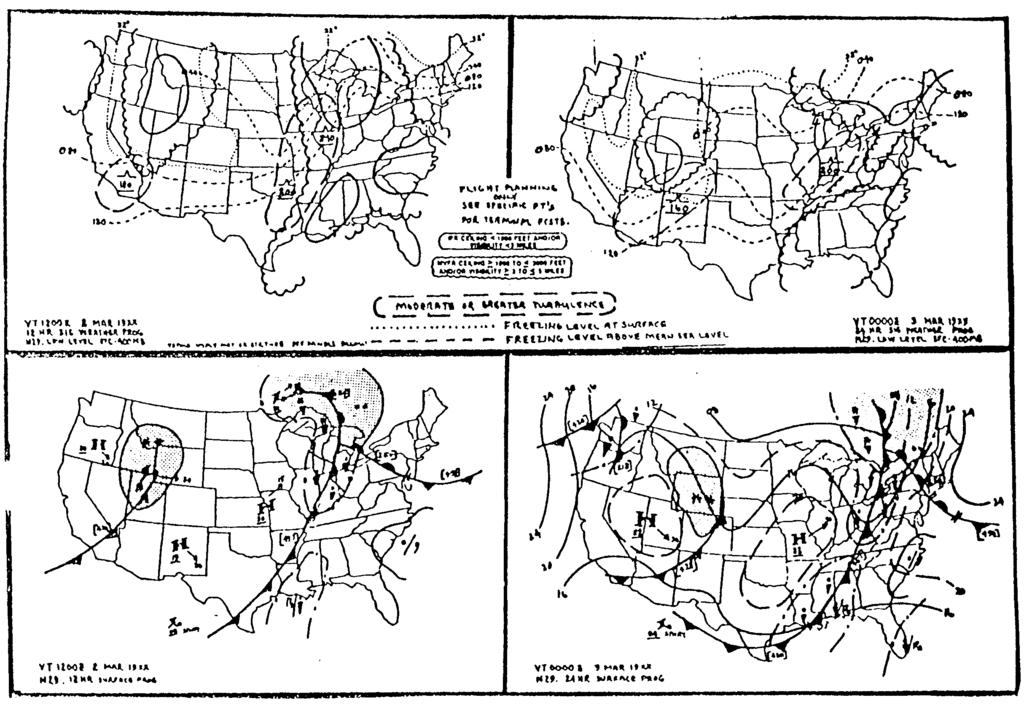
206
TAF CCCC YYGGggZ YYHHHH dddff(f)gffkt VVVVSM [ww NNNhhh] [Wshhh/dddffKT] [TTTTT xxxx] repeated as needed
![TAF CCCC YYGGggZ YYHHHH dddff(f)gffkt VVVVSM [ww NNNhhh] [Wshhh/dddffKT] [TTTTT xxxx] repeated as needed](/thumbs/80/81003809.jpg "TAF CCCC YYGGggZ YYHHHH dddff(f)gffkt VVVVSM [ww NNNhhh] [Wshhh/dddffKT] [TTTTT xxxx] repeated as needed") Encoding TAFs Terminal Aerodome Forecast (TAF) Terminal forecasts for the world follow an internationally accepted format. The TAFs are issued four times daily for 24 hour periods beginning at 00Z, 06Z,
Encoding TAFs Terminal Aerodome Forecast (TAF) Terminal forecasts for the world follow an internationally accepted format. The TAFs are issued four times daily for 24 hour periods beginning at 00Z, 06Z,
KEY TO DECODING THE U.S. METAR OBSERVATION REPORT
 KEY TO DECODING THE U.S. METAR OBSERVATION REPORT Example METAR Report METAR KABC 121755Z AUTO 21016G24KT 180V240 1SM R11/P6000FT -RA BR BKN015 0VC025 06/04 A2990 RMK A02 PK WND 20032/25 WSHFT 1715 VIS
TAF Decoder Courtesy of the Aviation Weather Center
 TAF Decoder Courtesy of the Aviation Weather Center A Terminal Aerodrome Forecast (TAF) is a concise statement of the expected meteorological conditions at an airport during a specified period (usually
Aerodrome Forecast (TAF)
") AVIATION WEATHER PRODUCTS () Bureau of Meteorology Aviation Weather Services A is a coded statement of meteorological conditions expected at an and within a radius of five nautical miles of the reference
AVIATION WEATHER PRODUCTS () Bureau of Meteorology Aviation Weather Services A is a coded statement of meteorological conditions expected at an and within a radius of five nautical miles of the reference
Meteorology METARs. References: FTGU pages AWWS:
 Meteorology 5.09 METARs References: FTGU pages 160-163 AWWS: www.flightplanning.navcanada.ca 5.09 METARs MTPs: Weather Observing Stations METARs Weather Observing Stations Weather observation are taken
Meteorology METARs Weather Observing Stations. MTPs: 5.09 METARs References: FTGU pages AWWS:
 Meteorology 5.09 References: FTGU pages 160-163 AWWS: www.flightplanning.navcanada.ca MTPs: Weather Observing Stations 5.09 Weather Observing Stations Weather observation are taken every hour at selected
Aviation Weather Reports
 Aviation Weather Reports Aviation Weather Reports METAR: hourly weather report (issued on the hour every hour) SPECI: special weather observations issued at times other than on the hour, as a result of
Issue of SIGMET/AIRMET warning
 Issue of SIGMET/AIRMET warning 1 Presentation Objectives After this presentation session you will be able to: Warn for Hazardous weather phenomena using the correct ICAO coding with regards to SIGMET/AIRMET
Aerodrome Reports and Forecasts
 Aerodrome Reports and Forecasts A Users Handbook to the Codes WMO-No. 782 Aerodrome Reports and Forecasts A Users Handbook to the Codes WMO-No. 782 Fifth edition November 2008 WMO-No. 782 World Meteorological
Preflight Weather Analysis Lesson 4 Part 4 of 4
 Preflight Weather Analysis Lesson 4 Part 4 of 4 Presented by Find-it Fast Books Unlimited FREE Downloads of this course available at www.finditfastbooks.org 1 The slide sequence for Lesson 4 is a little
MET 3502 Synoptic Meteorology. Lecture 5: Surface Weather Elements
 MET 3502 Synoptic Meteorology Lecture 5: Surface Weather Elements Surface Weather Elements Not observations of the surface, but Observations made by an observer (or instrument) at the surface Example:
STUDY UNIT SEVENTEEN GRAPHICAL AIRMAN S METEOROLOGICAL ADVISORY (G-AIRMET)
") STUDY UNIT SEVENTEEN GRAPHICAL AIRMAN S METEOROLOGICAL ADVISORY (G-AIRMET) 341 (10 pages of outline) 17.1 Product Description....................................................... 341 17.2 Issuance...............................................................
STUDY UNIT SEVENTEEN GRAPHICAL AIRMAN S METEOROLOGICAL ADVISORY (G-AIRMET) 341 (10 pages of outline) 17.1 Product Description....................................................... 341 17.2 Issuance...............................................................
TERMINAL AERODROME FORECAST
 1. Introduction TERMINAL AERODROME FORECAST Basically, a Terminal Aerodrome Forecast (or Terminal Area Forecast, TAF) is a message with a defined format with the objective to report a weather forecast
ROYAL CANADIAN AIR CADETS PROFICIENCY LEVEL FOUR INSTRUCTIONAL GUIDE SECTION 5 EO C ANALYZE WEATHER INFORMATION PREPARATION
 ROYAL CANADIAN AIR CADETS PROFICIENCY LEVEL FOUR INSTRUCTIONAL GUIDE SECTION 5 EO C436.03 ANALYZE WEATHER INFORMATION Total Time: 90 min PREPARATION PRE-LESSON INSTRUCTIONS Resources needed for the delivery
METEOROLOGICAL AIRPORT REPORT
 1. Introduction 1.1. METAR IVAO TM Training Department Headquarters METEOROLOGICAL AIRPORT REPORT A METAR (Meteorological Airport Report) is a meteorological observation report (not a prediction) dedicated
Weather Charts And Briefings
 Page M1 Chapter Thirteen Weather Charts And Briefings PIREPS, Progs & METARS The Telephone Briefing 1. [M4/1/9] When telephoning a weather briefing facility for preflight weather information, pilots should
Chapter 12 Weather Charts & Briefings: PIREPS, Progs & METARS
 Chapter 12 Weather Charts & Briefings: PIREPS, Progs & METARS The Telephone Briefing 1. [12-4/1/9] When telephoning a weather briefing facility for preflight weather information, pilots should A. identify
INSTRUMENT RATING FLIGHT PROCEDURES
 NAVAL AIR TRAINING COMMAND NAS CORPUS CHRISTI, TEXAS CNATRA P-1245 (Rev. 8-97) PAT INSTRUMENT RATING FLIGHT PROCEDURES LESSON GUIDE 1997 T-45 LESSON GUIDE CHANGE SUMMARY PAGE CHANGE DATE NUMBER ENTERED
Section 7: Hazard Avoidance
 7.1 In-Flight Hazard Awareness Section 7: Hazard Avoidance As technology improves, pilots have more and more real-time information within reach in all phases of flight. Terrain proximity, real-time weather
Flight Dispatcher Aviation Meteorology Required Knowledge
 Flight Dispatcher Aviation Meteorology Required Knowledge 3.1 THE EARTH'S ATMOSPHERE 1 Properties 2 Vertical Structure 3 ICAO Standard Atmosphere 3.2 ATMOSPHERIC PRESSURE 1 Pressure Measurements 2 Station
Explanation and decode for code figures used in the Wokingham 0900 and 1500 GMT observations
 Appendix 2. Explanation and decode for code figures used in the Wokingham 0900 and 1500 GMT observations VV : Visibility. Code figures 00 to 50 are in km and tenths e.g. 01 = 0.1 km = 100 m, 33 = 3.3 km,
National Transportation Safety Board Office of Aviation Safety Washington, D.C December 10, 2012 WEATHER STUDY DCA13RA025
 A. ACCIDENT National Transportation Safety Board Office of Aviation Safety Washington, D.C. 20594-2000 December 10, 2012 WEATHER STUDY DCA13RA025 Location: Monterrey, Mexico Date: December 9, 2012 Time:
Weather Legends in FOREFLIGHT MOBILE
 Weather Legends in FOREFLIGHT MOBILE 14th Edition Covers ForeFlight Mobile v9.4 on ipad Radar Legends (when from Internet) Snowy/Icy Precipitation Mixed Precipitation Rain Echo top (in 100 s of feet) ex:
QLD-S NSW-E NSW-W VIC TAS. A HEADER giving details of the time of issue and the associated validity period.
 FLIGHT FORECASTS Flight Forecasts are issued on request for flights for which GAFs are not available. They are subject to the requirements of AIP GEN 3.5 para 3.1 and AIP GEN 3.5 para 10.3. Flight forecasts
Effective: SPECI ALERTING
 AUSTRALIA AERONAUTICAL INFORMATION SERVICE AIRSERVICES AUSTRALIA GPO BOX 367, CANBERRA ACT 2601 Phone: 02 6268 4874 Email: aim.editorial@airservicesaustralia.com Effective: AERONAUTICAL INFORMATION CIRCULAR
Mechanical Turbulence Wind forms eddies as it blows around hanger, stands of trees or other obstructions
 Turbulence Low-level Turbulence below 15,000 feet consists of Mechanical Turbulence Convective Turbulence Frontal Turbulence Wake Turbulence Mechanical Turbulence Wind forms eddies as it blows around hanger,
III.B. Weather Information
 III.B. Weather Information References: AC 00-6; AC 00-45; FAA-H-8083-25 Objectives Key Elements Elements Schedule Equipment IP s Actions SP s Actions Completion Standards The student should develop knowledge
DEPARTMENT OF EARTH & CLIMATE SCIENCES SAN FRANCISCO STATE UNIVERSITY. Metr Fall 2014 Test #1 September 30, 2014
 DEPARTMENT OF EARTH & CLIMATE SCIENCES SAN FRANCISCO STATE UNIVERSITY NAME Metr 302.02 Fall 2014 Test #1 September 30, 2014 200 pts (4 pts each answer) Part I. Surface Chart Interpretation. Questions 1
Answer Key. Page 1 of 5
 Answer Key Name: Score: [1] When telephoning a weather briefing facility for preflight weather information, pilots should state A. whether they intend to fly VFR only. B. the full name and address of the
METEOROLOGY PANEL (METP) WORKING GROUP- METEOROLOGICAL OPERATION GROUP (MOG) FIRST MEETING
 WORKING GROUP- METEOROLOGICAL OPERATION GROUP (MOG) FIRST MEETING") 8 28/7/15 METEOROLOGY PANEL (METP) WORKING GROUP- METEOROLOGICAL OPERATION GROUP (MOG) FIRST MEETING Gatwick, United Kingdom, 08 to 11 September 2015 Agenda Item 3: Matters relating to SADIS 3.3: Operations
8 28/7/15 METEOROLOGY PANEL (METP) WORKING GROUP- METEOROLOGICAL OPERATION GROUP (MOG) FIRST MEETING Gatwick, United Kingdom, 08 to 11 September 2015 Agenda Item 3: Matters relating to SADIS 3.3: Operations
CHAPTER 9 - SPECIAL OBSERVATIONS
 CHAPTER 9 - AL OBSERVATIONS 9.1 Introduction This chapter explains the criteria for taking special observations (). 9.2 Special Observations s are taken whenever mandatory criteria are met, and at the
Atmospheric Pressure. Pressure Altimeter. Pressure Altimeter
 Atmospheric Pressure The : An instrument to measure altitude based on an aneroid barometer. It can be adjusted for changes in atmospheric pressure 1 2 Altimeter Setting Is not SLP, but close to it. If
Your Source for Global Aviation Forecasts
 Your Source for Global Aviation Forecasts (831) 238-5054 100 Sky Park Drive Monterey, CA 93940 Weather4Cast.com Live Weather Data Feeds Weather4Cast.com provides Live Aviation Weather Data Feeds formatted
Weather Legends in FOREFLIGHT MOBILE
 Weather Legends in FOREFLIGHT MOBILE 15th Edition Covers ForeFlight Mobile v9.6 on ipad Radar Legends (when from Internet) Snowy/Icy Precipitation Mixed Precipitation Rain Echo top (in 100 s of feet) ex:
METEOROLOGY. 1 The average height of the tropopause at 50 N is about A 14 km B 16 km C 11 km D 8 km
 1 The average height of the tropopause at 50 N is about A 14 km B 16 km C 11 km D 8 km 2 In the lower part of the stratosphere the temperature A is almost constant B decreases with altitude C increases
Air Traffic Control Weather Certification
 3 d Weather Squadron Air Traffic Control Weather Certification Mr B.J. Ortner, 3 WS/DOV Weather Forecaster Current as of: 8 June 2017 Overview Requirements/References RGAAF (KGRK) Observations HAAF (KHLR)
GEMPAK Symbols, Lines, and Markers APPENDIX C. SYMBOLS, LINES, and MARKERS. Past Weather. Pressure tendency with change.
 APPENDIX C SYMBOLS, LINES, and MARKERS SYMBOLS The World Meteorological Organization (WMO) has established a standard set of symbols depicting descriptive reports of certain types of weather observations.
CHAPTER THREE Mechanics of Frontal Systems
 Mechanics of Frontal Systems 300. INTRODUCTION The purpose of this chapter is to introduce the student to various frontal systems, including their formation, flight conditions, and associated weather patterns,
2. A mountain breeze (katabatic wind) blows : DOWN THE SLOPE DURING THE NIGHT
 blows : DOWN THE SLOPE DURING THE NIGHT") MODEL E-EXAM (ATPL) NO.3 1. Among the ten groups of clouds, the following two are mentioned specifically in MET-reports and forecasts intended for aviation: CUMULONIMBUS AND TOWERING CUMULUS 2. A mountain
MODEL E-EXAM (ATPL) NO.3 1. Among the ten groups of clouds, the following two are mentioned specifically in MET-reports and forecasts intended for aviation: CUMULONIMBUS AND TOWERING CUMULUS 2. A mountain
2012 National SAFECON SCAN Test
 Today is Friday, November 18, 2011. Your school's flight team has recently qualified for the National SAFECON. You have a couple days off from school and decide to return to your hometown of Rhinelander,
WEATHER THEORY. Weather Theory Page 100 Aviation Seminars. Measurement Of Temperature, Pressure And Moisture. Stability (Cont)
") Weather Theory Page 100 WEATHER THEORY Measurement Of Temperature, Pressure And Moisture The primary cause of all changes in the earth s weather is variation of solar energy received by the Earth s regions..
Weather Theory Page 100 WEATHER THEORY Measurement Of Temperature, Pressure And Moisture The primary cause of all changes in the earth s weather is variation of solar energy received by the Earth s regions..
Subject No 8 - PPL Meteorology
 Subject No 8 - PPL Meteorology Notes: This syllabus is principally based on the meteorology as applicable to flying a single piston-engine General Aviation type aeroplane or helicopter, within New Zealand
ERTH 465 Fall Laboratory Exercise 5. Surface Weather Observations (METARS) and Frontal Analysis (300 pts)
 and Frontal Analysis (300 pts)") ERTH 465 Fall 2017 Laboratory Exercise 5 Surface Weather Observations (METARS) and Frontal Analysis (300 pts) Insert in ringed-three hole binder. Point deductions for sloppy or late work. Due date: Tuesday
ERTH 465 Fall 2017 Laboratory Exercise 5 Surface Weather Observations (METARS) and Frontal Analysis (300 pts) Insert in ringed-three hole binder. Point deductions for sloppy or late work. Due date: Tuesday
AMDAR Forecast Applications. Richard Mamrosh NWS Green Bay, Wisconsin, USA
 AMDAR Forecast Applications Richard Mamrosh NWS Green Bay, Wisconsin, USA AMDAR has many applications Aviation Low level wind shear Ceilings and visibilities Icing and turbulence Winter Storms Precipitation
Metar And Taf Decoding
 Metar And Taf Decoding 1 / 6 2 / 6 3 / 6 Metar And Taf Decoding examples: kmem 230853z auto 18014g18kt 10sm clr 16/m02 a3008 rmk ao2 slp117 t01561022 tsno $ klax 161550z cor 11004kt 2 1/2sm hz bkn011 bkn015
Issue of SIGMET/AIRMET warning part II
 Issue of SIGMET/AIRMET warning part II 1 SIGMET SIGMET is warning information and hence it is of highest priority amongst other types of meteorological information provided to the aviation users. This
Global Surface Archives Documentation
 Global Surface Archives Documentation 1 July 2013 PO BOX 450211 GARLAND TX 75045 www.weathergraphics.com Global Surface Archives is a dataset containing hourly and special observations from official observation
Decoding Observations and Terminal Aerodrome Forecasts. Weather Observer/Forecaster O-LD 18 th Weather Squadron Ft Polk, LA
 Decoding Observations and Terminal Aerodrome Forecasts Weather Observer/Forecaster O-LD 18 th Weather Squadron Ft Polk, LA Part I. Decoding Observations What types of data goes into a weather observation?
DEPARTMENT OF GEOSCIENCES SAN FRANCISCO STATE UNIVERSITY. Metr Fall 2012 Test #1 200 pts. Part I. Surface Chart Interpretation.
 DEPARTMENT OF GEOSCIENCES SAN FRANCISCO STATE UNIVERSITY NAME Metr 356.01 Fall 2012 Test #1 200 pts Part I. Surface Chart Interpretation. Figure 1. Surface Chart for 1500Z 7 September 2007 1 1. Pressure
GRAPHICAL AREA FORECASTS (GAF) feet. Flight Information Region boundary QLD-S NSW-E VIC TAS
 feet. Flight Information Region boundary QLD-S NSW-E VIC TAS") GRAPHICAL AREA FORECASTS (GAF) Unlike at TAF, a Graphical Area Forecasts (GAFs) does not describe conditions expected at a particular location, it refers to a defined area and is intended for use in planning
GRAPHICAL AREA FORECASTS (GAF) Unlike at TAF, a Graphical Area Forecasts (GAFs) does not describe conditions expected at a particular location, it refers to a defined area and is intended for use in planning
Summary of Natural Hazard Statistics for 2008 in the United States
 Summary of Natural Hazard Statistics for 2008 in the United States This National Weather Service (NWS) report summarizes fatalities, injuries and damages caused by severe weather in 2008. The NWS Office
ESCI 241 Meteorology Lesson 9 Clouds and Fog
 References and Reading: MT Chapter 7 FORMATION OF CLOUDS ESCI 241 Meteorology Lesson 9 Clouds and Fog When air becomes saturated with water vapor, any excess water vapor condenses to form clouds The air
777 Neptune Groundschool Weather reporting & forecasts
 777 Neptune Groundschool 2018 Weather reporting & forecasts Weather Reporting Weather Forecast is a prediction of what the weather conditions will be in the future Weather Report tells the reader of what
ForeFlight Mobile Legends
 ForeFlight Mobile Legends ForeFlight, LLC 11th Edition - Covers ForeFlight Mobile v8.1 and later RADAR LEGENDS (WHEN FROM INTERNET) Snowy/Icy Precipitation Mixed Precipitation Rain Echo top (in 100 s of
Science Olympiad Meteorology Quiz #2 Page 1 of 8
 1) The prevailing general direction of the jet stream is from west to east in the northern hemisphere: 2) Advection is the vertical movement of an air mass from one location to another: 3) Thunderstorms
ENSTROM 480B OPERATOR S MANUAL AND FAA APPROVED ROTORCRAFT FLIGHT MANUAL SUPPLEMENT GARMIN GDL 69AH XM WX SATELLITE WEATHER/RADIO RECEIVER
 ENSTROM 480B OPERATOR S MANUAL AND FAA APPROVED ROTORCRAFT FLIGHT MANUAL SUPPLEMENT GARMIN GDL 69AH XM WX SATELLITE WEATHER/RADIO RECEIVER * * * * * REPORT NO. 28-AC-062 HELICOPTER SERIAL NO. HELICOPTER
AERODROME METEOROLOGICAL OBSERVATION AND FORECAST STUDY GROUP (AMOFSG)
") AMOFSG/9-SN No. 31 22/8/11 AERODROME METEOROLOGICAL OBSERVATION AND FORECAST STUDY GROUP (AMOFSG) NINTH MEETING Montréal, 26 to 30 September 2011 Agenda Item 5: Observing and forecasting at the aerodrome
AMOFSG/9-SN No. 31 22/8/11 AERODROME METEOROLOGICAL OBSERVATION AND FORECAST STUDY GROUP (AMOFSG) NINTH MEETING Montréal, 26 to 30 September 2011 Agenda Item 5: Observing and forecasting at the aerodrome
AVIATION WEATHER STUDENT GUIDE
 NAVAL AIR TRAINING COMMAND NAS CORPUS CHRISTI, TEXAS CNATRA P-559 (New 09-08) AVIATION WEATHER STUDENT GUIDE MULTI-ENGINE 2008 DEPA TENT OF HE NAVY Cl-fiEF OF' AVAL AIR TRAJNI G CNA 200 LEXINGlQ BL:VD
Unit: Weather Study Guide
 Name: Period: Unit: Weather Study Guide Define each vocabulary word on a separate piece of paper or index card. Weather Climate Temperature Wind chill Heat index Sky conditions UV index Visibility Wind
MET Lecture 34 Downbursts
 MET 4300 Lecture 34 Downbursts Downbursts A strong downdraft that originates within the lower part of a cumulus cloud or thunderstorms and spreads out at the surface Downbursts do not require strong thunderstorms
ES1 Investigating Weather Maps/Station Models Act# 10 Name Block Date
 yay, bonus pt. because oops, no HO, book, heading this date =MP ES1 Investigating Weather Maps/Station Models Act# 10 Name Block Date Weather INTRODUCTION: Weather maps combine meteorological data from
1. Which weather map symbol is associated with extremely low air pressure? A) B) C) D) 2. The diagram below represents a weather instrument.
 B) C) D) 2. The diagram below represents a weather instrument.") 1. Which weather map symbol is associated with extremely low air pressure? 2. The diagram below represents a weather instrument. Which weather variable was this instrument designed to measure? A) air pressure
1. Which weather map symbol is associated with extremely low air pressure? 2. The diagram below represents a weather instrument. Which weather variable was this instrument designed to measure? A) air pressure
Sources of Hourly Surface Data and Weather Maps for the U.S.
 Sources of Hourly Surface Data and Weather Maps for the U.S. Weather Underground Weather Underground http://www.wunderground.com/history/ maintains a deep archive of hourly reports for around the world.
Calculates CAT and MWT diagnostics. Paired down choice of diagnostics (reduce diagnostic redundancy) Statically weighted for all forecast hours
 Statically weighted for all forecast hours") 1 Major Upgrades All diagnostics mapped to Eddy Dissipation Rate ADDS now displays EDR values CAT diagnostic extended down to 1000 feet MSL & forecast hours 15 and 18 New Mountain Wave diagnostic CAT diagnostics
1 Major Upgrades All diagnostics mapped to Eddy Dissipation Rate ADDS now displays EDR values CAT diagnostic extended down to 1000 feet MSL & forecast hours 15 and 18 New Mountain Wave diagnostic CAT diagnostics
TAIWIN: Operational Concept Review
 TAIWIN: Operational Concept Review S.D. Green November 19, 2015 Overview Changes to FAR Parts 25 and 33 including FAR 25.1420 and Appendix O, will allow limited icing certification for transport category
Lab 19.2 Synoptic Weather Maps
 Lab 19.2 Synoptic Weather Maps Name: Partner: Purpose The purpose of this lab is to have you read and interpret the information displayed on synoptic weather maps. You will also learn the techniques used
data manipulation (2)
") Information Science in Action Week 06 data manipulation (2) College of Information Science and Engineering Ritsumeikan University last week: data manipulation (1) the evolution of protocols push vs. pull
Information Science in Action Week 06 data manipulation (2) College of Information Science and Engineering Ritsumeikan University last week: data manipulation (1) the evolution of protocols push vs. pull
Clouds. What they tell us about the weather
 Clouds What they tell us about the weather Spring funnel cloud over Willard, Utah 2003 Cloud coverage 581-586 How to show Cloud Coverage On a weather map meteorologists use circles shaded differently to
FAA-NWS Aviation Weather Weather Policy and Product Transition Panel. Friends and Partners in Aviation Weather October 22, 2014 NOAA NOAA
 FAA-NWS Aviation Weather Weather Policy and Product Transition Panel Friends and Partners in Aviation Weather October 22, 2014 Airplanes have changed. Lockheed Constellation Airbus A380 Aviation weather
and good his flight and take impact on Moderate Icing
 Learning Goals Weather Report Flying has always been about safety and good planning. A good pilot is the one who takes the time to plan his flight and take into account all of the variables. One of the
Gleim Private Pilot FAA Knowledge Test 2015 Edition, 1st Printing Updates July 2015
 Page 1 of 6 Gleim Private Pilot FAA Knowledge Test 2015 Edition, 1st Printing Updates July 2015 NOTE: Deleted text is displayed with a line through it. New text is shown with a blue background. If you
GEN 3.5 METEOROLOGICAL SERVICES
 GEN-3.5-1 3.5.1 RESPONSIBLE SERVICE GEN 3.5 METEOROLOGICAL SERVICES The authority entrusted with the provision of aeronautical meteorological service is the Lithuanian Hydrometeorological Service. Lithuanian
Syllabus details and associated Learning Objectives (A) and EIR METEOROLOGY
 and EIR METEOROLOGY") Syllabus details associated Learning Objectives 050 00 00 00 METEOROLOGY 050 01 00 00 THE ATMOSPHERE 050 01 02 00 Air temperature 050 01 02 04 Lapse rates LO Describe qualitatively quantitatively the temperature
Syllabus details associated Learning Objectives 050 00 00 00 METEOROLOGY 050 01 00 00 THE ATMOSPHERE 050 01 02 00 Air temperature 050 01 02 04 Lapse rates LO Describe qualitatively quantitatively the temperature
The Informed Scheduler
 The Informed Scheduler Thursday, January 21, 2016 1:00 p.m. 2:30 p.m. PRESENTED BY: Vinton Brown, Flight Safety International James M. Kohler, Chief Pilot, DuPont Andrew M. Bourland, CAM, Chief Pilot,
AVIATION WEATHER STUDENT GUIDE
 NAVAL AIR TRAINING COMMAND NAS CORPUS CHRISTI, TEXAS CNATRA P-770 (New 07-15) AVIATION WEATHER STUDENT GUIDE PRIMARY 2015 AVIATION WEATHER STUDENT GUIDE PRIMARY P-770 iii THIS PAGE INTENTIONALLY LEFT
What Is the Weather Like in Different Regions of the United States?
 Learning Set 1 What Is Weather, and How Is It Measured and Described? 1.3 Explore What Is the Weather Like in Different Regions of the United States? trends: patterns or tendencies you can see over a broad
Answers to Clicker Questions
 Answers to Clicker Questions Chapter 1 What component of the atmosphere is most important to weather? A. Nitrogen B. Oxygen C. Carbon dioxide D. Ozone E. Water What location would have the lowest surface
GEN 3.5 METEOROLOGICAL SERVICES
 AIP GEN 3.5-1 GEN 3.5 METEOROLOGICAL SERVICES 1. RESPONSIBLE SERVICE The meteorological services for civil aviation at Jordan are provided by the Jordanian Meteorological Department. Postal Address: Director
Appendix X for CAP 437 Offshore Helicopter Landing Areas Guidance on Standards.
 Appendix X for CAP 437 Offshore Helicopter Landing Areas Guidance on Standards. Additional Guidance relating to the provision of Meteorological Information from Offshore Installations 1. Introduction This
Wind direction measures in degrees Occasion described with codes, when is calm or variable wind. Explanation
 Introduction The searching results explanations of meteorological data Depending on the parameter, the instrumental measuring or visual observation method is used for the meteorological observations. Instrumentally
MACIS documentation. a. Temporal resolution: For each month and the hole year
 MACIS documentation Wind: 1. Relative frequency of mean wind speed b. Treshold values: mean wind speed greater, greater equal, less, less equal 3, 5, 10, 12, 15 20, 22, 25 kt 2. Relative frequency of gusts
Introduction to SIGMET. 28 June 2016 Japan Meteorological Agency
 Introduction to SIGMET 28 June 2016 Japan Meteorological Agency SIGMET Definition SIGMET information Information issued by a meteorological watch office concerning the occurrence or expected occurrence
Sources of Hourly Surface Data and Weather Maps for the U.S.
 Sources of Hourly Surface Data and Weather Maps for the U.S. Weather Underground Weather Underground http://www.wunderground.com/history/ maintains a deep archive of hourly reports for around the world.
Pilots watch the clouds, because clouds can indicate the kind of weather in store for a flight.
 Low stratus Cumulonimbus Pilots watch the clouds, because clouds can indicate the kind of weather in store for a flight. FILL IN THE BLANKS OR CIRCLE ONE: A. Stratus means flat or on one level. Low stratus
Analyzing Severe Weather Data
 Chapter Weather Patterns and Severe Storms Investigation A Analyzing Severe Weather Data Introduction Tornadoes are violent windstorms associated with severe thunderstorms. Meteorologists carefully monitor
Severe Icing Severe or Extreme Turbulence Dust storms and/or sand storms lowering visibilities to less than three (3) miles Volcanic Ash
 miles Volcanic Ash") SIGMETs A SIGMET advises of weather, other than convective activity, that is potentially hazardous to all aircraft. SIGMETs are issued (for the lower 48 states and adjacent coastal waters) for the following
SIGMETs A SIGMET advises of weather, other than convective activity, that is potentially hazardous to all aircraft. SIGMETs are issued (for the lower 48 states and adjacent coastal waters) for the following
July 13, 2017 Session #1 In Lieu of the Surface Observation Including EWINS Authority, RTMA, Web Cams, and Remote Observation Systems
 July 13, 2017 Session #1 In Lieu of the Surface Observation Including EWINS Authority, RTMA, Web Cams, and Remote Observation Systems Part 121 Operator Perspective: Equivalent Level of Safety Using Remote
Tuesday, September 13, 16
 Weather Weather State Objectives 4.c, 4.d, 4.h. Discussion What are some ways in which weather affects your everyday life? Discussion What are some ways in which weather affects your everyday life? What
B KMD 550/850 Multi-Function Display Quick Reference For Software Version 01/14 or Later
 F N B KMD 550/850 Multi-Function Display Quick Reference For Software Version 01/14 or Later 12 1 11 2 3 4 10 13 9 6 5 7 1. Brightness Control 2. Data Card 3. Display 4. Available Functions Legend 5. On/Off
THUNDERSTORMS-RISK FACTORS IN AVIATION. CASE STUDY: AREA OF RESPONSABILITY OF THE BUCHAREST- OTOPENI AERODROME ON
 RISCURI ŞI CATASTROFE, NR. XIV, VOL. 17, NR.2/2015 THUNDERSTORMS-RISK FACTORS IN AVIATION. CASE STUDY: AREA OF RESPONSABILITY OF THE BUCHAREST- OTOPENI AERODROME ON 30.06.2009 C. L. ŞCHIOPU 1, NICOLETA
STATION If relative humidity is 60% and saturation vapor pressure is 35 mb, what is the actual vapor pressure?
 STATION 1 Vapor pressure is a measure of relative humidity and saturation vapor pressure. Using this information and the information given in the problem, answer the following question. 1. If relative
Traffic and Weather. Soaring Safety Foundation. Tom Johnson CFIG
 Traffic and Weather Soaring Safety Foundation Tom Johnson CFIG Weather Contents Weather Gathering Sources Weather Acquisition Enroute Weather Analysis Weather Hazards Weather in the Landing Pattern Basic
Marine Weather Primer
 1 of 73 Marine Weather Primer Mark A. Thornton LakeErieWX: Marine Weather Education and Forecasting Resources Mark@LakeErieWX.com 2 of 73 3 of 73 Marine Weather Seminars & Workshops Learn a little meteorology
5.04 Clouds and Fog. References: FTGU pages , 147. Meteorology
 5.04 Clouds and Fog References: FTGU pages 124-126, 147 Meteorology 5.04 Clouds and Fog MTPs: Cloud Classification Types and Recognition Associated Precipitation Fog Formation and Types Cloud Classification
Use of lightning data to improve observations for aeronautical activities
 Use of lightning data to improve observations for aeronautical activities Françoise Honoré Jean-Marc Yvagnes Patrick Thomas Météo_France Toulouse France I Introduction Aeronautical activities are very
U.S. Aviation Meteorology
 U.S. Aviation Meteorology U.S. Aviation Meteorology FAA is U.S. Meteorological Authority for Aviation FAA and NWS share costs and ownership of observation systems ASOS/METAR Weather Radar ITWS NWS is U.S.
Fort Rucker Wx Operations
 Spring & Summer Weather Hazards Fort Rucker Wx Operations Overview Hours of Operation OWS vs FRWXOPS Products Services Climatology Seasonal Patterns Seasonal Hazards Hours of Operation Observing 24/7 (automated)
Atmospheric Moisture. Atmospheric Moisture:Clouds. Atmospheric Moisture:Clouds. Atmospheric Moisture:Clouds
 Sec A Atmospheric Moisture I. Measuring Relative Humidity A. A Psychrometer is an instrument for measuring relative humidity B. A common psychrometer uses two thermometers with a wet gauze wrapped over
Sport / Private Ground School. Lesson 7 Weather Products
 Sport / Private Ground School Lesson 7 Weather Products Weather Types Text Weather Actual Condi=ons Forecasts Graphical Weather Current Condi=ons Forecasts Text Weather Notes Winds are reported in reference
AERODROME METEOROLOGICAL OBSERVATION AND FORECAST STUDY GROUP (AMOFSG)
") 24/4/13 AERODROME METEOROLOGICAL OBSERVATION AND FORECAST STUDY GROUP (AMOFSG) TENTH MEETING Montréal, 17 to 19 June 2013 Agenda Item 6: Forecasting at the aerodrome and in the terminal area and ATIS requirements
24/4/13 AERODROME METEOROLOGICAL OBSERVATION AND FORECAST STUDY GROUP (AMOFSG) TENTH MEETING Montréal, 17 to 19 June 2013 Agenda Item 6: Forecasting at the aerodrome and in the terminal area and ATIS requirements