Why rainfall may reduce when the ocean warms
|
|
|
- Victor Reynolds
- 5 years ago
- Views:
Transcription

1 Why rainfall may reduce when the ocean warms Tim Hewson*, Ian Boutle** and Benedetta Dini** *ECMWF, Reading, UK **Met Office, Exeter, UK Work mainly undertaken at the Met Office Slide 1

2 Contents Introduction and hypothesis Components to test the hypothesis: 1. Ensemble runs 2. Idealised runs 3. Observations Summary and implications

3 Introduction and hypothesis


4 January mean SST and 10m winds from ERA Interim

5 July mean SST and 10m winds from ERA Interim
6 Motivation Airmasses that arrive in NW Europe have usually spent a long time over the ocean prevailing winds are west to southwesterly So, to what extent are characteristics of those airmasses ie weather - determined by the ocean temperature? Air temperature in the eastern north Atlantic is closely correlated with sea surface temperature (SST) it is well documented that the average temperature difference here between Sea and Air is small, and that this varies little But what about SST influences on humidity, and the direct impact that may have on cloudiness and rainfall (and the additional indirect impact, then, on air temperature over land)?
7 Relative Humidity Some classical ideas cite Clausius-Clapeyron (specific humidity at saturation increases with T) as evidence that warmer oceans may lead to higher rainfall But Simmons et al (JGR 2010) found that rainfall in Europe correlates more closely with relative humidity (RH) than with specific humidity (q) (both measured at screen level) So if relative humidity decreases as the ocean warms we could see a reduction in rainfall, even if specific humidity increases
 along the incoming airmass trajectory can influence boundary layer relative humidity, and thereby")

 Scenario 2 ( Cold east Atlantic ) Scenario 3 ( Warm east Atlantic )")
8 Hypothesis cloud and rain are favoured downwind of anomalously cold SSTs We propose that the gradient in SST (anomaly) along the incoming airmass trajectory can influence boundary layer relative humidity, and thereby cloud base, cloudiness and rainfall Illustrative profiles: Structure of middle and upper troposphere assumed to depend primarily on synoptic scale systems Atmospheric profile at start of NE ward bound trajectory towards UK (T & Td) 600mb Lower tropospheric temperature profiles at end of trajectory across ocean (Td unchanged) in: Scenario 1 ( Neutral SST anomalies ) Scenario 2 ( Cold east Atlantic ) Scenario 3 ( Warm east Atlantic ) 1000mb ~6 C
9 Possible tests of the hypothesis 1) Operational ensemble runs with different SSTs 2) Idealised numerical model simulations 3) Observational studies 4) Examine re-forecast climatology as a fn. of SST pattern 5) Single column model simulations not yet But we want to capture the myriad of possible atmospheric configurations for the incoming airmasses, as they pass over the ocean makes (5) difficult, and potentially risky (1) to (4) are much better in this regard
10 1. Ensemble runs with different SSTs


11 ECMWF forecasts for week 2 (day 12-18) ensemble means (50 members). DT 2 Jul 09. OPER SST PPN MSLP cloud and rain are favoured downwind of anomalously cold SSTs, and vice-versa ~0.5 C / 1000km reduction C mm mb 30% increase in total ppn RERUN WITH OBSERVED SST OBS OBS
12 2. Idealised numerical model simulations
 for cyclone/front simulation ~40km resolution, full model physics SST = fn (latitude), prescribed, and evolving in a simple way, to simulate passage W to E of a typical N Atlantic cyclone")
13 Experiment Design Use a different model the Met Office Unified model - in an idealised channel, mid-latitude, over-ocean configuration, with periodic W-E boundary conditions (following Boutle, BL Met, 2010) for cyclone/front simulation ~40km resolution, full model physics SST = fn (latitude), prescribed, and evolving in a simple way, to simulate passage W to E of a typical N Atlantic cyclone and its fronts Initialisation: Upper level (westerly) jet core, zero surface wind, surface air temperature = SST, thermal wind balance RH=fn(z), tapers down from 80% at surface (based on re-analysis climatologies) Temperature perturbation applied at all levels helps trigger cyclone development ~3 days to spin up, analyse later times SST evolution is key


14 SST configuration Real SST example from Nov 2012 LAT 70N Simulation Later in simulation analagous to E - weaker gradients - warmer ~4 C 30N SST Start of simulation analagous to W - strong gradients
15 SST evolution Day 0 : Western set up, atmosphere in balance with SST Day 0 3 : Linear evolution of SST towards Eastern set up (atmosphere evolves above cyclone spins up due to baroclinic instability) Day 3+ : Eastern SST pattern persisted, atmosphere continues to evolve 3 cases run Neutral, Warm East Atlantic, Cold East Atlantic 0 3
 Neutral")
16 SST (day 3+) and mslp (day 3) Neutral case
")


17 SST (day 3+) and mslp (day 3) Cold E Atlantic Strong gradient In SST along incoming airmass trajectory

18 SST (day 3+) and mslp (day 3) Warm E Atlantic Weak gradient In SST along incoming airmass trajectory
19 Temporal evolution MSLP and total ppn rate -Neutral SST case Average large scale ppn rate all runs Cold E Atlantic Neutral Warm E Atlantic mm/hr 4 7
20 Day 4 Warm E Atlantic MSLP and large scale ppn rate MSLP and average RH in lowest 1km


21 Day 4 Cold E Atlantic MSLP and large scale ppn rate MSLP and average RH in lowest 1km


22 Day 7 Warm E Atlantic MSLP and large scale ppn rate MSLP and average RH in lowest 1km


23 Day 7 Cold E Atlantic MSLP and large scale ppn rate MSLP and average RH in lowest 1km
 Day 4 Theta-w")

24 46 N Cross-Sections (W-E) Day 4 Theta-w and RH Warm E Atlantic Theta-w and Ppn rate

25 46 N Cross-Sections (W-E) Day 4 Theta-w and RH Cold E Atlantic Theta-w and Ppn rate

26 46 N Cross-Sections (W-E) Day 7 Theta-w and RH Warm E Atlantic Theta-w and Ppn rate

27 46 N Cross-Sections (W-E) Day 7 Theta-w and RH Cold E Atlantic Theta-w and Ppn rate
28 Fluxes - profiles just on warm side of cold front - day 5, 47N SST Fluxes derived from turbulence in BL scheme Moistening in q Cooling propogates upwards Condensation on ocean surface
29 Resumé of simulations Initially surface fluxes are strong, due to developing advection related to cyclogenesis, and due to evolving SSTs; later on fluxes reduce generally as the atmosphere re-harmonizes with the ocean In C, due to a greater warm sector sensible heat flux into the ocean, the lower troposphere is cooler than in W, but this also means that RH in C stays higher in the warm sector, with more low cloud and lower cloud bases in C as a result In W there is more advection of dry near surface air (RH) into the frontal zone, by the frictionally-turned low level wind, which would elevate the level of latent heat release in forced frontal ascent Due to high RH in C ppn intensity tends to increase downwards, via accretion; in W it remains relatively constant or reduces downwards via evaporation Greater sensible heat fluxes upward into the cold post-front air in W, because of higher SSTs, help to reduce the frontal thermal gradient markedly compared to C, and so inhibit any tendency for frontogenetically-forced ascent in W Ppn intensity initially is similar in C and W, but later on, as a result of all of the above, ppn activity dies more rapidly in the W case Pressure rises occur as the fronts tend to weaken in both cases W is the Warm East Atlantic case C is the Cold East Atlantic case
30 Key Points In the zone well south of the cyclone track (which is the zone that typically would affect much of NW Europe): Throughout the simulation lower tropospheric RH (and so low cloud) is greater when the ocean is colder Earlier in the simulation, when the cyclone is still developing, rainfall rates are similar in both SST scenarios Later in the simulation, when the parent cyclone has matured, and MSLP is rising, in the warm ocean case the trailing cold front dies more rapidly and precipitation rates are lower So can we see any of the above in real observations?...
31 3. Observational study
")
 Statistical tests were")
 for the higher pressure categories Average RH, lowest km, Valentia (higher pressure category) sondes DATA B")
32 Results briefly summarised: Used 38 years of radiosonde, rainfall and SST data (SST = Hadley Centre monthly means) Strong support for the findings from the numerical model study Boundary layer RH distribution depends strongly on SST upstream Small SST anomalies (<1C) are important Precipitation also relates to SST upstream 26% more wet days (>10mm) for cold E Atlantic scenario, despite pressure not being any lower Signals are stronger for categories of higher MSLP (analogous to later in the model runs) Statistical tests were applied to the distributions (Kolmogorov-Smirnov): distributions were significantly different (at > 99.95% confidence level) for the higher pressure categories Average RH, lowest km, Valentia (higher pressure category) sondes DATA B warmer than A B colder than A in SST anomaly terms

33 SST anomaly difference vs MSLP


")


34 Example histograms COLD E Valentia RH lowest 1km (all four mslp categories) COLD E NEUTRAL WARM E moister WARM E Midlands Rainfall (two highest mslp categories) wetter

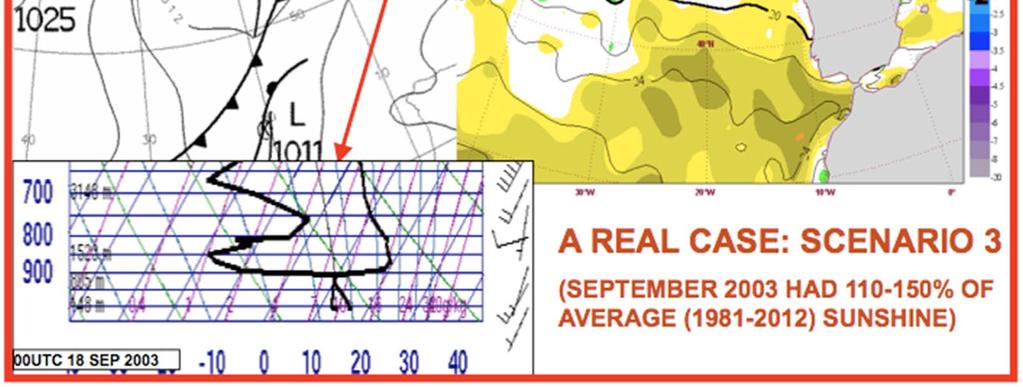
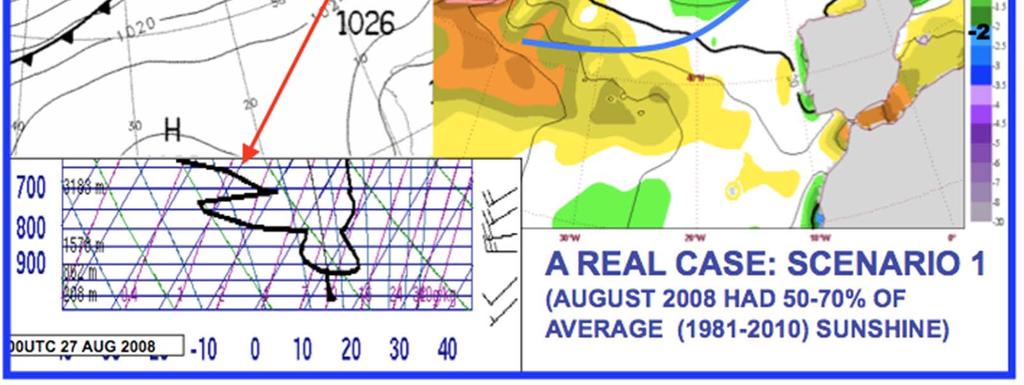
35 Example Warm E Atlantic

36 Example Cold E Atlantic
37 Summary

38 Summary hypothesis accepted! Results from studies of observational data, of ensemble runs with changed boundary conditions, and of idealised cyclone simulations all suggest the following influence of SST anomalies on weather in NW Europe, when winds blow from their prevailing west to southwesterly direction : More (low) cloud Lower cloud bases More wet days Less sunshine Colder days Less (low) cloud Higher cloud bases Fewer wet days More sunshine Warmer days

39 Mechanisms and discussion The primary mechanism seems to be the extra cooling of the boundary layer in the C case which simultaneously increases relative humidity Also, from a dynamical standpoint, collapse of trailing cold fronts appears to be promoted more in the W case Focus has mainly been on large scale rainfall, not convective. One might expect convective to be greater in the W case, and to be relevant for coastal regions with onshore flow (as in Persson et al, MWR, 2005, California, & Lenderink et al, Clim Dyn, 2009, Netherlands). However, simulations suggested that convective rainfall was not always greater in the W case, and in the observational study it was implicitly included, yet a signal still emerged. Geography such as coastal orientation, is probably very important. There may also be positive (and negative?) feedbacks between atmosphere and SST (and soil moisture, etc) not considered in this talk This work also highlights the importance of correct SST representation for long range predictions, and so may, in due course, help unlock some long range predictability in rainfall Sub-surface ocean temperatures also play a key role, as they modulate SST response to atmospheric forcing. These need also to be measured and correctly initialised in models Two-way atmosphere-ocean coupling from day 0 may also be beneficial for shorter range weather forecasts small SST changes (<1C) make a difference. Coming very soon to the ECMWF ENS (but not yet to HRES) W is the Warm East Atlantic case C is the Cold East Atlantic case
40
 as evidence that warmer oceans may lead to higher rainfall RELATED EXAMPLE from")

41 Specific Humidity Some classical ideas cite Clausius-Clapeyron (specific humidity at saturation increases with T) as evidence that warmer oceans may lead to higher rainfall RELATED EXAMPLE from Lenderink et al (Clim Dyn, 2009): -Aug 2006 SST (left) SST -2C -Cyclonic, convective NW ly regime -Ppn over Netherlands -Short range forecast simulations, with different SSTs SST anomaly -24h totals summed (T+12 to T+36)
42 Temporal evolution MSLP and total ppn rate -Neutral SST case Closer to low track -analogous to S Norway Average large scale ppn rate all runs Cold E Atlantic Neutral Warm E Atlantic mm/hr

43 Evolving SST in the ECMWF Ensemble Stippling shows where SST differences compared to uncoupled runs are greater than 1C (day 10)..
44 Vertical Ocean temperature profiles in IFS spring / early summer example ~5C Ocean surface Reality Anomalous heat storage =ocean model level Coupling is better but SST change may be too slow in certain situations ~10m Current EPS Response to cooling from above temperature
45 Some Tips? Watch out for differences between Control and calval=3 uncoupled control Precipitation / RH / cloud cover / cloud base may all vary at times, even for the same synoptic pattern Biggest influence of coupling likely in spring when large vertical sea temperature gradients can develop Watch out also for SST reduction being too slow in spring time after a warm spell (due to 10m upper level)
Boundary layer controls on extratropical cyclone development
 Boundary layer controls on extratropical cyclone development R. S. Plant (With thanks to: I. A. Boutle and S. E. Belcher) 28th May 2010 University of East Anglia Outline Introduction and background Baroclinic
CHAPTER 2 - ATMOSPHERIC CIRCULATION & AIR/SEA INTERACTION
 Chapter 2 - pg. 1 CHAPTER 2 - ATMOSPHERIC CIRCULATION & AIR/SEA INTERACTION The atmosphere is driven by the variations of solar heating with latitude. The heat is transferred to the air by direct absorption
and 24 mm, hPa lapse rates between 3 and 4 K km 1, lifted index values
 3.2 Composite analysis 3.2.1 Pure gradient composites The composite initial NE report in the pure gradient northwest composite (N = 32) occurs where the mean sea level pressure (MSLP) gradient is strongest
Seasonal Climate Watch January to May 2016
 Seasonal Climate Watch January to May 2016 Date: Dec 17, 2015 1. Advisory Most models are showing the continuation of a strong El-Niño episode towards the latesummer season with the expectation to start
Why There Is Weather?
 Lecture 6: Weather, Music Of Our Sphere Weather and Climate WEATHER The daily fluctuations in atmospheric conditions. The atmosphere on its own can produce weather. (From Understanding Weather & Climate)
TROPICAL-EXTRATROPICAL INTERACTIONS
 Notes of the tutorial lectures for the Natural Sciences part by Alice Grimm Fourth lecture TROPICAL-EXTRATROPICAL INTERACTIONS Anomalous tropical SST Anomalous convection Anomalous latent heat source Anomalous
3. Midlatitude Storm Tracks and the North Atlantic Oscillation
 3. Midlatitude Storm Tracks and the North Atlantic Oscillation Copyright 2006 Emily Shuckburgh, University of Cambridge. Not to be quoted or reproduced without permission. EFS 3/1 Review of key results
ESCI 344 Tropical Meteorology Lesson 7 Temperature, Clouds, and Rain
 ESCI 344 Tropical Meteorology Lesson 7 Temperature, Clouds, and Rain References: Forecaster s Guide to Tropical Meteorology (updated), Ramage Tropical Climatology, McGregor and Nieuwolt Climate and Weather
ATSC 2000 Final Fall 2005
 ATSC 2000 Final Fall 2005 true/false /25 multiple choice /25 short answer /23 essay /10 total /83 or % True/False Indicate whether the sentence or statement is true or false. (25 questions 1% each) 1.
Large-Eddy Simulations of Tropical Convective Systems, the Boundary Layer, and Upper Ocean Coupling
 DISTRIBUTION STATEMENT A. Approved for public release; distribution is unlimited. Large-Eddy Simulations of Tropical Convective Systems, the Boundary Layer, and Upper Ocean Coupling Eric D. Skyllingstad
Why the Atlantic was surprisingly quiet in 2013
 1 Why the Atlantic was surprisingly quiet in 2013 by William Gray and Phil Klotzbach Preliminary Draft - March 2014 (Final draft by early June) ABSTRACT This paper discusses the causes of the unusual dearth
3) What is the difference between latitude and longitude and what is their affect on local and world weather and climate?
 What is the difference between latitude and longitude and what is their affect on local and world weather and climate?") www.discoveryeducation.com 1) Describe the difference between climate and weather citing an example of each. Describe how water (ocean, lake, river) has a local effect on weather and climate and provide
www.discoveryeducation.com 1) Describe the difference between climate and weather citing an example of each. Describe how water (ocean, lake, river) has a local effect on weather and climate and provide
Divergence, Spin, and Tilt. Convergence and Divergence. Midlatitude Cyclones. Large-Scale Setting
 Midlatitude Cyclones Equator-to-pole temperature gradient tilts pressure surfaces and produces westerly jets in midlatitudes Waves in the jet induce divergence and convergence aloft, leading to surface
Transient/Eddy Flux. Transient and Eddy. Flux Components. Lecture 7: Disturbance (Outline) Why transients/eddies matter to zonal and time means?
 Why transients/eddies matter to zonal and time means?") Lecture 7: Disturbance (Outline) Transients and Eddies Climate Roles Mid-Latitude Cyclones Tropical Hurricanes Mid-Ocean Eddies (From Weather & Climate) Flux Components (1) (2) (3) Three components contribute
Lecture 7: Disturbance (Outline) Transients and Eddies Climate Roles Mid-Latitude Cyclones Tropical Hurricanes Mid-Ocean Eddies (From Weather & Climate) Flux Components (1) (2) (3) Three components contribute
Page 1. Name:
 Name: 1) As the difference between the dewpoint temperature and the air temperature decreases, the probability of precipitation increases remains the same decreases 2) Which statement best explains why
MAURITIUS METEOROLOGICAL SERVICES
 MAURITIUS METEOROLOGICAL SERVICES CLIMATE SEPTEMBER 2018 Introduction Synoptic weather pattern over the region portrayed September as a transition month. The month started with wintry characteristics.
Wind: Global Systems Chapter 10
 Wind: Global Systems Chapter 10 General Circulation of the Atmosphere General circulation of the atmosphere describes average wind patterns and is useful for understanding climate Over the earth, incoming
Lec 10: Interpreting Weather Maps
 Lec 10: Interpreting Weather Maps Case Study: October 2011 Nor easter FIU MET 3502 Synoptic Hurricane Forecasts Genesis: on large scale weather maps or satellite images, look for tropical waves (Africa
Hurricanes. April 14, 2009
 Tropical Weather & Hurricanes Chapter 15 April 14, 2009 Tropical meteorology Tropics characterized by seasonal wet and drier periods- wet when sun is nearly overhead at noon and inter-tropical convergence
Forecasting Local Weather
 Forecasting Local Weather Sea/Land Breeze Temperature Dew Fog Frost Snow Thunderstorms Tropical Cyclones Temperatures: Radiation Balance Typical Diurnal Variation of Temperature Min soon after dawn Temp
The Planetary Circulation System
 12 The Planetary Circulation System Learning Goals After studying this chapter, students should be able to: 1. describe and account for the global patterns of pressure, wind patterns and ocean currents
Atmospheric Circulation
 Atmospheric Circulation Introductory Oceanography Instructor: Ray Rector Atmospheric Circulation Key Topics Composition and Structure Solar Heating and Convection The Coriolis Effect Global Wind Patterns
1 What Is Climate? TAKE A LOOK 2. Explain Why do areas near the equator tend to have high temperatures?
 CHAPTER 17 1 What Is Climate? SECTION Climate BEFORE YOU READ After you read this section, you should be able to answer these questions: What is climate? What factors affect climate? How do climates differ
University of Reading, Reading, United Kingdom. 2 Hadley Centre for Climate Prediction and Research, Meteorological Office, Exeter, United Kingdom.
 9.1 RUNNING A CLIMATE MODEL IN FORECAST MODE TO IDENTIFY THE SOURCE OF TROPICAL CLIMATE ERRORS: WITH SPECIFIC REFERENCE TO THE DRY BIAS OVER THE MARITIME CONTINENT IN AN ATMOSPHERE ONLY GCM 1 Jane Strachan,
ENSO Outlook by JMA. Hiroyuki Sugimoto. El Niño Monitoring and Prediction Group Climate Prediction Division Japan Meteorological Agency
 ENSO Outlook by JMA Hiroyuki Sugimoto El Niño Monitoring and Prediction Group Climate Prediction Division Outline 1. ENSO impacts on the climate 2. Current Conditions 3. Prediction by JMA/MRI-CGCM 4. Summary
Storm and Storm Systems Related Vocabulary and Definitions. Magnitudes are measured differently for different hazard types:
 Storm and Storm Systems Related Vocabulary and Definitions Magnitude: this is an indication of the scale of an event, often synonymous with intensity or size. In natural systems, magnitude is also related
Chapter outline. Reference 12/13/2016
 Chapter 2. observation CC EST 5103 Climate Change Science Rezaul Karim Environmental Science & Technology Jessore University of science & Technology Chapter outline Temperature in the instrumental record
Forecasting Weather: Air Masses and Fronts
 Forecasting Weather: Air Masses and Fronts Weather is a combination of local conditions at any one time. It's what's happening outside right now, right here. Weather includes: Temperature Humidity Air
What a Hurricane Needs to Develop
 Weather Weather is the current atmospheric conditions, such as air temperature, wind speed, wind direction, cloud cover, precipitation, relative humidity, air pressure, etc. 8.10B: global patterns of atmospheric
Transient and Eddy. Transient/Eddy Flux. Flux Components. Lecture 3: Weather/Disturbance. Transient: deviations from time mean Time Mean
 Lecture 3: Weather/Disturbance Transients and Eddies Climate Roles Mid-Latitude Cyclones Tropical Hurricanes Mid-Ocean Eddies Transient and Eddy Transient: deviations from time mean Time Mean Eddy: deviations
Observation Homework Due 11/24. Previous Lecture. Midlatitude Cyclones
 Lecture 21 Midlatitude Cyclones Observation Homework Due 11/24 1 2 Midlatitude Cyclones Midlatitude Cyclone or Winter Storm Cyclogenesis Energy Source Life Cycle Air Streams Vertical Structure Storm Hazards
Chapter 24. Tropical Cyclones. Tropical Cyclone Classification 4/19/17
 Chapter 24 Tropical Cyclones Tropical Cyclones Most destructive storms on the planet Originate over tropical waters, but their paths often take them over land and into midlatitudes Names Hurricane (Atlantic
Crux of AGW s Flawed Science (Wrong water-vapor feedback and missing ocean influence)
") 1 Crux of AGW s Flawed Science (Wrong water-vapor feedback and missing ocean influence) William M. Gray Professor Emeritus Colorado State University There are many flaws in the global climate models. But
1 Crux of AGW s Flawed Science (Wrong water-vapor feedback and missing ocean influence) William M. Gray Professor Emeritus Colorado State University There are many flaws in the global climate models. But
4/29/2011. Mid-latitude cyclones form along a
 Chapter 10: Cyclones: East of the Rocky Mountain Extratropical Cyclones Environment prior to the development of the Cyclone Initial Development of the Extratropical Cyclone Early Weather Along the Fronts
WEATHER. Review Note Cards
 WEATHER Review Note Cards Thermometer Weather instrument that measures air temperature Units include F, C, and K ESRT 13 Sling Psychrometer Weather instrument that measures relative humidity and dewpoint
Lecture 7: The Monash Simple Climate
 Climate of the Ocean Lecture 7: The Monash Simple Climate Model Dr. Claudia Frauen Leibniz Institute for Baltic Sea Research Warnemünde (IOW) claudia.frauen@io-warnemuende.de Outline: Motivation The GREB
ESCI 241 Meteorology Lesson 19 Tropical Cyclones Dr. DeCaria
 ESCI 241 Meteorology Lesson 19 Tropical Cyclones Dr. DeCaria READING: Chapter 16 GENERAL A tropical cyclone is a large, low-pressure system that forms over the tropical oceans. Tropical cyclones are classified
1 What Is Climate? TAKE A LOOK 2. Explain Why do areas near the equator tend to have high temperatures?
 CHAPTER 17 1 What Is Climate? SECTION Climate BEFORE YOU READ After you read this section, you should be able to answer these questions: What is climate? What factors affect climate? How do climates differ
P R O L O G U E CORRELATION COEF. dsst/dt during wintertime (i.e., end of Feb. minus beginning of Dec, using 11-day averaged climatology)
") P R O L O G U E dsst/dt during wintertime (i.e., end of Feb. minus beginning of Dec, using 11-day averaged climatology) Correlation between total precipitable water (from NVAP-M) and total cloud (from
P R O L O G U E dsst/dt during wintertime (i.e., end of Feb. minus beginning of Dec, using 11-day averaged climatology) Correlation between total precipitable water (from NVAP-M) and total cloud (from
ESCI 344 Tropical Meteorology Lesson 11 Tropical Cyclones: Formation, Maintenance, and Intensification
 ESCI 344 Tropical Meteorology Lesson 11 Tropical Cyclones: Formation, Maintenance, and Intensification References: A Global View of Tropical Cyclones, Elsberry (ed.) Global Perspectives on Tropical Cylones:
Will a warmer world change Queensland s rainfall?
 Will a warmer world change Queensland s rainfall? Nicholas P. Klingaman National Centre for Atmospheric Science-Climate Walker Institute for Climate System Research University of Reading The Walker-QCCCE
6. State two factors and explain how each influences the weather in Ohio. Respond in the space provided in your Answer Document.
 6. State two factors and explain how each influences the weather in Ohio. Respond in the space provided in your Answer Document. (4 points) Sample Response for Item 6 (Extended Response): Other Correct
Quasi-Geostrophic Implications
 Chapter 10 Quasi-Geostrophic Implications When you look at a weather chart with all its isolines and plotted data, you need a framework upon which to interpret what you see. Quasi-geostrophic theory provides
Diabatic processes and the structure of the warm conveyor belt
 2 nd European Windstorm Workshop Leeds, 3-4 September 2012 Diabatic processes and the structure of the warm conveyor belt Oscar Martínez-Alvarado J. Chagnon, S. Gray, R. Plant, J. Methven Department of
Extratropical and Polar Cloud Systems
 Extratropical and Polar Cloud Systems Gunilla Svensson Department of Meteorology & Bolin Centre for Climate Research George Tselioudis Extratropical and Polar Cloud Systems Lecture 1 Extratropical cyclones
1. Which weather map symbol is associated with extremely low air pressure? A) B) C) D) 2. The diagram below represents a weather instrument.
 B) C) D) 2. The diagram below represents a weather instrument.") 1. Which weather map symbol is associated with extremely low air pressure? 2. The diagram below represents a weather instrument. Which weather variable was this instrument designed to measure? A) air pressure
1. Which weather map symbol is associated with extremely low air pressure? 2. The diagram below represents a weather instrument. Which weather variable was this instrument designed to measure? A) air pressure
AIR MASSES SOURCE REGION CHARACTERISTICS Continental Arctic (ca) Greenland, Antarctica, Highest latitudes of Asia and North America
 Greenland, Antarctica, Highest latitudes of Asia and North America") GEOGRAPHY CLIMATOLOGY AIRMASS, FRONT AND TEMPERATE CYCLONE AIRMASS A large body of air having little horizontal variation in temperature and moisture is called an airmass. Airmass acquires its properties
GEOGRAPHY CLIMATOLOGY AIRMASS, FRONT AND TEMPERATE CYCLONE AIRMASS A large body of air having little horizontal variation in temperature and moisture is called an airmass. Airmass acquires its properties
Lecture 5: Atmospheric General Circulation and Climate
 Lecture 5: Atmospheric General Circulation and Climate Geostrophic balance Zonal-mean circulation Transients and eddies Meridional energy transport Moist static energy Angular momentum balance Atmosphere
XC Meteorology. And other bullshit
 XC Meteorology And other bullshit (c) Jim White 2014 Why do Met? Choose whether to turn up Choose best task for day Choose glider configuration Choose pilot configuration! Avoid being in wrong place Achieve
Mid-Latitude Cyclones and Fronts. Lecture 12 AOS 101
 Mid-Latitude Cyclones and Fronts Lecture 12 AOS 101 Homework 4 COLDEST TEMPS GEOSTROPHIC BALANCE Homework 4 FASTEST WINDS L Consider an air parcel rising through the atmosphere The parcel expands as it
F = ma. ATS 150 Global Climate Change Winds and Weather. Scott Denning CSU CMMAP 1. Please read Chapter 6 from Archer Textbook
 Winds and Weather Please read Chapter 6 from Archer Textbook Circulation of the atmosphere and oceans are driven by energy imbalances Energy Imbalances What Makes the Wind Blow? Three real forces (gravity,
Percentage of normal rainfall for April 2018 Departure from average air temperature for April 2018
 New Zealand Climate Update No 227, May 2018 Current climate April 2018 Overall, April 2018 was characterised by lower pressure than normal over and to the southeast of New Zealand. Unlike the first three
3. As warm, moist air moves into a region, barometric pressure readings in the region will generally 1. decrease 2. increase 3.
 Teacher: Mr. Prizzi Castle Learning Review 1 1. Which process most directly results in cloud formation? 1. condensation 3. precipitation 2. transpiration 4. radiation 2. An air mass originating over north
El Niño 2015/2016 Impact Analysis Monthly Outlook February 2016
 El Niño 2015/2016 Impact Analysis Monthly Outlook February 2016 Linda Hirons, Nicolas Klingaman This report has been produced by University of Reading for Evidence on Demand with the assistance of the
5. General Circulation Models
 5. General Circulation Models I. 3-D Climate Models (General Circulation Models) To include the full three-dimensional aspect of climate, including the calculation of the dynamical transports, requires
Hurricanes and Tropical Weather Systems:
 Hurricanes and Tropical Weather Systems: An influence on weather in parts of the USA Meteorology 411 Iowa State University Week 2 Bill Gallus Classification/Terminology Tropical Disturbance enhanced convection
TC/PR/RB Lecture 3 - Simulation of Random Model Errors
 TC/PR/RB Lecture 3 - Simulation of Random Model Errors Roberto Buizza (buizza@ecmwf.int) European Centre for Medium-Range Weather Forecasts http://www.ecmwf.int Roberto Buizza (buizza@ecmwf.int) 1 ECMWF
Atmosphere and Weather Revision Notes
 Atmosphere and Weather Revision Notes Atmosphere The blanket of gases that surrounds the Earth is called the atmosphere. The main gases are nitrogen (78 %), oxygen (21 %), water vapour, ozone and carbon
Weather Systems III: Thunderstorms and Twisters
 Weather Systems III: Thunderstorms and Twisters Review 1. Definition of airmasses? Bergeron classification of air masses 2. Surface weather analysis: Station model, wind speed code, present weather 3.
Diabatic processes and the structure of extratropical cyclones
 Geophysical and Nonlinear Fluid Dynamics Seminar AOPP, Oxford, 23 October 2012 Diabatic processes and the structure of extratropical cyclones Oscar Martínez-Alvarado R. Plant, J. Chagnon, S. Gray, J. Methven
Fronts in November 1998 Storm
 Fronts in November 1998 Storm Much of the significant weather observed in association with extratropical storms tends to be concentrated within narrow bands called frontal zones. Fronts in November 1998
Polar Lows and other High Latitude Weather Systems. John Turner and Tom Bracegirdle British Antarctic Survey Cambridge, UK
 Polar Lows and other High Latitude Weather Systems John Turner and Tom Bracegirdle British Antarctic Survey Cambridge, UK A mosaic of infra-red satellite imagery of the Antarctic and Southern Ocean on
Lecture 14. Extratropical Cyclones extratropical cyclone
 Lecture 14. Extratropical Cyclones In mid-latitudes, much of our weather is associated with a particular kind of storm, the extratropical cyclone Cyclone: circulation around low pressure center Some midwesterners
Global Climate Patterns and Their Impacts on North American Weather
 Global Climate Patterns and Their Impacts on North American Weather By Julie Malmberg and Jessica Lowrey, Western Water Assessment Introduction This article provides a broad overview of various climate
ABSTRACT 1 INTRODUCTION P2G.4 HURRICANE DEFLECTION BY SEA SURFACE TEMPERATURE ANOMALIES.
 P2G.4 HURRICANE DEFLECTION BY SEA SURFACE TEMPERATURE ANOMALIES. M.E. McCulloch, J.T. Heming and J.D. Stark Met Office, Exeter, UK April 23, 2008 ABSTRACT To determine whether hurricane forecasts can be
Name: Regents Earth Science. Weather and Climate - Review Questions
 Name: Regents Earth Science Weather and Climate - Review Questions Date: Thayer - 279 1. People sometimes release substances into the atmosphere to increase the probability of rain by A) raising the air
SUPPLEMENTARY INFORMATION
 Figure S1. Summary of the climatic responses to the Gulf Stream. On the offshore flank of the SST front (black dashed curve) of the Gulf Stream (green long arrow), surface wind convergence associated with
MAURITIUS METEOROLOGICAL SERVICES
 MAURITIUS METEOROLOGICAL SERVICES CLIMATE NOVEMBER 2018 Introduction Climatologically speaking, November is a relatively dry month for Mauritius with a long term monthly mean rainfall of 78 mm. However,
Week: Dates: 3/2 3/20 Unit: Climate
 clementaged.weebly.com Name: EVEN Period: Week: 28 30 Dates: 3/2 3/20 Unit: Climate Monday Tuesday Wednesday Thursday Friday 2 O 3 E *Vocabulary *Water in the Atmosphere and Clouds Notes *Cloud Drawings
ENSO, AO, and climate in Japan. 15 November 2016 Yoshinori Oikawa, Tokyo Climate Center, Japan Meteorological Agency
 ENSO, AO, and climate in Japan 15 November 2016 Yoshinori Oikawa, Tokyo Climate Center, Japan Meteorological Agency Aims of this lecture At the end of the yesterday s lecture, Hare-run said, - In the exercise
Weather and Climate Summary and Forecast November 2017 Report
 Weather and Climate Summary and Forecast November 2017 Report Gregory V. Jones Linfield College November 7, 2017 Summary: October was relatively cool and wet north, while warm and very dry south. Dry conditions
The most abundant gas in the atmosphere by volume is. This gas comprises 78% of the Earth atmosphere by volume.
 The most abundant gas in the atmosphere by volume is. This gas comprises 78% of the Earth atmosphere by volume. A. Oxygen B. Water Vapor C. Carbon Dioxide D. Nitrogen An isobar is a line of constant. A.
PRMS WHITE PAPER 2014 NORTH ATLANTIC HURRICANE SEASON OUTLOOK. June RMS Event Response
 PRMS WHITE PAPER 2014 NORTH ATLANTIC HURRICANE SEASON OUTLOOK June 2014 - RMS Event Response 2014 SEASON OUTLOOK The 2013 North Atlantic hurricane season saw the fewest hurricanes in the Atlantic Basin
Tropical-Extratropical Transition
 Tropical-Extratropical Transition Extratropical Transition A significant number of tropical cyclones move into the midlatitudes and transform into extratropical cyclones. This process is generally referred
Air Masses and Fronts. Ahrens Chapter 12
 Air Masses and Fronts Ahrens Chapter 12 Air Mass Properties Air masses take on the properties of the underlying surface Air masses are classified according to their location of origin Geographical Characteristics
Weather Atmospheric condition in one place during a limited period of time Climate Weather patterns that an area typically experiences over a long
 Weather Atmospheric condition in one place during a limited period of time Climate Weather patterns that an area typically experiences over a long period of time Many factors influence weather & climate
The 2009 Hurricane Season Overview
 The 2009 Hurricane Season Overview Jae-Kyung Schemm Gerry Bell Climate Prediction Center NOAA/ NWS/ NCEP 1 Overview outline 1. Current status for the Atlantic, Eastern Pacific and Western Pacific basins
Description of the ET of Super Typhoon Choi-Wan (2009) based on the YOTC-dataset
 based on the YOTC-dataset") High Impact Weather PANDOWAE Description of the ET of Super Typhoon Choi-Wan (2009) based on the YOTC-dataset ¹, D. Anwender¹, S. C. Jones2, J. Keller2, L. Scheck¹ 2 ¹Karlsruhe Institute of Technology,
High Impact Weather PANDOWAE Description of the ET of Super Typhoon Choi-Wan (2009) based on the YOTC-dataset ¹, D. Anwender¹, S. C. Jones2, J. Keller2, L. Scheck¹ 2 ¹Karlsruhe Institute of Technology,
By: J Malherbe, R Kuschke
 2015-10-27 By: J Malherbe, R Kuschke Contents Summary...2 Overview of expected conditions over South Africa during the next few days...3 Significant weather events (27 October 2 November)...3 Conditions
Vertical structure. To conclude, we will review the critical factors invloved in the development of extratropical storms.
 Vertical structure Now we will examine the vertical structure of the intense baroclinic wave using three visualization tools: Upper level charts at selected pressure levels Vertical soundings for selected
GEOGRAPHY EYA NOTES. Weather. atmosphere. Weather and climate
 GEOGRAPHY EYA NOTES Weather and climate Weather The condition of the atmosphere at a specific place over a relatively short period of time Climate The atmospheric conditions of a specific place over a
Air Masses, Fronts, Storm Systems, and the Jet Stream
 Air Masses, Fronts, Storm Systems, and the Jet Stream Air Masses When a large bubble of air remains over a specific area of Earth long enough to take on the temperature and humidity characteristics of
A Synoptic Climatology of Heavy Precipitation Events in California
 A Synoptic Climatology of Heavy Precipitation Events in California Alan Haynes Hydrometeorological Analysis and Support (HAS) Forecaster National Weather Service California-Nevada River Forecast Center
2013 ATLANTIC HURRICANE SEASON OUTLOOK. June RMS Cat Response
 2013 ATLANTIC HURRICANE SEASON OUTLOOK June 2013 - RMS Cat Response Season Outlook At the start of the 2013 Atlantic hurricane season, which officially runs from June 1 to November 30, seasonal forecasts
PV Generation in the Boundary Layer
 1 PV Generation in the Boundary Layer Robert Plant 18th February 2003 (With thanks to S. Belcher) 2 Introduction How does the boundary layer modify the behaviour of weather systems? Often regarded as a
Impact of Eurasian spring snow decrement on East Asian summer precipitation
 Impact of Eurasian spring snow decrement on East Asian summer precipitation Renhe Zhang 1,2 Ruonan Zhang 2 Zhiyan Zuo 2 1 Institute of Atmospheric Sciences, Fudan University 2 Chinese Academy of Meteorological
CHAPTER 8 NUMERICAL SIMULATIONS OF THE ITCZ OVER THE INDIAN OCEAN AND INDONESIA DURING A NORMAL YEAR AND DURING AN ENSO YEAR
 CHAPTER 8 NUMERICAL SIMULATIONS OF THE ITCZ OVER THE INDIAN OCEAN AND INDONESIA DURING A NORMAL YEAR AND DURING AN ENSO YEAR In this chapter, comparisons between the model-produced and analyzed streamlines,
The Transfer of Heat
 The Transfer of Heat Outcomes: S2-4-03 Explain effects of heat transfer within the atmosphere and hydrosphere on the development and movement of wind and ocean currents. Coriolis Effect In our ecology
Science 1206 Chapter 1 - Inquiring about Weather
 Science 1206 Chapter 1 - Inquiring about Weather 1.1 - The Atmosphere: Energy Transfer and Properties (pp. 10-25) Weather and the Atmosphere weather the physical conditions of the atmosphere at a specific
Global Weather Trade Winds etc.notebook February 17, 2017
 Global Weather 1 north pole northern hemisphere equator southern hemisphere south pole 2 We have seasons because of the Earth's tilt The seasons are opposite in the northern and southern hemispheres winter
DOWNLOAD PDF READING CLIMATE MAPS
 Chapter 1 : Template:Climate chart/how to read a climate chart - Wikipedia Maps don't just tell you which way to go they can tell you practically everything about an area of land, even the weather. Learn
SPECIAL PROJECT PROGRESS REPORT
 SPECIAL PROJECT PROGRESS REPORT Progress Reports should be 2 to 10 pages in length, depending on importance of the project. All the following mandatory information needs to be provided. Reporting year
Quiz 2 Review Questions
 Quiz 2 Review Questions Chapter 7 Lectures: Winds and Global Winds and Global Winds cont 1) What is the thermal circulation (thermal wind) and how does it form? When we have this type of circulation, how
ESCI 344 Tropical Meteorology Lesson 8 Tropical Weather Systems
 ESCI 344 Tropical Meteorology Lesson 8 Tropical Weather Systems References: Tropical Climatology (2 nd Ed.), McGregor and Nieuwolt Climate and Weather in the Tropics, Riehl Climate Dynamics of the Tropics,
particular regional weather extremes
 SUPPLEMENTARY INFORMATION DOI: 1.138/NCLIMATE2271 Amplified mid-latitude planetary waves favour particular regional weather extremes particular regional weather extremes James A Screen and Ian Simmonds
AIR MASSES. Large bodies of air. SOURCE REGIONS areas where air masses originate
 Large bodies of air AIR MASSES SOURCE REGIONS areas where air masses originate Uniform in composition Light surface winds Dominated by high surface pressure The longer the air mass remains over a region,
The feature of atmospheric circulation in the extremely warm winter 2006/2007
 The feature of atmospheric circulation in the extremely warm winter 2006/2007 Hiroshi Hasegawa 1, Yayoi Harada 1, Hiroshi Nakamigawa 1, Atsushi Goto 1 1 Climate Prediction Division, Japan Meteorological
WEATHER FORECASTING Acquisition of Weather Information WFO Regions Weather Forecasting Tools Weather Forecasting Tools Weather Forecasting Methods
 1 2 3 4 5 6 7 8 WEATHER FORECASTING Chapter 13 Acquisition of Weather Information 10,000 land-based stations, hundreds of ships and buoys; four times a day, airports hourly Upper level: radiosonde, aircraft,
Weather Atmospheric condition in one place during a limited period of time Climate Weather patterns that an area typically experiences over a long
 Weather Atmospheric condition in one place during a limited period of time Climate Weather patterns that an area typically experiences over a long period of time Many factors influence weather & climate
An ENSO-Neutral Winter
 An ENSO-Neutral Winter This issue of the Blue Water Outlook newsletter is devoted towards my thoughts on the long range outlook for winter. You will see that I take a comprehensive approach to this outlook