Potential indicators of habitat and water quality in the lower Columbia River
|
|
|
- Dominick Morrison
- 5 years ago
- Views:
Transcription

1 Potential indicators of habitat and water quality in the lower Columbia River Joe Needoba, Ph.D. Associate Professor OHSU-PSU School of Public Health

2 How did the Blob influence the Columbia River estuary? August 2014 October 2014
3 In 2015 the estuary was also influenced by warm river conditions
4 For the CRE, how does compare to previous anomalous warm years? 1997 Strong El Niño - warm ocean 2001 Low snowpack - warm river 2005 Delayed upwelling - warm ocean The Blob - warm ocean and river
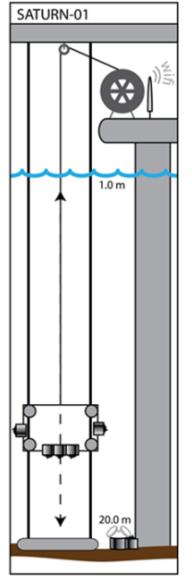
5 Sensor Networks in the Columbia River estuary


6 Measuring ocean water in the estuary
7 Measuring ocean water in the estuary Temperature corresponding to daily highest salinity measurement
8 River Flow and Temperature

9 1997 Strong El Niño - warm ocean NCDC SST
10 1997 Strong El Niño - warm ocean
11 1997 Strong El Niño - warm ocean

12 2001 Low snowpack - warm river t/snow/snowpack_maps/columbia_river/wy2 001/cusn0105.gif
13 2001 Low snowpack - warm river
14 2001 Low snowpack - warm river


15 2005 Delayed upwelling - warm ocean May 2005 August 2005
16 2005 Delayed upwelling - warm ocean
17 2005 Delayed upwelling - warm ocean

18 The Blob - warm ocean and river October 2014
19 The Blob - warm ocean and river

20 The Blob - warm ocean and river

21 The Blob - warm ocean and river
22 The Blob - warm ocean and river
23 Summary of Estuary Conditions Year Event Ocean end member River end member 1997 El Nino Warm Cold 2001 Small snowpack Cold Average 2005 Delayed upwelling Warm Average 2014 Upwelling - blob Cold - Warm Average 2015 Blob + small snowpack + unusual warm weather in spring Warm Warm
24 Water temperature and related variable metrics EOT-US: # days during upwelling season (May-Sept) the estuary-ocean temp was > 1 STD warmer than average for EOT-DS: # days during downwelling season (Oct-Apr) the estuary-ocean temp was > 1 STD warmer than average for Upwelling: a measure of seasonal upwelling inferred from cumulative wind stress on Oregon coast ( ) (Pierce and Barth) R-temp: # days that average river temp was >19 C between May Sept (data ) Freshet: cumulative river discharge (m 3 x ) for May Aug ( ) (Bonneville Dam) April CRB SWE: % of median ( ) snow water equivalent across all Columbia River sub-basins ( ) (National water and climate center, USDA) April CRB Precip: % of median ( ) cumulative precipitation across all Columbia River sub-basins (National water and climate center, USDA) PDX air: # of days daily minimum air temperature > 58 F ( ) (
25 Variables related to water temperature Year EOT-US EOT-DS Upwelling R-Temp Freshet CRB SWE CRB Precip PDX air temp Avg 24 ± ± ± ± ± ± ± ± (2.3) 56 (0.9) -1.7 (1.5) 69 (-0.5) 10.7 (1.9) 163 (2.0) 147 (2.4) 52 (1.07) (-0.8) 90 (1.8) -3.0 (-0.0) 85 (0.76) 7.5 (0.3) 99 (-0.1) 94 (-0.3) 48 (0.79) (-1.7) 0 (-0.6) -2.9 (0.0) 58 (-1.4) 8.3 (0.7) 157 (1.8) 128 (1.4) 34 (-0.2) (0.3) 5 (-0.5) -2.7 (0.3) 81 (0.44) 6.1 (-0.5) 114 (0.4) 102 (0.1) 31 (-0.4) (-0.1) 0 (-0.6) -2.7 (0.3) 86 (0.85) 3.6 (-1.8) 60 (-1.4) 60 (-2.0) 24 (-0.9) (-1.1) 0 (-0.6) -3.8 (-1.0) 73 (-0.2) 7.2 (0.1) 126 (0.8) 108 (0.4) 28 (-0.6) (-1.0) 22 (-0.0) -3.4 (-0.5) 82 (0.52) 6.3 (-0.4) 88 (-0.5) 92 (-0.4) 44 (0.50) (0.7) 1 (-0.6) -1.7 (1.5) 81 (0.44) 6.1 (-0.5) 95 (-0.3) 93 (-0.3) 51 (1.00) (1.4) 23 (-0.0) -3.3 (-0.5) 79 (0.27) 5.6 (-0.7) 59 (-1.5) 72 (-1.4) 38 (0.07) (-0.1) 0 (-0.6) -5.1 (-2.7) 77 (0.11) 7.4 (0.2) 135 (1.1) 118 (0.9) 33 (-0.2) (0.8) 3 (-0.6) -3.0 (-0.0) 77 (0.11) 6.1 (-0.5) 83 (-0.7) 103 (0.1) 40 (0.21) (-0.8) 7 (-0.4) -3.6 (-0.8) 72 (-0.2) 7.7 (0.4) 141 (1.3) 113 (0.6) 36 (-0.0) (-0.3) 0 (-0.6) -2.8 (0.1) 85 (0.76) 6.3 (-0.3) 112 (0.3) 99 (-0.0) 54 (1.22) (-0.1) 18 (-0.1) -2.7 (0.3) 47 (-2.3) 6.3 (-0.4) 77 (-0.9) 77 (-1.1) 27 (-0.7) (-0.8) 26 (0.0) -2.9 (0.1) 59 (-1.3) 10.4 (1.7) 130 (0.9) 121 (1.1) 38 (0.07) (-0.7) 0 (-0.6) -3.2 (-0.3) 59 (-1.3) 9.2 (1.2) 119 (0.5) 109 (0.5) 38 (0.07) (1.4) 14 (-0.2) -2.9 (0.1) 84 (0.68) 6.7 (-0.1) 88 (-0.5) 96 (-0.2) 57 (1.43) (0.5) 73 (1.3) -3.4 (-0.5) 86 (0.85) 7.3 (0.1) 103 (-0.0) 97 (-0.1) 60 (1.65) (0.7) 134 (3.0) -4.4 (-1.7) 102 (2.15) 4.7 (-1.1) 44 (-2.0) 92 (-0.4) 66 (2.08) 2016 n/a n/a (0.72) 5.5 (-0.7) 105 (0.03) 114 (0.61) 49 (0.86) 2017 n/a n/a (0.15) 8.7 (0.9) 120 (0.55) 138 (1.85) 45 (0.57) Record year Runner up 2015 ranked high in 5 of 8 categories
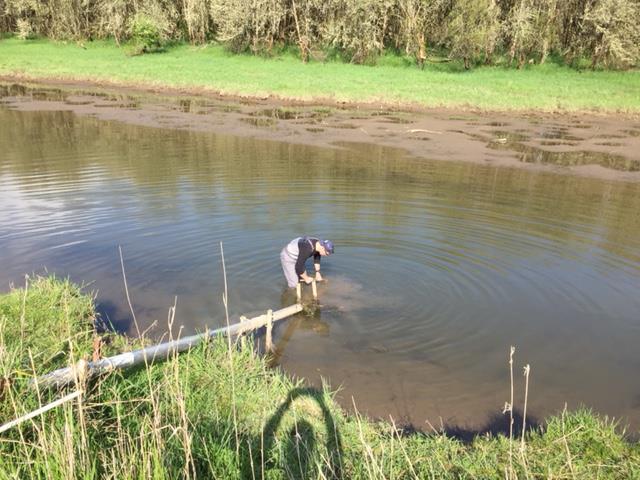
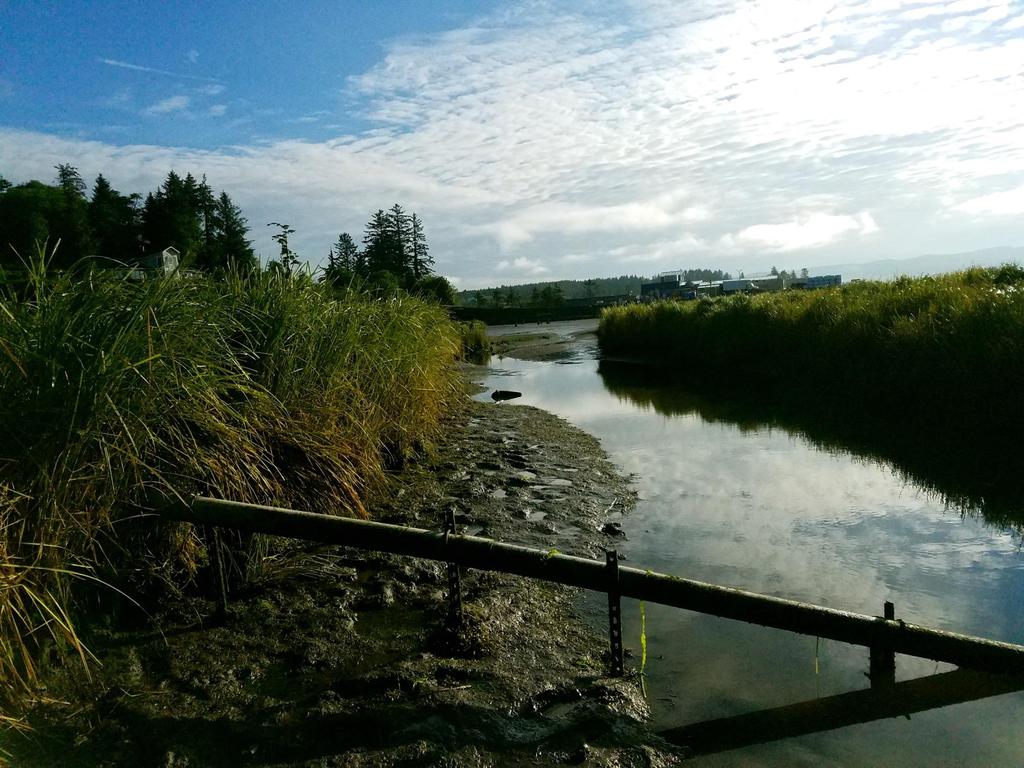
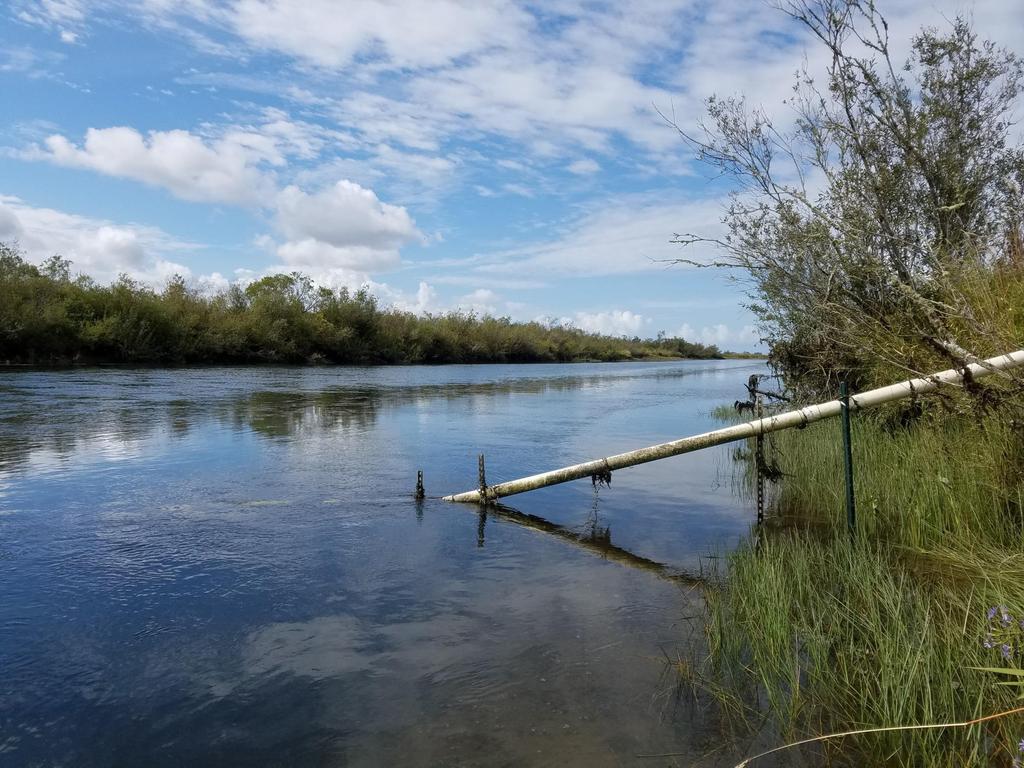
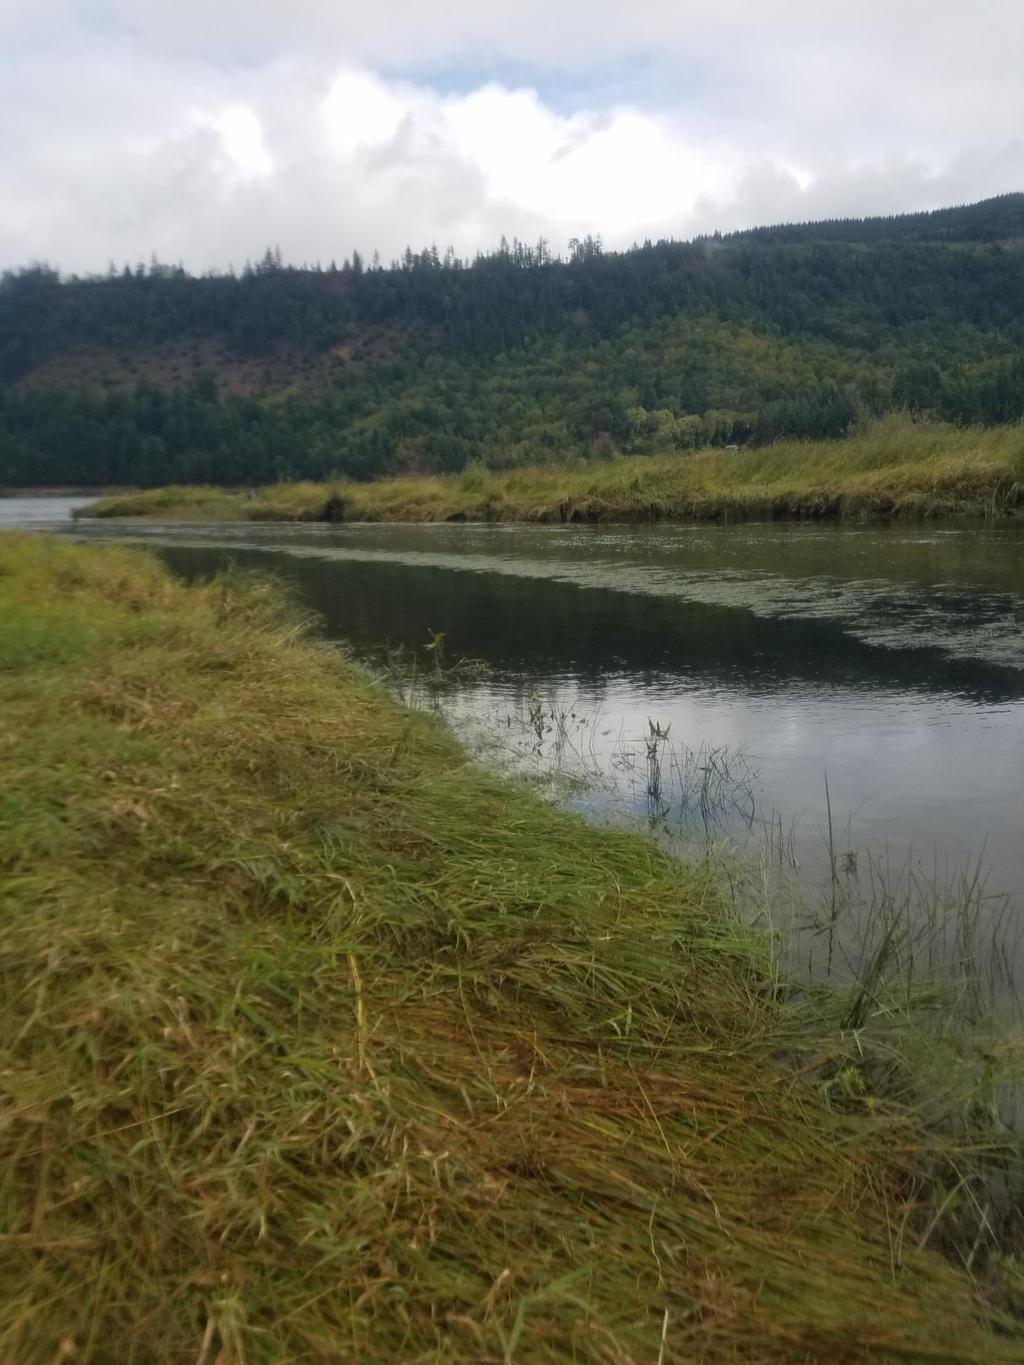
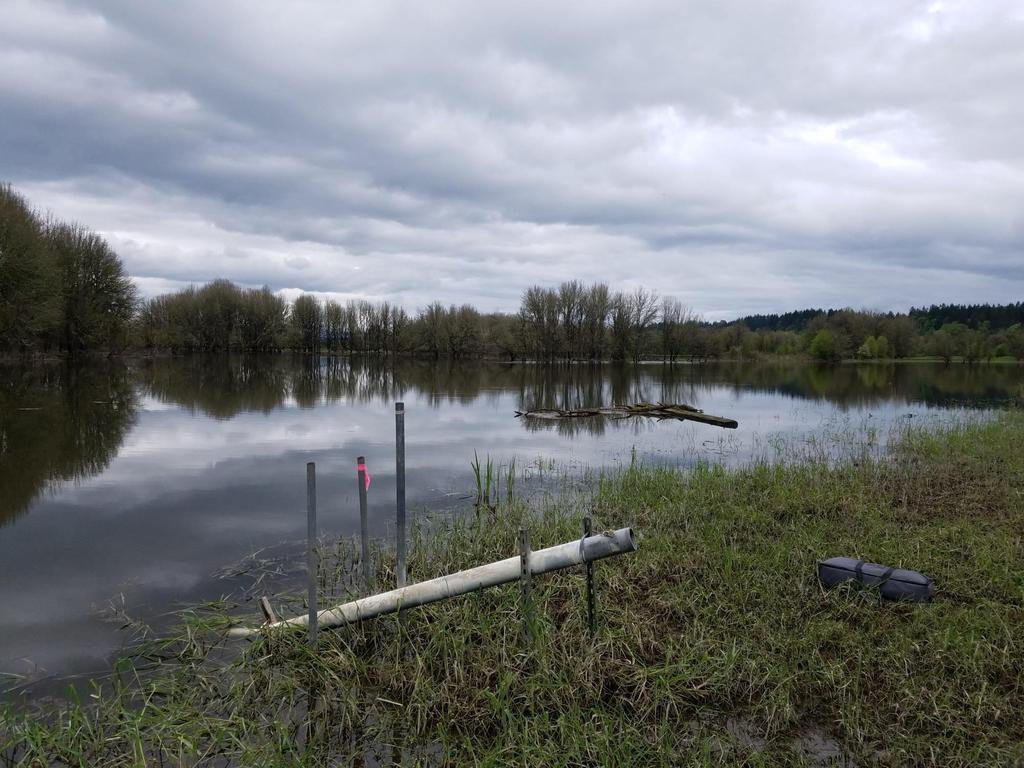
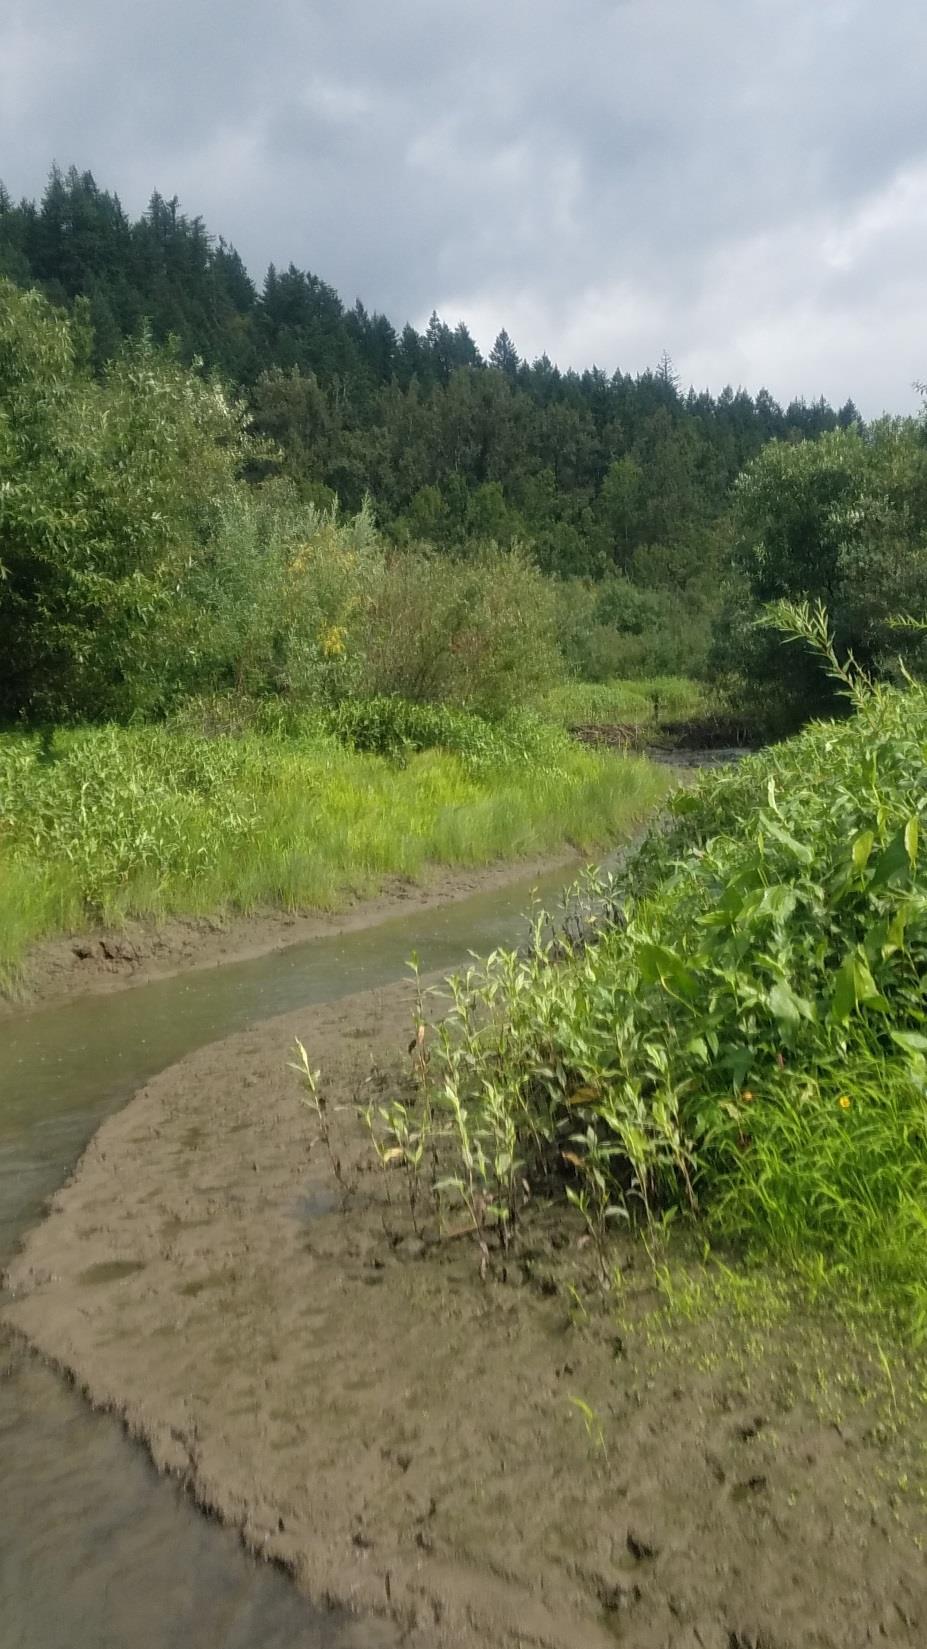
26 Water quality time series data from off-channel sites
27 # hours Low dissolved oxygen - # hours < 6 mg/l
28 # hours DO - # hours < 4 mg/l
29 # hours DO - # hours < 2 mg/l

30 Acknowledgments Tawnya Peterson, OHSU-PSU School of Public Health Catherine Corbett, Lower Columbia Estuary Partnership Charles Seaton, Sarah F. Riseman, António M. Baptista Center for Coastal Margin Observation & Prediction, OHSU
31 Mainstem Temperature
32 Mainstem Temperature
33 River Discharge at BAT
34 River Discharge at BAT
35 Estuary-Ocean Temperature and Cumulative Upwelling
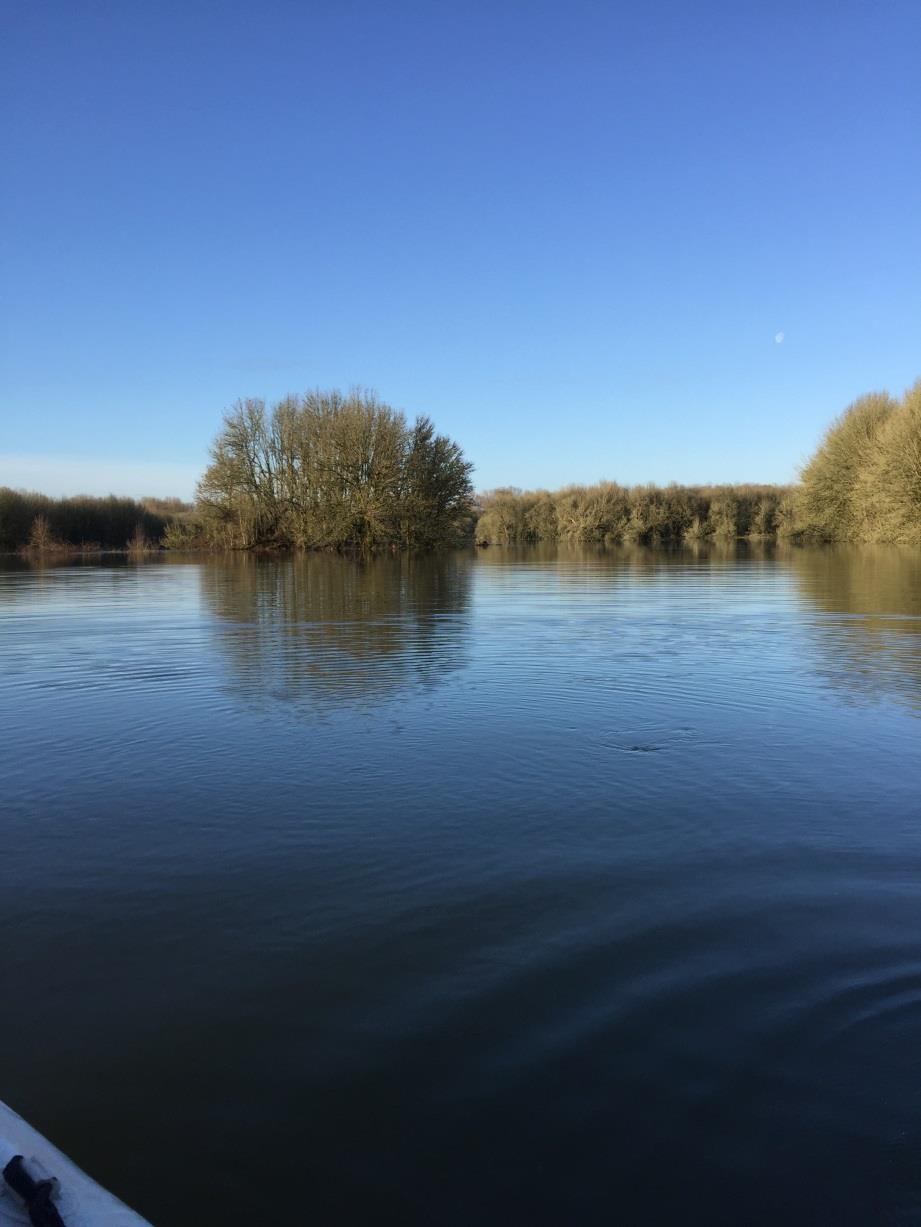
36 Off-channel habitats 2015 vs 2017
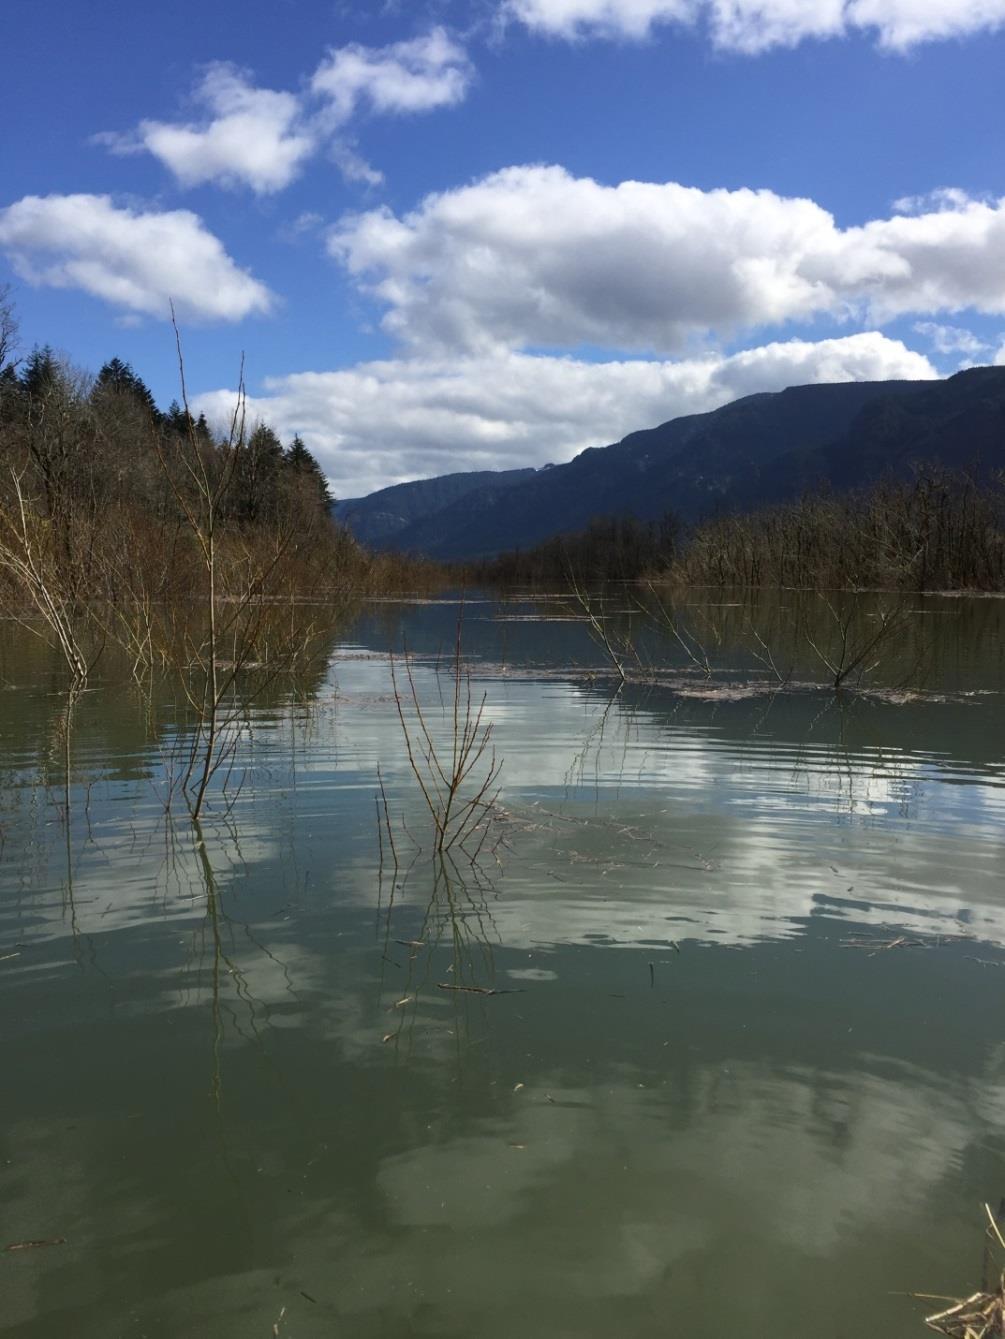
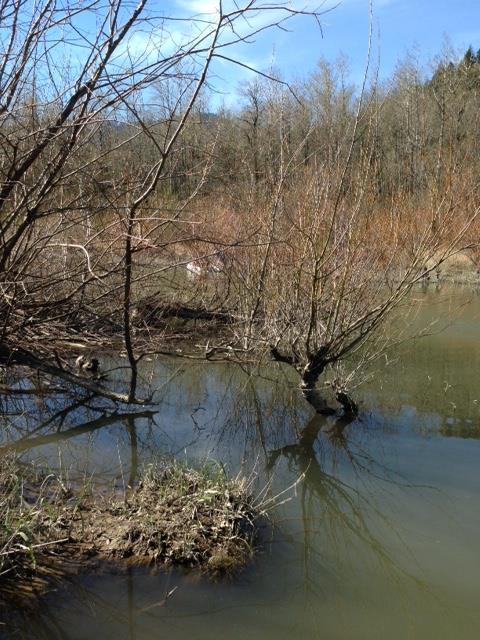
37 Off-channel habitats
38 Water quality time series data from offchannel sites
39 DO - # hours < 6 mg/l
40 DO - # hours < 4 mg/l
41 DO - # hours < 2 mg/l
42
43
44 2016 Temperature comparison: Franz - Mainstem
45 2016 Temperature comparison: Campbell - Mainstem
46 2016 Temperature comparison: Whites - Mainstem
47 2016 Temperature comparison: Ilwaco - Mainstem
48 2016: # hours per month of dissolved oxygen below threshold of 6 mg/l
49 All years # hours per month of dissolved oxygen below threshold ILWACO WHITES CAMPBELL FRANZ <6 <4 <2 <6 <4 <2 <6 <4 <2 <6 <4 <2 Jun/ Jul/ Aug/ Apr/ May/ Jun/10 >200 Jul/10 Aug/10 Apr/11 May/11 Jun/11 Jul/11 Aug/11 Apr/12 May/12 Jun/12 Jul/12 Aug/12 Apr/13 May/13 Jun/13 Jul/13 Aug/13 Apr/14 May/14 Jun/14 Jul/14 Aug/14 Apr/15 May/15 Jun/15 Jul/15 Aug/15 Sep/15 Apr/16 May/16 Jun/16 Jul/16 Aug/16
50

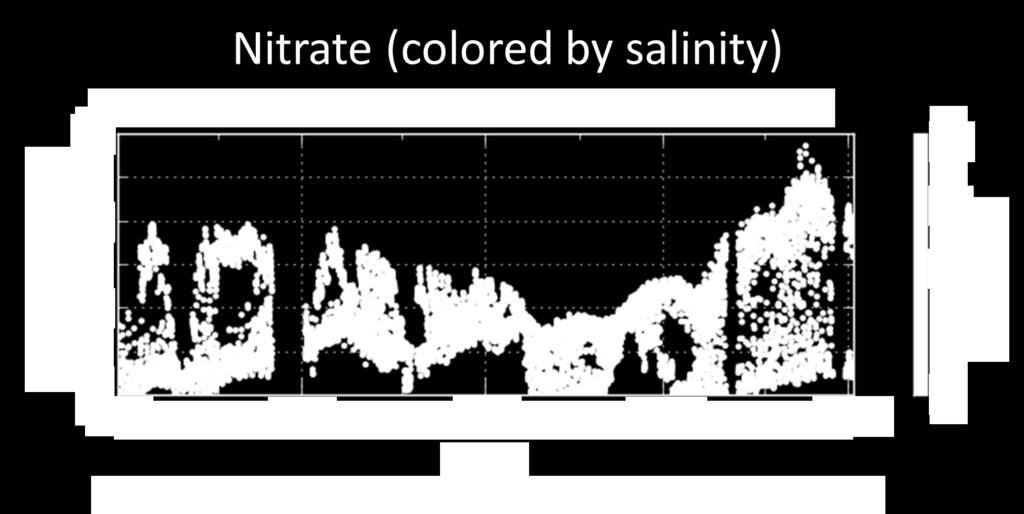
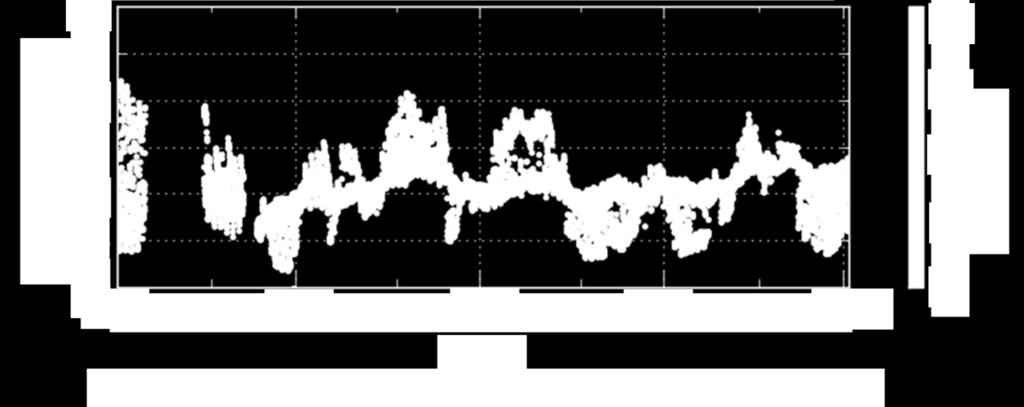
51 O 2 % Sat Salinity SATURN-03 Dissolved Oxygen Time Series 13 m dissolved oxygen Saturn No evidence for strong hypoxia formation associated with the blob
52
53
54
55
56
57
Climate Variability. Eric Salathé. Climate Impacts Group & Department of Atmospheric Sciences University of Washington. Thanks to Nathan Mantua
 Climate Variability Eric Salathé Climate Impacts Group & Department of Atmospheric Sciences University of Washington Thanks to Nathan Mantua Northwest Climate: the mean Factors that influence local/regional
How typical are current conditions?
 How typical are current conditions? NANOOS provides many sources of information for those wanting to track oceanographic conditions throughout the NE Pacific Ocean to be able to understand if the current
ALASKA REGION CLIMATE OUTLOOK BRIEFING. June 22, 2018 Rick Thoman National Weather Service Alaska Region
 ALASKA REGION CLIMATE OUTLOOK BRIEFING June 22, 2018 Rick Thoman National Weather Service Alaska Region Today s Outline Feature of the month: Ocean Warmth Headed into Summer Climate Forecast Basics Climate
Champaign-Urbana 2001 Annual Weather Summary
 Champaign-Urbana 2001 Annual Weather Summary ILLINOIS STATE WATER SURVEY 2204 Griffith Dr. Champaign, IL 61820 wxobsrvr@sws.uiuc.edu Maria Peters, Weather Observer January: After a cold and snowy December,
YACT (Yet Another Climate Tool)? The SPI Explorer
? The SPI Explorer") YACT (Yet Another Climate Tool)? The SPI Explorer Mike Crimmins Assoc. Professor/Extension Specialist Dept. of Soil, Water, & Environmental Science The University of Arizona Yes, another climate tool for
YACT (Yet Another Climate Tool)? The SPI Explorer Mike Crimmins Assoc. Professor/Extension Specialist Dept. of Soil, Water, & Environmental Science The University of Arizona Yes, another climate tool for
Climatography of the United States No
 Climate Division: AK 5 NWS Call Sign: ANC Month (1) Min (2) Month(1) Extremes Lowest (2) Temperature ( F) Lowest Month(1) Degree s (1) Base Temp 65 Heating Cooling 90 Number of s (3) Jan 22.2 9.3 15.8
Monthly Long Range Weather Commentary Issued: APRIL 25, 2016 Steven A. Root, CCM, Chief Analytics Officer, Sr. VP, sales
 Monthly Long Range Weather Commentary Issued: APRIL 25, 2016 Steven A. Root, CCM, Chief Analytics Officer, Sr. VP, sales sroot@weatherbank.com MARCH 2016 Climate Highlights The Month in Review The March
Champaign-Urbana 2000 Annual Weather Summary
 Champaign-Urbana 2000 Annual Weather Summary ILLINOIS STATE WATER SURVEY 2204 Griffith Dr. Champaign, IL 61820 wxobsrvr@sws.uiuc.edu Maria Peters, Weather Observer January: January started on a mild note,
Fire Season Prediction for Canada, Kerry Anderson Canadian Forest Service
 Fire Season Prediction for Canada, 2014 Kerry Anderson Canadian Forest Service 1 Introduction The Canadian Forest Service is now presenting monthly and seasonal forecast maps through the Canadian Wildland
The Virtual Estuary: What can we learn from long-term datasets and modeling efforts? Antonio Baptista OHSU-CMOP. Presented by Grant Law
 The Virtual Estuary: What can we learn from long-term datasets and modeling efforts? Antonio Baptista OHSU-CMOP Presented by Grant Law Outline 2 Introduction (5 min) The components of the virtual estuary
ALASKA REGION CLIMATE OUTLOOK BRIEFING. July 20, 2018 Rick Thoman National Weather Service Alaska Region
 ALASKA REGION CLIMATE OUTLOOK BRIEFING July 20, 2018 Rick Thoman National Weather Service Alaska Region Today s Outline Feature of the month: 2018 Wildfire Season Update Climate Forecast Basics Climate
Changing Hydrology under a Changing Climate for a Coastal Plain Watershed
 Changing Hydrology under a Changing Climate for a Coastal Plain Watershed David Bosch USDA-ARS, Tifton, GA Jeff Arnold ARS Temple, TX and Peter Allen Baylor University, TX SEWRU Objectives 1. Project changes
Missouri River Basin Water Management Monthly Update
 Missouri River Basin Water Management Monthly Update Participating Agencies 255 255 255 237 237 237 0 0 0 217 217 217 163 163 163 200 200 200 131 132 122 239 65 53 80 119 27 National Oceanic and Atmospheric
Climatography of the United States No
 Month (1) Min (2) Month(1) Extremes Lowest (2) Temperature ( F) Lowest Month(1) Degree s (1) Base Temp 65 Heating Cooling 100 Number of s (3) 42.6 24.2 33.4 79 1950 25 44.2 1974-16 1994 19 18.8 1977 977
Climatography of the United States No
 Month (1) Min (2) Month(1) Extremes Lowest (2) Temperature ( F) Lowest Month(1) Degree s (1) Base Temp 65 Heating Cooling 100 Number of s (3) Jan 54.3 40.1 47.2 75 1998 17 53.0 1995 18 1949 11 41.7 1972
Chiang Rai Province CC Threat overview AAS1109 Mekong ARCC
 Chiang Rai Province CC Threat overview AAS1109 Mekong ARCC This threat overview relies on projections of future climate change in the Mekong Basin for the period 2045-2069 compared to a baseline of 1980-2005.
Climatography of the United States No
 Temperature ( F) Month (1) Min (2) Month(1) Extremes Lowest (2) Lowest Month(1) Degree s (1) Base Temp 65 Heating Cooling 100 Number of s (3) Jan 32.8 21.7 27.3 62 1918 1 35.8 1983-24 1950 29 10.5 1979
Climatography of the United States No
 Month (1) Min (2) Month(1) Extremes Lowest (2) Temperature ( F) Lowest Month(1) Degree s (1) Base Temp 65 Heating Cooling 100 Number of s (3) Jan 63.9 39.3 51.6 86 1976 16 56.6 1986 20 1976 2 47.5 1973
Sierra Weather and Climate Update
 Sierra Weather and Climate Update 2014-15 Kelly Redmond Western Regional Climate Center Desert Research Institute Reno Nevada Yosemite Hydroclimate Workshop Yosemite Valley, 2015 October 8-9 Percent of
APPLICATIONS OF DOWNSCALING: HYDROLOGY AND WATER RESOURCES EXAMPLES
 APPLICATIONS OF DOWNSCALING: HYDROLOGY AND WATER RESOURCES EXAMPLES Dennis P. Lettenmaier Department of Civil and Environmental Engineering For presentation at Workshop on Regional Climate Research NCAR
Climatography of the United States No
 Climate Division: CA 6 NWS Call Sign: Month (1) Min (2) Month(1) Extremes Lowest (2) Temperature ( F) Lowest Month(1) Degree s (1) Base Temp 65 Heating Cooling 100 Number of s (3) 68.5 45.7 57.1 90 1971
Climatography of the United States No
 Climate Division: CA 1 NWS Call Sign: Month (1) Min (2) Month(1) Extremes Lowest (2) Temperature ( F) Lowest Month(1) Degree s (1) Base Temp 65 Heating Cooling 100 Number of s (3) Jan 52.4 35.4 43.9 69
Climatography of the United States No
 Climate Division: CA 1 NWS Call Sign: Month (1) Min (2) Month(1) Extremes Lowest (2) Temperature ( F) Lowest Month(1) Degree s (1) Base Temp 65 Heating Cooling 1 Number of s (3) Jan 56.2 4.7 48.5 79 1962
Climatography of the United States No
 Climate Division: CA 2 NWS Call Sign: Month (1) Min (2) Month(1) Extremes Lowest (2) Temperature ( F) Lowest Month(1) Degree s (1) Base Temp 65 Heating Cooling 100 Number of s (3) Jan 55.6 38.8 47.2 81
Climatography of the United States No
 Climate Division: CA 1 NWS Call Sign: Month (1) Min (2) Month(1) Extremes Lowest (2) Temperature ( F) Lowest Month(1) Degree s (1) Base Temp 65 Heating Cooling 100 Number of s (3) Jan 50.2 31.2 40.7 65+
Climatography of the United States No
 Climate Division: CA 7 NWS Call Sign: Month (1) Min (2) Month(1) Extremes Lowest (2) Temperature ( F) Lowest Month(1) Degree s (1) Base Temp 65 Heating Cooling 1 Number of s (3) 64.8 45.4 55.1 85 1971
Climatography of the United States No
 Climate Division: CA 4 NWS Call Sign: Month (1) Min (2) Month(1) Extremes Lowest (2) Temperature ( F) Lowest Month(1) Degree s (1) Base Temp 65 Heating Cooling 100 Number of s (3) Jan 61.4 33.1 47.3 82+
Climatography of the United States No
 Climate Division: CA 4 NWS Call Sign: Month (1) Min (2) Month(1) Extremes Lowest (2) Temperature ( F) Lowest Month(1) Degree s (1) Base Temp 65 Heating Cooling 100 Number of s (3) Jan 61.9 42.0 52.0 89
Climatography of the United States No
 Climate Division: CA 2 NWS Call Sign: Month (1) Min (2) Month(1) Extremes Lowest (2) Temperature ( F) Lowest Month(1) Degree s (1) Base Temp 65 Heating Cooling 100 Number of s (3) Jan 53.5 37.6 45.6 78
Climatography of the United States No
 Climate Division: CA 2 NWS Call Sign: Month (1) Min (2) Month(1) Extremes Lowest (2) Temperature ( F) Lowest Month(1) Degree s (1) Base Temp 65 Heating Cooling 100 Number of s (3) 53.3 31.8 42.6 74+ 1975
Climatography of the United States No
 Climate Division: CA 7 NWS Call Sign: Month (1) Min (2) Month(1) Extremes Lowest (2) Temperature ( F) Lowest Month(1) Degree s (1) Base Temp 65 Heating Cooling 1 Number of s (3) 65.5 38.7 52.1 87 1962
Climatography of the United States No
 Climate Division: CA 7 NWS Call Sign: Month (1) Min (2) Month(1) Extremes Lowest (2) Temperature ( F) Lowest Month(1) Degree s (1) Base Temp 65 Heating Cooling 100 Number of s (3) 44.5 29.3 36.9 69 1951
Climatography of the United States No
 Climate Division: CA 7 NWS Call Sign: Month (1) Min (2) Month(1) Extremes Lowest (2) Temperature ( F) Lowest Month(1) Degree s (1) Base Temp 65 Heating Cooling 100 Number of s (3) 56.0 35.7 45.9 83 1975
Climatography of the United States No
 Climate Division: CA 5 NWS Call Sign: Month (1) Min (2) Month(1) Extremes Lowest (2) Temperature ( F) Lowest Month(1) Degree s (1) Base Temp 65 Heating Cooling 100 Number of s (3) 59.3 31.5 45.4 80 1976
Climatography of the United States No
 Climate Division: CA 2 NWS Call Sign: Month (1) Min (2) Month(1) Extremes Lowest (2) Temperature ( F) Lowest Month(1) Degree s (1) Base Temp 65 Heating Cooling 100 Number of s (3) 53.3 37.1 45.2 77 1962
Climatography of the United States No
 Climate Division: CA 2 NWS Call Sign: Month (1) Min (2) Month(1) Extremes Lowest (2) Temperature ( F) Lowest Month(1) Degree s (1) Base Temp 65 Heating Cooling 100 Number of s (3) 53.7 32.7 43.2 79 1962
Climatography of the United States No
 Climate Division: CA 6 NWS Call Sign: Month (1) Min (2) Month(1) Extremes Lowest (2) Temperature ( F) Lowest Month(1) Degree s (1) Base Temp 65 Heating Cooling 100 Number of s (3) Jan 66.1 38.3 52.2 91
Climatography of the United States No
 Climate Division: CA 6 NWS Call Sign: Month (1) Min (2) Month(1) Extremes Lowest (2) Temperature ( F) Lowest Month(1) Degree s (1) Base Temp 65 Heating Cooling 100 Number of s (3) Jan 51.5 35.0 43.3 80
Climatography of the United States No
 Climate Division: CA 7 NWS Call Sign: Month (1) Min (2) Month(1) Extremes Lowest (2) Temperature ( F) Lowest Month(1) Degree s (1) Base Temp 65 Heating Cooling 100 Number of s (3) 70.4 44.2 57.3 95 1971
Climatography of the United States No
 Climate Division: CA 7 NWS Call Sign: Month (1) Min (2) Month(1) Extremes Lowest (2) Temperature ( F) Lowest Month(1) Degree s (1) Base Temp 65 Heating Cooling 100 Number of s (3) 58.8 34.3 46.6 81+ 1948
Monthly Long Range Weather Commentary Issued: APRIL 18, 2017 Steven A. Root, CCM, Chief Analytics Officer, Sr. VP,
 Monthly Long Range Weather Commentary Issued: APRIL 18, 2017 Steven A. Root, CCM, Chief Analytics Officer, Sr. VP, sroot@weatherbank.com MARCH 2017 Climate Highlights The Month in Review The average contiguous
Climatography of the United States No
 Climate Division: CA 4 NWS Call Sign: Month (1) Min (2) Month(1) Extremes Lowest (2) Temperature ( F) Lowest Month(1) Degree s (1) Base Temp 65 Heating Cooling 100 Number of s (3) Jan 56.4 43.6 50.0 77
Seasonal Climate Watch July to November 2018
 Seasonal Climate Watch July to November 2018 Date issued: Jun 25, 2018 1. Overview The El Niño-Southern Oscillation (ENSO) is now in a neutral phase and is expected to rise towards an El Niño phase through
A Review of the 2007 Water Year in Colorado
 A Review of the 2007 Water Year in Colorado Nolan Doesken Colorado Climate Center, CSU Mike Gillespie Snow Survey Division, USDA, NRCS Presented at the 28 th Annual AGU Hydrology Days, March 26, 2008,
Climatography of the United States No
 Climate Division: CA 1 NWS Call Sign: Month (1) Min (2) Month(1) Extremes Lowest (2) Temperature ( F) Lowest Month(1) Degree s (1) Base Temp 65 Heating Cooling 100 Number of s (3) Jan 57.9 38.9 48.4 85
Climatography of the United States No
 Climate Division: CA 4 NWS Call Sign: Month (1) Min (2) Month(1) Extremes Lowest (2) Temperature ( F) Lowest Month(1) Degree s (1) Base Temp 65 Heating Cooling 100 Number of s (3) Jan 55.6 39.3 47.5 77
Climatography of the United States No
 Climate Division: CA 6 NWS Call Sign: Month (1) Min (2) Month(1) Extremes Lowest (2) Temperature ( F) Lowest Month(1) Degree s (1) Base Temp 65 Heating Cooling 100 Number of s (3) Jan 69.4 46.6 58.0 92
Climatography of the United States No
 Climate Division: CA 5 NWS Call Sign: Month (1) Min (2) Month(1) Extremes Lowest (2) Temperature ( F) Lowest Month(1) Degree s (1) Base Temp 65 Heating Cooling 100 Number of s (3) Jan 56.6 36.5 46.6 81
Climatography of the United States No
 Climate Division: CA 4 NWS Call Sign: Month (1) Min (2) Month(1) Extremes Lowest (2) Temperature ( F) Lowest Month(1) Degree s (1) Base Temp 65 Heating Cooling 1 Number of s (3) Jan 58.5 38.8 48.7 79 1962
Climatography of the United States No
 Climate Division: CA 1 NWS Call Sign: Month (1) Min (2) Month(1) Extremes Lowest (2) Temperature ( F) Lowest Month(1) Degree s (1) Base Temp 65 Heating Cooling 1 Number of s (3) Jan 57.8 39.5 48.7 85 1962
Climatography of the United States No
 Climate Division: CA 4 NWS Call Sign: Month (1) Min (2) Month(1) Extremes Lowest (2) Temperature ( F) Lowest Month(1) Degree s (1) Base Temp 65 Heating Cooling 100 Number of s (3) Jan 49.4 37.5 43.5 73
Climatography of the United States No
 Climate Division: CA 5 NWS Call Sign: Month (1) Min (2) Month(1) Extremes Lowest (2) Temperature ( F) Lowest Month(1) Degree s (1) Base Temp 65 Heating Cooling 100 Number of s (3) Jan 44.8 25.4 35.1 72
Climatography of the United States No
 Climate Division: CA 6 NWS Call Sign: Month (1) Min (2) Month(1) Extremes Lowest (2) Temperature ( F) Lowest Month(1) Degree s (1) Base Temp 65 Heating Cooling 1 Number of s (3) Jan 67.5 42. 54.8 92 1971
The Blob, El Niño, and the Drought in Puget Sound
 The Blob, El Niño, and the Drought in Puget Sound Christopher Krembs, Marine Monitoring Unit, EAP, Ecology The Drought The Blob El Niño Warmest first four months since 1981, (Source: NASA's Goddard Institute
Climatography of the United States No
 Climate Division: SC 7 NWS Call Sign: CHS Month (1) Min (2) Month(1) Extremes Lowest (2) Temperature ( F) Lowest Month(1) Degree s (1) Base Temp 65 Heating Cooling 100 Number of s (3) Jan 58.9 36.9 47.9
Monthly Long Range Weather Commentary Issued: APRIL 1, 2015 Steven A. Root, CCM, President/CEO
 Monthly Long Range Weather Commentary Issued: APRIL 1, 2015 Steven A. Root, CCM, President/CEO sroot@weatherbank.com FEBRUARY 2015 Climate Highlights The Month in Review The February contiguous U.S. temperature
February 27, Jim Ruff, Manager, Mainstem Passage and River Operations. March 2008 Runoff Forecast and Power Supply Status
 W. Bill Booth Chair Idaho James A. Yost Idaho Tom Karier Washington Richard K. Wallace Washington Bruce A. Measure Vice-Chair Montana Rhonda Whiting Montana Melinda S. Eden Oregon Joan M. Dukes Oregon
Climatography of the United States No
 Climate Division: ND 8 NWS Call Sign: BIS Month (1) Min (2) Month(1) Extremes Lowest (2) Temperature ( F) Lowest Month(1) Degree s (1) Base Temp 65 Heating Cooling 100 Number of s (3) Jan 21.1 -.6 10.2
Climatography of the United States No
 Climate Division: TN 1 NWS Call Sign: Month (1) Min (2) Month(1) Extremes Lowest (2) Temperature ( F) Lowest Month(1) Degree s (1) Base Temp 65 Heating Cooling 100 Number of s (3) Jan 47.6 24.9 36.3 81
Climatography of the United States No
 Climate Division: CA 5 NWS Call Sign: FAT Month (1) Min (2) Month(1) Extremes Lowest (2) Temperature ( F) Lowest Month(1) Degree s (1) Base Temp 65 Heating Cooling 1 Number of s (3) Jan 53.6 38.4 46. 78
Climatography of the United States No
 Climate Division: CA 6 NWS Call Sign: 1L2 N Lon: 118 3W Month (1) Min (2) Month(1) Extremes Lowest (2) Temperature ( F) Lowest Month(1) Degree s (1) Base Temp 65 Heating Cooling 1 Number of s (3) Jan 63.7
Climatography of the United States No
 Climate Division: CA 5 NWS Call Sign: BFL Month (1) Min (2) Month(1) Extremes Lowest (2) Temperature ( F) Lowest Month(1) Degree s (1) Base Temp 65 Heating Cooling 1 Number of s (3) Jan 56.3 39.3 47.8
Climatography of the United States No
 Climate Division: TN 3 NWS Call Sign: BNA Month (1) Min (2) Month(1) Extremes Lowest (2) Temperature ( F) Lowest Month(1) Degree s (1) Base Temp 65 Heating Cooling 100 Number of s (3) Jan 45.6 27.9 36.8
Climatography of the United States No
 Climate Division: CA 5 NWS Call Sign: Elevation: 6 Feet Lat: 37 Month (1) Min (2) Month(1) Extremes Lowest (2) Temperature ( F) Lowest Month(1) Degree s (1) Base Temp 65 Heating Cooling 1 Number of s (3)
Climatography of the United States No
 Climate Division: CA 4 NWS Call Sign: Elevation: 13 Feet Lat: 36 Month (1) Min (2) Month(1) Extremes Lowest (2) Temperature ( F) Lowest Month(1) Degree s (1) Base Temp 65 Heating Cooling 1 Number of s
Climatography of the United States No
 Climate Division: CA 5 NWS Call Sign: Elevation: 1,14 Feet Lat: 36 Month (1) Min (2) Month(1) Extremes Lowest (2) Temperature ( F) Lowest Month(1) Degree s (1) Base Temp 65 Heating Cooling 1 Number of
Climatography of the United States No
 Climate Division: CA 4 NWS Call Sign: Elevation: 2 Feet Lat: 37 Month (1) Min (2) Month(1) Extremes Lowest (2) Temperature ( F) Lowest Month(1) Degree s (1) Base Temp 65 Heating Cooling 1 Number of s (3)
ALASKA REGION CLIMATE OUTLOOK BRIEFING. November 16, 2018 Rick Thoman Alaska Center for Climate Assessment and Policy
 ALASKA REGION CLIMATE OUTLOOK BRIEFING November 16, 2018 Rick Thoman Alaska Center for Climate Assessment and Policy Today s Outline Feature of the month: Southeast Drought Update Climate Forecast Basics
Champaign-Urbana 1999 Annual Weather Summary
 Champaign-Urbana 1999 Annual Weather Summary ILLINOIS STATE WATER SURVEY 2204 Griffith Dr. Champaign, IL 61820 wxobsrvr@sws.uiuc.edu Maria Peters, Weather Observer A major snowstorm kicked off the new
Monthly Long Range Weather Commentary Issued: February 15, 2015 Steven A. Root, CCM, President/CEO
 Monthly Long Range Weather Commentary Issued: February 15, 2015 Steven A. Root, CCM, President/CEO sroot@weatherbank.com JANUARY 2015 Climate Highlights The Month in Review During January, the average
Climatography of the United States No
 Climate Division: CA 6 NWS Call Sign: LAX Elevation: 1 Feet Lat: 33 Month (1) Min (2) Month(1) Extremes Lowest (2) Temperature ( F) Lowest Month(1) Degree s (1) Base Temp 65 Heating Cooling 1 Number of
Climatography of the United States No
 Climate Division: CA 6 NWS Call Sign: TOA Elevation: 11 Feet Lat: 33 2W Temperature ( F) Month (1) Min (2) Month(1) Extremes Lowest (2) Lowest Month(1) Degree s (1) Base Temp 65 Heating Cooling 1 Number
2015: A YEAR IN REVIEW F.S. ANSLOW
 2015: A YEAR IN REVIEW F.S. ANSLOW 1 INTRODUCTION Recently, three of the major centres for global climate monitoring determined with high confidence that 2015 was the warmest year on record, globally.
Climatography of the United States No
 No. 2 1971-2 Asheville, North Carolina 2881 COOP ID: 46646 Climate Division: CA 4 NWS Call Sign: 8W Month (1) Min (2) Month(1) Extremes Lowest (2) Temperature ( F) Lowest Month(1) Degree s (1) Base Temp
Climatography of the United States No
 No. 2 1971-2 Asheville, North Carolina 2881 COOP ID: 4792 Climate Division: CA 6 NWS Call Sign: Month (1) Min (2) Month(1) Extremes Lowest (2) Temperature ( F) Lowest Month(1) Degree s (1) Base Temp 65
ALASKA REGION CLIMATE FORECAST BRIEFING. October 27, 2017 Rick Thoman National Weather Service Alaska Region
 ALASKA REGION CLIMATE FORECAST BRIEFING October 27, 2017 Rick Thoman National Weather Service Alaska Region Today Feature of the month: West Pacific Typhoons Climate Forecast Basics Climate System Review
Seasonal cycle of phytoplankton community composition off Newport, Oregon, in 2009
 Seasonal cycle of phytoplankton community composition off Newport, Oregon, in 29 Xiuning Du 1, William Peterson 2 1 College of Environmental science and Engineering, Ocean University of China, Qingdao,
Climatography of the United States No
 No. 2 1971-2 Asheville, North Carolina 2881 COOP ID: 43417 Climate Division: CA 4 NWS Call Sign: N Lon: 121 Month (1) Min (2) Month(1) Extremes Lowest (2) Temperature ( F) Lowest Month(1) Degree s (1)
Climatography of the United States No
 No. 2 1971-2 Asheville, North Carolina 2881 COOP ID: 4795 Climate Division: CA 6 NWS Call Sign: SBA Month (1) Min (2) Month(1) Extremes Lowest (2) Temperature ( F) Lowest Month(1) Degree s (1) Base Temp
What Does It Take to Get Out of Drought?
 What Does It Take to Get Out of Drought? Nolan J. Doesken Colorado Climate Center Colorado State University http://ccc.atmos.colostate.edu Presented at the Insects, Diseases and Drought Workshop, May 19,
Acoustic telemetry of Dungeness crab at a nearshore sediment disposal site
 Acoustic telemetry of Dungeness crab at a nearshore sediment disposal site Curtis Roegner Stephanie Fields Columbia River Estuary Conference ~ Astoria, Oregon 26 May 216 Motivation: Channel maintenance
Jackson County 2013 Weather Data
 Jackson County 2013 Weather Data 61 Years of Weather Data Recorded at the UF/IFAS Marianna North Florida Research and Education Center Doug Mayo Jackson County Extension Director 1952-2008 Rainfall Data
Presentation Overview. Southwestern Climate: Past, present and future. Global Energy Balance. What is climate?
 Southwestern Climate: Past, present and future Mike Crimmins Climate Science Extension Specialist Dept. of Soil, Water, & Env. Science & Arizona Cooperative Extension The University of Arizona Presentation
Climatography of the United States No
 No. 2 1971-2 Asheville, North Carolina 2881 COOP ID: 42713 Climate Division: CA 7 NWS Call Sign: Elevation: -3 Feet Lat: 32 Month (1) Min (2) Month(1) Extremes Lowest (2) Temperature ( F) Lowest Month(1)
Climatography of the United States No
 No. 2 1971-2 Asheville, North Carolina 2881 COOP ID: 46175 Climate Division: CA 6 NWS Call Sign: 3L3 Elevation: 1 Feet Lat: 33 Month (1) Min (2) Month(1) Extremes Lowest (2) Temperature ( F) Lowest Month(1)
Name Period Part I: INVESTIGATING OCEAN CURRENTS: PLOTTING BUOY DATA
 Name Period Part I: INVESTIGATING OCEAN CURRENTS: PLOTTING BUOY DATA INTRODUCTION: Ocean currents are like huge rivers in the sea. They carry drifting organisms, vital dissolved chemical nutrients and
Eric Snodgrass Co-Founder and Senior Atmospheric Scientist of Agrible, Inc Director of Undergraduate Studies Department of Atmospheric Sciences
 Eric Snodgrass Co-Founder and Senior Atmospheric Scientist of Agrible, Inc Director of Undergraduate Studies Department of Atmospheric Sciences University Of Illinois Urbana-Champaign snodgrss@illinois.edu
Climate also has a large influence on how local ecosystems have evolved and how we interact with them.
 The Mississippi River in a Changing Climate By Paul Lehman, P.Eng., General Manager Mississippi Valley Conservation (This article originally appeared in the Mississippi Lakes Association s 212 Mississippi
Minnesota s Climatic Conditions, Outlook, and Impacts on Agriculture. Today. 1. The weather and climate of 2017 to date
 Minnesota s Climatic Conditions, Outlook, and Impacts on Agriculture Kenny Blumenfeld, State Climatology Office Crop Insurance Conference, Sep 13, 2017 Today 1. The weather and climate of 2017 to date
HAIDA GWAII CLIMATE ASSESSMENT 2010 Special Report for MIEDS Franc Pridoehl
 HAIDA GWAII CLIMATE ASSESSMENT 2010 Special Report for MIEDS Franc Pridoehl INTRODUCTION Climatic conditions have varied considerably on Haida Gwaii over the past centuries and millennia (Hebda 2007).
Conditional weather resampling for ensemble streamflow forecasting
 Conditional weather resampling for ensemble streamflow forecasting Joost Beckers, Albrecht Weerts (Deltares Delft) Edwin Welles (Deltares USA) Ann McManamon (BPA) HEPEX 10 th anniversary workshop Washington
Climatography of the United States No
 Climate Division: CA 7 NWS Call Sign: Month (1) Min (2) Month(1) Extremes Lowest (2) Temperature ( F) Lowest Month(1) Degree s (1) Base Temp 65 Heating Cooling 100 Number of s (3) Jan 54.4 36.9 45.7 77+
2003 Water Year Wrap-Up and Look Ahead
 2003 Water Year Wrap-Up and Look Ahead Nolan Doesken Colorado Climate Center Prepared by Odie Bliss http://ccc.atmos.colostate.edu Colorado Average Annual Precipitation Map South Platte Average Precipitation
Seasonal Climate Watch June to October 2018
 Seasonal Climate Watch June to October 2018 Date issued: May 28, 2018 1. Overview The El Niño-Southern Oscillation (ENSO) has now moved into the neutral phase and is expected to rise towards an El Niño
Constructing a typical meteorological year -TMY for Voinesti fruit trees region and the effects of global warming on the orchard ecosystem
 Constructing a typical meteorological year -TMY for Voinesti fruit trees region and the effects of global warming on the orchard ecosystem ARMEANU ILEANA*, STĂNICĂ FLORIN**, PETREHUS VIOREL*** *University
Missouri River Basin Water Management Monthly Update
 Missouri River Basin Water Management Monthly Update Participating Agencies 255 255 255 237 237 237 0 0 0 217 217 217 163 163 163 200 200 200 131 132 122 239 65 53 80 119 27 National Oceanic and Atmospheric
Northwest Outlook October 2016
 Northwest Outlook October 2016 Rainfall Opportunities and Challenges Rainfall over the month of September presented some challenges for the fall harvest while other producers benefitted. Figure 1a shows
A summary of the weather year based on data from the Zumwalt weather station
 ZUMWALT PRAIRIE WEATHER 2016 A summary of the weather year based on data from the Zumwalt weather station Figure 1. An unusual summer storm on July 10, 2016 brought the second-largest precipitation day
Weather and Climate Summary and Forecast Winter
 Weather and Climate Summary and Forecast Winter 2016-17 Gregory V. Jones Southern Oregon University February 7, 2017 What a difference from last year at this time. Temperatures in January and February
Drought Characterization. Examination of Extreme Precipitation Events
 Drought Characterization Examination of Extreme Precipitation Events Extreme Precipitation Events During the Drought For the drought years (1999-2005) daily precipitation data was analyzed to find extreme