APPENDIX C-6 - TRAFFIC MODELING REPORT, SRF CONSULTING GROUP
|
|
|
- Brittany Perkins
- 6 years ago
- Views:
Transcription
1 APPENDIX C-6 - TRAFFIC MODELING REPORT, SRF CONSULTING GROUP Scott County 2030 Comprehensive Plan Update Appendix C
2
3 Scott County Traffic Model Final Report and Documentation March 2008 Prepared for: Scott County Prepared by: SRF Consulting Group, Inc SRF Consulting Group, Inc. One Carlson Parkway Minneapolis, MN SRF No
4 SCOTT COUNTY TRAFFIC MODEL FINAL REPORT AND DOCUMENTATION TABLE OF CONTENTS Background and Purpose...1 Existing Conditions/Roadway Deficiencies Forecasts...5 Illustrative 2050/Buildout...13 Scott County Traffic Model Development...19 APPENDICES Development Assumptions By TAZ Documentation of Model Structure Summary of Meetings With Local Communities
5 SCOTT COUNTY TRAFFIC MODEL FINAL REPORT AND DOCUMENTATION BACKGROUND AND PURPOSE Scott County is updating its comprehensive plan in part as a response to Metropolitan Planning Act Requirements. To assist that effort the County has developed a traffic model capable of: 1) Estimating future traffic volumes for the purposes of identifying capacity deficiencies and facility needs 2) Estimating the effect of long-range land use decisions 3) Supporting local comprehensive plan updates and traffic studies by providing the opportunity for a consistent method of estimating traffic volumes 4) Supporting future land use and transportation project planning The structure of the model is such that County staff, using existing GIS datasets, will be able to maintain the input and forecast year records required as inputs to the model. Thus Scott County will be able to update its transportation plans and forecasts more cost-effectively by reducing the reliance on outside services for model development and maintenance. The model was prepared in a manner to make it consistent with the Metropolitan Council s travel demand model. The County used the results of the model in developing its transportation chapter of the Scott County Transportation Plan. Travel demand models are used to forecast the amount of travel on transportation facilities given assumptions of future development and transportation system improvements. The forecasts generated provide basic information about facility use (such as roadway volumes or transit ridership) and generalized travel impacts (such as vehicle miles of travel and vehicle hours of travel). Travel demand forecasts developed for Scott County were based on a modified version of the Twin Cities regional travel demand model known as the Collar County Model, which was developed for the Minnesota Department of Transportation (Mn/DOT) in 2005 to better estimate travel demand in the portions of the Twin Cities area. The model structure, software and nearly all of the parameters of the model are the same as that used by the Metropolitan Council in order to maintain consistency. However, the Collar County model provides more realistic results and relationships with the counties outside of the Metropolitan Council s jurisdiction, in this case LeSeuer, Rice and Sibley counties. The model was refined to include sufficient detail to provide sufficient forecast volumes on county road segments. Some refinement of the forecasts may be warranted within urbanized areas to address local needs. Page 1
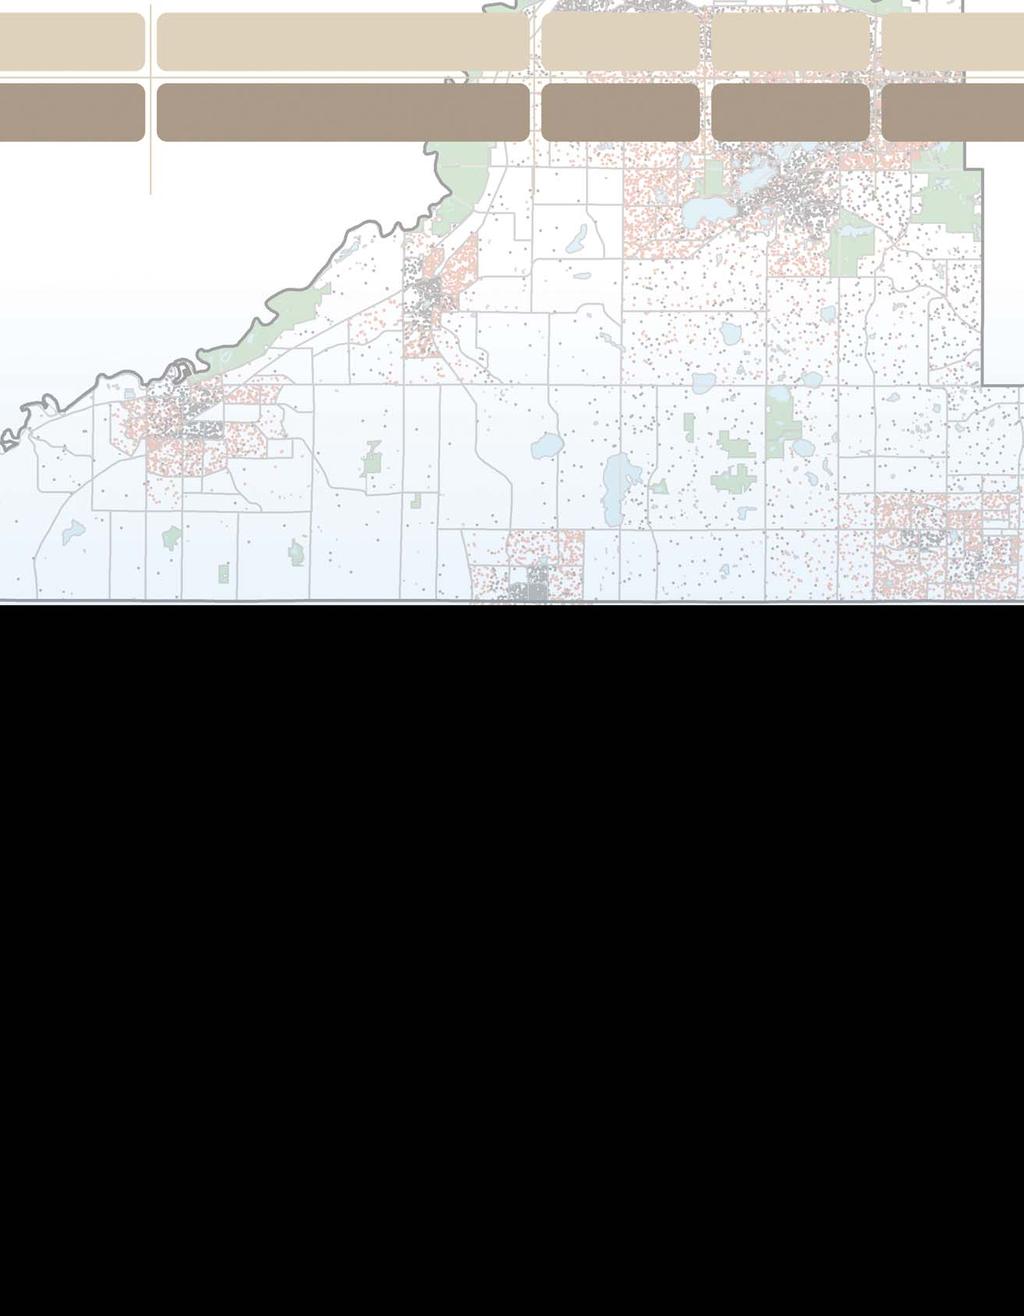
6 Two sets of forecasts were developed: 2030 Existing plus Committed, with development assumptions as directed by the Metropolitan Council Regional Development Framework (as of January 2007), regional roadway assumptions consistent with the Metropolitan Council Transportation Policy Plan (adopted in 2005), and selected county road improvements either programmed or identified in the current Scott County Transportation Plan. Descriptions of these improvements are listed in Table Illustrative Land Use, with an unofficial estimate of potential development levels and resulting transportation needs that may be experienced by the year Roadway assumptions included those in the 2030 existing plus committed network, a new Minnesota River crossing connection between TH 169 and TH 41, additional capacity improvements and new facilities within Scott County. Descriptions of these improvements are listed in a subsequent section of this report. EXISTING CONDITIONS/ROADWAY DEFICIENCIES Figure 1 shows existing traffic volumes and current capacity deficiencies in Scott County. These deficiencies are based on generalized capacity assumptions as shown in Table 1. Analysis in this report defines congestion as the maximum value of the ranges shown in Table 1. Capacities in Table 1 reflect overall roadway lane-capacity with general consideration of access and access control, and not specific intersection-level capacity deficiencies. The locations of current capacity problems are: TH 41, west of TH 169 TH 169, between TH 41 and CSAH 69 CSAH 83, south of CSAH 42 TH 21, south of TH 282 CSAH 42, east of CSAH 27 TH 13, between TH 169 and CSAH 5 in Dakota County Several other locations are nearing capacity as also shown in Figure 1. Page 2
7 , , ,885 9,500 4,382 2,300 8,100 8,560 1,000 1,223 1,223 2,038 3, , ,737 6,216 5,503 5, ,133 J:\Maps\6129\mxd\fig1_current_volumes.mxd Legend 153 ST 51?A Capacity Deficiency (Volume > Capacity) Near Capacity (Volume >.9 of Capacity) xxx Average Daily Traffic Volume UV 1 KL , ST 60 UV 6 1,900 1, ST ,300?A 25 16,200 2,191 1, UV 3 Miles 6,800 9, ST 55 2,140 21,900 2, EXISTING VOLUMES AND CAPACITY DEFICIENCIES SCOTT COUNTY TRAFFIC MODEL 509 Scott County, Minnesota 662 2, UV 5 ST ST ,019?A 19 ST 57 21, UV 7 2, KL 169 UV , ,478 22, , UV 4 UV 9 3,057 22,500 1,528 ST ST ,000 9, ST 2 6, , ,600 UV ,600 30, , ,700 28,000 3,750 15,800 1, ,500 1,834 4,800 5,300 6,200 9, , ,150 3,500 ST 69 ST 73 UV 15 UV , ,038 3, UV 15 4, ,376 31,500 2, ,802 2,650 1, ,200 1,250 2,547 ST ,000 1,070 4,700 21,603 1, ,047 5,200 2, ST ,242 ST 79 ST 54 9,700 19,361 28,000 5,706 1,987 ST ,700 1, ,100 5,100 15,600 5,910 UV?A ?A 13 5,100 9,986 4,789 10,394 6,600 6,318 5, , ,827 UV 2 13,247 1,325 46,000 13,349 16, ,891 8,458 2, , ,400 58,000 2, UV 8 3,312 1,376 11, ,247 2, ?A 19 4,178 9,400 14,775 3,750 3,500 3,006 2,547 2,900 2,649 1,681 13,800 4,000 UV 23 1,834 35,500 2,850 2,904 15,500 1,834 2, , , ST ,000 17,527 5,808 17,200 6,216 ST 84 2,547 18,800 12,636 12, ,600UV 86 5,400 21,908 45,500 2,038 3,450 3,159 3, ,500 22,000 5,200 17,000 6,012 5,197 1,350 1,300 6,600 9, ,800 2,140 3,159 11,209 25, ,400 3,057 52,000 ST 65 ST 75?A 282 UV 8 UV 10?A 21 3,923 7,800 1,325 5,000 9,400 6,114 6,929 3,159 14, ,012 UV UV UV 82 ST 64 ST 81 UV 10 UV 16 UV 21 UV101 12,900 12,500 12,024 ST 87 UV 18 ST 56 12,737 UV 27 9,986 UV ,699 5,600 28,532 11,718 3,712 4,382 2,750 1,550 4,400 2,395 9,782 UV 68 UV 21 34,035 2, ,407 53,000 2,089 5,500 1,325 3, ,250 UV ,019 2,900 12,228 5,187 5,600 2, ,337 13,043 UV 8 UV 2 ST 33 1,761 ST 95 2,172 ST 62 5,910 46,000 39,000 3,057!"# 35 5,299 UV 46 4,280 1,834 1, ,140 3,770 2,904 Figure 1
8 Table 1 Roadway Traffic Capacity Planning-Level Daily Thresholds Cross-Section Maximum Two-way ADT Two-lane undivided rural ADT = 14,000 15,000 Two-lane undivided urban ADT = 8,000 10,000 Two-lane divided urban (Three-lane) ADT = 14,000 17,000 Four-lane undivided urban ADT = 18,000 22,000 Four-lane divided urban (Five-lane) ADT = 28,000 32,000 Four-lane expressway ADT = 36,000 42,000 Four-lane divided rural ADT = 35,000 38,000 Six-lane divided rural ADT =48,000 60,000 Four-lane freeway ADT = 60,000 80,000 Six-lane freeway ADT = 80, ,000 Definitions: Undivided An undivided roadway does not have a raised median separating opposing traffic or left-turn lanes for turning traffic. Divided A divided roadway has a raised median separating opposing traffic, left-turn lanes and right-turn lanes. Rural A rural design implies higher speeds, fewer cross streets/accesses and cross streets/accesses with low volumes. Urban An urban design implies lower speeds, more cross streets/accesses and cross streets/accesses with higher volumes. Expressway An expressway implies a divided roadway, higher speeds, and few cross streets (signalized), with a median separating opposing traffic, left-turn lanes and right-turn lanes. Freeway A freeway is a divided roadway with limited access and no traffic signals or other traffic control. The above table provides planning-level capacity thresholds for different roadway cross-sections. These thresholds can be used to identify existing and future capacity problems. However, because of variations in traffic peaking as well as roadway characteristics, which do not always fall neatly into the above categories, capacity/operational issues should be confirmed through other sources if possible. Page 4
9 2030 FORECASTS Future-year traffic volumes (and congestion levels) are determined by running the traffic model using assumptions regarding development levels and roadway system improvements for the forecast year of DEVELOPMENT ASSUMPTIONS Table 2 shows the estimated existing and 2030 population, households and employment for each community in Scott County. The development assumptions used in this analysis are consistent with the Metropolitan Council s regional development framework totals (as of January 1, 2007). The travel demand model uses sub-community geographic allocations, referred to as Transportation Analysis Zones (or TAZs) to better represent the impact of development on specific roadways. TAZ information, discussed in greater detail in the appendix, was developed for existing conditions primarily using parcel-level information from the Scott County geographic information systems database. Meetings were held with planning and engineering staffs or representatives from each of the communities in Scott County and with County staff to discuss local planning issues, information availability and status of comprehensive plan updates for the Metropolitan Council. Information from these meetings was used to confirm existing development and transportation systems, and to identify future locations of development and roadway improvements. This data was used as input to the travel demand model. New Prague, partially located in LeSeuer County, is not under the land planning jurisdiction of the Metropolitan Council but is also preparing a comprehensive plan update. The lands of the Shakopee Mdewakanton Sioux (Dakota) Community are similarly not under the jurisdiction of the Metropolitan Council. However, staffs of the MSDC and Scott County have shared available information. Appendix C summarizes the meetings held with the local communities. It should be noted that for the purposes of this analysis if local communities estimated 2030 development levels were higher than those approved by the Metropolitan Council the growth was scaled back proportionately to match the Council s totals. Adjustments took into consideration municipal boundary shifts of orderly annexation agreements as of July 1, Figure 2 (for households) and Figure 3 (for employment) show a graphic representation of the forecast growth in Scott County. Much of the areas of Savage, northern Shakopee and Prior Lake area near-fully developed, as are the cores of the smaller urban communities (Jordon, Belle Plaine, New Prague and Elko-New Market). Growth in the future will continue to be dominated by expansion of the metropolitan core to the south (through Savage, Prior Lake and Shakopee), although the smaller cities will continue to urbanize. From 2000 to 2006 Scott County s population grew by 39 percent, making it the 21 st fastest growing county in the U.S. Page 5
10 Table 2 Extimated Existing and 2030 Population, Households ad Employment by Community in Scott County Community Population Households 2005 Retail Employment Non-Retail Employment Population Households Retail Employment Non-Retail Employment Belle Plaine 6,590 2, ,280 16,300 6,500 1,000 1,700 Belle Plaine Twp , Blakeley Twp Cedar Lake Twp. 2, ,700 1, Credit River Twp. 4,810 1, ,200 1, Elko New Market 3,310 1, ,800 8, ,120 Helena Twp. 1, , Jackson Twp. 1, , Jordan 5,150 1, ,330 11,500 4, ,510 Louisville Twp. 1, , New Market Twp. 3,490 1, ,700 1, New Prague (pt) 4,250 1, ,780 7,200 3, ,750 Prior Lake* 21,540 8, ,670 40,000 17,200 1,500 13,000 St. Lawrence Twp , Sand Creek Twp. 1, , Savage 25,070 8,530 1,990 5,370 42,700 16,000 3,100 5,600 Shakopee 30,970 11,610 5,120 11,590 52,000 21,500 9,170 13,630 Spring Lake Twp. 3,790 1, ,500 1, Total 119,660 42,520 9,440 31, ,770 88,190 16,350 41,840 *Prior Lake includes 1,200 additional households and 2,000 additional jobs in 2030 to account for potential increases in the Mdewakanton Sioux community. 2030
11 Legend 1 Dot = Household Growth 2005 Households Transportation Analysis Zones Waterbodies Parks and Refuges Miles J:\Maps\6129\mxd\fig2_2030_HH_Denisty.mxd RESIDENTIAL GROWTH FORECAST SCOTT COUNTY TRAFFIC MODEL Scott County, Minnesota Figure 2

12 Legend 1 Dot = Employment Growth 2005 Employment Transportation Analysis Zones Waterbodies Parks and Refuges Miles J:\Maps\6129\mxd\fig3_2030_Employment_Density.mxd EMPLOYMENT GROWTH FORECAST SCOTT COUNTY TRAFFIC MODEL Scott County, Minnesota Figure 3
13 2030 ROADWAY ASSUMPTIONS The 2030 forecasts assume regional roadway improvements roadway improvements that are under construction and/or have already been programmed or funded. Scott County identified several improvements from its 2020 Transportation Plan (December 2000) that is still under consideration. The improvements are summarized in Table 3 and shown on a map in Figure 4. Table 3 Roadway Improvements Assumed by 2030 Scott County Improvements CSAH 21 new alignment between CSAH 42 and CSAH 18 CSAH 16 (Eagle Creek Blvd) local turnback between CSAH 17 and CSAH 83 CSAH 15 expand to 4-lane divided between TH 169 and 17th Ave CSAH 17 expand to 4-lane divided between St. Francis and CSAH 42 CSAH 42 expand to 6-lane divided between Boone and Louisiana CSAH 42 expand to 6-lane divided near Huntington and Glendale CSAH 27 and CSAH 44 expand to 4-lane divided between Prior Lake CL and 0.3 mile north of CSAH 44 CR 81 realigned to north-south between CSAH 82 and CSAH 12 Intersection improvements at TH 21 and TH 282 New north-south roadway west of TH 169 between CR 64 and CSAH 5 CR 87 paved between CR 56 and CSAH 8 CR 56 paved between CSAH 23 and CR 87 New collector roadway between CSAH 68 and CSAH 21 CSAH 2 expand to 4-lanes between I-35 and CR 33 CSAH 37 new alignment between TH 21 and Naylor Ave CSAH 15 new alignment between 270th St and Alton Ave Regional Improvements TH 212 new 4-lane freeway between TH 5 and existing CSAH 140 (Carver Co) Interchange reconstruction at I-35 and CSAH 70 (Dakota Co) Improvements beyond the County borders were consistent with funded improvements from the current Mn/DOT Metropolitan District Transportation System Plan (2005). The main improvements include the completion of the new TH 212 freeway from Eden Prairie to Carver, reconstruction of the I-35/CSAH 50/60/70 interchanges in Dakota County and improvements to the TH 169/I-494 interchange. Page 9
14 Legend Improvements Improvements Access Removal?A 41 UV 17 ST UV 77 UV ST ST 73 UV 15 UV UV 14 UV ST ST UV ST 65 ST 75 UV 16 UV101 ST 79 KL 169 UV 18 UV 27 UV 44?A 13 UV Miles KL 169 ST 57 UV 9?A 282 UV 10 ST 79?A 13 ST 81 UV 10 UV 23 ST 87 UV 68 UV 21 J:\Maps\6129\mxd\fig4_roadway_improvements.mxd ST 51?A 19 UV 1 KL 169 ST 61 ST 52 UV?A ST 84 UV 91 UV ST UV 8 ST UV UV?A ST 64 UV ST 7 UV UV UV?A UV ST ST ST 62 UV 4 89 ST ST UV UV ST UV UV ?A 13?A 19 ST UV ST 85 UV 86 ST 95!"# 35 UV 46 Scott County Roadway Network Improvements Scott County Traffic Model Scott County, Minnesota Figure 4
15 2030 RESULTS Scott County was estimated to have 42,520 households and 41,180 jobs in the year 2005, or a ratio of 0.97 jobs per household. By 2030 it is forecast that the residential growth will outpace commercial/industrial growth, such that the jobs/housing ratio will decrease to One effect of this expected development pattern is that there will be additional commuting from the county to surrounding counties, resulting in higher traffic demand. The Scott County traffic model estimates that vehicle miles of travel will increase from the current 3.1 million vehicle miles per day to 5.75 million vehicle miles per day (model estimate) by 2030, an increase of 86 percent. The increase will be particularly high on arterial and collector roadways. Table 4 Scott County Transportation Model Vehicle Miles of Travel Facility Type Percent Change Freeway 643, ,692 42% Expressway 605,569 1,066,471 76% Ramps 51,026 67,450 32% Divided Arterial 486,102 1,021, % Undivided Arterial 902,121 1,772,660 96% Three-lane Roadway 36,572 59,318 62% Collector 362, , % Gravel Road 8,722 6,651-24% Total 3,095,777 5,752,180 86% Source: SRF, Scott County model Increases in traffic volumes in Scott County by 2030 result in a number of locations where congested is expected. These locations are depicted in Figure 5. Forecast daily traffic volumes for 2030 are also shown. Page 11
16 6,400 5,800 56,000 10,000 4,500 1,800 1,500 2,700 6,200 8,300 9,300 5,300 2,600 6,500 3,700 1,000 9,500 8,300 27,000 1,700 18,000 12,200 11,200 5,200 71,000 9,600 J:\Maps\6129\mxd\fig5_2030_vol_def.mxd Legend 2030 Roads ST 51?A 19 3,900 5,900 UV Lanes 4 Lanes 6 Lanes Capacity Deficiency (Volume > Capacity) 2 Lanes 4 Lanes 6 Lanes xx,xxx - Average Daily Traffic Volume ST 60 23, ,800 3,900 4,100 2,200 1,000 ST UV 6 25,000 4,900 2,800 4,100 13,600 31,000 4,300 UV 3 Miles 12,700 3,600 ST 55 3,900 36,000 2,700 5,700 4,000 UV 5 2,500 KL 169 4, FORECAST VOLUMES AND CAPACITY DEFICIENCIES SCOTT COUNTY TRAFFIC MODEL Scott County, Minnesota 2,900 8,100 33,000 1,200 3,800 UV 7?A 19 3,600 ST 66 ST 64 UV 59 7,900 2,600 3,000 5,500 3,900 ST 57 2,500 37,000 5,100 1,900 2, UV 9 20,000 3,900 ST 61 UV 4 15,500 13, ST 52 10,000 2,200 UV 11 1,800 4,400 5,500 2,100 10,800 9,100 48,000 12,400 2, UV 2 ST 65 51,000 25,000 49,000 11,400 4,400 6,300 7,000 9,000 ST 73 ST UV ,600 2,200 4,200 2,000 3,000 UV 15 2,600 4,600 5,700 ST 79 6,000 ST 72 13,000 13,100 7,500 5, ,000 14,000 4, ,000 74,000 4,600 4,500 2,400 4,400 7,700 10,300 ST 84 7,200 ST 64 UV UV 280?A UV ST ST ,900 ST UV 54?A 2 13 ST 85 13,800?A 19 UV 86 3,000 8,000 KL UV 10 4,600 52,000 9,200 9,300 UV 8 6,200 11,300 3,300?A 282 3,100 10, ,900 44,000 10,700 4,800 4,300 6,400 4,500 6, ,500 3,200 30,000 ST ,200 49,000 10,000 7,800 ST 70 2,700 2,700 38,000 5,000 15,300 19,000 3,200 11,300 8,300 34,000 16,000 3, UV101 13,000 23,000 UV UV 17 78?A 13 7,500 14,100 15,800 15,200 4,900 62,000 2,100 20,000 23,000 22,000 2,100 8,700 7,500 3,200 5,800 5,400 26,000 UV 83 25,000 UV 82 6,100 16,800 UV 16 10,000 12,600 9,100 4,900 5,900 6,600 8,700 29,000 32,000 UV 12 UV 23 ST 81 20,000 7,800 2,400 3,200 32,000 UV 42 48,000 1,500 37,000 12,600 2,300 8,900 21,000 2,200 32,000 13,800 23,000 ST 87 2,400 8,400 7,000 6, ,000 UV 18 54,000 8,200 38,000 21,000 19,200 24,000 23,000 3,100 19,300 9,500 30,000 39,000 18,000 27,000 UV 27 4,300 21,000 10,400 3,300 12,000 5,800 11,300 22,000 19,400 27,000?A 13 23,000 43,000 9,300 10,700 21,000 5,900 4,000 10,100 11,500 6,300 7,000 5,700 14,200 26,000 5,200 ST 75 UV 68 UV 21 UV 91 61,000 9,100 10,400 9,400 52,000 1,200 23,000 13,300 4,000 7,200 12,500 10,000 UV 8 5,900 16,700 ST 33 2,800 10,700 ST 62 22,000 4,600 15,100 ST 95!"# 35 UV 2 UV 46 7,300 3,900 14,800 12,200 12,400 12,300 Figure 5
17 ILLUSTRATIVE 2050/BUILDOUT SCENARIO An illustrative planning scenario was modeled to assess transportation needs beyond For the purpose of modeling, the forecasts are estimated as nominally occurring in the Year Forecasts beyond that time frame involve a significant amount of uncertainty with respect to roadway assumptions, travel behavior as well as development patterns, such that the value of the forecasts is diminished. However, this alternative provides a reasonable snapshot of a potential condition in the County. The land capacity in Scott County is capable of accommodating significantly more development than described in this section. While community-level and TAZ-level were developed for the purposes of operating the travel demand model, they are not included in this report since they do not represent any officially adopted forecast. The purpose was to provide and order-of-magnitude forecast for the County. DEVELOPMENT ASSUMPTIONS One of the impetuses for the forecasts is a potential new wastewater treatment facility on the Minnesota River between Jordan and Belle Plaine, which would greatly expand the ability to serve residential development with sewered services. In addition, the Elko New Market area will be served by the metropolitan wastewater treatment system by 2010, resulting in increased development opportunities in that area. The general assumptions used in developing 2050 growth allocations (summarized in Table 5 and depicted graphically in Figures 5 and 6) were as follows: Residential growth will still occur primarily in the urbanized portions of the County, with an assumed 2/3rds of the growth in the existing metropolitan urban service area of Savage, Shakopee and Prior Lake or the small urban centers of Elko New Market, New Prague, Belle Plaine and Jordan To the extent to which infill or typical suburban densification may occur, development will continue in the northern tier of communities contiguous to the metropolitan core (Prior Lake, Savage, and Shakopee) consistent with recent development patterns The remainder of residential development will occur in the rural area at densities as determined by the County, including expansion of small urban areas and development at the fringe of the urban areas. Employment growth was assumed at rates faster than that for residential development, to increase the balance of jobs and housing in Scott County to the regional level A new commercial center was assumed in the area surrounding TH 13/TH 282/CSAH 17. Retail growth proportional to population growth in TAZs A control target of 375,000 population was used for Scott County, which approximates an extrapolation of a 2035 projection from the Minnesota State Demographer s office adjusted to reflect the Metropolitan Council s 2030 forecast. Page 13
18 Table 5 Scott County General Growth Assumptions Metropolitan Urban Households Employment Households Employment Households Employment 28,200 32,500 54,700 48,700 78,900 86,600 Small Urban 6,900 6,000 22,100 9,000 37,300 33,200 Rural/Other 7,500 2,700 11,400 3,400 30,700 37,700 Total 42,600 41,200 88,200 61, , ,500 Development outside of the Scott County area was assumed to increase as well in order to better reflect potential interaction with areas outside of Scott County. While no official 2050 forecasts exist, background information from the Metropolitan Council s Water Supply Planning in the Twin Cities Metropolitan Area Technical Report (January, 2007), Appendix E was used as a general guide to establish growth patterns from 2030 to Retail development was forecast to be consistent with the amount and location of residential locations (primarily in the currently developing suburban areas or the next tier of urban area). Other employment was generally assumed to develop consistent with 2030 growth patterns and to maintain the current jobs/housing balance in the region. The overall seven-county metropolitan area totals for the 2050 scenario were: Population: 4.26 million Households: 1.73 million Employment: 2.46 million Page 14
19 Legend 1 Dot = Household Growth 2030 Households Transportation Analysis Zones Waterbodies Parks and Refuges Miles J:\Maps\6129\mxd\fig6_2050_HH_Denisty.mxd RESIDENTIAL GROWTH FORECAST SCOTT COUNTY TRAFFIC MODEL Scott County, Minnesota Figure 6
20 Legend 1 Dot = Employment Growth 2030 Employment Transportation Analysis Zones Waterbodies Parks and Refuges Miles J:\Maps\6129\mxd\fig7_2050_Employment_Density.mxd EMPLOYMENT GROWTH FORECAST SCOTT COUNTY TRAFFIC MODEL Scott County, Minnesota Figure 7
21 ILLUSTRATIVE 2050/BUILDOUT ROADWAY ASSUMPTIONS The following county road improvements were assumed as part of the base 2050 scenario: CSAH 15 expand to 3-lane roadway between CSAH 16 and CSAH 78 CSAH 16 expand to 4-lane divided between CSAH 27 and CSAH 83 CSAH 16 new 4-lane divided roadway between CSAH 15 and CR 69 CR 61 paved between CSAH 4 and TH 19 CR 71 realignment between TH 282 and CSAH 10 TH 169 upgraded to 4-lane freeway between CR 69 and TH 41 Bohnsack Way paved between CR 61 and CSAH 11 New 2-lane roadway on CSAH 70 alignment between TH 169 and CSAH 15 New 2-lane roadway on CSAH 70 alignment between CR 79 and CSAH 17 New 2-lane roadway on CSAH 68 alignment between CSAH 17 and CSAH 23 New 2-lane roadway connecting CR 64 between CR 61 and CSAH 11 New 2-lane roadway on CSAH 2 alignment between TH 169 and CR 61 New 2-lane roadway on CR 56 alignment between CR 87 and CR 91 New 2-lane roadway on CR 87 alignment between BR 56 and CSAH 2 New 3-lane roadway between CR 10 and TH 21 in Jordan New frontage road along east side of TH 169 between CR 64 and CSAH 7 New interchange at I-35 and CSAH 86 New interchange on TH 169 at CR 66 and Park Blvd New regional river crossing between TH 169 and TH 212 (Scott Co and Carver Co) TRAFFIC ANALYSIS As seen in Table 6 significant increases could be expected along the freeway corridors (which would include TH 169 by 2050), which would correspond to the development of Belle Plaine and Jordan. The greatest increases would be for the currently-undivided arterials, which would be consistent with the need to expand the capacity of those roadways as the urbanized areas expand into currently rural parts of the County. Table 6 Vehicle Miles of Travel: Facility Type Percent Change Freeway 643, ,692 1,507,699 65% Expressway 605,569 1,066,471 1,451,925 36% Ramps 51,026 67, , % Divided Arterial 486,102 1,021,156 1,507,057 48% Undivided Arterial 902,121 1,772,660 3,190,179 80% Three-lane Roadway 36,572 59,318 89,299 51% Collector 362, ,781 1,737, % Gravel Road 8,722 6,651 11,474 73% Total 3,095,777 5,752,180 9,647,921 68% Source: SRF, Scott County model Page 17
22 J:\Maps\6129\mxd\fig8_2050_vol_def.mxd Legend 2050 Roads ST 51?A UV Lane 4 Lanes 6 Lanes Capacity Deficiency (Volume > Capacity) 2 Lane 4 Lanes 6 Lanes xx,xxx - Average Daily Traffic Volume ST 60 UV ST UV Miles ST ILLUSTRATIVE 2050 BUILDOUT FORECAST VOLUMES AND CAPACITY DEFICIENCIES SCOTT COUNTY TRAFFIC MODEL Scott County, Minnesota 4300 UV KL ST UV 7?A ST UV ST UV UV ST ST UV ST ?A UV UV ST ?A ST 54?A UV UV UV ST ST UV?A 77 UV 13 UV 16 KL ST UV 42 UV UV UV ST UV UV UV ?A 282?A13 ST 81 UV ST ST ST 64 ST ST UV UV UV ST ST 75 UV UV UV ST ST UV 2!"# 35 UV Figure 8
23 SCOTT COUNTY TRAFFIC MODEL DEVELOPMENT The Scott County model was developed for use by Scott County, its local communities and others to prepare and analyze the traffic impacts of potential land development or transportation scenarios. The primary applications of the model are intended to be: 1. Estimating future traffic volumes for the purposes of identifying capacity deficiencies and facility needs 2. Estimating the effect of long-range land use decisions 3. Supporting local comprehensive plan updates and traffic studies by providing the opportunity for a consistent method of estimating traffic volumes 4. Supporting future land use and transportation project planning The model was prepared in a manner to make it consistent with the Metropolitan Council s travel demand model. The County used the results of the model in developing its transportation chapter of the Scott County Transportation Plan. The Scott County model is based on a modified version of the Twin Cities regional travel demand model known as the Collar County Model, which was developed for Mn/DOT in 2005 to better estimate travel demand in the portions of the Twin Cities area. The Collar County model provides more realistic results and relationships with the counties outside of the Metropolitan Council s jurisdiction, in this case LeSeuer, Rice and Sibley counties. Scott County is located entirely outside of the I-494/I-694 beltway, which is considered the point at which the Twin Cities regional model clearly performs more realistically. Sensitivity tests show The model structure, software and nearly all of the parameters of the model are the same as that used by the Metropolitan Council in order to maintain consistency. Consequently, any user with experience and familiarity with the Metropolitan Council s travel demand model should be readily able to use the Scott County model. The model was validated through multiple iterations until the travel patterns and choices of modes and routes reflected the current traffic patterns. Then, future socioeconomic and future roadway system data was incorporated into the model to generate the various forecast scenarios. TRAVEL DEMAND MODELING PROCESS Figure 8 shows the general flow of the Scott County model. Zonal Data Representation The travel demand model uses development activity as expressed by population, household, retail employment and non-retail employment to estimate travel activity. Scott County area is represented by 48 zones (transportation analysis zones, also known as TAZs) in the Metropolitan Council and Collar County model, which were further divided into a total of 300 zones to better reflect the location of development within Scott County. Additionally, Collar County zone number 1417 in Le Sueur County was divided into nine zones to provide additional detail around the City of New Prague. Page 19
24 The Scott County GIS-based parcel data file was used to identify the quantities of various land uses within each County model TAZ. Conversion rates were used to estimate the socio-economic totals from the land uses contained in the parcel data. One dwelling unit was considered to be one household and the average household size was 2.81 persons throughout Scott County. Employment land uses were calculated using the rates below. Office: 3.11 non-retail employees per 1,000 square feet Retail: 2.62 retail employees per 1,000 square feet Hotel/Motel: 0.48 retail employees per 1,000 square feet Institutional: 1.26 non-retail employees per 1,000 square feet Industrial: 1.10 non-retail employees per 1,000 square feet Local communities provided input for the allocation of existing and future-year development data into the zones. However, the in some cases the locally planned development levels exceeded those of the Metropolitan Council s regional development framework. Where that occurred, the County scaled back the local growth to meet the regional control totals for the purposes of the 2030 forecast. Page 20
25 Legend Scott County Transportation Analysis Zones Met Council Transportation Analysis Zones Miles J:\Maps\6129\mxd\fig9_TAZs.mxd SCOTT COUNTY AND METROPOLITAN COUNCIL ZONES SCOTT COUNTY TRAFFIC MODEL Scott County, Minnesota 1178 Figure 9
26 Legend Belle Plaine Jordan Shakopee New Prague SCOTT COUNTY Savage Prior Lake Elko New Market Scott County Transportation Analysis Zones Met Council Transportation Analysis Zones J:\Maps\6129\mxd\fig9a_TAZs.mxd Miles SCOTT COUNTY AND METROPOLITAN COUNCIL ZONES SCOTT COUNTY TRAFFIC MODEL Scott County, Minnesota Figure 9-A
27 Belle Plaine Jordan Shakopee New Prague SCOTT COUNTY Savage Prior Lake Elko New Market Legend Scott County Transportation Analysis Zones Met Council Transportation Analysis Zones J:\Maps\6129\mxd\fig9b_TAZs.mxd Miles SCOTT COUNTY AND METROPOLITAN COUNCIL ZONES SCOTT COUNTY TRAFFIC MODEL Scott County, Minnesota Figure 9-B
28 Belle Plaine Jordan Shakopee New Prague SCOTT COUNTY Savage Prior Lake Elko New Market J:\Maps\6129\mxd\fig9c_TAZs.mxd Legend Scott County Transportation Analysis Zones Met Council Transportation Analysis Zones Miles SCOTT COUNTY AND METROPOLITAN COUNCIL ZONES SCOTT COUNTY TRAFFIC MODEL Scott County, Minnesota Figure 9-C
29 Roadway Network Representation The base year roadway system is presented in the travel demand model as a representation of attributes, such as area type, facility type, length, speed, number of lanes and capacity. The level of detail in the highway network was expanded throughout Scott County to include all county roadways and selected local roadways. The model was developed using a Geographic Information System-based approach to provide more efficient analysis and output. The level of detail in the highway network was expanded throughout Scott County to include all county roadways. Future year assumptions and improvements were included as previously described. Network speeds in Scott County were modified, where necessary to reflect known local conditions, with adjustments for the presence of traffic control devices. Trip Generation Trip generation is the process by which the number of trips attributed to a zone is estimated based on the amount and type of socioeconomic activity in that zone (i.e., population, households and employment). The end result of trip generation estimation is the total number of trips produced by and attracted to each zone. The regional travel demand model uses trip rates from the 2000 travel behavior inventory, which are generally lower than those found in the ITE Trip Generation manual, which is widely used for traffic studies. Consequently, traffic studies performed for specific developments may yield different results. Trip Distribution/Destination Choice The destination-choice trip distribution process converts the person-trips estimated in the trip generation process to movements between pairs of zones based on the amount of travel activity in a zone and a generalized travel time between the producing zone and other zones. The Scott County model differs from the collar county and regional trip distribution model in one respect: a river crossing impedance file has been added to supplement the K-factors included in the regional model. The adjustment represents additional travel time and distance modeled between specific origins and destinations that would use a river crossing. The penalties are necessary because the model over-estimates travel between these areas while having available capacity on the river crossing; consequently there is no other mechanism within the model to reduce demand because of congestion. Potential highway assignment bias is eliminated because this adjustment is calibrated on the base year and applied to all future scenarios, and also because it is applied at a trip interchange-level rather than a bridge-specific location. Trip distribution travel times may also be affected by bridge congestion penalties as described under the section on highway assignment. Mode Choice The mode choice process takes the number of person-trips between each pair of zones and determines whether the trips are made by single-occupant vehicles, carpools or transit. No specific modifications were made to the mode choice process for this project: the model accounts for any changes assumed in transit services in the county Page 25
30 Zone-splitting Process In this model, split zones are aggregated to Collar County zone totals and used to run the trip generation, trip distribution, and mode choice steps of the modeling process. The mode choice production and attraction results are then divided among the Scott County split zones according to the split-zone socio-economic totals to mimic the trip generation model. Highway assignment is then completed at a split zone level. The reason for this procedure is that while roadway volumes are more precisely defined by zone disaggregation, the overall quantities, travel flows and modes are not more accurate because they are based on general regional or sub-regional parameters. Furthermore, increasing the number of zones through the entire modeling process would significantly increase the time it takes for the model to run. Finally, this process increases the flexibility of the model in maintaining its correspondence to the Metropolitan Council s model structure. Time-of-Day Modeling Traffic from the model is separated into various time periods for the subsequent purpose of assigning the traffic to the roadway network. The travel demand model estimates peak and offpeak trips, by trip purpose, separately as part of the trip distribution process. Consequently, the role of the time-of-day model is to further divide the peak and offpeak trips. The highway assignment model functions with four time periods instead of 24 as included in the Metropolitan Council model. However, the time periods from the Metropolitan Council model could be readily substituted for the Collar County process. The four time periods used are: AM Peak Midday PM Peak Evening/Night 6:45 AM 9:30 AM 9:30 AM 2:30 PM 2:30 PM 6:00 PM 6:00 PM 6:45 AM Aggregation of time periods allows more spreading of the peaks, whereas discrete hourly time periods would show more acute levels of congestion. Whereas the capacity analysis in the Scott County plan uses generalized capacities, treatment of peak congestion was not considered to be a major determinant of model structure. Highway Assignment Highway trips for each of the four periods were routed from zone-to-zone along the roadway system using an equilibrium assignment process. This process reflected congested conditions at appropriate times of the day for any given portion of the highway system. The hourly assignments were summed to produce a daily traffic volume. A dynamic river crossing bridge penalty function is included to better balance the reasonableness of volumes to capacity. River crossings, because they typically involve limited alternate routes, frequently show unrealistically high volumes. In addition, many non-freeway bridges are affected by signalized intersection capacity that is not well-modeled in a travel demand model. Page 26
31 The bridge penalty function calculates an additional travel time equivalent to be applied in the highway assignment and in determining travel times for trip distribution and mode choice. The function is only activated if, in a particular time period and direction, the capacity of the bridge is exceeded. The penalty is reset for each model iteration and time period. The penalty is applied, or potentially applied, to all crossings along the Minnesota River throughout the regional model. It is applied all future scenarios, including any new river crossings. External/Collar Trips The Scott County model, because it is based on the MnDOT Collar County model, uses a feature that assesses the likely travel pattern of trips from the uses assumed projections of Collar County model based on the type of roadway (freeway or arterial), the distance from development, and the results of travel surveys. These locations are at the outer edges of the counties surrounding the metropolitan area. Future volumes are input to the model based on historical growth patterns. Model Convergence The Scott County Travel Demand model iterates to provide a more realistic impact of congestion on all areas of travel behavior. Congestion can affect the number of trips a person makes, the destinations they choose, the attractiveness of activity locations, the modes (transit or carpooling) they might use, and the roadways they may choose for their trips. After each pass of the model, a comparison is made between travel times on a roadway and those from the previous pass. When the weighted difference is within five percent, the model is considered to be finished. Page 27
32 Input Data: Highway and Transit Network Data Input Data: TAZ Data (Including population, households, employment, transit accessibility, parking cost, etc.) Network Skims (Zone to zone distance and trip time) Area Type Auto Ownership (Number of 0, 1, 2,3 + auto households by zone) External Station Trip Generation Trip Generation (Trip productions and attractions by TAZ) External Station Trip Distribution Multiple Iterations Trip Distribution (Zone to zone person trips) Mode Choice (Zone to zone vehicle and transit trips) Diurnal Factoring (Hourly vehicle trips) Zone Split (Sub-TAZ Level) Vehicle Trips (Final interation only) Support/6129 Scott Co Transp Model/Reports/Figure 10 Convergence Check Highway Assignment (Roadway volumes) Post Processing Output Data: Daily and Hourly Traffic Forecasts, VMT, VHT, etc. Transit Assignment (Transit ridership by route) TRAVEL DEMAND FORECASTING PROCESS SCOTT COUNTY TRAFFIC MODEL Scott County, Minnesota Figure 10
33 Model Validation For the purpose of this study, model validation is defined to include the degree to which the travel demand model replicates known ground counts. Three areas of validation were considered. These criteria are based on the Federal Highway Administration s Model Validation and Reasonableness Checking Manual (1997). Correlation: A correlation of determination value of 0.88 was achieved, matching the FHWA s recommended minimum. This establishes that higher-volume roadways overwhelmingly achieve higher model volumes, and that lower-volume roadways model with low volumes. Link Root Mean Squared Error (RMSE): The average error of the model can be estimated in two ways. The first, the average arithmetic error compares the average modeled volume with the average count volume. For this measure, the Scott County model has an error of -2.1 percent, which is well within the acceptable tolerance of +/- 5 percent. However, analysts frequently use a more restrictive measure called Root Mean Squared Error (RMSE) that does not allow a toohigh volume to be averaged and offset against a too-low volume. Furthermore, error on higher volume facilities is weighed more heavily. For the Scott County model an RMSE of 44 percent was achieved. While this value is high, it is logical based on the large number of rural-area counts with low volumes where a small numeric error the model can tolerate high percentage errors with low actual numeric differences, as shown in Figure 11. Page 29
34 Figure 11 Maximum Desirable Error for Link Volumes Source: Model Validation and Reasonableness Checking Manual (FHWA, 1997). Link Deviation from Count: Differences between modeled volumes and ground counts are expected in a model. The significance of any difference is a function of whether the difference affects roadway requirements (such as the number of lanes) and the accuracy or stability of a traffic count. The Scott County model attained a 47 percent threshold, which necessitated applying the adjustment process described in the following section. Numerically the error tended to be on very low volume roadways as shown in Figure 12. Page 30
35 Figure 12 Maximum Desirable Error for Link Volumes Percentage Difference Count PCT_ERR Log. (Upper Bound) Log. (Lower Bound) Screenline Analysis: Screenlines were used to evaluate overall traffic flow performance in the validation model. Two east-west screenlines and two north-south screenlines were established across Scott County and are shown below in Figure 13. The results of this analysis are given in Table 7. Page 31


36 Figure 13 Screenline Locations Table 7 Validation Model Screenline Analysis Screenline 2005 AADT (vpd) 2005 Model (vpd) Percent Difference A 122, ,719 9% B 38,690 32,384-16% C 106,015 91,818-13% D 74,190 74,366 0% MODEL ADJUSTMENT PROCESS While the Scott County model is validated to base year ( ) counts, there is always a certain base-year discrepancy in each link or residual error in the model. To account for this discrepancy, forecast year volumes should be adjusted on a link-by-link basis. It is recommended Page 32
37 that this practice be used consistently to account Volume adjustments should be applied consistent with the methods described in NCHRP 255 (Highway Traffic Data for Urbanized Area Project Planning and Design) based on: The difference between model and count The ratio of the model to count The magnitude of growth between existing and future Table 8 shows the conditions under which each of these methods is appropriate. In general, the ratio method provides potentially volatile and unstable adjustments where the travel demand model is extremely different than the counts, or where growth is proportionately high. Consequently, it is never used on its own. In most cases, the average method should be appropriate. Table 8 Model Adjustment Process Condition Implications of Condition Method Used FutureVolume BaseVolume BaseCount BaseVolume BaseVolume BaseCount > 3 > 1.5 > 1.5 All Other Cases High model growth may cause the ratio method to result in unreasonably high adjusted volumes. A large underestimation by the model in the base year may cause the ratio method to result in unreasonably high adjusted volumes. A large overestimation by the model in the base year may cause the ratio method to result in unreasonably low adjusted volumes. Difference Method Difference Method Difference Method Average Method Ratio Method: AdjustedVolRatio = AssignedVolume * (BaseCount / BaseAssignedVolume) Difference Method: AdjustedVolDifference = AssignedVolume + (BaseCount - BaseAssignedVolume) Average Method: AdjustedVolDifference = 0.5 * (AdjustedVolDifference + AdjustedVolRatio) There are cases where none of these methods are appropriate, for example on a new facility or on a facility which is experiencing a major change in capacity in the future. This adjustment method may be applied across a screenline in those cases. Reasonable engineering/planning judgment should be used in using any adjustment technique, as well as in using unadjusted future volumes. The modeling process as developed includes a field to identify locations where additional manual adjustments were made. Page 33
3.0 ANALYSIS OF FUTURE TRANSPORTATION NEEDS
 3.0 ANALYSIS OF FUTURE TRANSPORTATION NEEDS In order to better determine future roadway expansion and connectivity needs, future population growth and land development patterns were analyzed as part of
III. FORECASTED GROWTH
 III. FORECASTED GROWTH In order to properly identify potential improvement projects that will be required for the transportation system in Milliken, it is important to first understand the nature and volume
APPENDIX IV MODELLING
 APPENDIX IV MODELLING Kingston Transportation Master Plan Final Report, July 2004 Appendix IV: Modelling i TABLE OF CONTENTS Page 1.0 INTRODUCTION... 1 2.0 OBJECTIVE... 1 3.0 URBAN TRANSPORTATION MODELLING
Appendixx C Travel Demand Model Development and Forecasting Lubbock Outer Route Study June 2014
 Appendix C Travel Demand Model Development and Forecasting Lubbock Outer Route Study June 2014 CONTENTS List of Figures-... 3 List of Tables... 4 Introduction... 1 Application of the Lubbock Travel Demand
TRAFFIC FORECAST METHODOLOGY
 CHAPTER 5 TRAFFIC FORECAST METHODOLOGY Introduction Need for County-Level Traffic Forecasting 2030 HC-TSP Model Methodology Model Calibration Future Traffic Forecasts Hennepin County Transportation Systems
StanCOG Transportation Model Program. General Summary
 StanCOG Transportation Model Program Adopted By the StanCOG Policy Board March 17, 2010 What are Transportation Models? General Summary Transportation Models are technical planning and decision support
APPENDIX I: Traffic Forecasting Model and Assumptions
 APPENDIX I: Traffic Forecasting Model and Assumptions Appendix I reports on the assumptions and traffic model specifications that were developed to support the Reaffirmation of the 2040 Long Range Plan.
Expanding the GSATS Model Area into
 Appendix A Expanding the GSATS Model Area into North Carolina Jluy, 2011 Table of Contents LONG-RANGE TRANSPORTATION PLAN UPDATE 1. Introduction... 1 1.1 Background... 1 1.2 Existing Northern Extent of
6 th Line Municipal Class Environmental Assessment
 6 th Line Municipal Class Environmental Assessment County Road 27 to St John s Road Town of Innisfil, ON September 6, 2016 APPENDIX L: TRAVEL DEMAND FORECASTING MEMORANDUM Accessible formats are available
2015 Grand Forks East Grand Forks TDM
 GRAND FORKS EAST GRAND FORKS 2015 TRAVEL DEMAND MODEL UPDATE DRAFT REPORT To the Grand Forks East Grand Forks MPO October 2017 Diomo Motuba, PhD & Muhammad Asif Khan (PhD Candidate) Advanced Traffic Analysis
Market Street PDP. Nassau County, Florida. Transportation Impact Analysis. VHB/Vanasse Hangen Brustlin, Inc. Nassau County Growth Management
 Transportation Impact Analysis Market Street PDP Nassau County, Florida Submitted to Nassau County Growth Management Prepared for TerraPointe Services, Inc. Prepared by VHB/Vanasse Hangen Brustlin, Inc.
Technical Memorandum #2 Future Conditions
 Technical Memorandum #2 Future Conditions To: Dan Farnsworth Transportation Planner Fargo-Moorhead Metro Council of Governments From: Rick Gunderson, PE Josh Hinds PE, PTOE Houston Engineering, Inc. Subject:
TRAVEL DEMAND MODEL. Chapter 6
 Chapter 6 TRAVEL DEMAND MODEL As a component of the Teller County Transportation Plan development, a computerized travel demand model was developed. The model was utilized for development of the Transportation
Traffic Impact Study
 Traffic Impact Study Statham DRI One University Parkway Prepared for: Barrow County Prepared by: October 2012 Table of Contents Executive Summary i Section 1. Introduction 1 Project Description 1 Methodology
2040 MTP and CTP Socioeconomic Data
 SE Data 6-1 24 MTP and CTP Socioeconomic Data Purpose of Socioeconomic Data The socioeconomic data (SE Data) shows the location of the population and employment, median household income and other demographic
Final City of Colusa STREETS & ROADWAYS MASTER PLAN. October J Street Suite 390 Sacramento, CA 95814
 Final City of Colusa STREETS & ROADWAYS MASTER PLAN October 2009 660 J Street Suite 390 Sacramento, CA 95814 TABLE OF CONTENTS I. INTRODUCTION... 1 Report Organization...1 II. ANALYSIS METHODOLOGY... 2
Douglas County/Carson City Travel Demand Model
 Douglas County/Carson City Travel Demand Model FINAL REPORT Nevada Department of Transportation Douglas County Prepared by Parsons May 2007 May 2007 CONTENTS 1. INTRODUCTION... 1 2. DEMOGRAPHIC INFORMATION...
Cipra D. Revised Submittal 1
 Cipra D. Revised Submittal 1 Enhancing MPO Travel Models with Statewide Model Inputs: An Application from Wisconsin David Cipra, PhD * Wisconsin Department of Transportation PO Box 7913 Madison, Wisconsin
STAFF REPORT. MEETING DATE: July 3, 2008 AGENDA ITEM: 7
 STAFF REPORT SUBJECT: Travel Models MEETING DATE: July 3, 2008 AGENDA ITEM: 7 RECOMMENDATION: Receive information on status of travel model development in Santa Barbara County and review factors to achieve
California Urban Infill Trip Generation Study. Jim Daisa, P.E.
 California Urban Infill Trip Generation Study Jim Daisa, P.E. What We Did in the Study Develop trip generation rates for land uses in urban areas of California Establish a California urban land use trip
Appendix B. Land Use and Traffic Modeling Documentation
 Appendix B Land Use and Traffic Modeling Documentation Technical Memorandum Planning Level Traffic for Northridge Sub-Area Study Office of Statewide Planning and Research Modeling & Forecasting Section
Traffic Demand Forecast
 Chapter 5 Traffic Demand Forecast One of the important objectives of traffic demand forecast in a transportation master plan study is to examine the concepts and policies in proposed plans by numerically
Data Collection. Lecture Notes in Transportation Systems Engineering. Prof. Tom V. Mathew. 1 Overview 1
 Data Collection Lecture Notes in Transportation Systems Engineering Prof. Tom V. Mathew Contents 1 Overview 1 2 Survey design 2 2.1 Information needed................................. 2 2.2 Study area.....................................
HORIZON 2030: Land Use & Transportation November 2005
 PROJECTS Land Use An important component of the Horizon transportation planning process involved reviewing the area s comprehensive land use plans to ensure consistency between them and the longrange transportation
Tier 2 Final Environmental Assessment I-66 Transportation Technical Report. Appendix E. Travel Demand Forecasting Model Validation Memorandum
 Tier 2 Final Environmental Assessment I-66 Transportation Technical Report Appendix E Travel Demand Forecasting Model Validation Memorandum FINAL AUGUST 216 MEMORANDUM To: Robert Josef, VDOT Northern Virginia
THE FUTURE OF FORECASTING AT METROPOLITAN COUNCIL. CTS Research Conference May 23, 2012
 THE FUTURE OF FORECASTING AT METROPOLITAN COUNCIL CTS Research Conference May 23, 2012 Metropolitan Council forecasts Regional planning agency and MPO for Twin Cities metropolitan area Operates regional
Mapping Accessibility Over Time
 Journal of Maps, 2006, 76-87 Mapping Accessibility Over Time AHMED EL-GENEIDY and DAVID LEVINSON University of Minnesota, 500 Pillsbury Drive S.E., Minneapolis, MN 55455, USA; geneidy@umn.edu (Received
Transportation Statistical Data Development Report OKALOOSA-WALTON OUTLOOK 2035 LONG RANGE TRANSPORTATION PLAN
 Transportation Statistical Data Development Report OKALOOSA-WALTON OUTLOOK 2035 LONG RANGE TRANSPORTATION PLAN Prepared for the Okaloosa-Walton Transportation Planning Organization and The Florida Department
Typical information required from the data collection can be grouped into four categories, enumerated as below.
 Chapter 6 Data Collection 6.1 Overview The four-stage modeling, an important tool for forecasting future demand and performance of a transportation system, was developed for evaluating large-scale infrastructure
Changes in the Spatial Distribution of Mobile Source Emissions due to the Interactions between Land-use and Regional Transportation Systems
 Changes in the Spatial Distribution of Mobile Source Emissions due to the Interactions between Land-use and Regional Transportation Systems A Framework for Analysis Urban Transportation Center University
Forecasts for the Reston/Dulles Rail Corridor and Route 28 Corridor 2010 to 2050
 George Mason University Center for Regional Analysis Forecasts for the Reston/Dulles Rail Corridor and Route 28 Corridor 21 to 25 Prepared for the Fairfax County Department of Planning and Zoning Lisa
Palmerston North Area Traffic Model
 Palmerston North Area Traffic Model Presentation to IPWEA 7 November 2014 PNATM Presentation Overview Model Scope and type Data collected The model Forecasting inputs Applications PNCC Aims and Objectives
FHWA Peer Exchange Meeting on Transportation Systems Management during Inclement Weather
 Travel Demand Modeling & Simulation at GBNRTC Matt Grabau Kimberly Smith Mike Davis Why Model? Travel modeling is a tool for transportation planners and policy makers, to observe impacts of a transportation
Developing and Validating Regional Travel Forecasting Models with CTPP Data: MAG Experience
 CTPP Webinar and Discussion Thursday, July 17, 1-3pm EDT Developing and Validating Regional Travel Forecasting Models with CTPP Data: MAG Experience Kyunghwi Jeon, MAG Petya Maneva, MAG Vladimir Livshits,
Updating the Urban Boundary and Functional Classification of New Jersey Roadways using 2010 Census data
 Updating the Urban Boundary and Functional Classification of New Jersey Roadways using 2010 Census data By: Glenn Locke, GISP, PMP 1 GIS-T May, 2013 Presentation Overview Purpose of Project Methodology
Prepared for: San Diego Association Of Governments 401 B Street, Suite 800 San Diego, California 92101
 Activity-Based Travel Model Validation for 2012 Using Series 13 Data: Coordinated Travel Regional Activity Based Modeling Platform (CT-RAMP) for San Diego County Prepared for: San Diego Association Of
VHD Daily Totals. Population 14.5% change. VMT Daily Totals Suffolk 24-hour VMT. 49.3% change. 14.4% change VMT
 6.9 Suffolk 6-54 VMT Population and Travel Characteristics Population 14.5% change 2014 1,529,202 VHD Daily Totals 2014 251,060 49.3% change 2040 1,788,175 2040 374,850 VMT Daily Totals 2014 39,731,990
Figure 8.2a Variation of suburban character, transit access and pedestrian accessibility by TAZ label in the study area
 Figure 8.2a Variation of suburban character, transit access and pedestrian accessibility by TAZ label in the study area Figure 8.2b Variation of suburban character, commercial residential balance and mix
Transit Market Index. Validating Local Potential for Transit Ridership
 Transit Market Index Validating Local Potential for Transit Ridership Transit Market Areas Characteristics 2010 TPP Characterized by different levels of transit service. Core Areas, 1 & 2: A variety of
Alternatives Analysis
 Alternatives Analysis Prepared for: Metropolitan Atlanta Rapid Transit Authority Prepared by: AECOM/Jacobs-JJG Joint Venture Atlanta, GA November 2012 Page Left Intentionally Blank ii TABLE OF CONTENTS
A Method for Mapping Settlement Area Boundaries in the Greater Golden Horseshoe
 A Method for Mapping Settlement Area Boundaries in the Greater Golden Horseshoe Purpose This paper describes a method for mapping and measuring the lands designated for growth and urban expansion in the
CIV3703 Transport Engineering. Module 2 Transport Modelling
 CIV3703 Transport Engineering Module Transport Modelling Objectives Upon successful completion of this module you should be able to: carry out trip generation calculations using linear regression and category
Central Florida Regional Planning Model (CFRPM) Version 6.0
 Version 6.0") Central Florida Regional Planning Model (CFRPM) Version 6.0 Technical Memorandum: Year 2010 Model Calibration and Validation Prepared for: FLORIDA DEPARTMENT OF TRANSPORTATION DISTRICT 5 Prepared by: Leftwich
Central Florida Regional Planning Model (CFRPM) Version 6.0 Technical Memorandum: Year 2010 Model Calibration and Validation Prepared for: FLORIDA DEPARTMENT OF TRANSPORTATION DISTRICT 5 Prepared by: Leftwich
Information for File MVP RMM
 Information for File MVP-2013-03320-RMM Applicant: City of St. Cloud Corps Contact: Ryan Malterud Address: 180 Fifth Street East, Suite 700, St. Paul, MN 55101 E-Mail: Ryan.M.Malterud@usace.army.mil Phone:
Neighborhood Locations and Amenities
 University of Maryland School of Architecture, Planning and Preservation Fall, 2014 Neighborhood Locations and Amenities Authors: Cole Greene Jacob Johnson Maha Tariq Under the Supervision of: Dr. Chao
SBCAG Travel Model Upgrade Project 3rd Model TAC Meeting. Jim Lam, Stewart Berry, Srini Sundaram, Caliper Corporation December.
 SBCAG Travel Model Upgrade Project 3rd Model TAC Meeting Jim Lam, Stewart Berry, Srini Sundaram, Caliper Corporation December. 7, 2011 1 Outline Model TAZs Highway and Transit Networks Land Use Database
final report A Recommended Approach to Delineating Traffic Analysis Zones in Florida Florida Department of Transportation Systems Planning Office
 A Recommended Approach to Delineating Traffic Analysis Zones in Florida final report prepared for Florida Department of Transportation Systems Planning Office September 27, 2007 final report A Recommended
South Western Region Travel Time Monitoring Program Congestion Management Process Spring 2008 Report
 South Western Region Travel Monitoring Program Congestion Management Process Spring 2008 Report Prepared by: South Western Regional Planning Agency 888 Washington Boulevard Stamford, CT 06901 Telephone:
Snow and Ice Control POLICY NO. P-01/2015. CITY OF AIRDRIE Snow and Ice Control Policy
 Page 1 CITY OF AIRDRIE Snow and Ice Control Effective Date: Approved By: Approved On: March 17, 2015 City Council March 16, 2015 Revision Date: Resolution #: ------ PURPOSE: The City of Airdrie is responsible
2014 Certification Review Regional Data & Modeling
 2014 Certification Review Regional Data & Modeling July 22, 2014 Regional Data Census Program Coordination PAG works with and for member agencies to ensure full participation in all Census Bureau programs
Trip Generation Model Development for Albany
 Trip Generation Model Development for Albany Hui (Clare) Yu Department for Planning and Infrastructure Email: hui.yu@dpi.wa.gov.au and Peter Lawrence Department for Planning and Infrastructure Email: lawrence.peter@dpi.wa.gov.au
Regional Transit Development Plan Strategic Corridors Analysis. Employment Access and Commuting Patterns Analysis. (Draft)
") Regional Transit Development Plan Strategic Corridors Analysis Employment Access and Commuting Patterns Analysis (Draft) April 2010 Contents 1.0 INTRODUCTION... 4 1.1 Overview and Data Sources... 4 1.2
Regional Transit Development Plan Strategic Corridors Analysis Employment Access and Commuting Patterns Analysis (Draft) April 2010 Contents 1.0 INTRODUCTION... 4 1.1 Overview and Data Sources... 4 1.2
APPENDIX G Halton Region Transportation Model
 APPENDIX G Halton Region Transportation Model Halton Region Transportation Master Plan Working Paper No. 1 - Legislative Context Working Paper No. 2 - Active Transportation Halton Transportation Model
محاضرة رقم 4. UTransportation Planning. U1. Trip Distribution
 UTransportation Planning U1. Trip Distribution Trip distribution is the second step in the four-step modeling process. It is intended to address the question of how many of the trips generated in the trip
Study Overview. the nassau hub study. The Nassau Hub
 Livable Communities through Sustainable Transportation the nassau hub study AlternativeS analysis / environmental impact statement The Nassau Hub Study Overview Nassau County has initiated the preparation
WOODRUFF ROAD CORRIDOR ORIGIN-DESTINATION ANALYSIS
 2018 WOODRUFF ROAD CORRIDOR ORIGIN-DESTINATION ANALYSIS Introduction Woodruff Road is the main road to and through the commercial area in Greenville, South Carolina. Businesses along the corridor have
GIS Analysis of Crenshaw/LAX Line
 PDD 631 Geographic Information Systems for Public Policy, Planning & Development GIS Analysis of Crenshaw/LAX Line Biying Zhao 6679361256 Professor Barry Waite and Bonnie Shrewsbury May 12 th, 2015 Introduction
Appendix C Final Methods and Assumptions for Forecasting Traffic Volumes
 Fairview Ave. and Main St. Improvements and Local Streets Plan Appendices Ada County Highway District Appendix C Final Methods and Assumptions for Forecasting Traffic Volumes January 3, 207 Appendices
Taming the Modeling Monster
 Taming the Modeling Monster Starring: Ellen Greenberg Scott McCarey Jim Charlier Audience Poll, part 1 Elected Officials Board Members Public Staff Consultants Journalists Other Audience Poll, part 2 Modeling
WEBER ROAD RESIDENTIAL DEVELOPMENT Single Family Residential Project
 WEBER ROAD RESIDENTIAL DEVELOPMENT Single Family Residential Project WEBER ROAD RESIDENTIAL DEVELOPMENT TRAFFIC IMPACT STUDY TABLE OF CONTENTS 1.0 Executive Summary Page 2.0 Introduction 2.1 DEVELOPMENT
I. M. Schoeman North West University, South Africa. Abstract
 Urban Transport XX 607 Land use and transportation integration within the greater area of the North West University (Potchefstroom Campus), South Africa: problems, prospects and solutions I. M. Schoeman
TRAFFIC IMPACT STUDY. Platte Canyon Villas Arapahoe County, Colorado (Arapahoe County Case Number: Z16-001) For
 For") TRAFFIC IMPACT STUDY For Platte Canyon Villas Arapahoe County, Colorado (Arapahoe County Case Number: Z16-001) February 2015 Revised: August 2015 April 2016 July 2016 September 2016 Prepared for: KB Home
TRAFFIC IMPACT STUDY For Platte Canyon Villas Arapahoe County, Colorado (Arapahoe County Case Number: Z16-001) February 2015 Revised: August 2015 April 2016 July 2016 September 2016 Prepared for: KB Home
Travel Demand Model Report City of Peterborough Comprehensive Transportation Plan Update Supporting Document
 Travel Demand Model Report City of Peterborough Comprehensive Transportation Plan Update Supporting Document Prepared for: City of Peterborough and Morrison Hershfield June 2012 Paradigm Transportation
Appendix B. Durham Region Travel Demand Model Calibration
 Appendix B Durham Region Travel Demand Model Calibration AECOM 300 Water Street 905 668 9363 tel Whitby, ON, Canada L1N 9J2 905 668 0221 fax www.aecom.com To Ron Albright, Municipality of Clarington Page
PROPOSED PROJECT. Section PROJECT DESCRIPTION
 1 2 3 4 5 6 7 8 9 10 11 12 13 14 15 16 17 18 19 20 21 22 23 24 25 26 27 28 29 30 31 32 33 34 35 36 37 38 39 40 41 42 43 1.1 PROJECT DESCRIPTION This Environmental Assessment describes the proposed improvements
2011 South Western Region Travel Time Monitoring Program Congestion Management Process. Executive Summary
 2011 South Western Region Travel Monitoring Program Executive Summary Prepared by: South Western Regional Planning Agency 888 Washington Blvd, 3rd Floor Stamford, CT 06901 Telephone: 203.6.5190 Facsimile:
Introduction of Information Feedback Loop To Enhance Urban Transportation Modeling System
 TRANSPORTATION RESEARCH RECORD 1493 81 Introduction of Information Feedback Loop To Enhance Urban Transportation Modeling System KYLE B. WINSLOW, ATHANASSIOS K. BLADIKAS, KENNETH J. HAUSMAN, AND LAZAR
November 16, Metropolitan Washington Council of Governments National Capital Region Transportation Planning Board
 Metropolitan Washington Council of Governments National Capital Region Transportation Planning Board Summary of the State of the Practice and State of the Art of Modeling Peak Spreading November 16, 2007
Kitsap County 2016 Comprehensive Plan Update. Appendix A: Growth Estimates
 Kitsap County 2016 Comprehensive Plan Update Appendix A: Growth Estimates Appendix A 1 April 2016 Kitsap County 2016 Comprehensive Plan Update Appendix A: Growth Estimates Land Capacity Land capacity
River North Multi-Modal Transit Analysis
 River North Multi-Modal Transit Analysis November 7, 2006 Dan Meyers, AICP URS Corporation 612-373-6446 / dan_meyers@urscorp.com River North Study Area Reasons for initiating the study Downtown areas north
City of Hermosa Beach Beach Access and Parking Study. Submitted by. 600 Wilshire Blvd., Suite 1050 Los Angeles, CA
 City of Hermosa Beach Beach Access and Parking Study Submitted by 600 Wilshire Blvd., Suite 1050 Los Angeles, CA 90017 213.261.3050 January 2015 TABLE OF CONTENTS Introduction to the Beach Access and Parking
APPENDIX I - AREA PLANS
 ROUTE 37 WEST LAND USE PLAN ROUTE 37 WEST LAND USE PLAN Recent land use decisions and development trends have drawn attention to the land within the Route 37 western by-pass area between Route 50 and
NATHAN HALE HIGH SCHOOL PARKING AND TRAFFIC ANALYSIS. Table of Contents
 Parking and Traffic Analysis Seattle, WA Prepared for: URS Corporation 1501 4th Avenue, Suite 1400 Seattle, WA 98101-1616 Prepared by: Mirai Transportation Planning & Engineering 11410 NE 122nd Way, Suite
GIS for the Non-Expert
 GIS for the Non-Expert Ann Forsyth University of Minnesota February 2006 GIS for the Non-Expert 1. Definitions and problems 2. Measures being tested in Twin Cities Walking Study Basic approach, data, variables
Table 3-1 Gallatin County Population and Employment Trends ( )
") 3.1 INTRODUCTION The method and process used to predict growth in the Bozeman area up to the year 030 is contained in this chapter of the Transportation Plan. By using population, employment and other
3.1 INTRODUCTION The method and process used to predict growth in the Bozeman area up to the year 030 is contained in this chapter of the Transportation Plan. By using population, employment and other
BROOKINGS May
 Appendix 1. Technical Methodology This study combines detailed data on transit systems, demographics, and employment to determine the accessibility of jobs via transit within and across the country s 100
Encapsulating Urban Traffic Rhythms into Road Networks
 Encapsulating Urban Traffic Rhythms into Road Networks Junjie Wang +, Dong Wei +, Kun He, Hang Gong, Pu Wang * School of Traffic and Transportation Engineering, Central South University, Changsha, Hunan,
CVS Derwood. Local Area Transportation Review
 CVS Derwood Montgomery County, Maryland May 27, 2016 Local Area Transportation Review Prepared for: JC Bar Properties, Inc. Steve Fleming, PE 415 Fallowfield Road, Suite 301 Camp Hill, Pennsylvania 17011
MINNESOTA SIDE Draft TRANSPORTATION IMPROVEMENT PROGRAM
 MINNESOTA SIDE Draft TRANSPORTATION IMPROVEMENT PROGRAM 2018-2021 April, 2017 FISCAL YEARS 2018-2021 MINNESOTA SIDE Draft TRANSPORTATION IMPROVEMENT PROGRAM FOR THE GRAND FORKS - EAST GRAND FORKS METROPOLITAN
Regional Performance Measures
 G Performance Measures Regional Performance Measures Introduction This appendix highlights the performance of the MTP/SCS for 2035. The performance of the Revenue Constrained network also is compared to
Economic Activity Economic A ctivity
 5 Economic Economic Activity Activity ECONOMIC ACTIVITY 5.1 EMPLOYMENT... 5-7 5.1.1 OBJECTIVE... 5-7 5.1.2 POLICIES... 5-7 5.2 PROTECTING THE AREA OF EMPLOYMENT... 5-9 5.2.1 OBJECTIVE... 5-9 5.2.2 POLICIES...
Transit Modeling Update. Trip Distribution Review and Recommended Model Development Guidance
 Transit Modeling Update Trip Distribution Review and Recommended Model Development Guidance Contents 1 Introduction... 2 2 FSUTMS Trip Distribution Review... 2 3 Proposed Trip Distribution Approach...
Development of modal split modeling for Chennai
 IJMTES International Journal of Modern Trends in Engineering and Science ISSN: 8- Development of modal split modeling for Chennai Mr.S.Loganayagan Dr.G.Umadevi (Department of Civil Engineering, Bannari
ARTICLE IN PRESS. Transport Policy
 Transport Policy ] (]]]]) ]]] ]]] Contents lists available at ScienceDirect Transport Policy journal homepage: www.elsevier.com/locate/tranpol Post-construction evaluation of traffic forecast accuracy
Texas Transportation Institute The Texas A&M University System College Station, Texas
 1. Report No. FHWA/TX-03/4198-2 4. Title and Subtitle CALIBRATION OF A PAST YEAR TRAVEL DEMAND MODEL FOR MODEL EVALUATION Technical Report Documentation Page 2. Government Accession No. 3. Recipient's
King City URA 6D Concept Plan
 King City URA 6D Concept Plan King City s Evolution Among the fastest growing cities 2000 Census 1,949 2010 Census 3,111 60% increase 2016 Census estimate 3,817 23% increase Average annual rate 4.3% Surpassing
An Integrated Approach to Statewide Travel Modeling Applications in Delaware
 TRB 88 th Annual Meeting Washington, D.C. January 14 th, 29 An Integrated Approach to Statewide Travel Modeling Applications in Delaware The Context: Challenges for Today s Modelers: Personnel: Vacant
The effects of impact fees on urban form and congestion in Florida
 The effects of impact fees on urban form and congestion in Florida Principal Investigators: Andres G. Blanco Ruth Steiner Presenters: Hyungchul Chung Jeongseob Kim Urban and Regional Planning Contents
Table of Contents Introduction... 4 Study Area... 5
 Table of Contents Introduction... 4 Study Area... 5 Streets and s... 5 Traffic Volumes... 8 Recent and Anticipated Development... 10 Crash Analysis... 10 Projected Traffic Volumes... 11 Trip Generation...
Regional Performance Measures
 G Performance Measures Regional Performance Measures Introduction This appendix highlights the performance of the MTP/SCS for 2035. The performance of the Revenue Constrained network also is compared to
Proposed Scope of Work Village of Farmingdale Downtown Farmingdale BOA Step 2 BOA Nomination Study / Draft Generic Environmental Impact Statement
 Proposed Scope of Work Village of Farmingdale Downtown Farmingdale BOA Step 2 BOA Nomination Study / Draft Generic Environmental Impact Statement The scope of work that follows incorporates and covers
Appendix C: City of Mississauga Transportation Strategy Update
 Appendix C: City of Mississauga Transportation Strategy Update Transportation Strategy Update Transportation and Works Department Agenda - Objectives - What has changed? - Forecasted trends and issues
MPOs SB 375 LAFCOs SCAG Practices/Experiences And Future Collaborations with LAFCOs
 Connecting LAFCOs and COGs for Mutual Benefits MPOs SB 375 LAFCOs SCAG Practices/Experiences And Future Collaborations with LAFCOs Frank Wen, Manager Research & Analysis Land Use & Environmental Planning
Land Use Modeling at ABAG. Mike Reilly October 3, 2011
 Land Use Modeling at ABAG Mike Reilly michaelr@abag.ca.gov October 3, 2011 Overview What and Why Details Integration Use Visualization Questions What is a Land Use Model? Statistical relationships between
Appendix I: Traffic Study
 City of Fontana Sierra Lakes Commerce Center Draft EIR Appendix I: Traffic Study FirstCarbon Solutions H:\Client (PN JN)\0144\01440050\EIR\1 ADEIR\01440050 Sec99 99 Appendix Dividers.doc THIS PAGE INTENTIONALLY
A Simplified Travel Demand Modeling Framework: in the Context of a Developing Country City
 A Simplified Travel Demand Modeling Framework: in the Context of a Developing Country City Samiul Hasan Ph.D. student, Department of Civil and Environmental Engineering, Massachusetts Institute of Technology,
3. THE TRANSPORTATION AND TRANSIT MASTER PLAN
 The Master Plan Report Page 3-1 3. THE TRANSPORTATION AND TRANSIT MASTER PLAN 3.1 The Strategy Through the technical and consultation processes "A Balanced Road and Transit System" has been defined as
VALIDATING THE RELATIONSHIP BETWEEN URBAN FORM AND TRAVEL BEHAVIOR WITH VEHICLE MILES TRAVELLED. A Thesis RAJANESH KAKUMANI
 VALIDATING THE RELATIONSHIP BETWEEN URBAN FORM AND TRAVEL BEHAVIOR WITH VEHICLE MILES TRAVELLED A Thesis by RAJANESH KAKUMANI Submitted to the Office of Graduate Studies of Texas A&M University in partial
Appendix B. Traffic Analysis Report
 Appendix B Traffic Analysis Report Report No. 14369/TR/WN02 August 2007 SALLINS BYPASS BYPASS OPTIONEERING ANALYSIS - TRAFFIC REPORT Kildare County Council Áras Chill Dara, Devoy Park, Naas, Co Kildare
Information for File # MMJ; Trunk Highway (TH) 7 / Louisiana Ave. Interchange Project
 7 / Louisiana Ave. Interchange Project") Information for File # 2013-00531-MMJ; Trunk Highway (TH) 7 / Louisiana Ave. Interchange Project Applicant: City of St. Louis Park Corps Contact: Melissa Jenny Address: U.S. Army Corps of Engineers Attn:
Information for File # 2013-00531-MMJ; Trunk Highway (TH) 7 / Louisiana Ave. Interchange Project Applicant: City of St. Louis Park Corps Contact: Melissa Jenny Address: U.S. Army Corps of Engineers Attn: