WEBER ROAD RESIDENTIAL DEVELOPMENT Single Family Residential Project
|
|
|
- Vincent Baldwin
- 5 years ago
- Views:
Transcription
1 WEBER ROAD RESIDENTIAL DEVELOPMENT Single Family Residential Project
2 WEBER ROAD RESIDENTIAL DEVELOPMENT TRAFFIC IMPACT STUDY TABLE OF CONTENTS 1.0 Executive Summary Page 2.0 Introduction 2.1 DEVELOPMENT DESCRIPTION STUDY AREA Area Conditions 3.1 AREA LAND USE SITE ACCESSIBILITY EXISTING TRAFFIC VOLUMES Traffic Volume Projections 4.1 PROJECTED BACKGROUND (NON-SITE) TRAFFIC VOLUMES ESTIMATED SITE-GENERATED TRAFFIC VOLUMES PROJECTED NO-BUILD AND BUILD TRAFFIC VOLUMES Traffic Analyses 5.1 TURN LANE WARRANT ANALYSIS CAPACITY ANALYSIS Findings and Recommendations 6.1 FINDINGS RECOMMENDATIONS Appendices JUNE 20, 2016
3 WEBER ROAD RESIDENTIAL DEVELOPMENT TRAFFIC IMPACT STUDY TABLE OF CONTENTS List of Figures, Tables, and Appendices FIGURES Figure 2A: Figure 3A: Figure 4A: Figure 4B: Figure 4C: Figure 4D: Project Location Map Counted Traffic Volumes Background Traffic Volumes Site Generated Traffic Volumes 2017 Build Scenario Total Traffic Volumes 2037 Build Scenario Total Traffic Volumes TABLES Table 4A: Table 5A: Table 5B: ITE Trip Generation Rates 2017 Capacity Analyses Summary 2037 Capacity Analyses Summary APPENDICES Appendix A: Preliminary Site Plan Appendix B: Traffic Count Data Appendix C: Turn Lane Warrants Appendix D: HCS 2010 Capacity Analysis Reports JUNE 20, 2016
4 WEBER ROAD RESIDENTIAL DEVELOPMENT TRAFFIC IMPACT STUDY 1.0 EXECUTIVE SUMMARY This traffic study was performed to analyze the proposed residential development at the southeast corner of the Weber Road intersection with Branch Hill Guinea Pike in Clermont County, Ohio. The project is projected to create approximately 160 single-family residences. The proposed development site will create an increase in traffic to and from Weber Road, with the majority the traffic traveling to and from the north and west. The proposed development is planned to open in In this area, Branch Hill Guinea Pike generally runs northwest to southeast. For purposes of this study, all report text and analyses refer to Branch Hill Guinea Pike as the north-south route and Cook Road / Weber Road as the east-west route, with Cook Road to the west of Branch Hill Guinea and Weber Road to the east of Branch Hill Guinea. As part of the development project, two new site access drives will be constructed on Weber Road. Each of the two development access points will connect with Weber Road across from an existing side street intersection, converting each three-leg intersection to a complete four-leg intersection. The west access drive will be constructed at the south leg of the Tanglewood Drive intersection with Weber Road. The east access drive will be constructed at the south leg of the Weber Woods Court intersection with Weber Road. According to correspondence with staff at the Clermont County Engineer s Office, traffic is expected to grow at 0.25% annually in this area. Counted traffic volumes were projected to the opening year (2017) and future design year (2037) to establish the background traffic volumes. Traffic volumes for the 160 single family residential development were estimated using data from the 9th Edition of ITE s publication Trip Generation. These volumes were combined with background traffic volumes to predict the total traffic volumes in the opening year (2017) and future design year (2037). As a separate project, the Clermont County Engineer is planning an improvement project on Branch Hill Guinea Pike in this area that will include reconstruction of the traffic signal installation and turn-lane enhancements at the Cook Road / Weber Road intersection. The County s Branch Hill Guinea Pike project is scheduled for construction in 2017 and these improved conditions will be considered as the baseline (No-Build) condition in this report for purposes of evaluating impacts from the proposed residential development. Turn lane warrant analyses were performed for the projected total traffic volumes at the proposed site access drives on Weber Road. According to the analysis, turn lane warrants are not met for either access point with the projected traffic volumes. Capacity analyses including traffic queue length calculations were performed for each of the three study intersections. The analysis results show that the surrounding roadway network (including improvements already planned by Clermont County) will be sufficient to accommodate additional traffic generated by the proposed residential development. In summary, the proposed development including the two proposed access points onto Weber Road should be approved as planned without the need for any additional infrastructure improvements. PAGE 1-1 JUNE 20, 2016
5 WEBER ROAD RESIDENTIAL DEVELOPMENT TRAFFIC IMPACT STUDY 2.0 INTRODUCTION This study was conducted to analyze the impact of the proposed residential development located in the southeast corner of the Weber Road intersection with Branch Hill Guinea Pike in Clermont County, Ohio. Traffic counts were collected in the study area during peak AM and PM times. Background volumes were projected based on a growth rate provided by the Clermont County Engineer s Office. Site generated traffic volumes were projected for the 160 lot single-family residential development. Site generated volumes were added to the background volumes. Turn lane warrants and intersection capacity analyses for the projected opening year (2017) and future year (2037) traffic volumes were conducted at the study area intersections. A Project Location Map is provided as Figure 2A. 2.1 DEVELOPMENT DESCRIPTION A residential development project is proposed at the southeast corner of the Weber Road intersection with Branch Hill Guinea Pike in Clermont County, Ohio. The project will create approximately 160 new single family residential lots. As part of the development project two new site access drives will be constructed on Weber Road. The west access drive will be constructed at the south leg of the Tanglewood Drive intersection with Weber Road. The east access drive will be constructed at the south leg of the Weber Woods Court intersection with Weber Road. The proposed residential development project is expected to be open in A preliminary site plan is included in Appendix A of this report. 2.2 STUDY AREA In this area, Branch Hill Guinea Pike generally runs northwest to southeast. For purposes of this study, all report text and analyses refer to Branch Hill Guinea Pike as the north-south route and Cook Road / Weber Road as the east-west route, with Cook Road to the west of Branch Hill Guinea and Weber Road to the east of Branch Hill Guinea. The study area for this analysis includes the following intersections: Cook and Weber Roads at Branch Hill Guinea Pike Tanglewood Drive and the proposed site access drive at Weber Road Weber Woods Court and the proposed site access drive at Weber Road PAGE 2-1 JUNE 20, 2016


6 WEBER ROAD RESIDENTIAL DEVELOPMENT TRAFFIC IMPACT STUDY 2.0 INTRODUCTION Study Intersections Proposed Residential Development Project Location Map FIGURE 2A JUNE 20, 2016
7 WEBER ROAD RESIDENTIAL DEVELOPMENT TRAFFIC IMPACT STUDY 3.0 AREA CONDITIONS 3.1 AREA LAND USE Area land use in the area of the proposed development is comprised of undeveloped open fields. Areas to the north, east, west, and south are comprised of residential developments. 3.2 SITE ACCESSIBILITY Branch Hill Guinea Pike is a two lane roadway with a posted speed limit of 40 miles per hour. Branch Hill Guinea Pike intersects with Cook and Weber Roads at a signalized intersection. As a separate project, the Clermont County Engineer is planning an improvement project on Branch Hill Guinea Pike in this area that will include reconstruction of the traffic signal installation and turn-lane enhancements at the Cook Road / Weber Road intersection. The County s Branch Hill Guinea Pike project is scheduled for construction in 2017 and these improved conditions will be considered as the baseline (No-Build) condition in this report for purposes of evaluating impacts from the proposed residential development. The improved intersection is expected to include an actuated three-phase traffic signal (with a leading eastbound phase to protect left-turning traffic) and dedicated left-turn lanes on all four approaches. Through-traffic and right-turning traffic will share a single lane on each approach. The expected leftturn bay lengths listed below were included in the capacity analysis scenarios. Cook Road Eastbound: 130-feet Weber Road Westbound: 75-feet Branch Hill Guinea Northbound: 125-feet Branch Hill Guinea Southbound: 170-feet Weber Road is a two lane roadway with a posted speed limit of 35 miles per hour. The existing intersections of Tanglewood Dive and Weber Woods Court with Weber Road are currently stop controlled where traffic on Weber Road does not stop. 3.3 EXISTING TRAFFIC VOLUMES Turning movement traffic counts were collected at the intersection of Weber Road with Branch Hill Guinea Pike on Thursday, October 16, 2014 from 6:30 AM to 8:30 AM and from 4:00 PM to 6:00 PM. Turning movement traffic counts were collected at the intersections of Weber Road with Tanglewood Drive and with Weber Woods Court on Thursday, May 19, 2016 from 6:30 AM to 8:30 AM and from 4:00 PM to 6:00 PM. These times were chosen based on approximate peak hours. The traffic count data is summarized in Appendix B of this report. Based on the count data collected, the AM and PM peak hours of traffic were found to occur from 7:15 to 8:15 AM and from 4:45 to 5:45 PM. The counted volumes for the Thursday AM and PM peak hours are presented in the attached Figure 3A. PAGE 3-1 JUNE 20, 2016
8 WEBER ROAD RESIDENTIAL DEVELOPMENT TRAFFIC IMPACT STUDY 3.0 AREA CONDITIONS Counted Traffic Volumes FIGURE 3A JUNE 20, 2016
9 WEBER ROAD RESIDENTIAL DEVELOPMENT TRAFFIC IMPACT STUDY 4.0 TRAFFIC VOLUME PROJECTIONS 4.1 PROJECTED BACKGROUND (NON-SITE) TRAFFIC VOLUMES The long range traffic projection rate in the surrounding area was provided by Clermont County and is assumed to be 0.25% linear growth per year. The projected 2017 and 2037 background traffic volumes are presented in Figure 4A of this report. 4.2 ESTIMATED SITE-GENERATED TRAFFIC VOLUMES Traffic volumes for the 160 single family residential development were estimated using data from the 9th Edition of ITE s publication Trip Generation. It is anticipated that the development will generate 31 entering and 91 exiting trips in the AM peak and 103 entering and 61 exiting trips in the PM peak. Table 4A, below, depicts the trip generation calculations. Single-Family Detached Housing ITE Land Use Code: 210 X= 160 Dwelling Units SITE-GENERATED TRIPS FITTED CURVE CONDITION ENTERING EXITING TRIPS TOTAL EQUATION PCT NO. PCT NO. TRIPS Weekday Daily Ln(T) = 0.92 LN(X) % % 810 1,620 Weekday A.M. Peak Hour (7-9am) T = 0.70(X) % 31 75% Weekday P.M. Peak Hour (4-6pm) Ln(T) = 0.90 LN(X) % % Table 4A: ITE Trip Generation Rates It is assumed that 45% of the exiting trips will travel north on Branch Hill Guinea Pike, 40% will travel west on Cook Road, and 15% will travel south on Branch Hill Guinea Pike. It is assumed that 35% of the entering trips will travel from the north on Branch Hill Guinea Pike, 40% will travel from the west on Cook Road, and 25% will travel from the south on Branch Hill Guinea Pike. Because the West Access Drive will provide quicker access to the majority of the residential development lots it is assumed that 90% of trips will enter and exit using the West Access Drive, and 10% of trips will enter and exit using the East Access Drive. The site generated traffic volumes and distribution are shown in Figure 4B. 4.3 PROJECTED NO-BUILD AND BUILD TRAFFIC VOLUMES The 2017 and 2037 no-build scenario traffic volumes are represented by the 2017 and 2037 background volumes which are found in Figure 4A. The projected 2017 and 2037 background volumes were combined with site generated traffic volumes to derive the build scenario traffic volumes. The 2017 build scenario traffic volumes are presented in Figure 4C. The 2037 build scenario traffic volumes are presented in Figure 4D. PAGE 4-1 JUNE 20, 2016
10 WEBER ROAD RESIDENTIAL DEVELOPMENT TRAFFIC IMPACT STUDY 4.0 TRAFFIC VOLUME PROJECTIONS 2017 and 2037 Background Traffic Volumes FIGURE 4A JUNE 20, 2016
11 WEBER ROAD RESIDENTIAL DEVELOPMENT TRAFFIC IMPACT STUDY 4.0 TRAFFIC VOLUME PROJECTIONS Site Generated Traffic Volumes FIGURE 4B JUNE 20, 2016
12 WEBER ROAD RESIDENTIAL DEVELOPMENT TRAFFIC IMPACT STUDY 4.0 TRAFFIC VOLUME PROJECTIONS 2017 Build Scenario Total Traffic Volumes FIGURE 4C JUNE 20, 2016
13 WEBER ROAD RESIDENTIAL DEVELOPMENT TRAFFIC IMPACT STUDY 4.0 TRAFFIC VOLUME PROJECTIONS 2037 Build Scenario Total Traffic Volumes FIGURE 4D JUNE 20, 2016
14 WEBER ROAD RESIDENTIAL DEVELOPMENT TRAFFIC IMPACT STUDY 5.0 TRAFFIC ANALYSES Projected 2017 and 2037 no-build and build scenario traffic volumes were analyzed at the study area intersections to determine the impacts of the proposed residential development. A turn-lane warrant analysis was performed in accordance with the guidelines of the ODOT s State Highway Access Management Manual to determine the necessity for auxiliary turn lanes at the proposed site access drives on Weber Road. HCS 2010 capacity analysis software was used to determine the Level of Service (LOS) of each of the study area intersections. The LOS represents an intersection s measure of effectiveness and is used to determine the impacts on the intersection from the proposed development. LOS values range from A (best) to F (failing). 5.1 TURN LANE WARRANT ANALYSIS Turn lane warrant charts were completed for projected 2017 and 2037 build scenario traffic volumes at the proposed site access drives intersections on Weber Road. The warrants were performed for the entering turn movements on the Weber Road approaches. Turn lane warrant charts are included in Appendix C of this report. According to the analysis, right turn lane warrant thresholds are not expected to be met during the AM and PM peak hours with projected opening year (2017) and future year (2037) traffic volumes. No site generated traffic is expected to turn left into the development so left turn lane warrants are not applicable. 5.2 CAPACITY ANALYSIS The projected traffic volumes were analyzed, using HCS 2010 software, on the study area network for the existing intersection configurations. Reports for each analysis are included in Appendix D of this report. The analysis results show that the addition of site-generated traffic causes only minor increases in traffic delays within the study area. Further, all three study intersections will operate at an acceptable LOS for both No-Build (background traffic) and Build (total traffic) conditions in both the opening year (2017) and future design year (2037) with improvements already planned by Clermont County. Tables 5A and 5B on the following page summarizes the results of the capacity analyses for projected traffic volumes for the opening year (2017) and the future year (2037), respectively. As part of the HCS capacity analyses, the left-turn bay storage was evaluated at the Branch Hill Guinea Pike / Cook Road / Weber Road intersection. The analyses showed that the 90th percentile queues fit within the left-turn bay lengths (Queue Storage Ratio 1) to be provided with the Clermont County s planned project for all scenarios (AM, PM, opening year, future year). Varying lane demands will be accommodated by the semi-actuated traffic signal installation with green time split adjustments while maintaining a consistent overall cycle length and providing acceptable levels of service for each approach. PAGE 5-1 JUNE 20, 2016
15 WEBER ROAD RESIDENTIAL DEVELOPMENT TRAFFIC IMPACT STUDY 5.0 TRAFFIC ANALYSES LOS / Delay (sec/veh) Eastbound Westbound Northbound Southbound LT THRU RT LT THRU RT LT THRU RT LT THRU RT INT. BHG / Cook / Weber, No-Build Volumes BHG / Cook / Weber, Build Volumes Weber Rd / West Site Drive (at Tanglewood) Build Volumes Weber Rd / East Site Drive (at Weber Woods) Build Volumes AM PM AM PM AM PM AM PM Table 5A: Capacity Analyses Summary, 2017 Volumes C B C C B B C B C C C C C D B B C C D B C D B C C B C C C C D D B B C C A A B A A A B A A A B A A A B A LOS / Delay (sec/veh) Eastbound Westbound Northbound Southbound LT THRU RT LT THRU RT LT THRU RT LT THRU RT INT. BHG / Cook / Weber, No-Build Volumes BHG / Cook / Weber, Build Volumes Weber Rd / West Site Drive (at Tanglewood) Build Volumes Weber Rd / East Site Drive (at Weber Woods) Build Volumes AM PM AM PM AM PM AM PM Table 5B: Capacity Analyses Summary, 2037 Volumes C B C C B C C B C C C C D C A B B B C B C C B C D B C C C C D C A B B C A A B A A A B A A A B A A A B A PAGE 5-2 JUNE 20, 2016
16 WEBER ROAD RESIDENTIAL DEVELOPMENT TRAFFIC IMPACT STUDY 6.0 FINDINGS & RECOMMENDATIONS 6.1 FINDINGS The following findings were made during the traffic impact study process: 1. The project is projected to create approximately 160 single-family residences. The proposed development site will create an increase in traffic to and from Weber Road, with the majority the traffic traveling to and from the north and west. The proposed development is planned to open in The Clermont County Engineer is planning an improvement project on Branch Hill Guinea Pike that will include reconstruction of the traffic signal installation and turn-lane enhancements at the Cook Road / Weber Road intersection. 3. Turn lane warrant thresholds are not expected to be met at the proposed site access points on Weber Road. 4. According to the capacity analyses, all study intersections are expected to operate at an acceptable level of service for both the opening year (2017) and future year (2037). 6.2 RECOMMENDATIONS The following traffic recommendations are given for the proposed development: 1. The proposed site access drives should be approved as shown on the plans. 2. No additional infrastructure improvements need be associated with the proposed project. PAGE 6-1 JUNE 20, 2016
17 WEBER ROAD RESIDENTIAL DEVELOPMENT TRAFFIC IMPACT STUDY APPENDIX A Preliminary Site Plan JUNE 20, 2016
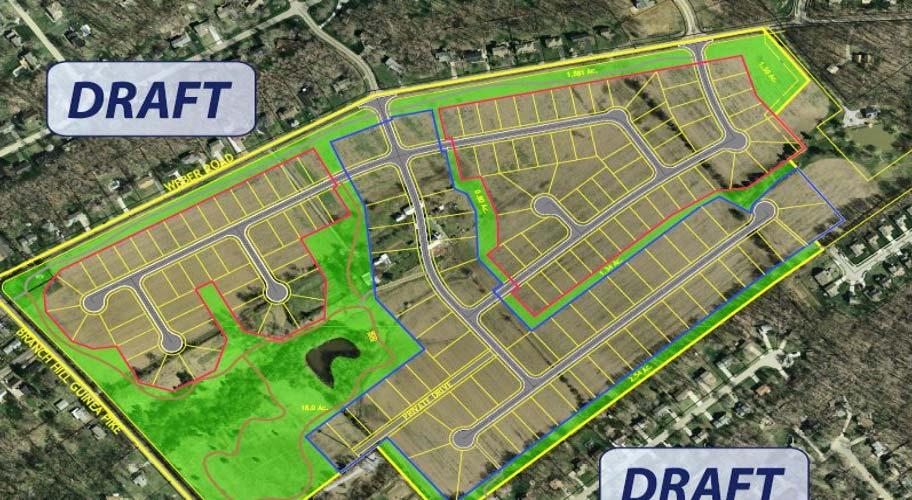
18
19 WEBER ROAD RESIDENTIAL DEVELOPMENT TRAFFIC IMPACT STUDY APPENDIX B Traffic Count Data JUNE 20, 2016
20 Turning Movement Counts Summary Table The Kleingers Group Location: Branch Hill Guinea Pike at Weber Road 6305 Centre Park Drive, West Chester, OH Date of Counts: Thursday, October 16, Performed By: MIO EB Weber Road WB Weber Road NB Branch Hill Guinea SB Branch Hill Guinea AM LEFT THRU RIGHT PED LEFT THRU RIGHT PED LEFT THRU RIGHT PED LEFT THRU RIGHT PED 6:30 to 6:45 am :45 to 7:00 am :00 to 7:15 am :15 to 7:30 am :30 to 7:45 am :45 to 8:00 am :00 to 8:15 am :15 to 8:30 am AM Peak Hr Vol. Peak Hr Factor EB Weber Road WB Weber Road NB Branch Hill Guinea SB Branch Hill Guinea PM LEFT THRU RIGHT PED LEFT THRU RIGHT PED LEFT THRU RIGHT PED LEFT THRU RIGHT PED 4:00 to 4:15 pm :15 to 4:30 pm :30 to 4:45 pm :45 to 5:00 pm :00 to 5:15 pm :15 to 5:30 pm :30 to 5:45 pm :45 to 6:00 pm PM Peak Hr Vol. Peak Hr Factor Peak Hour Times: AM 7:30 to 8:30 PM 4:30 to 5:30 Heavy Vehicle Volumes EB Weber Road WB Weber Road NB Branch Hill Guinea SB Branch Hill Guinea HV - AM LEFT THRU RIGHT LEFT THRU RIGHT LEFT THRU RIGHT LEFT THRU RIGHT 6:30 to 6:45 am :45 to 7:00 am :00 to 7:15 am :15 to 7:30 am :30 to 7:45 am :45 to 8:00 am :00 to 8:15 am :15 to 8:30 am AM Peak HV % Peak HV % 5% 6% 2% 13% 3% 15% 3% EB Weber Road WB Weber Road NB Branch Hill Guinea SB Branch Hill Guinea HV - PM LEFT THRU RIGHT LEFT THRU RIGHT LEFT THRU RIGHT LEFT THRU RIGHT 4:00 to 4:15 pm :15 to 4:30 pm :30 to 4:45 pm :45 to 5:00 pm :00 to 5:15 pm :15 to 5:30 pm :30 to 5:45 pm :45 to 6:00 pm AM Peak HV % Peak HV % 0% 1%
21 Turning Movement Counts Summary Table The Kleingers Group Location: Weber Road at Tanglewood Drive 6305 Centre Park Drive, West Chester, OH Date of Counts: Thursday, May, Performed By: MIO EB Weber Road WB Weber Road N/A SB Tanglewood Drive AM LEFT THRU RIGHT PED LEFT THRU RIGHT PED LEFT THRU RIGHT PED LEFT THRU RIGHT PED 6:30 to 6:45 am :45 to 7:00 am :00 to 7:15 am :15 to 7:30 am :30 to 7:45 am :45 to 8:00 am :00 to 8:15 am :15 to 8:30 am AM Peak Hr Vol. Peak Hr Factor EB Weber Road WB Weber Road N/A SB Tanglewood Drive PM LEFT THRU RIGHT PED LEFT THRU RIGHT PED LEFT THRU RIGHT PED LEFT THRU RIGHT PED 4:00 to 4:15 pm :15 to 4:30 pm :30 to 4:45 pm :45 to 5:00 pm :00 to 5:15 pm :15 to 5:30 pm :30 to 5:45 pm :45 to 6:00 pm PM Peak Hr Vol. Peak Hr Factor Peak Hour Times: AM 7:30 to 8:30 PM 4:30 to 5:30 Heavy Vehicle Volumes EB Weber Road WB Weber Road N/A SB Tanglewood Drive HV - AM LEFT THRU RIGHT LEFT THRU RIGHT LEFT THRU RIGHT LEFT THRU RIGHT 6:30 to 6:45 am :45 to 7:00 am :00 to 7:15 am :15 to 7:30 am :30 to 7:45 am :45 to 8:00 am :00 to 8:15 am :15 to 8:30 am AM Peak HV % Peak HV % 50% 3% EB Weber Road WB Weber Road N/A SB Tanglewood Drive HV - PM LEFT THRU RIGHT LEFT THRU RIGHT LEFT THRU RIGHT LEFT THRU RIGHT 4:00 to 4:15 pm :15 to 4:30 pm :30 to 4:45 pm :45 to 5:00 pm :00 to 5:15 pm :15 to 5:30 pm :30 to 5:45 pm :45 to 6:00 pm AM Peak HV % Peak HV
22 Turning Movement Counts Summary Table The Kleingers Group Location: Weber Road at Weber Woods Ct Centre Park Drive, West Chester, OH Date of Counts: Thursday, May, Performed By: MIO EB Weber Road WB Weber Road N/A SB Weber Woods Ct. AM LEFT THRU RIGHT PED LEFT THRU RIGHT PED LEFT THRU RIGHT PED LEFT THRU RIGHT PED 6:30 to 6:45 am :45 to 7:00 am :00 to 7:15 am :15 to 7:30 am :30 to 7:45 am :45 to 8:00 am :00 to 8:15 am :15 to 8:30 am AM Peak Hr Vol. Peak Hr Factor EB Weber Road WB Weber Road N/A SB Weber Woods Ct. PM LEFT THRU RIGHT PED LEFT THRU RIGHT PED LEFT THRU RIGHT PED LEFT THRU RIGHT PED 4:00 to 4:15 pm :15 to 4:30 pm :30 to 4:45 pm :45 to 5:00 pm :00 to 5:15 pm :15 to 5:30 pm :30 to 5:45 pm :45 to 6:00 pm PM Peak Hr Vol. Peak Hr Factor Peak Hour Times: AM 7:30 to 8:30 PM 4:30 to 5:30 Heavy Vehicle Volumes EB Weber Road WB Weber Road N/A SB Weber Woods Ct. HV - AM LEFT THRU RIGHT LEFT THRU RIGHT LEFT THRU RIGHT LEFT THRU RIGHT 6:30 to 6:45 am :45 to 7:00 am :00 to 7:15 am :15 to 7:30 am :30 to 7:45 am :45 to 8:00 am :00 to 8:15 am :15 to 8:30 am AM Peak HV % Peak HV % EB Weber Road WB Weber Road N/A SB Weber Woods Ct. HV - PM LEFT THRU RIGHT LEFT THRU RIGHT LEFT THRU RIGHT LEFT THRU RIGHT 4:00 to 4:15 pm :15 to 4:30 pm :30 to 4:45 pm :45 to 5:00 pm :00 to 5:15 pm :15 to 5:30 pm :30 to 5:45 pm :45 to 6:00 pm AM Peak HV % Peak HV %
23 WEBER ROAD RESIDENTIAL DEVELOPMENT TRAFFIC IMPACT STUDY APPENDIX C Turn Lane Warrants JUNE 20, 2016
24 2-Lane Highway Right Turn Lane Warrant =< 40 mph or 70 kph Posted Speed Right Turning Traffic (dhv) Advancing Traffic (dhv) REQ Intersection Advancing Right Turning Traffic Volume Traffic Result 1 EB West Drive - AM, NO 2 EB West Drive - PM, NO 3 EB East Drive - AM, NO 4 EB East Drive - PM, NO 5 EB West Drive - AM, NO 6 EB West Drive - PM, NO 7 EB East Drive - AM, NO 8 EB East Drive - PM, NO
25 WEBER ROAD RESIDENTIAL DEVELOPMENT TRAFFIC IMPACT STUDY APPENDIX D HCS 2010 Capacity Analysis Reports JUNE 20, 2016


, veh/h 222 20 18 27 93 111 15 648 12 13 144 68 Signal Information Cycle, s 90.")

, s 5.0 5.0 5.0 6.0 6.0 Max Allow Headway (MAH), s 3.")

, veh/h 241 41 29 222 16 717 14 230 Adjusted Saturation Flow Rate (s),")
, s 6.0 1.4 1.5 10.1 7.0 26.2 27.6 6.3 Green Ratio (g/c) 0.32 0.36 0.23 0.23 0.52 0.")

 (90th percentile) 0.83 0.00 0.29 0.00 0.06 0.")
, s/veh 0.0 0.0 0.0 0.0 0.0 0.0 0.0 0.0 Control Delay (d), s/veh 34.4 19.2 27.")
26 HCS 2010 Signalized Intersection Results Summary General Information Intersection Information Agency The Kleingers Group Duration, h 0.25 Analyst NMM Analysis Date Jun 17, 2016 Area Type Other Jurisdiction Clermont County Time Period AM Peak PHF 0.92 Intersection Branch Hill-Guinea and We Analysis Year 2017 Analysis Period 1> 7:00 File Name 2017 AM No-Build.xus Project Description 2017 AM Peak No-Build Demand Information EB WB NB SB Approach Movement L T R L T R L T R L T R Demand (v), veh/h Signal Information Cycle, s 90.0 Reference Phase 2 Offset, s 0 Reference Point End Uncoordinated Yes Simult. Gap E/W On Force Mode Fixed Simult. Gap N/S On Green Yellow Red Timer Results EBL EBT WBL WBT NBL NBT SBL SBT Assigned Phase Case Number Phase Duration, s Change Period, (Y+Rc), s Max Allow Headway (MAH), s Queue Clearance Time (gs), s Green Extension Time (ge), s Phase Call Probability Max Out Probability Movement Group Results EB WB NB SB Approach Movement L T R L T R L T R L T R Assigned Movement Adjusted Flow Rate (v), veh/h Adjusted Saturation Flow Rate (s), veh/h/ln Queue Service Time (gs), s Cycle Queue Clearance Time (gc), s Green Ratio (g/c) Capacity (c), veh/h Volume-to-Capacity Ratio (X) Available Capacity (ca), veh/h Back of Queue (Q), veh/ln (90th percentile) Queue Storage Ratio (RQ) (90th percentile) Uniform Delay (d1), s/veh Incremental Delay (d2), s/veh Initial Queue Delay (d3), s/veh Control Delay (d), s/veh Level of Service (LOS) C B C C B B C B Approach Delay, s/veh / LOS 32.1 C 30.8 C 18.8 B 12.7 B Intersection Delay, s/veh / LOS 22.3 C Multimodal Results EB WB NB SB Pedestrian LOS Score / LOS Bicycle LOS Score / LOS Copyright 2016 University of Florida, All Rights Reserved. HCS 2010 Streets Version 6.50 Generated: 6/17/2016 5:34:44 PM
27 HCS 2010 Signalized Intersection Results Summary General Information Intersection Information Agency The Kleingers Group Duration, h 0.25 Analyst NMM Analysis Date Jun 17, 2016 Area Type Other Jurisdiction Clermont County Time Period PM Peak PHF 0.92 Intersection Branch Hill-Guinea and We Analysis Year 2017 Analysis Period 1> 7:00 File Name 2017 PM No-Build.xus Project Description 2017 PM Peak No Build Demand Information EB WB NB SB Approach Movement L T R L T R L T R L T R Demand (v), veh/h Signal Information Cycle, s 90.0 Reference Phase 2 Offset, s 0 Reference Point End Uncoordinated Yes Simult. Gap E/W On Force Mode Fixed Simult. Gap N/S On Green Yellow Red Timer Results EBL EBT WBL WBT NBL NBT SBL SBT Assigned Phase Case Number Phase Duration, s Change Period, (Y+Rc), s Max Allow Headway (MAH), s Queue Clearance Time (gs), s Green Extension Time (ge), s Phase Call Probability Max Out Probability Movement Group Results EB WB NB SB Approach Movement L T R L T R L T R L T R Assigned Movement Adjusted Flow Rate (v), veh/h Adjusted Saturation Flow Rate (s), veh/h/ln Queue Service Time (gs), s Cycle Queue Clearance Time (gc), s Green Ratio (g/c) Capacity (c), veh/h Volume-to-Capacity Ratio (X) Available Capacity (ca), veh/h Back of Queue (Q), veh/ln (90th percentile) Queue Storage Ratio (RQ) (90th percentile) Uniform Delay (d1), s/veh Incremental Delay (d2), s/veh Initial Queue Delay (d3), s/veh Control Delay (d), s/veh Level of Service (LOS) C C C C D B B C Approach Delay, s/veh / LOS 22.8 C 34.5 C 15.0 B 24.3 C Intersection Delay, s/veh / LOS 23.1 C Multimodal Results EB WB NB SB Pedestrian LOS Score / LOS Bicycle LOS Score / LOS Copyright 2016 University of Florida, All Rights Reserved. HCS 2010 Streets Version 6.50 Generated: 6/17/2016 2:52:34 PM
28 HCS 2010 Signalized Intersection Results Summary General Information Intersection Information Agency The Kleingers Group Duration, h 0.25 Analyst NMM Analysis Date Jun 17, 2016 Area Type Other Jurisdiction Clermont County Time Period AM Peak PHF 0.92 Intersection Branch Hill-Guinea and We Analysis Year 2037 Analysis Period 1> 7:00 File Name 2037 AM No-Build.xus Project Description 2037 AM Peak No Build Demand Information EB WB NB SB Approach Movement L T R L T R L T R L T R Demand (v), veh/h Signal Information Cycle, s 90.0 Reference Phase 2 Offset, s 0 Reference Point End Uncoordinated Yes Simult. Gap E/W On Force Mode Fixed Simult. Gap N/S On Green Yellow Red Timer Results EBL EBT WBL WBT NBL NBT SBL SBT Assigned Phase Case Number Phase Duration, s Change Period, (Y+Rc), s Max Allow Headway (MAH), s Queue Clearance Time (gs), s Green Extension Time (ge), s Phase Call Probability Max Out Probability Movement Group Results EB WB NB SB Approach Movement L T R L T R L T R L T R Assigned Movement Adjusted Flow Rate (v), veh/h Adjusted Saturation Flow Rate (s), veh/h/ln Queue Service Time (gs), s Cycle Queue Clearance Time (gc), s Green Ratio (g/c) Capacity (c), veh/h Volume-to-Capacity Ratio (X) Available Capacity (ca), veh/h Back of Queue (Q), veh/ln (90th percentile) Queue Storage Ratio (RQ) (90th percentile) Uniform Delay (d1), s/veh Incremental Delay (d2), s/veh Initial Queue Delay (d3), s/veh Control Delay (d), s/veh Level of Service (LOS) C B C C B C C B Approach Delay, s/veh / LOS 26.7 C 27.0 C 26.5 C 15.5 B Intersection Delay, s/veh / LOS 24.8 C Multimodal Results EB WB NB SB Pedestrian LOS Score / LOS Bicycle LOS Score / LOS Copyright 2016 University of Florida, All Rights Reserved. HCS 2010 Streets Version 6.50 Generated: 6/17/2016 4:53:06 PM
29 HCS 2010 Signalized Intersection Results Summary General Information Intersection Information Agency The Kleingers Group Duration, h 0.25 Analyst NMM Analysis Date Jun 17, 2016 Area Type Other Jurisdiction Clermont County Time Period PM Peak PHF 0.92 Intersection Branch Hill-Guinea and We Analysis Year 2037 Analysis Period 1> 7:00 File Name 2037 PM No-Build.xus Project Description 2037 PM Peak No Build Demand Information EB WB NB SB Approach Movement L T R L T R L T R L T R Demand (v), veh/h Signal Information Cycle, s 90.0 Reference Phase 2 Offset, s 0 Reference Point End Uncoordinated Yes Simult. Gap E/W On Force Mode Fixed Simult. Gap N/S On Green Yellow Red Timer Results EBL EBT WBL WBT NBL NBT SBL SBT Assigned Phase Case Number Phase Duration, s Change Period, (Y+Rc), s Max Allow Headway (MAH), s Queue Clearance Time (gs), s Green Extension Time (ge), s Phase Call Probability Max Out Probability Movement Group Results EB WB NB SB Approach Movement L T R L T R L T R L T R Assigned Movement Adjusted Flow Rate (v), veh/h Adjusted Saturation Flow Rate (s), veh/h/ln Queue Service Time (gs), s Cycle Queue Clearance Time (gc), s Green Ratio (g/c) Capacity (c), veh/h Volume-to-Capacity Ratio (X) Available Capacity (ca), veh/h Back of Queue (Q), veh/ln (90th percentile) Queue Storage Ratio (RQ) (90th percentile) Uniform Delay (d1), s/veh Incremental Delay (d2), s/veh Initial Queue Delay (d3), s/veh Control Delay (d), s/veh Level of Service (LOS) C C C D C A B B Approach Delay, s/veh / LOS 30.5 C 35.7 D 10.8 B 15.9 B Intersection Delay, s/veh / LOS 19.3 B Multimodal Results EB WB NB SB Pedestrian LOS Score / LOS Bicycle LOS Score / LOS Copyright 2016 University of Florida, All Rights Reserved. HCS 2010 Streets Version 6.50 Generated: 6/17/2016 4:14:06 PM
30 HCS 2010 Signalized Intersection Results Summary General Information Intersection Information Agency The Kleingers Group Duration, h 0.25 Analyst NMM Analysis Date Jun 17, 2016 Area Type Other Jurisdiction Clermont County Time Period AM Peak PHF 0.92 Intersection Branch Hill-Guinea and We Analysis Year 2017 Analysis Period 1> 7:00 File Name 2017 AM Build.xus Project Description 2017 AM Peak Build Demand Information EB WB NB SB Approach Movement L T R L T R L T R L T R Demand (v), veh/h Signal Information Cycle, s 90.0 Reference Phase 2 Offset, s 0 Reference Point End Uncoordinated Yes Simult. Gap E/W On Force Mode Fixed Simult. Gap N/S On Green Yellow Red Timer Results EBL EBT WBL WBT NBL NBT SBL SBT Assigned Phase Case Number Phase Duration, s Change Period, (Y+Rc), s Max Allow Headway (MAH), s Queue Clearance Time (gs), s Green Extension Time (ge), s Phase Call Probability Max Out Probability Movement Group Results EB WB NB SB Approach Movement L T R L T R L T R L T R Assigned Movement Adjusted Flow Rate (v), veh/h Adjusted Saturation Flow Rate (s), veh/h/ln Queue Service Time (gs), s Cycle Queue Clearance Time (gc), s Green Ratio (g/c) Capacity (c), veh/h Volume-to-Capacity Ratio (X) Available Capacity (ca), veh/h Back of Queue (Q), veh/ln (90th percentile) Queue Storage Ratio (RQ) (90th percentile) Uniform Delay (d1), s/veh Incremental Delay (d2), s/veh Initial Queue Delay (d3), s/veh Control Delay (d), s/veh Level of Service (LOS) D B C D B C C B Approach Delay, s/veh / LOS 34.5 C 35.1 D 21.6 C 14.8 B Intersection Delay, s/veh / LOS 25.8 C Multimodal Results EB WB NB SB Pedestrian LOS Score / LOS Bicycle LOS Score / LOS Copyright 2016 University of Florida, All Rights Reserved. HCS 2010 Streets Version 6.50 Generated: 6/17/2016 5:35:56 PM
31 HCS 2010 Signalized Intersection Results Summary General Information Intersection Information Agency The Kleingers Group Duration, h 0.25 Analyst NMM Analysis Date Jun 17, 2016 Area Type Other Jurisdiction Clermont County Time Period PM Peak PHF 0.92 Intersection Branch Hill-Guinea and We Analysis Year 2017 Analysis Period 1> 7:00 File Name 2017 PM Build.xus Project Description 2017 PM Peak Build Demand Information EB WB NB SB Approach Movement L T R L T R L T R L T R Demand (v), veh/h Signal Information Cycle, s 90.0 Reference Phase 2 Offset, s 0 Reference Point End Uncoordinated Yes Simult. Gap E/W On Force Mode Fixed Simult. Gap N/S On Green Yellow Red Timer Results EBL EBT WBL WBT NBL NBT SBL SBT Assigned Phase Case Number Phase Duration, s Change Period, (Y+Rc), s Max Allow Headway (MAH), s Queue Clearance Time (gs), s Green Extension Time (ge), s Phase Call Probability Max Out Probability Movement Group Results EB WB NB SB Approach Movement L T R L T R L T R L T R Assigned Movement Adjusted Flow Rate (v), veh/h Adjusted Saturation Flow Rate (s), veh/h/ln Queue Service Time (gs), s Cycle Queue Clearance Time (gc), s Green Ratio (g/c) Capacity (c), veh/h Volume-to-Capacity Ratio (X) Available Capacity (ca), veh/h Back of Queue (Q), veh/ln (90th percentile) Queue Storage Ratio (RQ) (90th percentile) Uniform Delay (d1), s/veh Incremental Delay (d2), s/veh Initial Queue Delay (d3), s/veh Control Delay (d), s/veh Level of Service (LOS) C C C D D B B C Approach Delay, s/veh / LOS 23.1 C 38.8 D 15.0 B 24.2 C Intersection Delay, s/veh / LOS 23.9 C Multimodal Results EB WB NB SB Pedestrian LOS Score / LOS Bicycle LOS Score / LOS Copyright 2016 University of Florida, All Rights Reserved. HCS 2010 Streets Version 6.50 Generated: 6/17/2016 2:52:34 PM
32 HCS 2010 Signalized Intersection Results Summary General Information Intersection Information Agency The Kleingers Group Duration, h 0.25 Analyst NMM Analysis Date Jun 17, 2016 Area Type Other Jurisdiction Clermont County Time Period AM Peak PHF 0.92 Intersection Branch Hill-Guinea and We Analysis Year 2037 Analysis Period 1> 7:00 File Name 2037 AM Build.xus Project Description 2037 AM Peak Build Demand Information EB WB NB SB Approach Movement L T R L T R L T R L T R Demand (v), veh/h Signal Information Cycle, s 90.0 Reference Phase 2 Offset, s 0 Reference Point End Uncoordinated Yes Simult. Gap E/W On Force Mode Fixed Simult. Gap N/S On Green Yellow Red Timer Results EBL EBT WBL WBT NBL NBT SBL SBT Assigned Phase Case Number Phase Duration, s Change Period, (Y+Rc), s Max Allow Headway (MAH), s Queue Clearance Time (gs), s Green Extension Time (ge), s Phase Call Probability Max Out Probability Movement Group Results EB WB NB SB Approach Movement L T R L T R L T R L T R Assigned Movement Adjusted Flow Rate (v), veh/h Adjusted Saturation Flow Rate (s), veh/h/ln Queue Service Time (gs), s Cycle Queue Clearance Time (gc), s Green Ratio (g/c) Capacity (c), veh/h Volume-to-Capacity Ratio (X) Available Capacity (ca), veh/h Back of Queue (Q), veh/ln (90th percentile) Queue Storage Ratio (RQ) (90th percentile) Uniform Delay (d1), s/veh Incremental Delay (d2), s/veh Initial Queue Delay (d3), s/veh Control Delay (d), s/veh Level of Service (LOS) C B C C B C D B Approach Delay, s/veh / LOS 31.1 C 29.0 C 29.7 C 17.2 B Intersection Delay, s/veh / LOS 27.8 C Multimodal Results EB WB NB SB Pedestrian LOS Score / LOS Bicycle LOS Score / LOS Copyright 2016 University of Florida, All Rights Reserved. HCS 2010 Streets Version 6.50 Generated: 6/17/2016 4:57:18 PM
33 HCS 2010 Signalized Intersection Results Summary General Information Intersection Information Agency The Kleingers Group Duration, h 0.25 Analyst NMM Analysis Date Jun 17, 2016 Area Type Other Jurisdiction Clermont County Time Period PM Peak PHF 0.92 Intersection Branch Hill-Guinea and We Analysis Year 2037 Analysis Period 1> 7:00 File Name 2037 PM Build.xus Project Description 2037 PM Peak Build Demand Information EB WB NB SB Approach Movement L T R L T R L T R L T R Demand (v), veh/h Signal Information Cycle, s 90.0 Reference Phase 2 Offset, s 0 Reference Point End Uncoordinated Yes Simult. Gap E/W On Force Mode Fixed Simult. Gap N/S On Green Yellow Red Timer Results EBL EBT WBL WBT NBL NBT SBL SBT Assigned Phase Case Number Phase Duration, s Change Period, (Y+Rc), s Max Allow Headway (MAH), s Queue Clearance Time (gs), s Green Extension Time (ge), s Phase Call Probability Max Out Probability Movement Group Results EB WB NB SB Approach Movement L T R L T R L T R L T R Assigned Movement Adjusted Flow Rate (v), veh/h Adjusted Saturation Flow Rate (s), veh/h/ln Queue Service Time (gs), s Cycle Queue Clearance Time (gc), s Green Ratio (g/c) Capacity (c), veh/h Volume-to-Capacity Ratio (X) Available Capacity (ca), veh/h Back of Queue (Q), veh/ln (90th percentile) Queue Storage Ratio (RQ) (90th percentile) Uniform Delay (d1), s/veh Incremental Delay (d2), s/veh Initial Queue Delay (d3), s/veh Control Delay (d), s/veh Level of Service (LOS) C C C D C A B B Approach Delay, s/veh / LOS 29.7 C 37.2 D 12.1 B 18.4 B Intersection Delay, s/veh / LOS 21.4 C Multimodal Results EB WB NB SB Pedestrian LOS Score / LOS Bicycle LOS Score / LOS Copyright 2016 University of Florida, All Rights Reserved. HCS 2010 Streets Version 6.50 Generated: 6/17/2016 4:41:39 PM
34 Two-Way Stop Control file:///c:/users/arichards/appdata/local/temp/u2kf370.tmp Page 1 of 1 6/1/2016 General Information Analyst David Meyer Agency/Co. The Kleingers Group Date Performed 6/1/2016 Analysis Time Period AM Peak TWO-WAY STOP CONTROL SUMMARY Site Information Intersection Jurisdiction Analysis Year West Site Drive and Weber Road Clermont County 2017 Build Project Description East/West Street: Weber Road North/South Street: West Site Drive Intersection Orientation: East-West Study Period (hrs): 0.25 Vehicle Volumes and Adjustments Major Street Eastbound Westbound Movement L T R L T R Volume (veh/h) Peak-Hour Factor, PHF Hourly Flow Rate, HFR (veh/h) Percent Heavy Vehicles Median Type Undivided RT Channelized 0 0 Lanes Configuration LTR LTR Upstream Signal 0 0 Minor Street Northbound Southbound Movement L T R L T R Volume (veh/h) Peak-Hour Factor, PHF Hourly Flow Rate, HFR (veh/h) Percent Heavy Vehicles Percent Grade (%) 0 0 Flared Approach N N Storage 0 0 RT Channelized 0 0 Lanes Configuration LTR LTR Delay, Queue Length, and Level of Service Approach Eastbound Westbound Northbound Southbound Movement Lane Configuration LTR LTR LTR LTR v (veh/h) C (m) (veh/h) v/c % queue length Control Delay (s/veh) LOS A A B A Approach Delay (s/veh) Approach LOS B A Copyright 2010 University of Florida, All Rights Reserved HCS+ TM Version 5.6 Generated: 6/1/2016 9:39 AM
35 Two-Way Stop Control file:///c:/users/arichards/appdata/local/temp/u2kc2fe.tmp Page 1 of 1 6/1/2016 General Information Analyst David Meyer Agency/Co. The Kleingers Group Date Performed 6/1/2016 Analysis Time Period PM Peak TWO-WAY STOP CONTROL SUMMARY Site Information Intersection Jurisdiction Analysis Year West Site Drive and Weber Road Clermont County 2017 Build Project Description East/West Street: Weber Road North/South Street: West Site Drive Intersection Orientation: East-West Study Period (hrs): 0.25 Vehicle Volumes and Adjustments Major Street Eastbound Westbound Movement L T R L T R Volume (veh/h) Peak-Hour Factor, PHF Hourly Flow Rate, HFR (veh/h) Percent Heavy Vehicles Median Type Undivided RT Channelized 0 0 Lanes Configuration LTR LTR Upstream Signal 0 0 Minor Street Northbound Southbound Movement L T R L T R Volume (veh/h) Peak-Hour Factor, PHF Hourly Flow Rate, HFR (veh/h) Percent Heavy Vehicles Percent Grade (%) 0 0 Flared Approach N N Storage 0 0 RT Channelized 0 0 Lanes Configuration LTR LTR Delay, Queue Length, and Level of Service Approach Eastbound Westbound Northbound Southbound Movement Lane Configuration LTR LTR LTR LTR v (veh/h) C (m) (veh/h) v/c % queue length Control Delay (s/veh) LOS A A B A Approach Delay (s/veh) Approach LOS B A Copyright 2010 University of Florida, All Rights Reserved HCS+ TM Version 5.6 Generated: 6/1/2016 9:42 AM
The Highline Development Traffic Impact Study
 The Highline Development Traffic Impact Study Columbia Falls, Montana Prepared For: TD&H Engineering 450 Corporate Drive, Suite 101 Kalispell, MT 59901 June, 2018 130 South Howie Street Helena, Montana
LIC SR INTERCHANGE OPERATIONS STUDY
 LIC SR 16 18.20 - INTERCHANGE OPERATIONS STUDY Project Summary Location SR 16 & W. Church St. Interchange Newark, Ohio Licking County PID 99478 Study Sponsor ODOT District 5 Proposed Work Add Left Turn
TRAFFIC IMPACT STUDY MANUFACTURING COMPANY
 TRAFFIC IMPACT STUDY For MANUFACTURING COMPANY Prepared For: Airway Heights, WA Prepared By: SUNBURST ENGINEERING, P. S. 4310 S. Ball Dr. Veradale, WA 99037 April, 2013 TRAFFIC IMP ACT STUDY Manufacturing
JEP John E. Jack Pflum, P.E. Consulting Engineering 7541 Hosbrook Road, Cincinnati, OH Telephone:
 JEP John E. Jack Pflum, P.E. Consulting Engineering 7541 Hosbrook Road, Cincinnati, OH 45243 Email: jackpflum1@gmail.com Telephone: 513.919.7814 MEMORANDUM REPORT Traffic Impact Analysis Proposed Soccer
TRAFFIC IMPACT STUDY
 TRAFFIC IMPACT STUDY TERRE HAUTE CONVENTION CENTER WABASH AVENUE & 9 TH STREET TERRE HAUTE, INDIANA PREPARED FOR 8365 Keystone Crossing, Suite 201 Indianapolis, IN 46240 Phone: (317) 202-0864 Fax: (317)
Market Street PDP. Nassau County, Florida. Transportation Impact Analysis. VHB/Vanasse Hangen Brustlin, Inc. Nassau County Growth Management
 Transportation Impact Analysis Market Street PDP Nassau County, Florida Submitted to Nassau County Growth Management Prepared for TerraPointe Services, Inc. Prepared by VHB/Vanasse Hangen Brustlin, Inc.
Airline Road: is a two lane residential roadway adjacent to the west side of the proposed school site with a speed limit of 30 mph.
 HIGHLAND PARK ISD TRAFFIC IMPACT STUDY REPORT FOR PROPOSED HPISD ELEMENTARY SCHOOL SITE ON NORTHWEST HIGHWAY BETWEEN AIRLINE ROAD AND DURHAM IN THE CITY OF DALLAS, TEXAS PURPOSE OF STUDY The purpose of
TRAFFIC IMPACT STUDY. Platte Canyon Villas Arapahoe County, Colorado (Arapahoe County Case Number: Z16-001) For
 For") TRAFFIC IMPACT STUDY For Platte Canyon Villas Arapahoe County, Colorado (Arapahoe County Case Number: Z16-001) February 2015 Revised: August 2015 April 2016 July 2016 September 2016 Prepared for: KB Home
TRAFFIC IMPACT STUDY For Platte Canyon Villas Arapahoe County, Colorado (Arapahoe County Case Number: Z16-001) February 2015 Revised: August 2015 April 2016 July 2016 September 2016 Prepared for: KB Home
Signalized Intersections
 Signalized Intersections Kelly Pitera October 23, 2009 Topics to be Covered Introduction/Definitions D/D/1 Queueing Phasing and Timing Plan Level of Service (LOS) Signal Optimization Conflicting Operational
CVS Derwood. Local Area Transportation Review
 CVS Derwood Montgomery County, Maryland May 27, 2016 Local Area Transportation Review Prepared for: JC Bar Properties, Inc. Steve Fleming, PE 415 Fallowfield Road, Suite 301 Camp Hill, Pennsylvania 17011
MEMORANDUM. The study area of the analysis was discussed with City staff and includes the following intersections:
 MEMORANDUM DATE: JULY 6, 2012 TO: FROM: RE: CC: MELANIE KNIGHT BRAD BYVELDS/ JENNIFER LUONG 1050 SOMERSET STREET PRELIMINARY TRAFFIC ANALYSIS OUR FILE NO. 111152 NEIL MALHOTRA The purpose of this memo
Appendix C Traffic Study
 Final Environmental Impact Statement Appendix C Traffic Study Schofield Generating Station Project, Hawaii October 2015 C-1 Final Environmental Impact Statement This page intentionally left blank. Schofield
TRANSPORTATION IMPACT STUDY WHEELER STREET CLOSURE
 TRANSPORTATION IMPACT STUDY WHEELER STREET CLOSURE Village of Greene, Chenango County, New York Prepared for: VILLAGE OF GREENE 49 Genesee Street Greene, NY 13778 Prepared by: LARSON DESIGN GROUP 1000
Traffic Impact Study
 Traffic Impact Study Statham DRI One University Parkway Prepared for: Barrow County Prepared by: October 2012 Table of Contents Executive Summary i Section 1. Introduction 1 Project Description 1 Methodology
April 10, Mr. Curt Van De Walle, City Manager City of Castle Hills 209 Lemonwood Drive Castle Hills, Texas 78213
 Mr. Curt Van De Walle, City Manager City of Castle Hills 209 Lemonwood Drive Castle Hills, Texas 78213 Subject: Revised Castle Hills BASIS Charter School Traffic Impact Analysis Review City of Castle Hills,
MnDOT Method for Calculating Measures of Effectiveness (MOE) From CORSIM Model Output
 From CORSIM Model Output") MnDOT Method for Calculating Measures of Effectiveness (MOE) From CORSIM Model Output Rev. April 29, 2005 MnDOT Method for Calculating Measures of Effectiveness (MOE) From CORSIM Model Output Table of
MnDOT Method for Calculating Measures of Effectiveness (MOE) From CORSIM Model Output Rev. April 29, 2005 MnDOT Method for Calculating Measures of Effectiveness (MOE) From CORSIM Model Output Table of
Per your request and authorization, we have prepared this traffic evaluation for the above referenced project.
 Memorandum To: From: Re: Marc Stout, P.E. City Engineer, City of Roseville Chris Gregerson, P.E., T.E. Matt Weir, P.E., T.E., PTOE Douglas Boulevard Coffee Kiosk Traffic Evaluation Roseville, California
MADISON, WI STONE HOUSE DEVELOPMENT 1000 E. WASHINGTON AVENUE REDEVELOPMENT TRANSPORTATION STUDY DECEMBER 14, 2015
 MADISON, WI STONE HOUSE DEVELOPMENT 1000 E. WASHINGTON AVENUE REDEVELOPMENT TRANSPORTATION STUDY DECEMBER 14, 2015 TABLE OF CONTENTS... 3 Proposed Development... 3 Methodology... 3 Phase 1 Development...
KAISER SOUTH NORTHERN VIRGINIA HUB TRAFFIC IMPACT STUDY PRINCE WILLIAM COUNTY, VIRGINIA TABLE OF CONTENTS. Section 2 BACKGROUND INFORMATION 12
 KAISER SOUTH NORTHERN VIRGINIA HUB TRAFFIC IMPACT STUDY PRINCE WILLIAM COUNTY, VIRGINIA TABLE OF CONTENTS Page EXECUTIVE SUMMARY 1 Purpose of Report and Study Objectives... 1 Site Location and Study Area...
CHAPTER 3. CAPACITY OF SIGNALIZED INTERSECTIONS
 CHAPTER 3. CAPACITY OF SIGNALIZED INTERSECTIONS 1. Overview In this chapter we explore the models on which the HCM capacity analysis method for signalized intersections are based. While the method has
1 h. Page 1 of 12 FINAL EXAM FORMULAS. Stopping Sight Distance. (2 ) N st U Where N=sample size s=standard deviation t=z value for confidence level
 N st U Where N=sample size s=standard deviation t=z value for confidence level") Page 1 of 12 FINAL EXAM FORMULAS Stopping Sight Distance 2 2 V V d 1.47Vt 1.075 i f a 2 2 Vi Vf d 1.47Vt 30( f 0.01 G) Where d = distance (ft) V = speed (mph) t = time (sec) a=deceleration rate (ft/sec
Page 1 of 12 FINAL EXAM FORMULAS Stopping Sight Distance 2 2 V V d 1.47Vt 1.075 i f a 2 2 Vi Vf d 1.47Vt 30( f 0.01 G) Where d = distance (ft) V = speed (mph) t = time (sec) a=deceleration rate (ft/sec
NATHAN HALE HIGH SCHOOL PARKING AND TRAFFIC ANALYSIS. Table of Contents
 Parking and Traffic Analysis Seattle, WA Prepared for: URS Corporation 1501 4th Avenue, Suite 1400 Seattle, WA 98101-1616 Prepared by: Mirai Transportation Planning & Engineering 11410 NE 122nd Way, Suite
Critchfield Rd / SR-129
 NOVEMBER 27, 2017 Critchfield Rd / SR-129 Intersection Safety Study Alternatives Report CRITCHFIELD INTERSECTION SAFETY STUDY Contents Introduction...1 Purpose...2 Existing Conditions...2 Proposed Alternatives...2
Table of Contents Introduction... 4 Study Area... 5
 Table of Contents Introduction... 4 Study Area... 5 Streets and s... 5 Traffic Volumes... 8 Recent and Anticipated Development... 10 Crash Analysis... 10 Projected Traffic Volumes... 11 Trip Generation...
APPENDIX. Sutter Street Bicycle Lanes Stockton, CA January 2010
 APPENDIX reet Bicycle Lanes Stockton, CA January 2010 1. Traffic count locations 2. Turning movement counts o AM PEAK - El Dorado Street at Ingram Street o PM PEAK - El Dorado Street at Ingram Street o
Focused Traffic Analysis for the One Lincoln Park Project
 September 15, 2015 Mr. Bill Johnson Coldwell Banker 511 Sir Francis Drake Boulevard Greenbrae, CA 94904 Focused Traffic Analysis for the One Lincoln Park Project Dear Mr. Johnson; As requested, W-Trans
Appendix I: Traffic Study
 City of Fontana Sierra Lakes Commerce Center Draft EIR Appendix I: Traffic Study FirstCarbon Solutions H:\Client (PN JN)\0144\01440050\EIR\1 ADEIR\01440050 Sec99 99 Appendix Dividers.doc THIS PAGE INTENTIONALLY
PLAZA MEXICO RESIDENCES
 PLAZA MEXICO RESIDENCES TRAFFIC STUDY PREPARED FOR: 3000 E. IMPERIAL, LLC. 6940 Beach Boulevard, D-501 Buena Park, California 90621 PREPARED BY: OCTOBER 5, 2017 translutions the transportatio n solutions
DOLLAR GENERAL PROJECT FOCUSED TRAFFIC ANALYSIS (REVISED) May 20, 2015
 May 20, 2015") DOLLAR GENERAL PROJECT FOCUSED TRAFFIC ANALYSIS (REVISED) May 20, 2015 May 20, 2015 Mr. Dan Biswas, VP of Development CJS DEVELOPMENT II, LLC 5111 North Scottsdale Road, Suite 200 Scottsdale, CA 85250
DOLLAR GENERAL PROJECT FOCUSED TRAFFIC ANALYSIS (REVISED) May 20, 2015 May 20, 2015 Mr. Dan Biswas, VP of Development CJS DEVELOPMENT II, LLC 5111 North Scottsdale Road, Suite 200 Scottsdale, CA 85250
FINAL Traffic Report for the Proposed Golden Valley Road and Newhall Ranch Road Projects in the City of Santa Clarita, California May 5, 2005
 FINAL Traffic Report for the Proposed Golden Valley Road and Newhall Ranch Road Projects in the City of Santa Clarita, California May 5, 2005 Prepared For: EDAW, Inc. 1420 Kettner Boulevard, Suite 620
CE351 Transportation Systems: Planning and Design
 CE351 Transportation Systems: Planning and Design TOPIC: Level of Service (LOS) at Traffic Signals 1 Course Outline Introduction to Transportation Highway Users and their Performance Geometric Design Pavement
Traffic Impact Analysis. for the STARBUCKS STORE. Located at 9900 BALBOA BOULEVARD. Submitted to CITY OF LOS ANGELES. January 2017.
 Traffic Impact Analysis for the STARBUCKS STORE Located at 9900 BALBOA BOULEVARD Submitted to CITY OF LOS ANGELES January 2017 Submitted By January 5, 2017 Ken A. Aitchison, P.E. Transportation Engineering
TRAFFIC IMPACT STUDY FOR SOUTH BAY SALT POND RESTORATION PROJECT PHASE 2
 APPENDIX G TRAFFIC IMPACT STUDY FOR SOUTH BAY SALT POND RESTORATION PROJECT PHASE 2 South Bay Salt Pond Restoration Project Phase II May 2015 Draft Environmental Impact Statement/Report Traffic Impact
SUBJECT: SUMMARY OF FINDINGS. October 29, Mr. Carter Redish Carter Group Architects, Inc S. El Camino Real, Suite F San Clemente, CA 92672
 October 29, 2018 Mr. Carter Redish Carter Group Architects, Inc. 1810 S. El Camino Real, Suite F San Clemente, CA 92672 SUBJECT: CANYON STEEL FOCUSED TRAFFIC IMPACT ANALYSIS Dear Mr. Carter Redish: Urban
6711 LEE HIGHWAY TRAFFIC IMPACT STUDY ARLINGTON, VIRGINIA
 6711 TRAFFIC IMPACT STUDY ARLINGTON, VIRGINIA Prepared for: NVR, Inc. Prepared by: Wells + Associates, Inc. Michael J. Workosky, PTP, TOPS, TSOS John J. Andrus William L. Zeid, PE 703.917.6620 May 4, 2017
US 169/I-70 North Loop Planning & Environmental Linkages Study
 US 169/I-70 North Loop Planning & Environmental Linkages Study VISSIM Calibration Document Draft April 13, 2018 Page i Table of Contents 1. Overview... 1 2. Data Types... 2 3. Model Parameter Adjustments...
TRAFFIC STUDY FOR THE GAFFEY POOL PROJECT LOS ANGELES, CALIFORNIA CITY OF LOS ANGELES, BUREAU OF ENGINEERING OCTOBER 2013 PREPARED FOR PREPARED BY
 TRAFFIC STUDY FOR THE GAFFEY POOL PROJECT LOS ANGELES, CALIFORNIA OCTOBER 2013 PREPARED FOR CITY OF LOS ANGELES, BUREAU OF ENGINEERING PREPARED BY DRAFT TRAFFIC STUDY FOR THE GAFFEY POOL PROJECT October
S.170 th Street Micro-Simulation Seattle-Tacoma International Airport Port of Seattle/Aviation Planning
 Seattle-acoma International Airport Port of Seattle/Aviation Planning Port of Seattle PO OF SEAE Aviation Planning Airport Operations January 24, 2013 Summary he Port is planning to relocate the cell phone
TRANSPORTATION AND TRAFFIC ANALYSIS REPORT
 Square One Drive Extension Municipal Class Environmental Assessment Environmental Study Report Appendix B Transportation and Traffic Analysis Report TRANSPORTATION AND TRAFFIC ANALYSIS REPORT FINAL DRAFT
FARM 1065 PORTION 1, ATLANTIS TRAFFIC IMPACT ASSESSMENT
 FARM 1065 PORTION 1, ATLANTIS TRAFFIC IMPACT ASSESSMENT February 2018 FIRST ISSUE Prepared by: JG AFRIKA (PTY) LTD Branch: Cape Town PO Box 38561 Postal code: 7430 Telephone: 021 530 1800 Email: wink@
Travel Demand Management Plan
 Travel Demand Management Plan Tryg s & Apartment Building 8 West Lake Street Minneapolis, MN AUTHORIZED PROPERTY REPRESENTATIVE: By Dated: Mr. Johnny Carlson Trammell Crow Chicago Development, Inc. 5 South
Approved Corrections and Changes for the Highway Capacity Manual 2000
 Approved Corrections and Changes for the Highway Capacity Manual 2000 Updated 7/8/2005 Previous update 2/27/2004 TRB Committee AHB40, Highway Capacity and Quality of Service Unless stated otherwise, corrections
Brandywine Road Speed Study FINAL REPORT
 Brandywine Road Speed Study FINAL REPORT City of Albuquerque Brandywine Road Speed Study Final Report Albuquerque, New Mexico City of Albuquerque May, 2016 Brandywine Road Speed Study Final Report City
ALTA VISTA COMMERCIAL/ RESIDENTIAL PROJECT
 ALTA VISTA COMMERCIAL/ RESIDENTIAL PROJECT TRAFFIC IMPACT ANALYSIS Prepared For: Paul Conzelman SC Development 2151 Michelson Drive, Suite 140 Irvine, CA 92612 Prepared By: 2030 Main Street, Suite 1200
A Study of Red Light Cameras in Kansas City, MO
 A Study of Red Light s in Kansas City, MO Prepared by the Special Operations Division Executive Summary This paper will analyze the crash data for the 29 red light cameras located in 17 intersections in
FY 2010 Continuing i Planning Program Product Report. Local Transportation and Traffic Data. Wood-Washington-Wirt Interstate Planning Commission
 FY 2010 Continuing i Planning Program Product Report Local Transportation and Traffic Data Travel Time and Delay Data for Belpre and Marietta, Ohio Wood-Washington-Wirt Interstate Planning Commission CONTINUING
Subject: Desert Palisades Specific Plan - Tram Way Access Sight Distance
 Endo Engineering Traffic Engineering Air Quality Studies Noise Assessments July 13, 2015 Mr. Ed Freeman Pinnacle View, LLC P.O. Box 1754 Lake Oswego, OR 97035-0579 Subject: Desert Palisades Specific Plan
CONTINUING PLANNING PROGRAM LOCAL TRANSPORTATION AND TRAFFIC DATA PRODUCT REPORT [OH Corridors]
![CONTINUING PLANNING PROGRAM LOCAL TRANSPORTATION AND TRAFFIC DATA PRODUCT REPORT [OH Corridors]](/thumbs/94/120123757.jpg "CONTINUING PLANNING PROGRAM LOCAL TRANSPORTATION AND TRAFFIC DATA PRODUCT REPORT [OH Corridors]") CONTINUING PLANNING PROGRAM LOCAL TRANSPORTATION AND TRAFFIC DATA PRODUCT REPORT [OH Corridors] Travel Time and Delay Analysis for Belpre (OH) and Marietta (OH) Fiscal Year 2009 Report WOOD WASHINGTON
CONTINUING PLANNING PROGRAM LOCAL TRANSPORTATION AND TRAFFIC DATA PRODUCT REPORT [OH Corridors] Travel Time and Delay Analysis for Belpre (OH) and Marietta (OH) Fiscal Year 2009 Report WOOD WASHINGTON
HALFF 16196? TRAFFIC MANAGEMENT PLAN. Richardson ISD Aikin Elementary School Dallas, Texas North Bowser Road Richardson, Texas 75081
 30280 16196? TRAFFIC MANAGEMENT PLAN Exhibit 572B Aikin Elementary School Planned Development District No. 572 Approved City Plan Commission October20, 2016 July 12, 2016 Prepared for HALFF AVO 31586 PHO1
Traffic Signal Timing: Green Time. CVEN 457 & 696 Lecture #18 Gene Hawkins
 Traffic Signal Timing: Green Time CVEN 457 & 696 Lecture #18 Gene Hawkins The Problem N 25 134 77 128 643 216 181 517 171 111 154 56 NBLT = 181 vph NBTR = 688* vph SBLT = 216 vph SBTR = 771* vph WB = 321*
The Sunland Park flyover ramp is set to close the week of March 19 until early summer
 March 2, 2018 The Sunland Park flyover ramp is set to close the week of March 19 until early summer GO 10 is targeting the week of March 19 to close the Sunland Park Drive flyover entrance ramp to I 10
Parking Regulations Dundas Street West, from Bathurst Street to Dovercourt Road
 STAFF REPORT ACTION REQUIRED Parking Regulations Dundas Street West, from Bathurst Street to Dovercourt Road Date: October 28, 2008 To: From: Toronto and East York Community Council Director, Transportation
Appendix C Final Methods and Assumptions for Forecasting Traffic Volumes
 Fairview Ave. and Main St. Improvements and Local Streets Plan Appendices Ada County Highway District Appendix C Final Methods and Assumptions for Forecasting Traffic Volumes January 3, 207 Appendices
Appendix B. Traffic Analysis Report
 Appendix B Traffic Analysis Report Report No. 14369/TR/WN02 August 2007 SALLINS BYPASS BYPASS OPTIONEERING ANALYSIS - TRAFFIC REPORT Kildare County Council Áras Chill Dara, Devoy Park, Naas, Co Kildare
1.0 INTRODUCTION AND SUMMARY...
 TABLE OF CONTENTS 1.0 INTRODUCTION AND SUMMARY... 1 1.1 Purpose and Study Objective... 1 1.2 Executive Summary... 1 2.0 ROADWAY CONDITIONS... 5 2.1 Granville Parkway (South Intersection)... 8 2.2 Tuscany
Appendixx C Travel Demand Model Development and Forecasting Lubbock Outer Route Study June 2014
 Appendix C Travel Demand Model Development and Forecasting Lubbock Outer Route Study June 2014 CONTENTS List of Figures-... 3 List of Tables... 4 Introduction... 1 Application of the Lubbock Travel Demand
6 th Line Municipal Class Environmental Assessment
 6 th Line Municipal Class Environmental Assessment County Road 27 to St John s Road Town of Innisfil, ON September 6, 2016 APPENDIX L: TRAVEL DEMAND FORECASTING MEMORANDUM Accessible formats are available
Appendix B.1 EMME Model Calibration Memo
 Appendix B.1 EMME Model Calibration Memo itrans 144 Front Street West, Suite 655 Toronto, ON M5J 2L7 Tel: (416) 847-0005 Fax: (905) 882-1557 www.hdrinc.com www.itransconsulting.com File: 2.0 Memorandum
California Urban Infill Trip Generation Study. Jim Daisa, P.E.
 California Urban Infill Trip Generation Study Jim Daisa, P.E. What We Did in the Study Develop trip generation rates for land uses in urban areas of California Establish a California urban land use trip
March Grade Crossing Analysis
 March 2014 Grade Crossing Analysis T E C H N I C A L M E M O R A N D U M South Florida Freight and Passenger Rail Enhancement Study Phase 1A - Rehabilitate Existing Northwood Connection; FPID: 434948-1
VHD Daily Totals. Population 14.5% change. VMT Daily Totals Suffolk 24-hour VMT. 49.3% change. 14.4% change VMT
 6.9 Suffolk 6-54 VMT Population and Travel Characteristics Population 14.5% change 2014 1,529,202 VHD Daily Totals 2014 251,060 49.3% change 2040 1,788,175 2040 374,850 VMT Daily Totals 2014 39,731,990
Design Priciples of Traffic Signal
 Design Priciples of Traffic Signal Lecture Notes in Transportation Systems Engineering Prof. Tom V. Mathew Contents 1 Overview 1 2 Definitions and notations 2 3 Phase design 3 3.1 Two phase signals.................................
MEMORANDUM (DRAFT) DRAFT
 DRAFT") 117 Commercial St. NE, Suite 310 Salem, OR 97301 503.391.8773 www.dksassociates.com MEMORANDUM (DRAFT) DATE: February 15, 2017 TO: FROM: SUBJECT: Alex Dupey, MIG Scott Mansur, PE, PTOE; Garth Appanaitis,
117 Commercial St. NE, Suite 310 Salem, OR 97301 503.391.8773 www.dksassociates.com MEMORANDUM (DRAFT) DATE: February 15, 2017 TO: FROM: SUBJECT: Alex Dupey, MIG Scott Mansur, PE, PTOE; Garth Appanaitis,
Automated Delay Estimation at Signalized Intersections: Phase I Concept and Algorithm Development
 Brigham Young University BYU ScholarsArchive All Theses and Dissertations 2011-03-16 Automated Delay Estimation at Signalized Intersections: Phase I Concept and Algorithm Development Taylor R. Forbush
Final City of Colusa STREETS & ROADWAYS MASTER PLAN. October J Street Suite 390 Sacramento, CA 95814
 Final City of Colusa STREETS & ROADWAYS MASTER PLAN October 2009 660 J Street Suite 390 Sacramento, CA 95814 TABLE OF CONTENTS I. INTRODUCTION... 1 Report Organization...1 II. ANALYSIS METHODOLOGY... 2
Impact of Day-to-Day Variability of Peak Hour Volumes on Signalized Intersection Performance
 Impact of Day-to-Day Variability of Peak Hour Volumes on Signalized Intersection Performance Bruce Hellinga, PhD, PEng Associate Professor (Corresponding Author) Department of Civil and Environmental Engineering,
Bruce Freeman Rail Trail
 Functional Design Report Bruce Freeman Rail Trail Station Road to Concord Town Line Sudbury, Massachusetts PREPARED FOR Town of Sudbury Planning and Community Development 287 Old Sudbury Road Sudbury,
APPENDIX IV MODELLING
 APPENDIX IV MODELLING Kingston Transportation Master Plan Final Report, July 2004 Appendix IV: Modelling i TABLE OF CONTENTS Page 1.0 INTRODUCTION... 1 2.0 OBJECTIVE... 1 3.0 URBAN TRANSPORTATION MODELLING
FDOT Level 2 Roundabout b/c Evaluation
 FDOT Level 2 Roundabout b/c Evaluation This spreadsheet tool compares the cost of a roundabout to the cost of a traditional intersection, as specified by the user. A traditional intersection is defined
TRAFFIC ALERT FOR WEEK OF February 4 8, 2008
 TRAFFIC ALERT FOR WEEK OF February 4 8, 2008 Highway work zones in the Staunton District The following is a list of highway work that might affect traffic in the Staunton transportation district during
Traffic signal design-ii
 CHAPTER 4. TRAFFIC SIGNAL DESIGN-II NPTEL May 3, 007 Chapter 4 Traffic signal design-ii 4.1 Overview In the previous chapter, a simple design of cycle time was discussed. Here we will discuss how the cycle
>
 The grade length should include 5% of the length of the ertical cures at the start and end of the grade. With two consecutie upgrades, 50% of the length of the ertical cure joining them should be included.
I-10 East at Redd closes for 24 hours this Sunday, Feb 11. Then, I-10 West at Resler closes for 27 hours on Feb 25
 NEWS RELEASE a TxDOT Project For immediate release EL PASO DISTRICT Jennifer Wright (915) 790-4340 Jennifer.Wright3@txdot.gov February 9, 2018 I-10 East at Redd closes for 24 hours this Sunday, Feb 11
WOODRUFF ROAD CORRIDOR ORIGIN-DESTINATION ANALYSIS
 2018 WOODRUFF ROAD CORRIDOR ORIGIN-DESTINATION ANALYSIS Introduction Woodruff Road is the main road to and through the commercial area in Greenville, South Carolina. Businesses along the corridor have
Metro Emergency Security Operations Center (ESOC) 410 Center Street City of Los Angeles
 410 Center Street City of Los Angeles") Metro Emergency Security Operations Center (ESOC) 410 Center Street City of Los Angeles Traffic Study August 31, 2015 AECOM 515 South Flower Street, 4 th Floor Los Angeles, CA 90071 Job Number: 60323255
Metro Emergency Security Operations Center (ESOC) 410 Center Street City of Los Angeles Traffic Study August 31, 2015 AECOM 515 South Flower Street, 4 th Floor Los Angeles, CA 90071 Job Number: 60323255
Speed Limit Review. Montague Road, West End. Prepared for Brisbane City Council CEB06842 CEB06842
 Speed Limit Review Montague Road, West End CEB06842 CEB06842 Prepared for Brisbane City Council 2 November 2016 Speed Limit Review Montague Road, West End Document Information Prepared for Brisbane City
1.0 BACKGROUND. January 6, 2006 Proj #
 January 6, 2006 Proj # 4565-01 Mr. Eugene Wat Director of Engineering City of Port Moody 100 Newport Drive Box 36 Port Moody, BC V3H 3E1 Dear Mr. Wat: RE: ALDERSIDE ROAD & IOCO ROAD PEDESTRIAN CROSSING
Appendix BAL Baltimore, Maryland 2003 Annual Report on Freeway Mobility and Reliability
 (http://mobility.tamu.edu/mmp) Office of Operations, Federal Highway Administration Appendix BAL Baltimore, Maryland 2003 Annual Report on Freeway Mobility and Reliability This report is a supplement to:
Prepared for. 3D/International, Inc West Loop South, Suite 400 Houston, Texas November 2006
 DRAFT TRAFFIC IMPACT STUDY FOR PHASED DEVELOPMENT OF TAMU CC Prepared for 3D/International, Inc. 1900 West Loop South, Suite 400 Houston, Texas 77027 November 2006 Interim Review Only Document Incomplete:
2014 Data Collection Project ITE Western District
 2014 Data Collection Project ITE Western District Project Completed By: Oregon State University OSU ITE Student Chapter 101 Kearney Hall Corvallis, OR 97331 Student Coordinator: Sarah McCrea (OSU ITE Student
Appendix B. Durham Region Travel Demand Model Calibration
 Appendix B Durham Region Travel Demand Model Calibration AECOM 300 Water Street 905 668 9363 tel Whitby, ON, Canada L1N 9J2 905 668 0221 fax www.aecom.com To Ron Albright, Municipality of Clarington Page
930 Old Northern Rd & 4 Post Office Rd, Glenorie
 Proposed Mixed Use Development 930 Old Northern & 4, Glenorie TRAFFIC AND PARKING ASSESSMENT REPORT 13 December 2016 Ref 16264 Suite 6, 20 Young Street, Neutral Bay NSW 2089 - PO Box 1868, Neutral Bay
CHAPTER 3 TRANSPORTATION
 CHAPTER 3 TRANSPORTATION This chapter presents information on transportation impacts of Section 2 of the Project that have changed from those identified in the published Westside Subway Extension Final
III. FORECASTED GROWTH
 III. FORECASTED GROWTH In order to properly identify potential improvement projects that will be required for the transportation system in Milliken, it is important to first understand the nature and volume
VIRGINIA S I-77 VARIABLE SPEED LIMIT SYSTEM FOR LOW VISIBILITY CONDITIONS
 VIRGINIA S I-77 VARIABLE SPEED LIMIT SYSTEM FOR LOW VISIBILITY CONDITIONS Christopher D. McDonald, PE, PTOE Regional Operations Director, Southwest Region NRITS and ITS Arizona Annual Conference October
Trip Generation Study: A 7-Eleven Gas Station with a Convenience Store Land Use Code: 945
 Trip Generation Study: A 7-Eleven Gas Station with a Convenience Store Land Use Code: 945 Introduction The Brigham Young University Institute of Transportation Engineers student chapter (BYU ITE) completed
Project Level Traffic Forecast Report Business 40 Reconstruction Study Forsyth County
 Project Level Traffic Forecast Report Business 40 Reconstruction Study Forsyth County TIP No. U-2827 B WBS # 34872.1.1 June 2013 Prepared for North Carolina Department of Transportation Prepared by Project
MEMORANDUM. Trip Generation Analysis
 MEMORANDUM To: RMC Architects From: Matthew Palmer, PE Subject: Trip Generation, Parking Analysis & Level of Service Project: Port of Everett, GTC #13-053 Date: August 25, 2014 The trip generation and
January 12, Mr. Ryan Granger TMGB Wilson, LLC 2221 Health Drive SW, Suite 2200 Wyoming, Michigan 49519
 January 12, 2018 Mr. Ryan Granger TMGB Wilson, LLC 2221 Health Drive SW, Suite 2200 Wyoming, Michigan 49519 Re: Proposed Reserve at Rivertown Mixed-Use Development Updated Trip Generation and Site Driveway
ADAPTIVE SIGNAL CONTROL IV
 ADAPTIVE SIGNAL CONTROL IV Evaluation of the Adaptive Traffic Control System in Park City, Utah Dr. Peter T. Martin Associate Professor Aleksandar Stevanovic Research Associate Ivana Vladisavljevic Research
Signalized Intersection Delay Models
 Transportation System Engineering 56. Signalized Intersection Delay Models Chapter 56 Signalized Intersection Delay Models 56.1 Introduction Signalized intersections are the important points or nodes within
Signalized Intersection Delay Models
 Chapter 35 Signalized Intersection Delay Models 35.1 Introduction Signalized intersections are the important points or nodes within a system of highways and streets. To describe some measure of effectiveness
3.0 ANALYSIS OF FUTURE TRANSPORTATION NEEDS
 3.0 ANALYSIS OF FUTURE TRANSPORTATION NEEDS In order to better determine future roadway expansion and connectivity needs, future population growth and land development patterns were analyzed as part of
Trip Generation Calculations
 Trip Generation Calculations A HORIZON AIR ALLEGIANT AI R EMPLOYEES Daily Trip Generation Daily Trip Generation Daily Trip Generation Directional Flights (per day): 20 Directional Flights (per day): 2.8
FIELD MANUAL FOR CONFIGURING TRAFFIC-RESPONSIVE CONTROL ON TxDOT CLOSED-LOOP SYSTEMS
 FIELD MANUAL FOR CONFIGURING TRAFFIC-RESPONSIVE CONTROL ON TxDOT CLOSED-LOOP SYSTEMS by Geza Pesti, Ph.D., P.E. Associate Research Engineer Texas Transportation Institute Nadeem Chaudhary, Ph.D., P.E.
Expanding the GSATS Model Area into
 Appendix A Expanding the GSATS Model Area into North Carolina Jluy, 2011 Table of Contents LONG-RANGE TRANSPORTATION PLAN UPDATE 1. Introduction... 1 1.1 Background... 1 1.2 Existing Northern Extent of
CHAPTER 5 DELAY ESTIMATION FOR OVERSATURATED SIGNALIZED APPROACHES
 CHAPTER 5 DELAY ESTIMATION FOR OVERSATURATED SIGNALIZED APPROACHES Delay is an important measure of effectiveness in traffic studies, as it presents the direct cost of fuel consumption and indirect cost
South Western Region Travel Time Monitoring Program Congestion Management Process Spring 2008 Report
 South Western Region Travel Monitoring Program Congestion Management Process Spring 2008 Report Prepared by: South Western Regional Planning Agency 888 Washington Boulevard Stamford, CT 06901 Telephone:
PW 001 SNOW REMOVAL AND SANDING FOR ROADWAYS AND SIDEWALKS October 6, 2014 (#223-14) Original October 19, 2015; October 15, 2018 Public Works
 Original October 19, 2015; October 15, 2018 Public Works") Policy Statement: The Village of Kitscoty will provide snow and ice control on municipal streets and sidewalks according to determined priorities. Purpose: To provide direction and information to employees
Policy Statement: The Village of Kitscoty will provide snow and ice control on municipal streets and sidewalks according to determined priorities. Purpose: To provide direction and information to employees
Traffic flow theory involves the development of mathematical relationships among
 CHAPTER 6 Fundamental Principles of Traffic Flow Traffic flow theory involves the development of mathematical relationships among the primary elements of a traffic stream: flow, density, and speed. These