Table of Contents Introduction... 4 Study Area... 5
|
|
|
- Claude Cook
- 5 years ago
- Views:
Transcription

1
2 Table of Contents Introduction... 4 Study Area... 5 Streets and s... 5 Traffic Volumes... 8 Recent and Anticipated Development Crash Analysis Projected Traffic Volumes Trip Generation Distribution of New Trips From Known Developments Alternatives Evaluated Alternative A: Raised Median Alternative B: Raised Median and Additional U-turn Lanes Alternative C: Raised Median and Hooded Left-Turns from FM Alternative D: Eliminate Holleman Drive Through Movement and Provide a Mid-block U-Turn Alternative E: Eliminate Holleman Drive Through Movement with no U-Turn Provided Alternative F: Continuous Flow (CFI) with Displaced Left Turns Alternative G: Displaced Left Turns from FM 2818 and No Through on Holleman Drive Alternative H: No Through or Left Turns From Side Streets Capacity Analysis Analyses of Alternatives A through G Summary of Alternatives A through G Analysis of Alternative H Summary of Alternative H Alternative H Queueing Analysis Recommendations Recommended Locations and Geometry of Right-Turn Deceleration Lanes Geometry of Left-Turn and U-Turn Lanes Remove the Ramp From Jones Butler Road to the FM 2818 Main Lanes Conclusions Appendix Traffic Analysis FM 2818 Schematic Binkley & Barfield 1
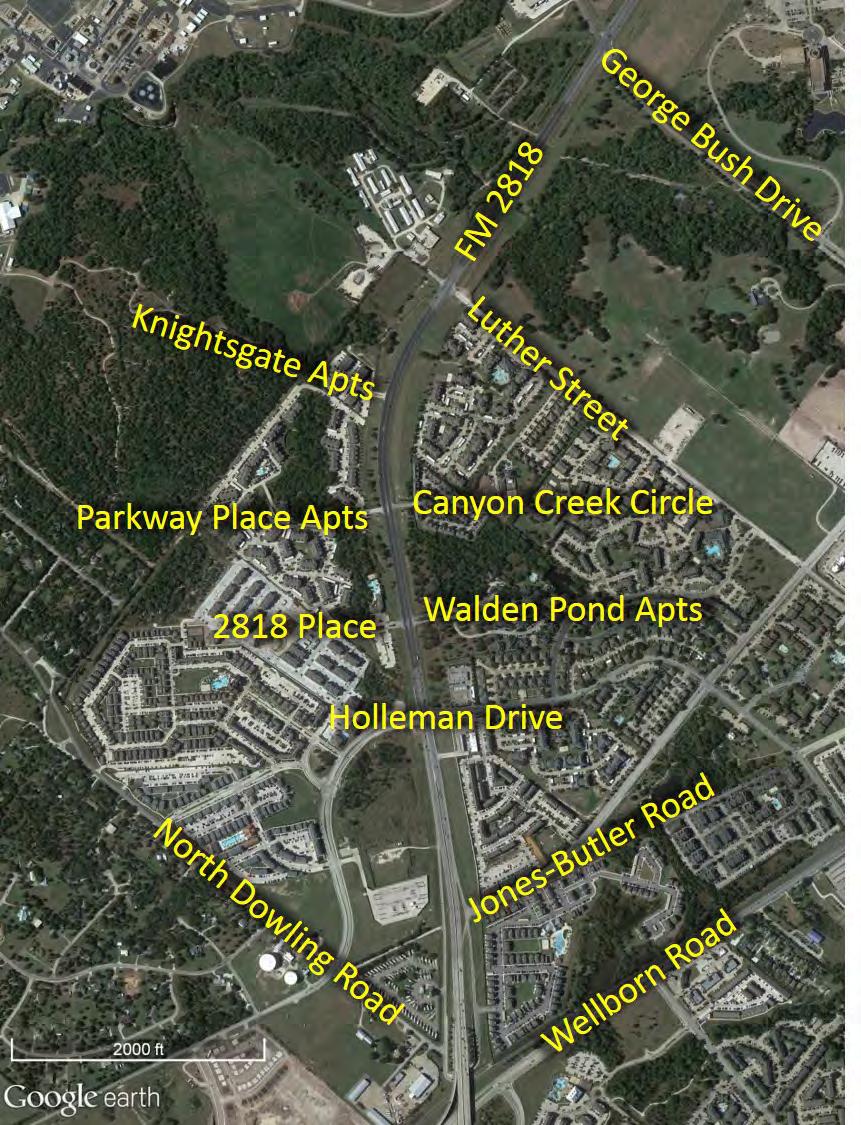
3 List of Figures Figure 1. Site Location...7 Figure 2. Peak Hour Volumes Existing (2016)...9 Figure 3. Peak Hour Volumes Background (2029) Figure 4. Peak Hour Volumes Background (2039) Figure 5. Trip Distribution from Holleman Drive Study Figure 6. Trip Distribution from Holleman Crossing Development Figure 7. Trip Distribution from Park West Development Figure 8. Trip Distribution from Wyndham Garden Hotel Figure 9. Volumes Added from Nearby Developments Figure 10. Peak Hour Volumes Design Year (2029) Figure 11. Peak Hour Volumes Design Year (2039) Figure 12. U-turn for southbound through movements on Holleman Drive Figure 13. Southbound through movement accommodated with a left turn and access from Dowling Road Figure 14. Sample CFI traffic movement diagram Figure 15. Left-turn movements from FM 2818 in a CFI Figure 16. Mid-block U-turns provided to accommodate left-turn and through movements from side streets Figure 17. Peak Hour Volumes (2029) Redistributed for Super Street Figure 18. Peak Hour Volumes (2039) Redistributed for Super Street Figure 19. Simulated 2039 Average Maximum Queues Traffic Analysis FM 2818 Schematic Binkley & Barfield 2
4 List of Tables Table 1. Signalized Crashes: Table 2. Unsignalized Crashes: Table 3. Summary of Peak Hour Trips Added to FM 2818 Network Table 4. AM Peak Hour Level of Service Analysis: Signalized s Table 5. AM Peak Hour Level of Service Analysis: Unsignalized s Table 6. PM Peak Hour Level of Service Analysis: Signalized s Table 7. PM Peak Hour Level of Service Analysis: Unsignalized s Table 8. AM Peak Hour Level of Service by Movement (Alternative H) Table 9. PM Peak Hour Level of Service by Movement (Alternative H) Table 10. Average Vehicular Delay Along Corridor in Alternative H Table 11. Average Maximum Simulated Queue and Calculated Queue (feet) Table 12. Minimum U-Turn Lane Dimensions Table 13. Minimum Left-Turn Lane Dimensions Traffic Analysis FM 2818 Schematic Binkley & Barfield 3
5 TRAFFIC ANALYSIS for FM 2818 Schematic: FM 2154 (Wellborn Road) Ramps to FM 60 (University Drive) Ramps City of College Station, Texas INTRODUCTION The City of College Station and the Texas Department of Transportation plan to widen FM 2818 (Harvey Mitchel Parkway South) from the ramps at FM 2154 (Wellborn Road) to FM 60 (University Drive). Reconstruction of the corridor will modify the existing five-lane cross section comprised of two through lanes for each direction and a two-way left-turn lane median. In the process of determining a preferred alternative for how the corridor should be configured, Binkley and Barfield, Inc. (BBI) analyzed the traffic operations of the roadway under the current and possible future conditions. This report documents roadway operations under the following conditions with the identified design year: Existing 2016 Existing with planned improvements 2016 No Build 2029 Alternative A 2029 Alternative B 2029 Alternative C 2029 Alternative D 2029 Alternative E 2029 Alternative F 2029 Alternative G 2029 Alternative H 2029 Alternative H 2039 Each alternative differs from another by how lanes are configured along the corridor, access is provided at key driveways, and/or the signal phasing used at signalized intersections. As part of the evaluation process, each configuration has been modeled in a traffic simulation to obtain measures of effectiveness used in the decision-making process. The preferred alternative results in the least amount of delay along the corridor while addressing safety concerns that have been identified in a crash analysis. Each alternative is briefly described below. Alternative A: A raised median throughout corridor with median openings only at signalized intersections. U-turns are allowed from traditional turn lanes at these locations. Alternative B: A raised median throughout the corridor with median openings only at signalized intersections. U-turn lanes are provided at Luther Street and at Holleman Drive adjacent to the left-turn lanes. Alternative C: A raised median throughout the corridor with median openings at signalized intersections and also hooded left-turn lanes at Canyon Creek Circle and the Parkway Place Apartments. Alternative D: A raised median throughout the corridor. At Holleman Drive, the through movement that crosses FM 2818 is eliminated. A mid-block U-turn is provided on FM Traffic Analysis FM 2818 Schematic Binkley & Barfield 4
6 Alternative E: A raised median throughout the corridor. At Holleman Drive, the through movement that crosses FM 2818 is eliminated. There is no mid-block U-turn provided. Alternative F: A raised median throughout the corridor. At Holleman Drive, the left-turn movements are displaced to create a continuous flow intersection (CFI). Alternative G: A raised median throughout the corridor. At Holleman Drive, the left-turn movements are displaced to create a continuous flow intersection, and the through movement crossing FM 2818 is eliminated. Alternative H: A super street with a wide median separating the two directions on FM The through and left-turn movements are eliminated from the signalized side streets. Mid-block U-turns are provided. STUDY AREA The study corridor extends along FM 2818 (Harvey Mitchel Parkway South) from the ramps at Wellborn Road (FM 2154) to Raymond Stotzer Parkway / University Drive (FM 60). In this study, the FM 2818 corridor is considered to be oriented in the east-west direction and the side streets extend north-south. The sections below describe the existing conditions along the corridor, the current traffic volumes, relevant development that is expected in the area, and an analysis of crashes along the corridor. STREETS AND INTERSECTIONS FM 2818 is classified as an expressway in the City Master Thoroughfare Plan (MTP) and contains five lanes along most of the study corridor; however, there is no median left-turn lane near the Wellborn Road (FM 2154) ramps. At this location FM 2818 operates as a freeway with grade separation over Wellborn Road with two main lanes for each direction. The posted speed limit is 55 mph. Raymond Stotzer Parkway / University Drive (FM 60) is a four lane road with a posted speed limit of 55 mph. The road is identified as a proposed 6-lane major arterial on one side and a freeway/expressway on the other side in the City s MTP. Currently, the interchange of FM 2818 at Raymond Stotzer Parkway / University Drive is being reconstructed to have ramps configured as a diverging diamond to improve operations of the interchange. George Bush Drive (FM 2347) is a four-lane divided roadway with a posted speed limit of 45 mph. George Bush Drive is classified as a four-lane major arterial on the City s MTP and is built to its full intended cross section. There are planned improvements at the intersection of FM 2818 at George Bush Drive that will increase the number of through lanes for each direction at the intersection to three and provide an additional eastbound left-turn lane on FM 2818 turning north onto George Bush Drive. The City s MTP identifies the intersection as a candidate for grade separation in the future. Luther Street is a two-lane road defined in the City s MTP as a two-lane major collector. Though it currently terminates on the south side of the intersection at the Poultry Science Center, the MTP indicates the two-lane collector is to be extended south and east to Dowling Road. The Knightsgate Apartments are located east of Luther Street on the south side of FM Canyon Creek Circle provides access to FM 2818 for a townhome community. Canyon Creek Circle is located on the north side of FM 2818 and is the only access for the townhome community. On the south side of FM 2818 across from Canyon Creek Circle is the Parkway Place apartments complex. Traffic Analysis FM 2818 Schematic Binkley & Barfield 5
7 The Walden Pond Apartments are located on the north side of FM 2818 to the west of Holleman Drive. On the opposite side of FM 2818 is the 2818 Place apartment complex. Holleman Drive is a two-lane undivided road north of FM 2818 and four-lane divided road south of FM The City MTP identifies the north portion as a proposed four-lane minor arterial. The south portion is built out to its identified classification as a four-lane minor arterial. There are planned improvements at the intersection of FM 2818 at Holleman Drive that will add a leftturn lane for the northbound to westbound movement. Frontage roads are used on the east portion of the study corridor where FM 2818 contains a freeway segment with grade separated ramps at Wellborn Road. Dowling Road intersects the eastbound frontage road (FM 2818 Eastbound Frontage Road) and Jones-Butler Road intersects the westbound frontage road (FM 2818 Westbound Frontage Road). The Eastbound Frontage Road connects to the Westbound Frontage Road with a U-turn that passes under the FM 2818 main lanes. See Figure 1 for an aerial photograph of the area identifying the key roads and study locations along the FM 2818 corridor. Traffic Analysis FM 2818 Schematic Binkley & Barfield 6
8
9 TRAFFIC VOLUMES Traffic data were collected on March 29, 2016 and included 24-hour counts and AM and PM Peak Hour turning movement counts. The Peak Hours were identified within the 7 AM to 9 AM and 4 PM to 6 PM morning and afternoon periods. Traffic counts were collected during the AM and PM Peak Hours at the following intersections on FM 2818: George Bush Drive Luther Street Knightsgate Apartments Canyon Creek Circle / Parkway Place apartments Walden Pond Apartments / 2818 Place apartments Holleman Drive Dowling Road at FM 2818 Eastbound Frontage Road Jones-Butler Road at FM 2818 Westbound Frontage Road Figure 2 identifies the AM and PM Peak Hour movements as observed in Traffic Analysis FM 2818 Schematic Binkley & Barfield 8
10
11 RECENT AND ANTICIPATED DEVELOPMENT Although most of the land along the FM 2818 corridor has been fully developed to its intended land use, there remains several areas that are experiencing growth. Texas A&M University (TAMU) recently announced it has surpassed enrollment of 60,000 students on the College Station campus and intends to continue growing. Part of that growth is reflected in the TAMU Park West student housing project located between Luther Street and George Bush Drive and adjacent to Penberthy Road and Jones Butler Road. The development will house approximately 3,400 students. Other anticipated or recently-completed projects in the area include The Retreat, located at the intersection of Jones-Butler Road and FM 2818 Frontage Road; the Wyndham Garden Hotel; Holleman Crossing; The Junction Cottages & Townhomes; and the Aspen Heights apartments. The latter three developments are all located on Holleman Drive South. A recent study completed by BBI evaluated future traffic operations along Holleman Drive South that accounted for some of these and other anticipated developments. This study incorporates assumptions from that study, as identified later in this report. CRASH ANALYSIS An analysis of crashes along the FM 2818 corridor was completed to identify crashes that may be mitigated by the addition of a raised median. Crashes occurring between Wellborn Road and George Bush Drive reported over a three-year period ( ) were analyzed. Of the 256 crash records that were reviewed, 114 crashes were found to be directly attributed to the study intersections. These 114 crashes were investigated to reveal critical patterns between the sites relevant to the left-turn movements. With the inability to make a left-turn movement at unsignalized locations, it is reasonable to assume that the crashes involving left-turns at these locations would be eliminated by the median barrier. Results of the crash analysis are summarized in Table 1 and Table 2 for the signalized and unsignalized intersections, respectively. The left-turn crashes identified in Table 1 and Table 2 are specifically those that involve conflicting movements, and not side-swipe or rear-end collisions that are in the same direction of travel (even if in the left-turn lane). Crash diagrams with information from each reported collision at the study intersections are provided in the Appendix. Table 1. Signalized Crashes: All Directions Left-Turn Crashes With Conflicting Movements Total Crashes From FM 2818 Onto FM 2818 George Bush Drive (57%) 1 (5%) Luther Street 15 1 (7%) 1 (5%) Holleman Drive (32%) 5 (9%) Total (34%) 7 (8%) Traffic Analysis FM 2818 Schematic Binkley & Barfield 10
12 Table 2. Unsignalized Crashes: Left-Turn Crashes With All Directions Conflicting Movements Total Crashes From FM 2818 Onto FM 2818 TAMU Sewer Plant 1 0 (0%) 1 (100%) Knightsgate Apts 2 0 (0%) 1 (50%) Parkway Place Apts / Canyon Creek Circle 6 0 (0%) 4 (67%) 2818 Place Apts / Walden Pond Apts 12 2 (17%) 5 (42%) Jones-Butler Road 1 0 (0%) 0 (0%) Total 22 2 (9%) 11 (50%) As shown in Table 1, 34% of the 92 crashes at signalized intersections are associated with leftturns from FM 2818 to the minor street. The patterns in crash frequencies are not likely to be reduced with a raised median because the proposed improvements include openings in the median at these locations. However, the proposed cross section includes three through lanes in each direction. With three lanes to cross and high opposing traffic volumes, it is unlikely that leftturns would operate in a permissive phase, and it is not recommended that they do so. By having protected-only phasing for the left-turns, the crash frequency for left-turns is likely to decrease as several crashes are due to motorists not yielding to oncoming traffic when completing left-turn maneuvers. As shown in Table 2, 50% of the 22 reported crashes at unsignalized intersections are associated with left-turn movements onto FM 2818 from the minor road. In several instances, the crash reports indicate that traffic was stopped in only the outside lane when the responsible driver attempted to turn left through a gap in the stopped traffic. The collision occurred with a moving vehicle in the inside lane. For these cases, the drivers did not misjudge a gap in traffic, but visibility was restricted such that drivers were misled to think a left-turn was safe. Based on the tabulation in Table 2, at least 13 crashes over a three-year period (approximately 4 per year) will be reduced by the installation of a raised median. Crash severity was not a key part of the crash analysis. However, there was one crash, out of the thirteen involving left-turns, that resulted in two fatalities, three incapacitating injuries, and two non-incapacitating injuries. The crash occurred at the Parkway Place Apartments on March 23, Nationally, 6.8% of all crashes involving left turns result in a fatality (as reported by the National Highway Traffic Safety Administration s Traffic Safety Facts 2014). One fatal crash out of thirteen left-turn crashes, as was observed on this corridor, is consistent with national trends. PROJECTED TRAFFIC VOLUMES Background traffic along the FM 2818 corridor was assumed to grow at an annual rate of 1%. A rate of 1% may be considered smaller than is typical, but was selected based on growth observed at similar locations in the area and because additional trips generated by surrounding developments are included as discussed below. The background traffic was grown over a period of 13 years and 23 years from 2016, to determine 2029 and 2039 traffic volumes that represent 10 or 20 years from project completion. Figure 3 shows the resulting 2029 background traffic, and Figure 4 shows the traffic grown through A design life of 10 years was assumed for the first Alternatives evaluated (A through G). Alternative H was evaluated at 10 and 20 years from opening. TRIP GENERATION The Holleman Drive South study completed by BBI assumed a very aggressive growth along the Holleman Drive corridor for the next 22 years. The growth in background traffic combined Traffic Analysis FM 2818 Schematic Binkley & Barfield 11
13 with assumed development of land with urban land use led to equivalent annual growth rates of more than 5% at each intersection. Such aggressive growth produced a conservative analysis to ensure the corridor is designed to meet the future traffic demands. It was determined that the forecasted traffic identified in the Holleman Drive South Report should be added to the traffic at and along FM Preliminary analysis indicated that there was not enough capacity for FM 2818 to manage all forecasted Holleman Drive traffic, even after implementing one of the proposed alternatives. To conduct an analysis that addresses some growth of the area, half of the trips generated from the Holleman Drive study were added to the network. The included volumes are summarized in Table 3. In addition to the volumes from the Holleman Drive Study, new traffic generated from the TAMU Park West development, the Holleman Crossing apartments, and a forthcoming Wyndham Garden Hotel with adjacent restaurant were assumed to use the FM 2818 corridor. The assumed trips generated from the Holleman Crossing apartments were derived from a traffic impact analysis completed for Crystal Real Estate Development in August 2014 and are reprinted in Table 3. Trips generated from the Park West development were based on the number of apartment bedrooms with a 30% reduction for use of transit and walking proximity to the TAMU campus. Trips generated for the hotel and adjacent restaurant were calculated from assuming ITE Trip Generation rates for a hotel (130 beds) and a high-turnover sit-down restaurant (4,200 square feet). Table 3 indicates the number of assumed trips generated. Table 3. Summary of Peak Hour Trips Added to FM 2818 Network Generator ITE Code Size AM Peak Hour Trips PM Peak Hour Trips Enter Exit Total Enter Exit Total Holleman Drive Study 1 Mixed , ,260 Holleman Crossing 2 Mixed TAMU Park West 222 3,400 beds Wyndham Garden Hotel Mixed Notes: 1 Represents 50% of 2038 forecasted traffic added to the Holleman Drive corridor determined in BBI study. 2 Trip generation from TIA for Crystal Real Estate Development. DISTRIBUTION OF NEW TRIPS FROM KNOWN DEVELOPMENTS The trips generated from the Holleman Drive corridor, the Holleman Crossing development, the Park West housing project, and the Wyndham Garden Hotel were distributed throughout the road network based on the likely routes drivers will take to reach local attractions. Current traffic patterns helped identify appropriate distributions. Figures 5 through 9 identify the distributions used and the resulting traffic added to the network background traffic. Figure 10 shows the combined Peak Hour traffic for 2029 resulting from the growth of background traffic and the inclusion of trips generated from other developments. Figure 11 shows the combined Peak Hour traffic for Traffic Analysis FM 2818 Schematic Binkley & Barfield 12
14
15
16
17
18
19
20
21
22
23 ALTERNATIVES EVALUATED Each of the proposed alternatives in this study includes a six-lane cross section with a median along the corridor that restricts left-turn movements of unsignalized intersections. The alternatives differ in how left-turn and U-turn movements are accommodated and how the signalized intersections are phased. The alternatives are evaluated in terms of the resulting delay and level of service (LOS) at each intersection and the ability to reduce crashes at the unsignalized intersections. ALTERNATIVE A: RAISED MEDIAN Alternative A includes a raised median along the corridor with median openings at all signalized intersections. Left-turns and U-turns will be allowed from traditional turn lanes at these locations. The median will be closed at all unsignalized locations to prohibit all egress and ingress leftturns. ALTERNATIVE B: RAISED MEDIAN AND ADDITIONAL U-TURN LANES Alternative B includes a raised median along the corridor with median openings at all signalized intersections and an additional U-turn lane provided at Luther Street and at Holleman Drive. These U-turn lanes will allow motorists to reverse direction due to being diverted by the raised median. ALTERNATIVE C: RAISED MEDIAN AND HOODED LEFT-TURNS FROM FM 2818 Alternative C provides median openings with left-turn lanes at all signalized intersections. Additional openings with hooded left-turns will be provided at Canyon Creek Circle and the Parkway Place apartments. The configuration of the hooded left-turn lanes will allow for leftturns from FM 2818 to these driveways, but not for left-turn movements onto FM ALTERNATIVE D: ELIMINATE HOLLEMAN DRIVE THROUGH MOVEMENT AND PROVIDE A MID-BLOCK U-TURN Alternative D eliminates the northbound and southbound through movement that crosses FM A signalized U-turn west of the intersection is provided for motorists intending to make a through movement in the southbound direction. Motorists would turn right at FM 2818, complete a U-turn at the proposed signal, then turn right at Holleman Drive as shown in Figure 12. It is expected that some diverted through traffic would turn left and use the frontage road exit at Dowling Road to connect to Holleman Drive. Northbound motorists intending to make a through movement would similarly turn right, but instead of a signalized U-turn, would use the frontageroad turn-around under the bridge at Jones Butler Road. It is likely that a large proportion of motorists intending to make a northbound through movement would eventually adjust their travel to avoid the intersection and exclusively use Dowling Road to connect at Jones Butler Road. Traffic Analysis FM 2818 Schematic Binkley & Barfield 22


24 Figure 12. U-turn for southbound through movements on Holleman Drive. ALTERNATIVE E: ELIMINATE HOLLEMAN DRIVE THROUGH MOVEMENT WITH NO U-TURN PROVIDED It is expected that some motorists will use the frontage road turnaround at Jones Butler Road if the through movement is eliminated and only left-turns and right-turns are allowed. Southbound motorists can turn left, use the frontage road exit, and then turn right onto Dowling Road to continue to Holleman Drive as shown in Figure 13. Forcing all through movements to use this route only creates a longer travel distance for motorists along Holleman Drive. This proposed route is more direct than the U-turn provided in Alternative D for motorists connecting to areas along Holleman Drive to the south of the Dowling Road intersection. Figure 13. Southbound through movement accommodated with a left turn and access from Dowling Road. Traffic Analysis FM 2818 Schematic Binkley & Barfield 23


25 ALTERNATIVE F: CONTINUOUS FLOW INTERSECTION (CFI) WITH DISPLACED LEFT TURNS Alternative D and Alternative E remove the northbound and southbound through movemetns that cross FM 2818 at Holleman Drive, thereby reducing one phase needed to be served during the signal s cycle. A continuous flow intersection (CFI) with displaced left turns removes left-turn movements from the main intersection to upstream signalized locations. This results in fewer conflict points at the main intersection and the elimination of the left-turn phase as the left-turn movments would then run concurrent with the through movements. Additional coordinated signals are used so that the displaced left turns cross the conflicting eastbound or westbound traffic with little interference. A simple configuration is shown in Figure 14. The left-turn movements applied to the intersection of FM 2818 at Holleman Drive are shown in Figure 15. Figure 14. Sample CFI traffic movement diagram. Figure 15. Left-turn movements from FM 2818 in a CFI. ALTERNATIVE G: DISPLACED LEFT TURNS FROM FM 2818 AND NO THROUGH ON HOLLEMAN DRIVE Alternative G is patterned after the CFI suggested in Alternative F, with the proposed change of eliminating through movements on Holleman Drive, as suggested by Alternative E. As shown in Alternative E, motorists intending to make a northbound or southbound through movement on Holleman Drive can use the connection at Dowling Road and the turnaround to Jones Butler Drive. ALTERNATIVE H: NO THROUGH OR LEFT TURNS FROM SIDE STREETS Alternative H is a super street concept that allows all movements from FM 2818 (left-turn, through, and right-turn movements) and only permits right-turn movements from the side streets. To accommodate the motorists intending to go through or turn left from the side street, mid-block U-turns are permitted at signalized locations. The result is a dramatic increase in efficiency for the main arterial by reducing the number of phases at the intersection to two Traffic Analysis FM 2818 Schematic Binkley & Barfield 24

26 phases: one serving the main through movement and one serving both the left-turn movement from the arterial and the right-turn movement from the minor approach. Figure 16. Mid-block U-turns provided to accommodate left-turn and through movements from side streets. INTERSECTION CAPACITY ANALYSIS Analyses of delay and resultant Levels of Service (LOS) of the study intersections were performed with Synchro and VISSIM software. The model inputs were the volumes identified in Figures 10 and 11 and timing and phasing plans for the signalized intersections as currently used by the City, or phasing and timing that may be used if the phasing would change for an Alternative. The volumes at the study intersections were adjusted as necessary for any diverted movements. Copies of the computer printouts and a description of the various levels of service have been included in the Appendix. Typically, the desirable levels of service are "A" through "D." Levels of service "E" and "F" are undesirable. The findings and discussion of the analyses are divided into two groups. The first group contains Alternatives A through G, which were analyzed using Synchro. Upon reviewing the findings of the analyses, it was determined that Alternatives A through G did not provide adequate capacity for the traffic demands in Alternative H (a super street eliminating leftturns and through movements from the side streets) was subsequently evaluated as a more dramatic solution. Alternative H, recommended as the appropriate configuration for the corridor, was evaluated with VISSIM software. VISSIM provides a more-rigorous analysis and is appropriate for complex situations such as alternative intersections. The findings of the analysis of Alternative H, the super street, are discussed after those of Alternatives A through G. ANALYSES OF ALTERNATIVES A THROUGH G Alternatives A through G were evaluated with Synchro software. For Alternatives D through G, only the Holleman Drive intersection was analyzed and in the PM Peak Hour because it was determined that addressing the inadequate capacity at the Holleman Drive intersection was the key to addressing congestion throughout the corridor. The results of the capacity analyses for the study intersections of Alternatives A through G are summarized by approach in the following tables: Table 4. AM Peak Hour Level of Service Analysis: Signalized s Table 5. AM Peak Hour Level of Service Analysis: Unsignalized s Table 6. PM Peak Hour Level of Service Analysis: Signalized s Traffic Analysis FM 2818 Schematic Binkley & Barfield 25
27 Table 7. PM Peak Hour Level of Service Analysis: Unsignalized s The summary tables contain results from analyses for the following conditions which are discussed below: Existing (2016) o Operations as currently observed using existing traffic volumes. Existing (2016) with Planned Improvements o Operations as forecasted following improvements planned at the Holleman Drive and George Bush Drive intersections. Future (2029) No Build o Operations using 2029 volumes and no changes made following the current planned improvements. Future (2029) Alternative A o Operations using 2029 volumes, planned improvements, 6-lane divided cross section with median openings, and turn lanes only at signalized intersections. Future (2029) Alternative B o Operations using 2029 volumes, planned improvements, 6-lane divided cross section with median openings, and turn lanes only at signalized intersections. Additional U-turn lanes are provided at the Holleman Drive and Luther Street intersections. Future (2029) Alternative C o Operations using 2029 volumes, planned improvements, 6-lane divided cross section with median openings, turn lanes only at signalized intersections, and hooded left-turn lanes provided at Canyon Creek Circle. Future (2029) Alternative D o Operations using 2029 volumes, planned improvements, 6-lane divided cross section with no through movement at Holleman Drive. The southbound through movement on Holleman Drive is accommodated by a mid-block U-turn west of the intersection. Future (2029) Alternative E o Operations using 2029 volumes, planned improvements, 6-lane divided cross section with no through movement at Holleman Drive. A mid-block U-turn is not provided. Future (2029) Alternative F o Operations using 2029 volumes, planned improvements, 6-lane divided cross section with a continuous flow intersection using displaced left-turns at Holleman Drive. Future (2029) Alternative G o Operations using 2029 volumes, planned improvements, 6-lane divided cross section with a continuous flow intersection using displaced left-turns at Holleman Drive. Through movements are not provided at Holleman Drive. Existing (2016) The analysis identified that the signalized intersections at George Bush Drive and at Luther Street operate at LOS D or better in the AM and PM Peak Hours. The intersection at Holleman Drive, however, currently operates at LOS E in the AM and PM Peak Hours. Of the unsignalized intersections, the northbound approaches at the Parkway Place Apartments and the 2818 Place Apartments experience failing levels of service in the AM and PM Peak Hours. The delay calculated for these movements is greater than 300 seconds, but it is likely that, in reality, motorists executing left-turns from the side streets use the two-way left-turn lane to split the turn into two maneuvers, or they accept smaller gaps than are applied by model assumptions. This Traffic Analysis FM 2818 Schematic Binkley & Barfield 26
28 second reason is possible given the motorist demographics. Such behavior can lead to higher crash rates. Existing (2016) with Planned Improvements The Existing with Planned Improvements scenario focused on corridor operations with the intersections at Holleman Drive and at George Bush drive configured to how they will be constructed in the near future. The modifications at George Bush Drive will increase the number of through lanes at the intersection to three for each direction and provide an additional left-turn lane eastbound on FM 2818 turning north onto George Bush Drive. The modifications at Holleman Drive will add another left-turn lane for the northbound to westbound movement. This improvement creates dual northbound left-turn lanes. There is a notable improvement in operations at George Bush Drive and at Holleman Drive with the planned improvements. The intersection at George Bush Drive operates at LOS B in the AM Peak Hour (instead of LOS D), reducing delay by an average of 28 seconds per vehicle. In the PM Peak Hour, the intersection operates at LOS C (instead of LOS D), with a reduction in 21 seconds of delay per vehicle. At Holleman Drive, the intersection is expected to operate at LOS D (improved from LOS E) in the AM Peak Hour, with 18 seconds of delay per vehicle less than under the existing conditions. In the PM Peak Hour, Holleman Drive operates at LOS D, with 20 seconds of delay per vehicle less than currently experienced. Future (2029) No Build While there are several locations with failing operations along the corridor in the Future No Build scenario, operations are notably poor at the Holleman Drive intersection. The intersection operates at LOS F during both AM and PM Peak Hours. Luther Street is expected to operate at LOS E during the AM Peak Hour, but LOS C in the PM Peak Hour. The intersection at George Bush Drive operates at LOS D or better during the AM and PM Peak Hours. The unsignalized intersections at the Parkway Place Apartments and at the 2818 Place Apartments have failing levels of service for the northbound approaches during both the AM and PM Peak Hours. The southbound approaches operate at LOS F during the PM Peak Hour. The long delays indicate that there are not enough gaps in the traffic to service the vehicles attempting to turn onto FM Future (2029) Alternative A With Alternative A, FM 2818 is widened to a 6-lane cross section and a raised median is installed along the corridor. Where drivers once made left-turns onto or from FM 2818, they now make an equivalent movement with a U-turn at either Holleman Drive or Luther Street. By prohibiting left-turns from the side streets at the unsignalized intersections, operations improve for those northbound or southbound movements as motorists are forced to execute right-turns. Only the Holleman Drive intersection operates at a LOS E or F. Future (2029) Alternative B With Alternative B, FM 2818 is widened to a 6-lane cross section and a raised median is installed along the corridor. Additional U-turn lanes are provided at Luther Street and at Holleman Drive to accommodate the increased demand in those lanes under Alternative A and Alternative C. It was found that the number of left-turns from the westbound approach at Luther Street was sufficiently small enough that, operationally, the U-turns can be managed sufficiently well without an additional U-turn lane as prescribed by Alternative B. Therefore, the lane configuration at Luther Street was altered to have the U-turns use the left-turn lane at that location as done with Alternative A or Alternative C. (Otherwise, the traditional left-turn lane is underutilized and unnecessary). With the addition of the U-turn lane at Holleman Drive, operations at the intersection remain at LOS E during the AM Peak Hour and LOS F during the Traffic Analysis FM 2818 Schematic Binkley & Barfield 27
29 PM Peak Hour. The average delay experienced by drivers is shortened by about 5 seconds per vehicle in the AM Peak and 1 second per vehicle in the PM Peak. Future (2029) Alternative C With Alternative C, FM 2818 is widened to a 6-lane cross section and a raised median is installed along the corridor. A median opening is provided at Canyon Creek Circle / Parkway Place Apartments to allow for vehicles to turn left from FM 2818, but it is configured to prohibit left-turns from the side streets. The signalized and unsignalized intersections under Alternative C operate at comparable levels of service as when they are configured the same as Alternative A or Alternative B. The opening for hooded left-turns from FM 2818 operates at LOS B or LOS C, depending on the direction and the peak hour. Mitigation 1 For Alternatives A through C No proposed alternative results in a desirable level of service at Holleman Drive during either Peak Hour. While the additional through lanes reduce delay, the intersection still operates at LOS E or LOS F during the AM and PM Peak Hours. It was observed that the westbound leftturn movement experiences significant delay and queueing, and that mitigation on that approach may be the best option to increase capacity at the intersection and manage the demand. A dual-left-turn for the westbound approach is recommended as Mitigation 1. Alternatives A through C were re-analyzed to identify the effects on operations if a second leftturn lane is added. The greatest benefits of the Holleman Drive mitigation are observed during the PM Peak Hour where, despite still operating at LOS F, the average delay per vehicle is reduced from approximately 133 seconds to less than 100. During the AM Peak Hour, the intersection still operates at LOS E for Alternative A and Alternative C, but improves to LOS D for Alternative B. Future (2029) Alternative D Alternative D was only evaluated at Holleman Drive for the PM Peak Hour. Alternative D reduces a phase at the intersection and diverts all through movements crossing Holleman Drive as right-turns that either use a midblock U-turn or the turnaround at Dowling Road and Jones Butler Road. The intersection in the PM Peak Hour operates at LOS D with nearly 45 seconds of delay per vehicle. Future (2029) Alternative E Alternative E does not provide a midblock U-turn like Alternative D provides. All vehicles intending to make a through movement on Holleman Drive crossing FM 2818 must use Dowling Road. The intersection still operates with one less phase and there is no noticeable improvement in level of service or delay compared to Alternative D. Future (2029) Alternative F The CFI intersection with displaced left-turns at Holleman Drive was forecasted to operate at LOS E in the PM Peak Hour with 64 seconds of delay per vehicle. The added efficiency of this intersection compared to the traditional configurations of Alternatives A through C comes from displacing the left-turns upstream of the intersection so they can be executed during the through phase on FM Future (2029) Alternative G Alternative G is a combination of Alternative E and Alternative F, producing a CFI at Holleman Drive that has no through movements crossing FM The result is another phase removed from the cycle. The forecasted delay for the 2029 PM Peak Hour is 56 seconds per vehicle, corresponding to LOS E. Traffic Analysis FM 2818 Schematic Binkley & Barfield 28
30 SUMMARY OF ALTERNATIVES A THROUGH G Operations along the corridor improve dramatically under the proposed configurations due to the increase in capacity for the through movements and the restricted left-turn movements. Most notable is the reduced delay experienced by drivers leaving the apartment complexes at unsignalized intersections. This reduced delay leads to improved safety because drivers are less likely to accept unsafe gaps. Comparing Alternative A, Alternative B, and Alternative C at the signalized intersections, there are primarily minor differences in level of service. From the level of service and calculated delay alone, Alternative B appears preferable. Additionally, Alternative C has vehicles making unprotected left-turns against three lanes of traffic with heavy volumes at the hooded left-turns. The result is long delays, especially when opposing the peak directional flow. It should be noted that the intersection operations as analyzed in this study have been optimized to minimize the average delay experienced at the intersection. The optimization may force vehicles on one approach to experience very long delays compared to other approaches simply because it improves overall efficiency. The failing levels of service or long queues for specific approaches may be mitigated by adjusting the timing settings. This comes at the expense of overall efficiency, but is one method to address very localized issues. The results of the Queueing Analysis discussed in the next section supplement the findings of the capacity analysis by providing estimates of the lengths of the queues that form at the intersections. Long queues, especially for left-turns, should be a priority for mitigation as they can block other vehicles from making their intended turns. Traffic Analysis FM 2818 Schematic Binkley & Barfield 29
31 Table 4. AM Peak Hour Level of Service Analysis: Signalized s Scenario Eastbound Westbound Northbound Southbound LT TH RT LT TH RT LT TH RT LT TH RT INT FM 2818 at FM 2347 (George Bush Drive) Existing (2016) F B A A E A D E E B D Existing (2016) C B A A A A E E A D E A B Planned Improvements Future (2029) C C A A B A F E A E E A C No Build Future (2029) C B A A B A E E A F F A B Alternative A Future (2029) C B A A B A E E A F F A B Alternative B Future (2029) C B A A B A E E A F F A B Alternative C FM 2818 at Luther Street Existing (2016) A A A C D E B B Existing (2016) Planned Improvements Future (2029) No Build Future (2029) Alternative A Future (2029) Alternative B Future (2029) Alternative C A B A B D E B B A B A F D E B E A A A A D E B A A A A A D E B A A A A A D E B A Note: Letters are level of service; numbers are average seconds of delay per vehicle Traffic Analysis FM 2818 Schematic Binkley & Barfield 30
32 Table 4. AM Peak Hour Level of Service Analysis: Signalized s (Continued) Scenario Eastbound Westbound Northbound Southbound UT LT TH RT LT TH RT LT TH RT LT TH RT INT FM 2818 at Holleman Drive Existing (2016) - B B A B D A F F B F E C E Existing (2016) - B B A C D A E F A F E A D Planned Improvements Future (2029) - B E A F F A F F E F F A F No Build Future (2029) - F D A F E A F F C F F A E Alternative A Future (2029) F E D A F E A F F C F F A E Alternative B Future (2029) - F D A F E A F F C F F A E Alternative C Future (2029) - F C A E E A F F C F F B E Alternative A Mit Future (2029) F E C A E E A F F C F F A D Alternative B Mit Future (2029) - F C A E E A F F C F F A E Alternative C Mit Note: Letters are level of service; numbers are average seconds of delay per vehicle Traffic Analysis FM 2818 Schematic Binkley & Barfield 31
33 Table 5. AM Peak Hour Level of Service Analysis: Unsignalized s Scenario Northbound Eastbound Westbound Southbound LT RT LT TH/RT LT TH/RT LT RT FM 2818 at Knightsgate Apartments Existing (2016) D - A A A Existing (2016) D - A A A - Planned Improvements Future (2029) D - A A A - No Build Future (2029) - B - A - A - Alternative A Future (2029) - B - A - A - Alternative B Future (2029) - B - A - A - Alternative C FM 2818 at Canyon Creek Circle / Parkway Place Apartments Existing (2016) F C A A A D > Existing (2016) F C A A A D Planned Improvements > Future (2029) F C A A A D No Build > Future (2029) - B - A - A - C Alternative A Future (2029) - B - A - A - C Alternative B Future (2029) - B B A B A - C Alternative C FM 2818 at 2818 Place Apartments / Walden Pond Apartments Existing (2016) F A A B A C > Existing (2016) F A A B A C Planned Improvements Future (2029) F A A B A C No Build Future (2029) - B - A - A - C Alternative A Future (2029) - B - A - A - C Alternative B Future (2029) - B - A - A - C Alternative C Note: Letters are level of service; numbers are average seconds of delay per vehicle Traffic Analysis FM 2818 Schematic Binkley & Barfield 32
34 Table 6. PM Peak Hour Level of Service Analysis: Signalized s Scenario Eastbound Westbound Northbound Southbound LT TH RT LT TH RT LT TH RT LT TH RT INT FM 2818 at FM 2347 (George Bush Drive) Existing (2016) F D A B C A F F F C D Existing (2016) C C A B B A F E A E E B C Planned Improvements Future (2029) C D A B C A F F A F F B D No Build Future (2029) C D A A B A F F A F F B D Alternative A Future (2029) C D A A B A F F A F F B D Alternative B Future (2029) C D A A B A F F A F F B D Alternative C FM 2818 at Luther Street Existing (2016) A A - C E F A B Existing (2016) Planned Improvements Future (2029) No Build Future (2029) Alternative A Future (2029) Alternative B Future (2029) Alternative C A A - A E F A A B D A E F A C A A E A E F A A A A E A E F A A A A D A E F A A Note: Letters are level of service; numbers are average seconds of delay per vehicle Traffic Analysis FM 2818 Schematic Binkley & Barfield 33
35 Table 7. PM Peak Hour Level of Service Analysis: Signalized s (Continued) Eastbound Westbound Northbound Southbound Scenario UT LT TH RT LT TH RT LT TH RT LT TH RT FM 2818 at Holleman Drive Existing (2016) - B D B F C A F F D F F A E > Existing (2016) - A C A F C A F F C F F A D Planned Improvements Future (2029) - C F A F D A F F F F F A F No Build Future (2029) - E F A F D A F F D F F A F Alternative A > Future (2029) E E F A F D A F F E F F A F Alternative B > Future (2029) - E F A F D A F F E F F A F Alternative C > Future (2029) - F F B F D A F F D F F A F Alternative A Mit Future (2029) E E F B F D A F F D F F A F Alternative B Mit Future (2029) - F F C F D A F F D F F A F Alternative C Mit Future (2029) E E D B E D A E - E E - B D Alternative D Future (2029) E E C A E C A F - E F - B D Alternative E Future (2029) - - E D - C A F D F F F B E Alternative F Future (2029) - - E A - D A C - F F - A E Alternative G Note: Letters are level of service; numbers are average seconds of delay per vehicle INT Traffic Analysis FM 2818 Schematic Binkley & Barfield 34
36 Table 7. PM Peak Hour Level of Service Analysis: Unsignalized s Scenario Northbound Eastbound Westbound Southbound LT RT LT TH/RT LT TH/RT LT RT FM 2818 at Knightsgate Apartments Existing (2016) C - A B A Existing (2016) C - A B A - Planned Improvements Future (2029) F - A F A - No Build >300-0 > Future (2029) - C - A - A - Alternative A Future (2029) - C - A - A - Alternative B Future (2029) - C - A - A - Alternative C FM 2818 at Canyon Creek Circle / Parkway Place Apartments Existing (2016) F A A C A D > Existing (2016) F A A B A D Planned Improvements > Future (2029) F B A F A F No Build > >300 0 >300 Future (2029) - C - A - A - B Alternative A Future (2029) - C - A - A - B Alternative B Future (2029) - C B A C A - B Alternative C FM 2818 at 2818 Place Apartments / Walden Pond Apartments Existing (2016) F A A C A D > Existing (2016) F A A C A F Planned Improvements > Future (2029) F B A F A F No Build > >300 0 >300 Future (2029) - D - A - A - B Alternative A Future (2029) - D - A - A - B Alternative B Future (2029) - D - A - A - B Alternative C Note: Letters are level of service; numbers are average seconds of delay per vehicle Traffic Analysis FM 2818 Schematic Binkley & Barfield 35
37 ANALYSIS OF ALTERNATIVE H Alternative H, a super street, was proposed as a viable solution to the inadequate capacity of the tested future scenarios. A simulation model using VISSIM software was used to test whether the super street provides adequate capacity and to make recommendations for design elements that impact traffic operations, such as the presence and lengths of turn lanes. The following scenarios were evaluated: Future (2029) Alternative H o Operations using 2029 volumes and a 6-lane divided cross section that prohibits through and left-turn movements from side streets. Only right-turns occur at the side streets. U-turns are provided downstream of the three signalized intersections. Future (2039) Alternative H o Operations using 2039 volumes and a 6-lane divided cross section that prohibits through and left-turn movements from side streets. Only right-turns occur at the side streets. U-turns are provided downstream of the three signalized intersections. As noted above, Alternative H was evaluated with 2029 and 2039 conditions. This was to ensure the facility will operate adequately for 20 years from completion. During the process of developing the model, it was determined that the connection between Jones Butler Road and the westbound/northbound FM 2818 mainlanes would not be long enough to provide a safe distance for merging or weaving, especially with the signalized U-turn located between Jones Butler and Holleman Drive. It is recommended that the connection be removed. The traffic volumes that previously entered the corridor from Jones Butler Drive or Dowling Road were redirected to enter the network at Holleman Drive. As was done with the analyses of Alternatives A through G, left-turn and through movements at side streets were redirected to using U-turns. The resultant Peak Hour traffic volumes for 2029 and 2039 are shown in Figures 17 and 18. There are significant differences between the methods used by the Synchro and VISSIM software programs. Synchro primarily applies calculations developed for the Highway Capacity Manual (HCM). VISSIM is a microsimulation tool that provides the user much more control over input parameters and uses stochastic methods to provide a different result each time the simulation is run. Several iterations were conducted to set signal timings and offsets so vehicular delay is minimized as much as possible. Upon finalizing the signal parameters in the model, five simulations were run for each scenario to produce the averages reported in the tables below. The primary measure of effectiveness for the VISSIM analysis is the vehicular delay of each intended movement at the signalized intersections. The level of service is determined from the same HCM scale used in the Synchro analyses. Each signalized intersection, however, is more complicated with this super street concept than the previous iterations since every movement except a right-turn from the side street crosses at least two signalized locations. For example, a motorist intending to turn left from a side street must first turn right onto FM 2818, then make a U-turn, then go through the intersection (passing through three signalized locations). A through movement on FM 2818 requires the motorist to first pass the first signalized U-turn, then go straight at the main signalized intersection (passing through three signalized locations). Ideally, the signal timings are offset to reduce the number of stops at each location and the signals are coordinated along the corridor to maximize progression. Table 8 and Table 9 record the delay measured for each intended movement at the signalized intersections. These values account for Traffic Analysis FM 2818 Schematic Binkley & Barfield 36
38 all the steps involved in executing the movement. Table 10 shows the delay experienced driving from one location in the corridor to another. Future (2029) Alternative H With the super street concept for Alternative H, the network is forecasted to operate much more efficiently than Alternatives A through G in In the AM Peak Hour, the delays at George Bush Drive and at Luther Street are both less than 15 seconds per vehicle, comparable to the findings for the other Alternatives. At Holleman Drive, the AM Peak Hour delay improves to 34 seconds per vehicle, approximately 20 seconds per vehicle less than with the other alternatives during that period. In the PM Peak Hour, the delay at George Bush Drive is 28 seconds per vehicle (LOS C), at Luther Street it is 9 seconds per vehicle (LOS A), and at Holleman Drive it is 44 seconds per vehicle (LOS D). These values represent significant reductions in delay at George Bush Drive and at Holleman Drive compared to the other Alternatives. Future (2039) Alternative H Alternative H is the only concept that was evaluated with traffic volumes forecasted to During the AM Peak Hour, both George Bush Drive and Luther Street operate with 15 seconds of delay per vehicle or less. At Holleman Drive, the average delay is 44 seconds per vehicle, resulting in LOS D. For the PM Peak Hour, the average delay at George Bush Drive is 43 seconds per vehicle (LOS D), at Luther Street it is 15 seconds per vehicle (LOS B), and at Holleman Drive it is 57 seconds per vehicle (LOS E). SUMMARY OF ALTERNATIVE H The average vehicular delay for Alternative H is dramatically lower at the signalized intersections than the delay experienced in Alternatives A through G. In fact, the delays forecasted for Alternative H in 2039 are comparable or lower than those identified for Alternatives A through G in By having only two phases at the intersections, there is a smaller proportion of time lost during yellow and all-red intervals. Additionally, progression throughout the corridor is increased through improved coordination that favors the movement along FM These result is more than 10 extra years of functional use of the corridor compared to the other Alternatives. Traffic Analysis FM 2818 Schematic Binkley & Barfield 37
39 FM 2818 TRAFFIC STUDY PEAK HOUR VOLUMES (2029) REDISTRIBUTED FOR SUPER STREET
 REDISTRIBUTED FOR SUPER")
40 FM 2818 TRAFFIC STUDY PEAK HOUR VOLUMES (2039) REDISTRIBUTED FOR SUPER STREET
TRAFFIC IMPACT STUDY. Platte Canyon Villas Arapahoe County, Colorado (Arapahoe County Case Number: Z16-001) For
 For") TRAFFIC IMPACT STUDY For Platte Canyon Villas Arapahoe County, Colorado (Arapahoe County Case Number: Z16-001) February 2015 Revised: August 2015 April 2016 July 2016 September 2016 Prepared for: KB Home
TRAFFIC IMPACT STUDY For Platte Canyon Villas Arapahoe County, Colorado (Arapahoe County Case Number: Z16-001) February 2015 Revised: August 2015 April 2016 July 2016 September 2016 Prepared for: KB Home
Market Street PDP. Nassau County, Florida. Transportation Impact Analysis. VHB/Vanasse Hangen Brustlin, Inc. Nassau County Growth Management
 Transportation Impact Analysis Market Street PDP Nassau County, Florida Submitted to Nassau County Growth Management Prepared for TerraPointe Services, Inc. Prepared by VHB/Vanasse Hangen Brustlin, Inc.
Traffic Impact Study
 Traffic Impact Study Statham DRI One University Parkway Prepared for: Barrow County Prepared by: October 2012 Table of Contents Executive Summary i Section 1. Introduction 1 Project Description 1 Methodology
WEBER ROAD RESIDENTIAL DEVELOPMENT Single Family Residential Project
 WEBER ROAD RESIDENTIAL DEVELOPMENT Single Family Residential Project WEBER ROAD RESIDENTIAL DEVELOPMENT TRAFFIC IMPACT STUDY TABLE OF CONTENTS 1.0 Executive Summary Page 2.0 Introduction 2.1 DEVELOPMENT
April 10, Mr. Curt Van De Walle, City Manager City of Castle Hills 209 Lemonwood Drive Castle Hills, Texas 78213
 Mr. Curt Van De Walle, City Manager City of Castle Hills 209 Lemonwood Drive Castle Hills, Texas 78213 Subject: Revised Castle Hills BASIS Charter School Traffic Impact Analysis Review City of Castle Hills,
NATHAN HALE HIGH SCHOOL PARKING AND TRAFFIC ANALYSIS. Table of Contents
 Parking and Traffic Analysis Seattle, WA Prepared for: URS Corporation 1501 4th Avenue, Suite 1400 Seattle, WA 98101-1616 Prepared by: Mirai Transportation Planning & Engineering 11410 NE 122nd Way, Suite
JEP John E. Jack Pflum, P.E. Consulting Engineering 7541 Hosbrook Road, Cincinnati, OH Telephone:
 JEP John E. Jack Pflum, P.E. Consulting Engineering 7541 Hosbrook Road, Cincinnati, OH 45243 Email: jackpflum1@gmail.com Telephone: 513.919.7814 MEMORANDUM REPORT Traffic Impact Analysis Proposed Soccer
MEMORANDUM. The study area of the analysis was discussed with City staff and includes the following intersections:
 MEMORANDUM DATE: JULY 6, 2012 TO: FROM: RE: CC: MELANIE KNIGHT BRAD BYVELDS/ JENNIFER LUONG 1050 SOMERSET STREET PRELIMINARY TRAFFIC ANALYSIS OUR FILE NO. 111152 NEIL MALHOTRA The purpose of this memo
TRANSPORTATION AND TRAFFIC ANALYSIS REPORT
 Square One Drive Extension Municipal Class Environmental Assessment Environmental Study Report Appendix B Transportation and Traffic Analysis Report TRANSPORTATION AND TRAFFIC ANALYSIS REPORT FINAL DRAFT
CVS Derwood. Local Area Transportation Review
 CVS Derwood Montgomery County, Maryland May 27, 2016 Local Area Transportation Review Prepared for: JC Bar Properties, Inc. Steve Fleming, PE 415 Fallowfield Road, Suite 301 Camp Hill, Pennsylvania 17011
TRANSPORTATION IMPACT STUDY WHEELER STREET CLOSURE
 TRANSPORTATION IMPACT STUDY WHEELER STREET CLOSURE Village of Greene, Chenango County, New York Prepared for: VILLAGE OF GREENE 49 Genesee Street Greene, NY 13778 Prepared by: LARSON DESIGN GROUP 1000
Focused Traffic Analysis for the One Lincoln Park Project
 September 15, 2015 Mr. Bill Johnson Coldwell Banker 511 Sir Francis Drake Boulevard Greenbrae, CA 94904 Focused Traffic Analysis for the One Lincoln Park Project Dear Mr. Johnson; As requested, W-Trans
CHAPTER 3. CAPACITY OF SIGNALIZED INTERSECTIONS
 CHAPTER 3. CAPACITY OF SIGNALIZED INTERSECTIONS 1. Overview In this chapter we explore the models on which the HCM capacity analysis method for signalized intersections are based. While the method has
North Carolina s First Quadrant Left: History and Lessons Learned
 North Carolina s First Quadrant Left: History and Lessons Learned Michael P. Reese, P.E. (Corresponding Author) Congestion Management Section Project Engineer North Carolina Department of Transportation
TRAFFIC IMPACT STUDY
 TRAFFIC IMPACT STUDY TERRE HAUTE CONVENTION CENTER WABASH AVENUE & 9 TH STREET TERRE HAUTE, INDIANA PREPARED FOR 8365 Keystone Crossing, Suite 201 Indianapolis, IN 46240 Phone: (317) 202-0864 Fax: (317)
North Carolina s First Quadrant Left: History and Lessons Learned
 0 0 0 North Carolina s First Quadrant Left: History and Lessons Learned Michael P. Reese, P.E. (Corresponding Author) Congestion Management Section Project Engineer North Carolina Department of Transportation
APPENDIX IV MODELLING
 APPENDIX IV MODELLING Kingston Transportation Master Plan Final Report, July 2004 Appendix IV: Modelling i TABLE OF CONTENTS Page 1.0 INTRODUCTION... 1 2.0 OBJECTIVE... 1 3.0 URBAN TRANSPORTATION MODELLING
VHD Daily Totals. Population 14.5% change. VMT Daily Totals Suffolk 24-hour VMT. 49.3% change. 14.4% change VMT
 6.9 Suffolk 6-54 VMT Population and Travel Characteristics Population 14.5% change 2014 1,529,202 VHD Daily Totals 2014 251,060 49.3% change 2040 1,788,175 2040 374,850 VMT Daily Totals 2014 39,731,990
1.0 INTRODUCTION AND SUMMARY...
 TABLE OF CONTENTS 1.0 INTRODUCTION AND SUMMARY... 1 1.1 Purpose and Study Objective... 1 1.2 Executive Summary... 1 2.0 ROADWAY CONDITIONS... 5 2.1 Granville Parkway (South Intersection)... 8 2.2 Tuscany
Appendixx C Travel Demand Model Development and Forecasting Lubbock Outer Route Study June 2014
 Appendix C Travel Demand Model Development and Forecasting Lubbock Outer Route Study June 2014 CONTENTS List of Figures-... 3 List of Tables... 4 Introduction... 1 Application of the Lubbock Travel Demand
FINAL Traffic Report for the Proposed Golden Valley Road and Newhall Ranch Road Projects in the City of Santa Clarita, California May 5, 2005
 FINAL Traffic Report for the Proposed Golden Valley Road and Newhall Ranch Road Projects in the City of Santa Clarita, California May 5, 2005 Prepared For: EDAW, Inc. 1420 Kettner Boulevard, Suite 620
Subject: Desert Palisades Specific Plan - Tram Way Access Sight Distance
 Endo Engineering Traffic Engineering Air Quality Studies Noise Assessments July 13, 2015 Mr. Ed Freeman Pinnacle View, LLC P.O. Box 1754 Lake Oswego, OR 97035-0579 Subject: Desert Palisades Specific Plan
Parking Regulations Dundas Street West, from Bathurst Street to Dovercourt Road
 STAFF REPORT ACTION REQUIRED Parking Regulations Dundas Street West, from Bathurst Street to Dovercourt Road Date: October 28, 2008 To: From: Toronto and East York Community Council Director, Transportation
Appendix I: Traffic Study
 City of Fontana Sierra Lakes Commerce Center Draft EIR Appendix I: Traffic Study FirstCarbon Solutions H:\Client (PN JN)\0144\01440050\EIR\1 ADEIR\01440050 Sec99 99 Appendix Dividers.doc THIS PAGE INTENTIONALLY
The Sunland Park flyover ramp is set to close the week of March 19 until early summer
 March 2, 2018 The Sunland Park flyover ramp is set to close the week of March 19 until early summer GO 10 is targeting the week of March 19 to close the Sunland Park Drive flyover entrance ramp to I 10
KAISER SOUTH NORTHERN VIRGINIA HUB TRAFFIC IMPACT STUDY PRINCE WILLIAM COUNTY, VIRGINIA TABLE OF CONTENTS. Section 2 BACKGROUND INFORMATION 12
 KAISER SOUTH NORTHERN VIRGINIA HUB TRAFFIC IMPACT STUDY PRINCE WILLIAM COUNTY, VIRGINIA TABLE OF CONTENTS Page EXECUTIVE SUMMARY 1 Purpose of Report and Study Objectives... 1 Site Location and Study Area...
S.170 th Street Micro-Simulation Seattle-Tacoma International Airport Port of Seattle/Aviation Planning
 Seattle-acoma International Airport Port of Seattle/Aviation Planning Port of Seattle PO OF SEAE Aviation Planning Airport Operations January 24, 2013 Summary he Port is planning to relocate the cell phone
MnDOT Method for Calculating Measures of Effectiveness (MOE) From CORSIM Model Output
 From CORSIM Model Output") MnDOT Method for Calculating Measures of Effectiveness (MOE) From CORSIM Model Output Rev. April 29, 2005 MnDOT Method for Calculating Measures of Effectiveness (MOE) From CORSIM Model Output Table of
MnDOT Method for Calculating Measures of Effectiveness (MOE) From CORSIM Model Output Rev. April 29, 2005 MnDOT Method for Calculating Measures of Effectiveness (MOE) From CORSIM Model Output Table of
Appendix C Traffic Study
 Final Environmental Impact Statement Appendix C Traffic Study Schofield Generating Station Project, Hawaii October 2015 C-1 Final Environmental Impact Statement This page intentionally left blank. Schofield
6 th Line Municipal Class Environmental Assessment
 6 th Line Municipal Class Environmental Assessment County Road 27 to St John s Road Town of Innisfil, ON September 6, 2016 APPENDIX L: TRAVEL DEMAND FORECASTING MEMORANDUM Accessible formats are available
A Study of Red Light Cameras in Kansas City, MO
 A Study of Red Light s in Kansas City, MO Prepared by the Special Operations Division Executive Summary This paper will analyze the crash data for the 29 red light cameras located in 17 intersections in
PLAZA MEXICO RESIDENCES
 PLAZA MEXICO RESIDENCES TRAFFIC STUDY PREPARED FOR: 3000 E. IMPERIAL, LLC. 6940 Beach Boulevard, D-501 Buena Park, California 90621 PREPARED BY: OCTOBER 5, 2017 translutions the transportatio n solutions
6711 LEE HIGHWAY TRAFFIC IMPACT STUDY ARLINGTON, VIRGINIA
 6711 TRAFFIC IMPACT STUDY ARLINGTON, VIRGINIA Prepared for: NVR, Inc. Prepared by: Wells + Associates, Inc. Michael J. Workosky, PTP, TOPS, TSOS John J. Andrus William L. Zeid, PE 703.917.6620 May 4, 2017
Expanding the GSATS Model Area into
 Appendix A Expanding the GSATS Model Area into North Carolina Jluy, 2011 Table of Contents LONG-RANGE TRANSPORTATION PLAN UPDATE 1. Introduction... 1 1.1 Background... 1 1.2 Existing Northern Extent of
US 169/I-70 North Loop Planning & Environmental Linkages Study
 US 169/I-70 North Loop Planning & Environmental Linkages Study VISSIM Calibration Document Draft April 13, 2018 Page i Table of Contents 1. Overview... 1 2. Data Types... 2 3. Model Parameter Adjustments...
III. FORECASTED GROWTH
 III. FORECASTED GROWTH In order to properly identify potential improvement projects that will be required for the transportation system in Milliken, it is important to first understand the nature and volume
TRAFFIC IMPACT STUDY MANUFACTURING COMPANY
 TRAFFIC IMPACT STUDY For MANUFACTURING COMPANY Prepared For: Airway Heights, WA Prepared By: SUNBURST ENGINEERING, P. S. 4310 S. Ball Dr. Veradale, WA 99037 April, 2013 TRAFFIC IMP ACT STUDY Manufacturing
Appendix B.1 EMME Model Calibration Memo
 Appendix B.1 EMME Model Calibration Memo itrans 144 Front Street West, Suite 655 Toronto, ON M5J 2L7 Tel: (416) 847-0005 Fax: (905) 882-1557 www.hdrinc.com www.itransconsulting.com File: 2.0 Memorandum
Signalized Intersections
 Signalized Intersections Kelly Pitera October 23, 2009 Topics to be Covered Introduction/Definitions D/D/1 Queueing Phasing and Timing Plan Level of Service (LOS) Signal Optimization Conflicting Operational
HALFF 16196? TRAFFIC MANAGEMENT PLAN. Richardson ISD Aikin Elementary School Dallas, Texas North Bowser Road Richardson, Texas 75081
 30280 16196? TRAFFIC MANAGEMENT PLAN Exhibit 572B Aikin Elementary School Planned Development District No. 572 Approved City Plan Commission October20, 2016 July 12, 2016 Prepared for HALFF AVO 31586 PHO1
US 20 Highway Safety Study
 US 20 Highway Safety Study Corvallis City Limits to Springhill Road, Albany Prepared for Prepared by December 2016 US 20 HIGHWAY SAFETY STUDY FINAL REPORT Benton County, Oregon Prepared for: Oregon Department
I-10 East at Redd closes for 24 hours this Sunday, Feb 11. Then, I-10 West at Resler closes for 27 hours on Feb 25
 NEWS RELEASE a TxDOT Project For immediate release EL PASO DISTRICT Jennifer Wright (915) 790-4340 Jennifer.Wright3@txdot.gov February 9, 2018 I-10 East at Redd closes for 24 hours this Sunday, Feb 11
I-95/I-85 INTERCHANGE ROADWAY SAFETY ASSESSMENT
 FINAL REPORT I-95/I-85 INTERCHANGE ROADWAY SAFETY ASSESSMENT Prepared for: Prepared by: 117306012.B MARCH 2013 Final Report March 2013 I-95/I-85 Interchange ROADWAY SAFETY ASSESSMENT Prepared for: Prepared
NORTH HOUSTON HIGHWAY IMPROVEMENT PROJECT (NHHIP)
") NORTH HOUSTON HIGHWAY IMPROVEMENT PROJECT (NHHIP) Project Overview Briefing Packet September 2015 RECOMMENDED ALTERNATIVES Environmental Impact Statement (EIS) Project Divided into 3 Segments Segment 1:
NORTH HOUSTON HIGHWAY IMPROVEMENT PROJECT (NHHIP) Project Overview Briefing Packet September 2015 RECOMMENDED ALTERNATIVES Environmental Impact Statement (EIS) Project Divided into 3 Segments Segment 1:
Prepared for. 3D/International, Inc West Loop South, Suite 400 Houston, Texas November 2006
 DRAFT TRAFFIC IMPACT STUDY FOR PHASED DEVELOPMENT OF TAMU CC Prepared for 3D/International, Inc. 1900 West Loop South, Suite 400 Houston, Texas 77027 November 2006 Interim Review Only Document Incomplete:
California Urban Infill Trip Generation Study. Jim Daisa, P.E.
 California Urban Infill Trip Generation Study Jim Daisa, P.E. What We Did in the Study Develop trip generation rates for land uses in urban areas of California Establish a California urban land use trip
EVALUATION OF SAFETY PERFORMANCES ON FREEWAY DIVERGE AREA AND FREEWAY EXIT RAMPS. Transportation Seminar February 16 th, 2009
 EVALUATION OF SAFETY PERFORMANCES ON FREEWAY DIVERGE AREA AND FREEWAY EXIT RAMPS Transportation Seminar February 16 th, 2009 By: Hongyun Chen Graduate Research Assistant 1 Outline Introduction Problem
NORTH HOUSTON HIGHWAY IMPROVEMENT PROJECT (NHHIP)
") NORTH HOUSTON HIGHWAY IMPROVEMENT PROJECT (NHHIP) Planning for a Mega Project in a Metropolitan Area TxDOT Short Course October 13, 2015 RECOMMENDED ALTERNATIVES Environmental Impact Statement (EIS) Project
NORTH HOUSTON HIGHWAY IMPROVEMENT PROJECT (NHHIP) Planning for a Mega Project in a Metropolitan Area TxDOT Short Course October 13, 2015 RECOMMENDED ALTERNATIVES Environmental Impact Statement (EIS) Project
PROPOSED PROJECT. Section PROJECT DESCRIPTION
 1 2 3 4 5 6 7 8 9 10 11 12 13 14 15 16 17 18 19 20 21 22 23 24 25 26 27 28 29 30 31 32 33 34 35 36 37 38 39 40 41 42 43 1.1 PROJECT DESCRIPTION This Environmental Assessment describes the proposed improvements
VIRGINIA S I-77 VARIABLE SPEED LIMIT SYSTEM FOR LOW VISIBILITY CONDITIONS
 VIRGINIA S I-77 VARIABLE SPEED LIMIT SYSTEM FOR LOW VISIBILITY CONDITIONS Christopher D. McDonald, PE, PTOE Regional Operations Director, Southwest Region NRITS and ITS Arizona Annual Conference October
COUNCIL POLICY MANUAL
 COUNCIL POLICY MANUAL SECTION: PUBLIC WORKS SUBJECT: SNOW & ICE CONTROL POLICY 2012/2013 GOAL: Pages: 1 of 10 Approval Date: Dec. 3, 2012 Res. # 1001/2012 To annually identify the winter maintenance costs
INTRODUCTION PURPOSE DATA COLLECTION
 DETERMINATION OF VEHICLE OCCUPANCY ON THE KATY AND NORTHWEST FREEWAY MAIN LANES AND FRONTAGE ROADS Mark Ojah and Mark Burris Houston Value Pricing Project, March 2004 INTRODUCTION In the late 1990s, an
The Highline Development Traffic Impact Study
 The Highline Development Traffic Impact Study Columbia Falls, Montana Prepared For: TD&H Engineering 450 Corporate Drive, Suite 101 Kalispell, MT 59901 June, 2018 130 South Howie Street Helena, Montana
FARM 1065 PORTION 1, ATLANTIS TRAFFIC IMPACT ASSESSMENT
 FARM 1065 PORTION 1, ATLANTIS TRAFFIC IMPACT ASSESSMENT February 2018 FIRST ISSUE Prepared by: JG AFRIKA (PTY) LTD Branch: Cape Town PO Box 38561 Postal code: 7430 Telephone: 021 530 1800 Email: wink@
Per your request and authorization, we have prepared this traffic evaluation for the above referenced project.
 Memorandum To: From: Re: Marc Stout, P.E. City Engineer, City of Roseville Chris Gregerson, P.E., T.E. Matt Weir, P.E., T.E., PTOE Douglas Boulevard Coffee Kiosk Traffic Evaluation Roseville, California
Appendix B. Traffic Analysis Report
 Appendix B Traffic Analysis Report Report No. 14369/TR/WN02 August 2007 SALLINS BYPASS BYPASS OPTIONEERING ANALYSIS - TRAFFIC REPORT Kildare County Council Áras Chill Dara, Devoy Park, Naas, Co Kildare
CONTINUING PLANNING PROGRAM LOCAL TRANSPORTATION AND TRAFFIC DATA PRODUCT REPORT [OH Corridors]
![CONTINUING PLANNING PROGRAM LOCAL TRANSPORTATION AND TRAFFIC DATA PRODUCT REPORT [OH Corridors]](/thumbs/94/120123757.jpg "CONTINUING PLANNING PROGRAM LOCAL TRANSPORTATION AND TRAFFIC DATA PRODUCT REPORT [OH Corridors]") CONTINUING PLANNING PROGRAM LOCAL TRANSPORTATION AND TRAFFIC DATA PRODUCT REPORT [OH Corridors] Travel Time and Delay Analysis for Belpre (OH) and Marietta (OH) Fiscal Year 2009 Report WOOD WASHINGTON
CONTINUING PLANNING PROGRAM LOCAL TRANSPORTATION AND TRAFFIC DATA PRODUCT REPORT [OH Corridors] Travel Time and Delay Analysis for Belpre (OH) and Marietta (OH) Fiscal Year 2009 Report WOOD WASHINGTON
Appendix C Final Methods and Assumptions for Forecasting Traffic Volumes
 Fairview Ave. and Main St. Improvements and Local Streets Plan Appendices Ada County Highway District Appendix C Final Methods and Assumptions for Forecasting Traffic Volumes January 3, 207 Appendices
APPENDIX I: Traffic Forecasting Model and Assumptions
 APPENDIX I: Traffic Forecasting Model and Assumptions Appendix I reports on the assumptions and traffic model specifications that were developed to support the Reaffirmation of the 2040 Long Range Plan.
Research Article Headway Distributions Based on Empirical Erlang and Pearson Type III Time Methods Compared
 Research Journal of Applied Sciences, Engineering and Technology 7(21): 4410-4414, 2014 DOI:10.19026/rjaset.7.817 ISSN: 2040-7459; e-issn: 2040-7467 2014 Maxwell Scientific Publication Corp. Submitted:
MEMORANDUM (DRAFT) DRAFT
 DRAFT") 117 Commercial St. NE, Suite 310 Salem, OR 97301 503.391.8773 www.dksassociates.com MEMORANDUM (DRAFT) DATE: February 15, 2017 TO: FROM: SUBJECT: Alex Dupey, MIG Scott Mansur, PE, PTOE; Garth Appanaitis,
117 Commercial St. NE, Suite 310 Salem, OR 97301 503.391.8773 www.dksassociates.com MEMORANDUM (DRAFT) DATE: February 15, 2017 TO: FROM: SUBJECT: Alex Dupey, MIG Scott Mansur, PE, PTOE; Garth Appanaitis,
TRAFFIC ALERT FOR WEEK OF February 4 8, 2008
 TRAFFIC ALERT FOR WEEK OF February 4 8, 2008 Highway work zones in the Staunton District The following is a list of highway work that might affect traffic in the Staunton transportation district during
WOODRUFF ROAD CORRIDOR ORIGIN-DESTINATION ANALYSIS
 2018 WOODRUFF ROAD CORRIDOR ORIGIN-DESTINATION ANALYSIS Introduction Woodruff Road is the main road to and through the commercial area in Greenville, South Carolina. Businesses along the corridor have
Travel Demand Management Plan
 Travel Demand Management Plan Tryg s & Apartment Building 8 West Lake Street Minneapolis, MN AUTHORIZED PROPERTY REPRESENTATIVE: By Dated: Mr. Johnny Carlson Trammell Crow Chicago Development, Inc. 5 South
GIS ANALYSIS METHODOLOGY
 GIS ANALYSIS METHODOLOGY No longer the exclusive domain of cartographers, computer-assisted drawing technicians, mainframes, and workstations, geographic information system (GIS) mapping has migrated to
Traffic flow theory involves the development of mathematical relationships among
 CHAPTER 6 Fundamental Principles of Traffic Flow Traffic flow theory involves the development of mathematical relationships among the primary elements of a traffic stream: flow, density, and speed. These
FINAL REPORT. City of Toronto. Contract Project No: B
 City of Toronto SAFETY IMPACTS AND REGULATIONS OF ELECTRONIC STATIC ROADSIDE ADVERTISING SIGNS TECHNICAL MEMORANDUM #2B BEFORE/AFTER COLLISION ANALYSIS AT MID-BLOCK LOCATIONS FINAL REPORT 3027 Harvester
FY 2010 Continuing i Planning Program Product Report. Local Transportation and Traffic Data. Wood-Washington-Wirt Interstate Planning Commission
 FY 2010 Continuing i Planning Program Product Report Local Transportation and Traffic Data Travel Time and Delay Data for Belpre and Marietta, Ohio Wood-Washington-Wirt Interstate Planning Commission CONTINUING
SUBJECT: SUMMARY OF FINDINGS. October 29, Mr. Carter Redish Carter Group Architects, Inc S. El Camino Real, Suite F San Clemente, CA 92672
 October 29, 2018 Mr. Carter Redish Carter Group Architects, Inc. 1810 S. El Camino Real, Suite F San Clemente, CA 92672 SUBJECT: CANYON STEEL FOCUSED TRAFFIC IMPACT ANALYSIS Dear Mr. Carter Redish: Urban
Freeway Work Zone Lane Capacity
 Report Title Report Date: 2009 Freeway Work Zone Lane Capacity Principle Investigator Vendor Name and Address Name Drakopoulos, Alex «Vendor» Affiliation Marquette University Address 263 Haggerty Hall
Final City of Colusa STREETS & ROADWAYS MASTER PLAN. October J Street Suite 390 Sacramento, CA 95814
 Final City of Colusa STREETS & ROADWAYS MASTER PLAN October 2009 660 J Street Suite 390 Sacramento, CA 95814 TABLE OF CONTENTS I. INTRODUCTION... 1 Report Organization...1 II. ANALYSIS METHODOLOGY... 2
Automated Delay Estimation at Signalized Intersections: Phase I Concept and Algorithm Development
 Brigham Young University BYU ScholarsArchive All Theses and Dissertations 2011-03-16 Automated Delay Estimation at Signalized Intersections: Phase I Concept and Algorithm Development Taylor R. Forbush
930 Old Northern Rd & 4 Post Office Rd, Glenorie
 Proposed Mixed Use Development 930 Old Northern & 4, Glenorie TRAFFIC AND PARKING ASSESSMENT REPORT 13 December 2016 Ref 16264 Suite 6, 20 Young Street, Neutral Bay NSW 2089 - PO Box 1868, Neutral Bay
Freeway Work Zone Lane Capacity
 Freeway Work Zone Lane Capacity Thomas Notbohm, P.E. Wisconsin Department of Transportation Thomas.Notbohm@dot.state.wi.us Alex Drakopoulos Department of Civil & Environmental Engineering Marquette University,
Active Traffic & Safety Management System for Interstate 77 in Virginia. Chris McDonald, PE VDOT Southwest Regional Operations Director
 Active Traffic & Safety Management System for Interstate 77 in Virginia Chris McDonald, PE VDOT Southwest Regional Operations Director Interstate 77 at Fancy Gap Mountain Mile markers 0-15 Built in late
Perth County Road Fatal Head-on Collision - A Common and Dangerous Issue
 Perth County Road Fatal Head-on Collision - A Common and Dangerous Issue Posting Date: 25-Aug-2016 Figure 1: View looking east long "Speeders Alley" - a more appropriate name for the long, straight and
CHAPTER 2. CAPACITY OF TWO-WAY STOP-CONTROLLED INTERSECTIONS
 CHAPTER 2. CAPACITY OF TWO-WAY STOP-CONTROLLED INTERSECTIONS 1. Overview In this chapter we will explore the models on which the HCM capacity analysis method for two-way stop-controlled (TWSC) intersections
Traffic Demand Forecast
 Chapter 5 Traffic Demand Forecast One of the important objectives of traffic demand forecast in a transportation master plan study is to examine the concepts and policies in proposed plans by numerically
Evaluation of fog-detection and advisory-speed system
 Evaluation of fog-detection and advisory-speed system A. S. Al-Ghamdi College of Engineering, King Saud University, P. O. Box 800, Riyadh 11421, Saudi Arabia Abstract Highway safety is a major concern
Roundabout Level of Service
 Roundabout Level of Service Rahmi Akçelik Director Akcelik & Associates Pty Ltd email: rahmi.akcelik@sidrasolutions.com web: www.sidrasolutions.com 8 January 2009 Contents 1. Introduction... 1 2. Fundamental
Greater Toronto Area Cordon Count Summary Analysis of Traffic Trends 1985 to 2011
 Greater Toronto Area Cordon Count Summary Analysis of Traffic Trends 1985 to 2011 Prepared by: Data Management Group Department of Civil Engineering University of Toronto Telephone: (416) 978-3916 Table
Metro Emergency Security Operations Center (ESOC) 410 Center Street City of Los Angeles
 410 Center Street City of Los Angeles") Metro Emergency Security Operations Center (ESOC) 410 Center Street City of Los Angeles Traffic Study August 31, 2015 AECOM 515 South Flower Street, 4 th Floor Los Angeles, CA 90071 Job Number: 60323255
Metro Emergency Security Operations Center (ESOC) 410 Center Street City of Los Angeles Traffic Study August 31, 2015 AECOM 515 South Flower Street, 4 th Floor Los Angeles, CA 90071 Job Number: 60323255
Snow and Ice Control POLICY NO. P-01/2015. CITY OF AIRDRIE Snow and Ice Control Policy
 Page 1 CITY OF AIRDRIE Snow and Ice Control Effective Date: Approved By: Approved On: March 17, 2015 City Council March 16, 2015 Revision Date: Resolution #: ------ PURPOSE: The City of Airdrie is responsible
3.0 ANALYSIS OF FUTURE TRANSPORTATION NEEDS
 3.0 ANALYSIS OF FUTURE TRANSPORTATION NEEDS In order to better determine future roadway expansion and connectivity needs, future population growth and land development patterns were analyzed as part of
APPENDIX G Halton Region Transportation Model
 APPENDIX G Halton Region Transportation Model Halton Region Transportation Master Plan Working Paper No. 1 - Legislative Context Working Paper No. 2 - Active Transportation Halton Transportation Model
OVERVIEW OF A SIMULATION STUDY OF THE HIGHWAY 401 FTMS
 OVERVIEW OF A SIMULATION STUDY OF THE HIGHWAY 401 FTMS HELLINGA, Bruce 1, BAKER, Mark 1, VAN AERDE, Michel 1, AULTMAN-HALL, Lisa 1, and MASTERS, Philip 2 1 Transportation Systems Research Group Queen's
MEMORANDUM. Trip Generation Analysis
 MEMORANDUM To: RMC Architects From: Matthew Palmer, PE Subject: Trip Generation, Parking Analysis & Level of Service Project: Port of Everett, GTC #13-053 Date: August 25, 2014 The trip generation and
2011 South Western Region Travel Time Monitoring Program Congestion Management Process. Executive Summary
 2011 South Western Region Travel Monitoring Program Executive Summary Prepared by: South Western Regional Planning Agency 888 Washington Blvd, 3rd Floor Stamford, CT 06901 Telephone: 203.6.5190 Facsimile:
Best Practices and Techniques for Clearing Intersection Layouts
 Research for winter highway maintenance Manual of Best Practices and Techniques for Clearing Intersection Layouts Prepared by: Yan Qi (Southern Illinois University Edwardsville) Dave Bergner (Monte Vista
$QDO\]LQJ$UWHULDO6WUHHWVLQ1HDU&DSDFLW\ RU2YHUIORZ&RQGLWLRQV
![$QDO\]LQJ$UWHULDO6WUHHWVLQ1HDU&DSDFLW\ RU2YHUIORZ&RQGLWLRQV](/thumbs/76/73951207.jpg "$QDO\]LQJ$UWHULDO6WUHHWVLQ1HDU&DSDFLW\ RU2YHUIORZ&RQGLWLRQV") Paper No. 001636 $QDO\]LQJ$UWHULDO6WUHHWVLQ1HDU&DSDFLW\ RU2YHUIORZ&RQGLWLRQV Duplication for publication or sale is strictly prohibited without prior written permission of the Transportation Research Board
Paper No. 001636 $QDO\]LQJ$UWHULDO6WUHHWVLQ1HDU&DSDFLW\ RU2YHUIORZ&RQGLWLRQV Duplication for publication or sale is strictly prohibited without prior written permission of the Transportation Research Board
Control Delay at Signalized Diamond Interchanges Considering Internal Queue Spillback Paper No
 Publish Information: Xu, H., H. Liu, and Z. Tian (00). Control Delay at Signalized Interchanges Considering Internal Queue Spillback. Journal of Transportation Research Record, No.73, 3 3. Control Delay
Appendix B. Durham Region Travel Demand Model Calibration
 Appendix B Durham Region Travel Demand Model Calibration AECOM 300 Water Street 905 668 9363 tel Whitby, ON, Canada L1N 9J2 905 668 0221 fax www.aecom.com To Ron Albright, Municipality of Clarington Page
5.1 Introduction. 5.2 Data Collection
 Chapter 5 Traffic Analysis 5.1 Introduction This chapter of the EIS assesses the traffic impacts of the proposed N5 Westport to Turlough Road Project (the proposed scheme). The proposed scheme will provide
CITY OF ORILLIA POLICY MANUAL. Winter Operations. Table of Contents. WINTER CONTROL Objectives 2. WINTER CONTROL Season 3
 Page 1 of 12 Winter Operations Table of Contents WINTER CONTROL Objectives 2 WINTER CONTROL Season 3 SNOW ACCUMULATION Road Plowing 4,5 ICY ROADWAYS Application of Deicers/Abrasives 6 SNOW ACCUMULATION
Katrina. Katrina... 2/27/2009 4
 Some History Concept Developed over 25 Years Ago Featured in Numerous Research Efforts & Publications Over 60 Currently Operating AASHTO s 2002 National Award for Innovation More History 2002 LADOTD and
California Experience With Inside Shoulder Removals
 TRANSPORTATION RESEARCH RECORD 1122 37 California Experience With Inside Shoulder Removals THOMAS URBANIK AND CARLOS R. BONILLA The problem of increasing freeway corridor capacity in a safe and cost-effective
Forecasts from the Strategy Planning Model
 Forecasts from the Strategy Planning Model Appendix A A12.1 As reported in Chapter 4, we used the Greater Manchester Strategy Planning Model (SPM) to test our long-term transport strategy. A12.2 The origins
PW 001 SNOW REMOVAL AND SANDING FOR ROADWAYS AND SIDEWALKS October 6, 2014 (#223-14) Original October 19, 2015; October 15, 2018 Public Works
 Original October 19, 2015; October 15, 2018 Public Works") Policy Statement: The Village of Kitscoty will provide snow and ice control on municipal streets and sidewalks according to determined priorities. Purpose: To provide direction and information to employees
Policy Statement: The Village of Kitscoty will provide snow and ice control on municipal streets and sidewalks according to determined priorities. Purpose: To provide direction and information to employees
Technical Memorandum #2 Future Conditions
 Technical Memorandum #2 Future Conditions To: Dan Farnsworth Transportation Planner Fargo-Moorhead Metro Council of Governments From: Rick Gunderson, PE Josh Hinds PE, PTOE Houston Engineering, Inc. Subject:
January 12, Mr. Ryan Granger TMGB Wilson, LLC 2221 Health Drive SW, Suite 2200 Wyoming, Michigan 49519
 January 12, 2018 Mr. Ryan Granger TMGB Wilson, LLC 2221 Health Drive SW, Suite 2200 Wyoming, Michigan 49519 Re: Proposed Reserve at Rivertown Mixed-Use Development Updated Trip Generation and Site Driveway