Lake Tahoe. Response to Winter Rain Events. Dr. David Maidment University of Texas at Austin. Dr. David Tarboton Utah State University
|
|
|
- Brice Atkinson
- 6 years ago
- Views:
Transcription


1 CE 394K GIS in Water Resources Fall 2017 University of Texas at Austin PREPARED FOR Dr. David Maidment University of Texas at Austin Dr. David Tarboton Utah State University PREPARED BY Joel Lagade Jr., EIT University of Texas at Austin CAEE - EWRE
2 TABLE OF CONTENTS 1.0 INTRODUCTION Lake Tahoe Background California Drought Background Objective METHODS AND DATA COLLECTION Gage Station Identification and Data Extraction nohrsc supplemental maps USDM Supplmental Maps and Plots Relative Drought Severity Cartography USDM Drought Data Download and Extraction Data Organization and Transformation RESULTS Prior to the Drought ( ) During the Drought ( ) Response to Drought ( ) SUMMARY AND CONCLUSIONS REFERENCES i Fall 2017
3 LIST OF FIGURES Figure 1 Percent Area Time Series of California Drought Figure 2a Photo - Lake Tahoe Dam 2015 Figure 2b Photo - Lake Tahoe Dam 2017 Figure 3 Lake Tahoe Site Location Map Figure 4 California Drought Maps Figure 5 Hydrologic Cycle Figure 6a Lake Tahoe Watershed with Subwatersheds, Catchments, and Flowlines Figure 6b Lake Tahoe Watershed with Land Cover and Gaging Stations Figure 7 USDM GIS Data Files Page Figure 8 Merged USDM Shapefiles Figure 9 Lake Tahoe Watershed Hexagon Grid Figure 10 Lake Tahoe Watershed Centroids Figure 11 Lake Tahoe Watershed Spatially Joined Centroids and Drought Polygons Figure 12 California Snow Water Equivalent 3 Jan 2005 to 3 Jan 2011 Figure 13a Before Drought - Relative Drought Severity Map (Oct 2004 to Oct 2011) Figure 13b Before Drought - California Drought in Percent Area (Oct 2004 to Oct 2011) Figure 14 California Snow Water Equivalent 3 Jan 2012 to 3 Jan 2016 Figure 15a During Drought - Relative Drought Severity Map (Oct 2011 to Oct 2016) Figure 15b During Drought - California Drought in Percent Area (Oct 2011 to Oct 2016) Figure 16 California Snow Water Equivalent 3 Jan 2017l Figure 17a Post Drought - Relative Drought Severity Map (Oct 2016 to Dec 2017) Figure 17b Post Drought - California Drought in Percent Area (Oct 2016 to Dec 2017) LIST OF TABLES Table 1 Table 2 List of Gaging Stations Hydrologic Parameters LIST OF PLOTS Plot 1 Before Drought - Average Rain and Snow Accumulation / Oct 2004 to Oct 2011 Plot 2 Before Drought - Total Discharge and Lake Gage Height / Oct 2004 to Oct 2011 Plot 3 Before Drought - Average Soil Moisture Content / Oct 2004 to Oct 2011 Plot 4 Before Drought - Average Soil Temperature / Oct 2004 to Oct 2011 Plot 5 During Drought - Average Rain and Snow Accumulation / Oct 2011 to Oct 2016 ii Fall 2017
4 Plot 6 During Drought - Total Discharge and Lake Gage Height / Oct 2011 to Oct 2016 Plot 7 During Drought - Average Soil Moisture Content / Oct 2011 to Oct 2016 Plot 8 During Drought - Average Soil Temperature / Oct 2011 to Oct 2016 Plot 9 Post Drought - Average Rain and Snow Accumulation / Oct 2016 to Dec 2017 Plot 10 Post Drought - Total Discharge and Lake Gage Height / Oct 2016 to Dec 2017 Plot 11 Post Drought - Average Soil Moisture Content / Oct 2016 to Dec 2017 Plot 12 Post Drought - Average Soil Temperature / Oct 2016 to Dec 2017 APPENDICES Appendix A Precipitation and Snow Water Content (CDEC, 2017) iii Fall 2017
5 ACRONYMS/ABBREVIATIONS amsl bgs cfs F above mean sea level below ground surface cubic feet per second degrees Fahrenheit DM Drought Monitor HUC Hydrologic Unit Code LA Times Los Angeles Times NLCD National Land Cover Dataset NHDPlusV2 USA National Hydrography Dataset Plus Version 2 NOHRSC National Operational Hydrologic Remote Sensing Center NRCS Natural Resources Conservation Service SNOTEL Snow Telemetry sq-mi square miles USDM United States Drought Monitor USGS United States Geologic Survey iv Fall 2017
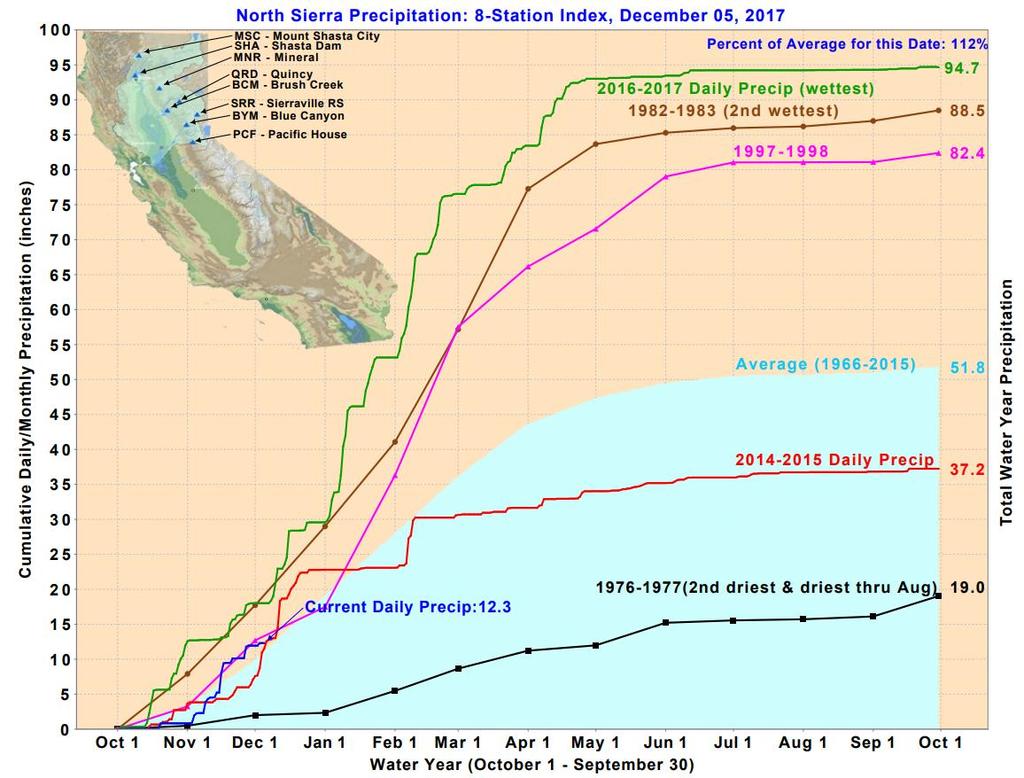
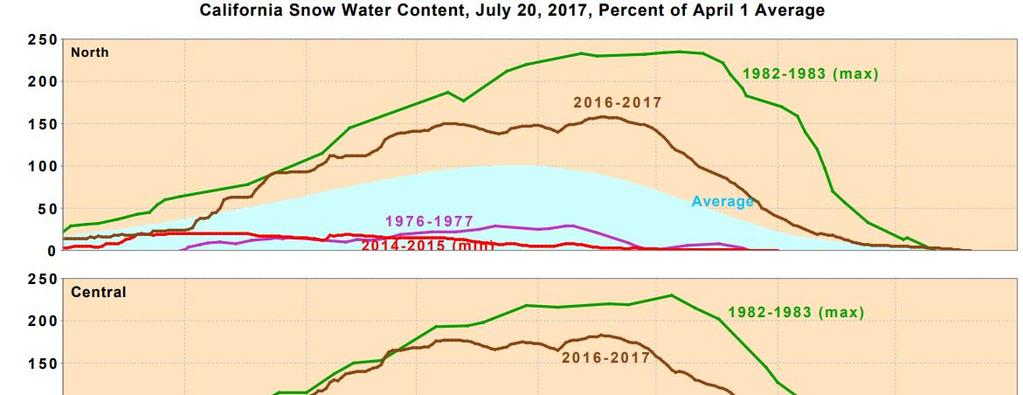
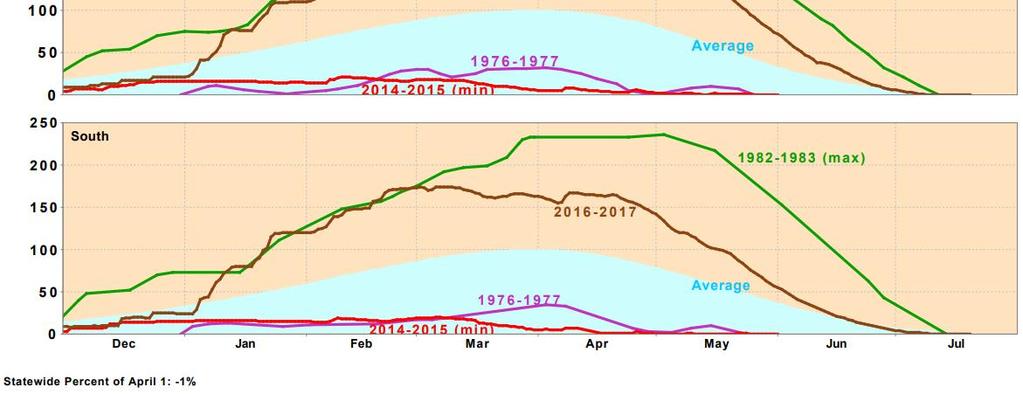
6 EXECUTIVE SUMMARY California has experienced one of its most severe and prolonged droughts from December 2011 to October According to the United States Drought Monitor (USDM), approximately 90 percent of California was in a drought from 2013 to At its worst, more than 60 percent of California was experiencing at least a level of Extreme Drought D3 forcing Governor Jerry Brown to declare a drought state of emergency in January 2014 (See Figure 1; United States Geologic Survey (USGS), 2017). Governor Brown ordered a 25% reduction in urban water use enforcing people to take shorter showers and replanting of their lawns. This forced California to rely heavily on groundwater and inevitably create its first groundwater regulations and laws. The last prolonged drought of similar magnitude and policy change was from when California responded by building several reservoirs (Los Angeles Times (LA Times), 2017). Figure 1 Percent Area Time Series of California Drought (USDM, 2017) During the drought, California fell to historic hydrologic lows due to the amount of precipitation and snow that did not fall. This was particularly evident in the Northern Sierra 8- Station precipitation index and the recorded California Snow Water Content, which the former measures the precipitation of the Sacramento River Watershed a major component of the state s water supply. Since 1966, the Sacramento River Watershed has received a maximum daily average of 51.8 inches of precipitation a year and California as a whole recorded a maximum daily average of 100 inches of snow water content a year. However, from December 2011 to October 2016, the Sacramento River watershed dropped to a maximum daily average of 37.2 inches of precipitation and the State of California recorded its lowest maximum daily average of approximately 20 inches of snow water content in the driest and warmest year on record, (Appendix A; California Department of Water Resources, 2017). The Lake Tahoe Watershed, located in the Sierra Nevada, was no different and exhibited extremely low conditions from the end of 2011 through This was determined by disseminating data from active USGS gage and Natural Resources Conservation Service (NRCS) Snow Telemetry (SNOTEL) stations. In the seven years prior to the drought ( ), the Lake Tahoe Watershed received a maximum daily average of 35.7 inches in precipitation, 20.1 inches in snow water equivalent, and 68.9 inches in snow depth. The maximum daily total average mean discharge into Lake Tahoe was 2,262 cubic feet per second (cfs) and the maximum daily average lake gage height was 6.52 feet (6, feet above mean sea level (amsl)). To identify 1 Fall 2017
. During this time period, the Lake Tahoe Watershed averaged drought levels between Severe Drought D2 to Extreme Drought D3.")

7 the drought frequency and severity of the Lake Tahoe Watershed, relative drought severity maps were developed utilizing the same methodology as John Nelson in his Esri ArcGIS Five Year Drought story map (Esri, 2017). During this time period, the Lake Tahoe Watershed averaged drought levels between Severe Drought D2 to Extreme Drought D3. From the winter of 2011 to the winter of 2016, the Lake Tahoe Watershed maximum daily averages dropped to 27.8 inches in precipitation, 9.0 inches in snow water equivalent, and 36.0 inches in snow depth. The maximum daily total average mean discharge into Lake Tahoe decreased to 1,115 cfs and the maximum daily average lake gage height decreased to 5.14 feet (6, feet amsl). The drought levels in the Lake Tahoe Watershed averaged an Extreme Drought D3 to Exceptional Drought D4 during this time. Fortunately for Lake Tahoe and California as a whole, the historical high levels of precipitation and snow of winter brought California out of the strenuous five year drought. As such, Governor Brown declared the drought state of emergency over in April The Sacramento Watershed experienced its wettest year on record with a maximum daily precipitation of 94.7 inches. The State of California recorded its second highest maximum daily snow water content measurements of approximately 160, 180, and 175 inches in Northern, Central, and Southern California, respectively (Appendix A; California Department of Water Resources, 2017). Similarly, the Lake Tahoe Watershed received a maximum average daily precipitation of 71.7 inches, water equivalent of 36.4 inches, and snow depth of 105 inches. The maximum daily total average mean discharge into Lake Tahoe increased to 4,017 cfs and the maximum daily average lake gage height increased to 8.97 feet (6, feet amsl) short of its maximum legal gage height of 9.1 feet (6,229.1 feet amsl). Through 2017, Lake Tahoe has not averaged any drought level. This historic response to the winter rain events is seen in Figure 2a-b. See Plots 1-12 and Table 2 for hydrologic measurements and Figures for relative drought severity levels No Flow 2017 Excess Flow Figure 2a-b Lake Tahoe Dam Before (2015) and After (2017) Photos (Truckee River Guide, 2015; Northern Nevada Business Weekly, 2017) At the conclusion of this term project, the Lake Tahoe Watershed and the majority of California has fully receded from their drought statuses. The only portion of California experiencing the drought and/or its side effects is central and southern California. While this has been a historic year, history and Governor Brown reminds us that the next drought could be around the corner. Conservation must remain a way of life (LA Times, 2017). 2 Fall 2017
, Lake Tahoe straddles the California and Nevada state line.")
8 1.0 INTRODUCTION 1.1 LAKE TAHOE BACKGROUND Lake Tahoe is located in the Sierra Nevada and is the sixth largest natural lake in the United States, behind the five Great Lakes (See Figure 3). At an elevation of 6,225 feet above mean sea level (amsl), Lake Tahoe straddles the California and Nevada state line. The surrounding Lake Tahoe watershed is approximately 314 square miles (sq-mi), which is situated in the greater Lake Tahoe subbasin (507 sq-mi). The lake itself, is approximately 21.2 miles north-south, 11.9 miles east-west, with an approximate surface area of 192 square miles. The average depth is approximately 1,000 feet with a maximum depth of 1,645 feet. Lake Tahoe can hold about 39 trillion gallons of water with a regulated variation of 243 billion gallons. The only outlet is a dam located at Tahoe City, which controls the release of water into the Truckee River. The water is reported to be % pure versus commercially distilled water at % purity (Tahoe Fund, 2017). Figure 3 Lake Tahoe Site Location Map Approximately 65% of the water that enters Lake Tahoe is rain and snow melt runoff from 63 tributaries within the watershed. The remaining 35% of water is precipitation that directly falls on the lake typically 212 billion gallons of water a year. In a normal year, about one-third of the lake water flows into the Truckee River for downstream use and ultimately to Pyramid Lake in Nevada. The remaining water is lost to evaporation at an annual average rate of 0.1 inch per day or 36 inches per year. Every 24 hours about 1.4 million tons of water evaporates from Lake Tahoe, which is enough to serve 3.3 million people (Tahoe Fund, 2017) CALIFORNIA DROUGHT BACKGROUND The State of California recorded its worst drought from December 2011 to October 2016 since the drought of 1987 to From the onset of the drought, the drought status of California became progressively worse. From 2013 to 2016, approximately 90 percent of California was in a drought. In California s warmest year on record, , approximately 60 percent of California was experiencing at least a level of Extreme Drought D3 (See Figures 1 and 4; USDM, 2017). As a result, Governor Jerry Brown declared a drought state of emergency in January 2014 ordering a 25% reduction in urban water use and increased reliance on groundwater aquifers. The creation of groundwater regulations and policies followed soon after. This all lead to several permanent changes in people s habits such as shorter showers and drought resistant landscape replanting of homes and businesses. 3 Fall 2017
 During the 2011-2016 drought, the average amount of precipitation and snowpack decreased dramatically.")
9 Dec Start of Drought Dec Jan Gov. Brown Declares Emergency Dec Dec Dec Apr Gov. Brown Declares Drought Over Figure 4 California Drought Maps (USDM, 2017) During the drought, the average amount of precipitation and snowpack decreased dramatically. This was particularly evident in the Northern Sierra 8-station precipitation index and the recorded California Snow Water Content, which the former measures the precipitation of the Sacramento River Watershed a major component of the state s water supply. Since recording began in 1966, the Sacramento River watershed has received a maximum daily average of 51.8 inches of precipitation a year and California as a whole recorded a maximum daily average of 100 inches of snow water content a year. However, from December 2011 to October 2016, the Sacramento River watershed dropped to a maximum daily average of 37.2 inches of precipitation and the State of California recorded its lowest maximum daily average of approximately 20 inches of snow water content in the driest and warmest year on record, (Appendix A; California Department of Water Resources, 2017). In the winter of , the State of California recorded historical high levels of precipitation and snow which ultimately brought California out of the drought. The Sacramento Watershed experienced its wettest year on record with a maximum daily precipitation of 94.7 inches. The State of California recorded its second highest maximum daily snow water content measurements of approximately 160, 180, and 175 inches in Northern, Central, and Southern California, respectively (Appendix A; California Department of Water Resources, 2017). As such, Governor Brown declared the drought state of emergency over in April Fall 2017

10 1.3 OBJECTIVE To analyze how the recent rain events of the winter season of impacted Lake Tahoe, the Lake Tahoe Watershed, and surrounding snow packs against California s drought severity level via the parameters described and depicted below: 1. Precipitation / Snow Accumulation 2. Snow Water Equivalent / Depth 3. Surface / Snowmelt Runoff 4. Lake Tahoe Water Level 5. State and Local Drought Severity Figure 5 Hydrologic Cycle (NOAA - National Weather Service, 2010) Cartography and data collection was completed via ArcGIS Pro, United States Geologic Survey (USGS), National Resources Conservation Service Snow Telemetry (NCRS-SNOTEL), National Weather Service National Operational Hydrologic Remote Sensing Center (NOHRSC), and United States Drought Monitor (USDM). Methodology is detailed below in Section 2. 5 Fall 2017

 16050101 with a total of four subwatersheds, 478 catchments, and 483 streams as seen in Figure 6a.")
11 2.0 METHODS AND DATA COLLECTION 2.1 GAGE STATION IDENTIFICATION AND DATA EXTRACTION To identify pertinent gage stations for hydrologic analysis, the Lake Tahoe Subbasin, associated watershed, subwatersheds, catchments, and stream flowlines were extracted from the USA National Hydrography Dataset (NHDPlusV2, 2017) and delineated in ArcGIS Pro. The Lake Tahoe Subbasin was identified as Hydrologic Unit Code 12 (HUC 12) with a total of four subwatersheds, 478 catchments, and 483 streams as seen in Figure 6a. To assist in visually determining streams and areas with gage stations, the flowlines were recolored to the Best Estimate of Actual Mean Flow Attribute and land cover rasters for were extracted from the National Land Cover Database (NLCD, 2011) onto the Lake Tahoe Watershed (See Figure 6b). This cartographic process was cross referenced with the USGS and SNOTEL databases to plot all the relevant and active gaging stations: one lake gage, eight stream gages, and five SNOTEL stations. See Figures 6a/b and Table 1. 6a 6b Figure 6a Lake Tahoe Watershed with Subwatersheds, Catchments, and Flowlines Figure 6b Lake Tahoe Watershed with Land Cover and Gaging Stations 6 Fall 2017
12 Table 1 List of Gaging Stations Site # Name Agency Latitute Longtitude Lake Tahoe at Tahoe City, CA USGS Truckee River, CA USGS Third Creek near Crystal Bay, NV USGS Incline Creek near Crystal Bay, NV USGS Trout Creek near Tahoe Valley, CA USGS Upper Truckee River at South Lake Tahoe, CA USGS General Creek near Meeks Bay, CA USGS Blackwood Creek near Tahoe City, CA USGS Ward Creek at Hwy 89 near Tahoe Pines, CA USGS Tahoe City Cross NRCS-SNOTEL Marlette Lake NRCS-SNOTEL Heavenly Valley NRCS-SNOTEL Hagans Meadow NRCS-SNOTEL Fallen Leaf NRCS-SNOTEL Once the stations were identified and plotted, specific hydrologic data were downloaded for each type of station from October 2004 through November 2017: 1) Lake Tahoe daily lake gage height (Station 1, USGS); 2) daily mean discharge for stream gages (Stations 2-9, USGS); and 3) daily mean precipitation, snow water equivalent, snow depth, soil moisture content, and soil moisture temperature (Stations 10-14; NRCS-SNOTEL). Due to the size of the Lake Tahoe Watershed and locale variation of the gaging stations, the hydrologic characteristics were averaged in order to analyze the watershed as a whole. Caution was exercised in making sure not to apply these averaged values toward single gaging stations. This data is detailed and analyzed in Section NOHRSC SUPPLEMENTAL MAPS As supplemental and visual material in comparing the three time periods, NOHRSC maps for snow water equivalent were extracted from the online interactive maps. They are depicted below in Section USDM SUPPLMENTAL MAPS AND PLOTS Similar to the NOHRSC supplemental material, USDM maps and plots were extracted from the online database for analysis. Additionally, GIS shapefiles were downloaded and used to develop relative drought severity maps. The extracted maps and plots are displayed through this project. The methodology in developing the relative drought severity maps is described below in Section RELATIVE DROUGHT SEVERITY CARTOGRAPHY In order to analyze the impact of the winter rain events on the Lake Tahoe Watershed and the five year drought, relative drought severity maps were developed to depict the combined frequency and severity that Lake Tahoe experienced. This methodology was reproduced based 7 Fall 2017
, which is described below with respect to the maps created for the Lake")
.")
 together into one single shapefile.")
13 on the Esri Five Years of Drought Story Map created by John Nelson (Esri, 2017). John Nelson outlined this process in his ArcGIS blog post, Six Months of Drought in the American Southeast (Nelson, 2016), which is described below with respect to the maps created for the Lake Tahoe Watershed USDM Drought Data Download and Extraction On their website, USDM provides a plethora of data files ranging from statistics to GIS shapefiles dating back to 2000 (See Figure 7). For this term project, weekly drought perimeter shapefiles were downloaded per bulk year from 2004 through The shapefiles were then extracted into the ArcGIS Pro project location, opened in the software, and merged (Geoprocessing tool) together into one single shapefile. Each polygon in the shapefile produced has a single Figure 7 USDM GIS Data Files Page drought severity attribute based on the USDM drought levels: 0 (Abnormally Dry), 1 (Moderate Drought), 2 (Severe Drought), 3 (Extreme Drought), and 4 (Exceptional Drought). Figure 8 below depicts the merging of the USDM drought shapefiles into a single shapefile and its visual output. Figure 8 Merged USDM Shapefiles 8 Fall 2017

14 2.4.2 Data Organization and Transformation Figure 9 Lake Tahoe Watershed Hexagon Grid To begin organizing the data within the single drought shapefile, the Lake Tahoe Watershed was divided into an evenly spaced grid via hexagonal tessellation. The project file was set to an equal area projection and the Lake Tahoe Subbasin and its surrounding area were carved into approximately 16 sq-mi hexagonal cells (See Figure 9 above). Figure 10 Lake Tahoe Watershed Centroids The hexagonal polygons were then converted to point centroids via the Feature to Point geoprocessing tool to have precisely only one location per point to account for overlapping drought polygons (See Figure 10 above). 9 Fall 2017
15 Figure 11 Lake Tahoe Watershed Spatially Joined Centroids and Drought Polygons The centroid layer was then spatially joined (Geoprocessing tool) to the single drought shapefile merged in Section Figure 11 above depicts spatially joined centroids and drought polygons broken into three drought severity groups: DM2 Severe Drought (orange, left side), DM3 Extreme Drought (bright red, center right), and DM3 Exceptional Drought (dark red, top right). Each group was separated into its own layer in order to assign a specified color and size. This process took into account all the drought polygons that overlapped at each centroid point via the DM attribute. As reminded by John Nelson, the DM attribute is a categorical scale and is not intended to be quantifiable. However, similarly to John Nelson s work, this term project uses this relative, cumulative DM value per point to depict the frequency (centroid size) and severity (centroid color) of the Lake Tahoe Watershed. Analysis of these maps are detailed in Section Fall 2017
16 3.0 RESULTS 3.1 PRIOR TO THE DROUGHT ( ) To get a cumulative sense of the severity of the drought and the impact of the subsequent winter rains, hydrologic data prior to the drought was analyzed. The time period of 2004 through 2011 was selected as an arbitrary, but suitable time period for comparison. During the seven years prior to the drought, Lake Tahoe exhibited cyclical behavior expected from a large and historical natural system winter / wet seasons beginning on October 1. As detailed in Plots 1 and 2 and Table 2, there were expected hydrologic highs and lows. Interestingly enough, Lake Tahoe received its highest precipitation and snowpack levels from October 2010 to October 2011, immediately before the start of the drought. From , the Lake Tahoe Watershed received a maximum daily average of 35.7 inches in precipitation, 20.1 inches in snow water equivalent, and 68.9 inches in snow depth. The maximum daily total average mean discharge into Lake Tahoe was 2,262 cubic feet per second (cfs) and the maximum daily average lake gage height was 6.52 feet (6, feet amsl). See Figure 12 for a visual representation of the accumulated snow water equivalent in California. Plot 1 Plot 2 11 Fall 2017
.")
17 JAN-2005 JAN-2006 JAN-2007 JAN-2008 JAN-2009 JAN-2010 JAN-2011 Figure 12 California Snow Water Equivalent 3 Jan 2005 to 3 Jan 2011 (NOHRSC, 2017) Note: January 3 for Lake Tahoe is the center date for the most snow. Soil moisture content and associated temperatures are measured at the SNOTEL stations at 2- inches, 8-inches, and 20-inches below ground surface (bgs). From 2004 to 2011, the maximum daily average soil moisture content measured in the Lake Tahoe Watershed were 25.9%, 34.5%, and 40.5%, at 2-, 8-, and 20-inches, respectively. The associated measured maximum daily average temperatures were 60.1 degrees Fahrenheit ( F), 58.1 F, and 53.1 F, respectively. Conversely, the minimum daily average soil moisture content measured in the Lake Tahoe Watershed were 0.9%, 7.5%, and 8.9%, at 2-, 8-, and 20-inches bgs, respectively. The associated measured minimum daily average soil temperatures were 32.8 F, 33.9 F, and 35.1 F, respectively. As a result, the Lake Tahoe Watershed averaged drought levels between Severe Drought D2 to Extreme Drought D3 going from the southwest to the northwest. See Plots 3 and 4, and Figure 13a-b. 12 Fall 2017

18 Plot 3 Plot 4 13 Fall 2017
 3.2 DURING THE DROUGHT (2011-2016) Identical to the entire State of California, Lake Tahoe experienced hydrologic record lows at all its gaging stations.")
.")
19 13a 13b Drought Severity & Frequency D2 Severe Drought D3 Extreme Drought Figure 13a Before Drought - Relative Drought Severity Map (Oct 2004 to Oct 2011) Figure 13b California Drought in Percent Area (USDM, 2017) 3.2 DURING THE DROUGHT ( ) Identical to the entire State of California, Lake Tahoe experienced hydrologic record lows at all its gaging stations. During this exceptionally dry period, the maximum daily average precipitation, snow water equivalent, and snow depth dropped to 27.8 inches, 9.0 inches, and 36.0 inches, respectively. Likewise the maximum daily total average mean discharge into Lake Tahoe dropped 1,115 cfs and the maximum daily average lake gage height dropped to 5.14 feet (6, feet amsl). See Plots 5-6 and Figure 14. Plot 5 14 Fall 2017
20 Plot 6 JAN-2012 JAN-2013 JAN-2014 JAN-2015 JAN-2016 Figure 14 California Snow Water Equivalent 3 Jan 2012 to 3 Jan 2016 (NOHRSC, 2017) Note: January 3 for Lake Tahoe is the center date for the most snow. 15 Fall 2017

21 During the drought, the maximum daily average soil moisture content measured at 2-, 8-, and 20- inches bgs decreased to 23.6%, 29.7%, and 38.1%, respectively. The associated measured maximum daily average temperatures increased 62.3 F, 58.6 F, and 53.6 F. On the other end of the spectrum, the minimum daily average soil moisture content measured increased to 3.1%, 9.1% and 11.2%, respectively. The associated measured minimum daily average temperatures decreased to 31.7 F, 33.2 F, and 35.2 F, respectively. Thus the Lake Tahoe Watershed averaged drought between Extreme Drought D3 and Exceptional Drought D4. See Plots 7 and 8, and Figure 13 a-b. Plot 7 Plot 8 16 Fall 2017
 3.")
22 13a 13b Drought Severity & Frequency D3 Extreme Drought Figure 15a During Drought - Relative Drought Severity Map (Oct 2011 to Oct 2016) Figure 15b During Drought - California Drought in Percent Area (Oct 2011 to Oct 2016; USDM, 2017) 3.3 RESPONSE TO DROUGHT ( ) For the Lake Tahoe Watershed, the drought began to diminish at the beginning of the winter / wet season as the region experienced record highs for a single winter. As detailed in the following Plots 9-10 and Figure 16, precipitation and snow accumulation and the lakes response measurements increased dramatically. The recorded maximum daily average precipitation, snow water equivalents, and snow depth were 71.7 inches, 36.4 inches, and 105 inches, respectively. The maximum daily total average mean discharge into Lake Tahoe rose to 4,017 cfs and the resultant maximum daily average lake gage height rose to 8.97 feet (6, feet amsl) 0.13 feet shy of the legal maximum limit of 9.1 feet (6,229.1 feet amsl). The winter and wet seasons ensuing extension pushed observed received precipitation into September 2017 and snow accumulation into June Plot 9 17 Fall 2017

23 Plot 10 JAN-2017 Figure 16 California Snow Water Equivalent 3 Jan 2017 (NOHRSC, 2017) Note: January 3 for Lake Tahoe is the center date for the most snow. As expected from the increase in precipitation and snow, the measured maximum daily average soil moisture content increased at all depths to 31.8%, 35.4%, and 40.3% - at 2-, 8-, and 20- inches bgs, respectively. The measured minimum daily average soil moisture content increased to 8.6%, 9.7%, and 14.5%, respectively. The measured maximum daily average soil temperatures decreased to 59.4 F, 56.6 F, and 53.2 F, respectively. The measured minimum daily average soil temperatures increased to 32.8 F (2-inches) and 33.6 F (8-inches), with the exception of the soil temperature at 20-inches, which decreased to 34.8 F. Since the beginning of the winter season to December 2017, the Lake Tahoe Watershed has not averaged in any drought level. See Plots 11 and 12, and Figure 17 a-b. 18 Fall 2017
 Figure 14b Post Drought - California Drought in Percent Area (Oct 2016 to Dec 2017; USDM, 2017) 19 Fall")
24 Plot 11 Plot 12 14a 14b Drought Severity & Frequency None No Drought Figure 14a Post Drought - Relative Drought Severity Map (Oct 2016 to Dec 2017) Figure 14b Post Drought - California Drought in Percent Area (Oct 2016 to Dec 2017; USDM, 2017) 19 Fall 2017
25 4.0 SUMMARY AND CONCLUSIONS As detailed in Section 3 above and Table 2 below, from October 2004 to December 2017, Lake Tahoe behaved in an expected cyclical behavior from a large and established natural ecosystem. While not the ideal and statistical analytical methodology, averaging the hydrologic parameters and identifying the maximum and minimum averaged values provided an ample comparative picture of the impact of the winter rain events. Table 2 Hydrologic Parameters Before Drought Difference Increase / Decrease During Drought Difference Increase / Decrease Post Drought Precipitation (in.) Snow Water Equivalent (in.) Snow Depth (in.) Total Mean Discharge (cfs) 2,262 1,031 1,115 2,901 4,017 Lake Gage Height (feet) Soil Moisture 2-in. (%) [Max / Min] Variance (Max-Min) Soil Moisture 8-in. (%) [Max / Min] Variance (Max-Min) Soil Moisture 20-in. (%) Max / Min Variance (Max-Min) 25.9 / / / / / / / / / / / / / / / Soil 2-in. ( F) [Max / Min] Variance (Max-Min) 60.1 / / / / / Soil 8-in. ( F) [Max / Min] Variance (Max-Min) 58.1 / / / / / Soil 20-in. ( F) [Max / Min] Variance (Max-Min) 53.1 / / / / / As detailed in Table 2 and depicted throughout Section 3, the precipitation and snow accumulation received by Lake Tahoe decreased from before the drought and increased after the drought. As a result, the total mean discharge into the lake and the water level of the lake decreased and increased. Comparing Plots 1 and 2 (before drought) to Plots 5 and 6 (during drought), it is observed that while precipitation levels generally were around the same range, the difference in received snow and measured snow water equivalent had immediate effects on the lake and the surrounding watershed. In particular, there is a downward trend in the lake gage height in Plot 6 until the winter rain events. Additionally, it is observed that due to less rain and snow during the drought, the variance (maximum minus minimum values) in soil moisture content decreased, which resulted in a higher variance in soil temperature. From before the drought and into the drought time period, the drought in Lake Tahoe worsened from a D2-D3 (Severe to Extreme Drought) to a D3-D4 (Extreme to Exceptional Drought). With the winter rain events, the soil moisture content and associated soil temperature rebounded close to levels prior to the drought. Similar to the impact 20 Fall 2017
26 of the drought on the soil, it will take time and more rain and snow for Lake Tahoe to regain its typical characteristics. At the very least, Lake Tahoe has not averaged a drought this year. In conclusion, the winter rain events not only brought Lake Tahoe out of the drought, but also the majority of California. This drought forced California and its people to be more water conscious than they have ever been. However, in looking at the history of California and Lake Tahoe, a drought could be right around the corner as was experienced in 2011, prior to the five year drought. 21 Fall 2017
27 5.0 REFERENCES California Department of Water Resources California Data Exchange Center (CDEC) Esri Five Years of Drought Story Map. Created by John Nelson. ( Los Angeles Times (LA Times) Gov. Brown declares California drought emergency is over. ( April 7. National Land Cover Database (NLCD) USGS. ( National Oceanic and Atmospheric Administration (NOAA) National Weather Service ( National Operational Hydrologic Remote Sensing Center (NOHRSC) National Weather Service ( Nelson, John Six Months of Drought in the American Southeast. Esri ArcGIS Blog. ( December 6. Tahoe Fund ( United States Drought Monitor (USDM) The U.S. Drought Monitor is jointly produced by the National Drought Mitigation Center at the University of Nebraska-Lincoln, the United States Department of Agriculture, and the National Oceanic and Atmospheric Administration. Map courtesy of NDMC-UNL. United States Geologic Survey (USGS) USA National Hydrography Dataset Plus Version 2 (NHDPlusV2) Fall 2017
28 APPENDIX A Precipitation and Snow Water Content (CDEC, 2017) Fall 2017
29 Fall 2017
30 Fall 2017
GRAPEVINE LAKE MODELING & WATERSHED CHARACTERISTICS
 GRAPEVINE LAKE MODELING & WATERSHED CHARACTERISTICS Photo Credit: Lake Grapevine Boat Ramps Nash Mock GIS in Water Resources Fall 2016 Table of Contents Figures and Tables... 2 Introduction... 3 Objectives...
The Documentation of Extreme Hydrometeorlogical Events: Two Case Studies in Utah, Water Year 2005
 The Documentation of Extreme Hydrometeorlogical Events: Two Case Studies in Utah, Water Year 2005 Tim Bardsley1*, Mark Losleben2, Randy Julander1 1. USDA, NRCS, Snow Survey Program, Salt Lake City, Utah.
January 25, Summary
 January 25, 2013 Summary Precipitation since the December 17, 2012, Drought Update has been slightly below average in parts of central and northern Illinois and above average in southern Illinois. Soil
REDWOOD VALLEY SUBAREA
 Independent Science Review Panel Conceptual Model of Watershed Hydrology, Surface Water and Groundwater Interactions and Stream Ecology for the Russian River Watershed Appendices A-1 APPENDIX A A-2 REDWOOD
Lake Tahoe Watershed Model. Lessons Learned through the Model Development Process
 Lake Tahoe Watershed Model Lessons Learned through the Model Development Process Presentation Outline Discussion of Project Objectives Model Configuration/Special Considerations Data and Research Integration
Missouri River Basin Water Management
 Missouri River Basin Water Management US Army Corps of Engineers Missouri River Navigator s Meeting February 12, 2014 Bill Doan, P.E. Missouri River Basin Water Management US Army Corps of Engineers BUILDING
Monthly Long Range Weather Commentary Issued: February 15, 2015 Steven A. Root, CCM, President/CEO
 Monthly Long Range Weather Commentary Issued: February 15, 2015 Steven A. Root, CCM, President/CEO sroot@weatherbank.com JANUARY 2015 Climate Highlights The Month in Review During January, the average
Great Lakes Update. Volume 194: 2015 Annual Summary
 Great Lakes Update Volume 194: 2015 Annual Summary Background The U.S. Army Corps of Engineers (USACE) tracks and forecasts the water levels of each of the Great Lakes. This report summarizes the hydrologic
SEPTEMBER 2013 REVIEW
 Monthly Long Range Weather Commentary Issued: October 21, 2013 Steven A. Root, CCM, President/CEO sroot@weatherbank.com SEPTEMBER 2013 REVIEW Climate Highlights The Month in Review The average temperature
USING GIS TO MODEL AND ANALYZE HISTORICAL FLOODING OF THE GUADALUPE RIVER NEAR NEW BRAUNFELS, TEXAS
 USING GIS TO MODEL AND ANALYZE HISTORICAL FLOODING OF THE GUADALUPE RIVER NEAR NEW BRAUNFELS, TEXAS ASHLEY EVANS While the state of Texas is well-known for flooding, the Guadalupe River Basin is one of
Illinois Drought Update, December 1, 2005 DROUGHT RESPONSE TASK FORCE Illinois State Water Survey, Department of Natural Resources
 Illinois Drought Update, December 1, 2005 DROUGHT RESPONSE TASK FORCE Illinois State Water Survey, Department of Natural Resources For more drought information please go to http://www.sws.uiuc.edu/. SUMMARY.
NATIONAL WEATHER SERVICE
 January 2016 February 9, 2016 This was a dry month across the HSA despite one large and several smaller snowfalls. Most locations ended up 1-2 inches below normal for the month. The driest locations at
Monthly Long Range Weather Commentary Issued: NOVEMBER 16, 2015 Steven A. Root, CCM, Chief Analytics Officer, Sr. VP, sales
 Monthly Long Range Weather Commentary Issued: NOVEMBER 16, 2015 Steven A. Root, CCM, Chief Analytics Officer, Sr. VP, sales sroot@weatherbank.com OCTOBER 2015 Climate Highlights The Month in Review The
Lower Tuolumne River Accretion (La Grange to Modesto) Estimated daily flows ( ) for the Operations Model Don Pedro Project Relicensing
 Estimated daily flows ( ) for the Operations Model Don Pedro Project Relicensing") Lower Tuolumne River Accretion (La Grange to Modesto) Estimated daily flows (1970-2010) for the Operations Model Don Pedro Project Relicensing 1.0 Objective Using available data, develop a daily time series
Lower Tuolumne River Accretion (La Grange to Modesto) Estimated daily flows (1970-2010) for the Operations Model Don Pedro Project Relicensing 1.0 Objective Using available data, develop a daily time series
Monthly Long Range Weather Commentary Issued: APRIL 1, 2015 Steven A. Root, CCM, President/CEO
 Monthly Long Range Weather Commentary Issued: APRIL 1, 2015 Steven A. Root, CCM, President/CEO sroot@weatherbank.com FEBRUARY 2015 Climate Highlights The Month in Review The February contiguous U.S. temperature
January 2011 Calendar Year Runoff Forecast
 January 2011 Calendar Year Runoff Forecast 2010 Runoff Year Calendar Year 2010 was the third highest year of runoff in the Missouri River Basin above Sioux City with 38.8 MAF, behind 1978 and 1997 which
Monthly Long Range Weather Commentary Issued: July 18, 2014 Steven A. Root, CCM, President/CEO
 Monthly Long Range Weather Commentary Issued: July 18, 2014 Steven A. Root, CCM, President/CEO sroot@weatherbank.com JUNE 2014 REVIEW Climate Highlights The Month in Review The average temperature for
Wind River Indian Reservation and Surrounding Area Climate and Drought Summary
 Northern Arapaho Tribe Wind River Indian Reservation and Surrounding Area Climate and Drought Summary Spring Events & Summer Outlook 2015 Spring Was Warm And Very Wet Across The Region The spring season
CENTRAL TEXAS HILL COUNTRY FLOOD
 CENTRAL TEXAS HILL COUNTRY FLOOD Term project report DECEMBER 7, 2018 UNIVERSITY OF TEXAS AT AUSTIN CE394K: GIS in Water Resources Engineering RIFAAI Mohamed Talha Table of Contents Introduction... 3 Context...
PH YSIC A L PROPERT IE S TERC.UCDAVIS.EDU
 PH YSIC A L PROPERT IE S 8 Lake surface level Daily since 1900 Lake surface level varies throughout the year. Lake level rises due to high stream inflow, groundwater inflow and precipitation directly onto
NATIONAL HYDROPOWER ASSOCIATION MEETING. December 3, 2008 Birmingham Alabama. Roger McNeil Service Hydrologist NWS Birmingham Alabama
 NATIONAL HYDROPOWER ASSOCIATION MEETING December 3, 2008 Birmingham Alabama Roger McNeil Service Hydrologist NWS Birmingham Alabama There are three commonly described types of Drought: Meteorological drought
Development and Land Use Change in the Central Potomac River Watershed. Rebecca Posa. GIS for Water Resources, Fall 2014 University of Texas
 Development and Land Use Change in the Central Potomac River Watershed Rebecca Posa GIS for Water Resources, Fall 2014 University of Texas December 5, 2014 Table of Contents I. Introduction and Motivation..4
Upper Missouri River Basin December 2017 Calendar Year Runoff Forecast December 5, 2017
 Upper Missouri River Basin December 2017 Calendar Year Runoff Forecast December 5, 2017 Calendar Year Runoff Forecast Explanation and Purpose of Forecast U.S. Army Corps of Engineers, Northwestern Division
NIDIS Intermountain West Drought Early Warning System May 23, 2017
 NIDIS Drought and Water Assessment NIDIS Intermountain West Drought Early Warning System May 23, 2017 Precipitation The images above use daily precipitation statistics from NWS COOP, CoCoRaHS, and CoAgMet
2012 Growing Season Weather Summary for North Dakota. Adnan Akyüz and Barbara A. Mullins Department of Soil Science October 30, 2012
 2012 Growing Season Weather Summary for North Dakota Adnan Akyüz and Barbara A. Mullins Department of Soil Science October 30, 2012 Introduction The 2012 growing season (the period from April through September)
NIDIS Drought and Water Assessment
 NIDIS Drought and Water Assessment PRECIPITATION The images above use daily precipitation statistics from NWS COOP, CoCoRaHS, and CoAgMet stations. From top to bottom, and left to right: most recent 7-days
A Report on a Statistical Model to Forecast Seasonal Inflows to Cowichan Lake
 A Report on a Statistical Model to Forecast Seasonal Inflows to Cowichan Lake Prepared by: Allan Chapman, MSc, PGeo Hydrologist, Chapman Geoscience Ltd., and Former Head, BC River Forecast Centre Victoria
PRECIPITATION. Last Week Precipitation:
 12/3/2014 NIDIS Drought and Water Assessment PRECIPITATION The images above use daily precipitation statistics from NWS COOP, CoCoRaHS, and CoAgMet stations. From top to bottom, and left to right: most
Great Lakes Update. Volume 199: 2017 Annual Summary. Background
 Great Lakes Update Volume 199: 2017 Annual Summary Background The U.S. Army Corps of Engineers (USACE) tracks and forecasts the water levels of each of the Great Lakes. This report is primarily focused
Designing a Dam for Blockhouse Ranch. Haley Born
 Designing a Dam for Blockhouse Ranch Haley Born CE 394K GIS in Water Resources Term Paper Fall 2011 Table of Contents Introduction... 1 Data Sources... 2 Precipitation Data... 2 Elevation Data... 3 Geographic
Weather History on the Bishop Paiute Reservation
 Weather History on the Bishop Paiute Reservation -211 For additional information contact Toni Richards, Air Quality Specialist 76 873 784 toni.richards@bishoppaiute.org Updated 2//214 3:14 PM Weather History
Near Real-Time Runoff Estimation Using Spatially Distributed Radar Rainfall Data. Jennifer Hadley 22 April 2003
 Near Real-Time Runoff Estimation Using Spatially Distributed Radar Rainfall Data Jennifer Hadley 22 April 2003 Introduction Water availability has become a major issue in Texas in the last several years,
HyMet Company. Streamflow and Energy Generation Forecasting Model Columbia River Basin
 HyMet Company Streamflow and Energy Generation Forecasting Model Columbia River Basin HyMet Inc. Courthouse Square 19001 Vashon Hwy SW Suite 201 Vashon Island, WA 98070 Phone: 206-463-1610 Columbia River
January 2008 Climate Summary
 Joseph Mays (765) 494-6574 Feb 5, 2008 http://www.iclimate.org Summary January 2008 Climate Summary January was a mix bag of conditions, with an oscillatory pattern developing. We experienced phases of
Upper Missouri River Basin February 2018 Calendar Year Runoff Forecast February 6, 2018
 Upper Missouri River Basin February 2018 Calendar Year Runoff Forecast February 6, 2018 Calendar Year Runoff Forecast Explanation and Purpose of Forecast U.S. Army Corps of Engineers, Northwestern Division
NIDIS Intermountain West Drought Early Warning System January 15, 2019
 NIDIS Drought and Water Assessment NIDIS Intermountain West Drought Early Warning System January 15, 2019 Precipitation The images above use daily precipitation statistics from NWS COOP, CoCoRaHS, and
NIDIS Intermountain West Regional Drought Early Warning System February 7, 2017
 NIDIS Drought and Water Assessment NIDIS Intermountain West Regional Drought Early Warning System February 7, 2017 Precipitation The images above use daily precipitation statistics from NWS COOP, CoCoRaHS,
The hydrologic service area (HSA) for this office covers Central Kentucky and South Central Indiana.
 for this office covers Central Kentucky and South Central Indiana.") January 2012 February 13, 2012 An X inside this box indicates that no flooding occurred within this hydrologic service area. January 2012 continued the string of wet months this winter. Rainfall was generally
January 2012 February 13, 2012 An X inside this box indicates that no flooding occurred within this hydrologic service area. January 2012 continued the string of wet months this winter. Rainfall was generally
Water Supply Conditions and Outlook June 4, 2018
 Water Supply Conditions and Outlook June 4, 2018 Flow Forecasting & Operations Planning Water Security Agency Overview Water supply conditions across Saskatchewan are generally good with most reservoir
Weather and Climate Summary and Forecast Summer 2017
 Weather and Climate Summary and Forecast Summer 2017 Gregory V. Jones Southern Oregon University August 4, 2017 July largely held true to forecast, although it ended with the start of one of the most extreme
NIDIS Intermountain West Drought Early Warning System April 18, 2017
 1 of 11 4/18/2017 3:42 PM Precipitation NIDIS Intermountain West Drought Early Warning System April 18, 2017 The images above use daily precipitation statistics from NWS COOP, CoCoRaHS, and CoAgMet stations.
Sierra Weather and Climate Update
 Sierra Weather and Climate Update 2014-15 Kelly Redmond Western Regional Climate Center Desert Research Institute Reno Nevada Yosemite Hydroclimate Workshop Yosemite Valley, 2015 October 8-9 Percent of
Monthly Long Range Weather Commentary Issued: APRIL 18, 2017 Steven A. Root, CCM, Chief Analytics Officer, Sr. VP,
 Monthly Long Range Weather Commentary Issued: APRIL 18, 2017 Steven A. Root, CCM, Chief Analytics Officer, Sr. VP, sroot@weatherbank.com MARCH 2017 Climate Highlights The Month in Review The average contiguous
Monthly Long Range Weather Commentary Issued: SEPTEMBER 19, 2016 Steven A. Root, CCM, Chief Analytics Officer, Sr. VP,
 Monthly Long Range Weather Commentary Issued: SEPTEMBER 19, 2016 Steven A. Root, CCM, Chief Analytics Officer, Sr. VP, sroot@weatherbank.com SEPTEMBER 2016 Climate Highlights The Month in Review The contiguous
Leon Creek Watershed October 17-18, 1998 Rainfall Analysis Examination of USGS Gauge Helotes Creek at Helotes, Texas
 Leon Creek Watershed October 17-18, 1998 Rainfall Analysis Examination of USGS Gauge 8181400 Helotes Creek at Helotes, Texas Terrance Jackson MSCE Candidate University of Texas San Antonio Abstract The
2015 Fall Conditions Report
 2015 Fall Conditions Report Prepared by: Hydrologic Forecast Centre Date: December 21 st, 2015 Table of Contents Table of Figures... ii EXECUTIVE SUMMARY... 1 BACKGROUND... 2 SUMMER AND FALL PRECIPITATION...
Wind River Indian Reservation and Surrounding Area Climate and Drought Summary
 Northern Arapaho Tribe Wind River Indian Reservation and Surrounding Area Climate and Drought Summary Summer Events & Fall Outlook 2015 Summer Was Near, Precipitation Was Highly Variable Across The Region
Precipitation. Standardized Precipitation Index. NIDIS Intermountain West Regional Drought Early Warning System January 3, 2017
 1/3/2017 NIDIS Drought and Water Assessment NIDIS Intermountain West Regional Drought Early Warning System January 3, 2017 Precipitation The images above use daily precipitation statistics from NWS COOP,
A GIS-based Approach to Watershed Analysis in Texas Author: Allison Guettner
 Texas A&M University Zachry Department of Civil Engineering CVEN 658 Civil Engineering Applications of GIS Instructor: Dr. Francisco Olivera A GIS-based Approach to Watershed Analysis in Texas Author:
Prediction of Snow Water Equivalent in the Snake River Basin
 Hobbs et al. Seasonal Forecasting 1 Jon Hobbs Steve Guimond Nate Snook Meteorology 455 Seasonal Forecasting Prediction of Snow Water Equivalent in the Snake River Basin Abstract Mountainous regions of
Wind River Indian Reservation and Surrounding Area Climate and Drought Summary
 Northern Arapaho Tribe Wind River Indian Reservation and Surrounding Area Climate and Drought Summary Winter Events & Spring Outlook 2015-2016 Winter Was Warm And Dry Winter was warm and dry for the Wind
NIDIS Intermountain West Drought Early Warning System November 21, 2017
 NIDIS Drought and Water Assessment NIDIS Intermountain West Drought Early Warning System November 21, 2017 Precipitation The images above use daily precipitation statistics from NWS COOP, CoCoRaHS, and
2. PHYSICAL SETTING FINAL GROUNDWATER MANAGEMENT PLAN. 2.1 Topography. 2.2 Climate
 FINAL GROUNDWATER MANAGEMENT PLAN 2. PHYSICAL SETTING Lassen County is a topographically diverse area at the confluence of the Cascade Range, Modoc Plateau, Sierra Nevada and Basin and Range geologic provinces.
NIDIS Intermountain West Drought Early Warning System March 26, 2019
 NIDIS Intermountain West Drought Early Warning System March 26, 2019 The images above use daily precipitation statistics from NWS COOP, CoCoRaHS, and CoAgMet stations. From top to bottom, and left to right:
The hydrologic service area (HSA) for this office covers Central Kentucky and South Central Indiana.
 for this office covers Central Kentucky and South Central Indiana.") MONTH YEAR January 2011 February 15, 2011 X An X inside this box indicates that no flooding occurred within this hydrologic service area. January 2011 was drier than normal in all locations in the area.
MONTH YEAR January 2011 February 15, 2011 X An X inside this box indicates that no flooding occurred within this hydrologic service area. January 2011 was drier than normal in all locations in the area.
Wind River Indian Reservation and Surrounding Area Climate and Drought Summary
 Northern Arapaho Tribe Wind River Indian Reservation and Surrounding Area Climate and Drought Summary Fall Events & Winter Outlook 2016-2017 Warm And Wet Fall The fall season was warm and very wet throughout
Rainfall Observations in the Loxahatchee River Watershed
 Rainfall Observations in the Loxahatchee River Watershed Richard C. Dent Loxahatchee River District September 1997 Introduction Rain is a common occurrence in south Florida, yet its presence or absence
NIDIS Intermountain West Drought Early Warning System May 1, 2018
 NIDIS Intermountain West Drought Early Warning System May 1, 2018 Precipitation The images above use daily precipitation statistics from NWS COOP, CoCoRaHS, and CoAgMet stations. From top to bottom, and
Natural Variability in Annual Maximum Water Level and Outflow of Yellowstone Lake
 Natural Variability in Annual Maximum Water Level and Outflow of Yellowstone Lake Phillip E. Farnes Abstract The water level in Yellowstone Lake varies each year in response to differences in the winter
HYDROLOGIC AND WATER RESOURCES EVALUATIONS FOR SG. LUI WATERSHED
 HYDROLOGIC AND WATER RESOURCES EVALUATIONS FOR SG. LUI WATERSHED 1.0 Introduction The Sg. Lui watershed is the upper part of Langat River Basin, in the state of Selangor which located approximately 20
Chiang Rai Province CC Threat overview AAS1109 Mekong ARCC
 Chiang Rai Province CC Threat overview AAS1109 Mekong ARCC This threat overview relies on projections of future climate change in the Mekong Basin for the period 2045-2069 compared to a baseline of 1980-2005.
TRINITY COUNTY. Board Item Request Form Phone
 County Contract No. Department Board of Supervisors TRINITY COUNTY 6.01 Board Item Request Form 2014-08-12 Contact Judy Pflueger Phone 623-1217 Requested Agenda Location County Matters Requested Board
Quenching the Valley s thirst: The connection between Sierra Nevada snowpack & regional water supply
 Quenching the Valley s thirst: The connection between Sierra Nevada snowpack & regional water supply Roger Bales, UC Merced Snow conditions Snow & climate change Research directions Sierra Nevada snow
May 2016 Volume 23 Number 5
 The Weather Wire May 2016 Volume 23 Number 5 Contents: Winter Summary Current Colorado and West-wide Snow Pack Drought Monitor April Summary/Statistics May Preview Snowfall Totals Winter Summary The Front
NWS FORM E-5 U.S. DEPARTMENT OF COMMERCE I HYDRO SERVICE AREA NOAA, NATIONAL WEATHER SERVICE I Indianapolis, IN MONTHLY REPORT
 NWS FORM E-5 U.S. DEPARTMENT OF COMMERCE I HYDRO SERVICE AREA NOAA, NATIONAL WEATHER SERVICE I Indianapolis, IN. 1-------------------- MONTHLY REPORT OF RIVER AND FLOOD CONDITIONSI REPORT FOR I November
NIDIS Intermountain West Drought Early Warning System February 6, 2018
 NIDIS Intermountain West Drought Early Warning System February 6, 2018 Precipitation The images above use daily precipitation statistics from NWS COOP, CoCoRaHS, and CoAgMet stations. From top to bottom,
Monthly Long Range Weather Commentary Issued: APRIL 25, 2016 Steven A. Root, CCM, Chief Analytics Officer, Sr. VP, sales
 Monthly Long Range Weather Commentary Issued: APRIL 25, 2016 Steven A. Root, CCM, Chief Analytics Officer, Sr. VP, sales sroot@weatherbank.com MARCH 2016 Climate Highlights The Month in Review The March
Climate Change and Water Supply Research. Drought Response Workshop October 8, 2013
 Climate Change and Water Supply Research Drought Response Workshop October 8, 2013 DWR Photo Oroville Reservoir, 2009 Talk Overview Expectations History Atmospheric Rivers and Water Supply Current Research
Climate Change Impact on Air Temperature, Daily Temperature Range, Growing Degree Days, and Spring and Fall Frost Dates In Nebraska
 EXTENSION Know how. Know now. Climate Change Impact on Air Temperature, Daily Temperature Range, Growing Degree Days, and Spring and Fall Frost Dates In Nebraska EC715 Kari E. Skaggs, Research Associate
NIDIS Intermountain West Drought Early Warning System December 18, 2018
 NIDIS Intermountain West Drought Early Warning System December 18, 2018 Precipitation The images above use daily precipitation statistics from NWS COOP, CoCoRaHS, and CoAgMet stations. From top to bottom,
February 10, Mr. Jeff Smith, Chairman Imperial Valley Water Authority E County Road 1000 N Easton, IL Dear Chairman Smith:
 February 1, 1 Mr. Jeff Smith, Chairman Imperial Valley Water Authority 8 E County Road 1 N Easton, IL Dear Chairman Smith: The Illinois State Water Survey (ISWS), under contract to the Imperial Valley
Webinar and Weekly Summary February 15th, 2011
 Webinar and Weekly Summary February 15th, 2011 -Assessment of current water conditions - Precipitation Forecast - Recommendations for Drought Monitor Upper Colorado Normal Precipitation Upper Colorado
NIDIS Weekly Climate, Water and Drought Assessment Summary. Upper Colorado River Basin June 21, 2011
 NIDIS Weekly Climate, Water and Drought Assessment Summary Upper Colorado River Basin June 21, 2011 PrecipitaEon and Snowpack Fig. 1: June month to date precipitaeon in inches. Fig. 2: 24 hour accumulated
Climatic Change Implications for Hydrologic Systems in the Sierra Nevada
 Climatic Change Implications for Hydrologic Systems in the Sierra Nevada Part Two: The HSPF Model: Basis For Watershed Yield Calculator Part two presents an an overview of why the hydrologic yield calculator
Weather and Climate Summary and Forecast Winter
 Weather and Climate Summary and Forecast Winter 2016-17 Gregory V. Jones Southern Oregon University February 7, 2017 What a difference from last year at this time. Temperatures in January and February
Great Lakes Update. Volume 193: 2015 January through June Summary. Vol. 193 Great Lakes Update August 2015
 Great Lakes Update Volume 193: 2015 January through June Summary The U.S. Army Corps of Engineers (USACE) monitors the water levels of each of the Great Lakes. This report provides a summary of the Great
PRELIMINARY DRAFT FOR DISCUSSION PURPOSES
 Memorandum To: David Thompson From: John Haapala CC: Dan McDonald Bob Montgomery Date: February 24, 2003 File #: 1003551 Re: Lake Wenatchee Historic Water Levels, Operation Model, and Flood Operation This
Highlights of the 2006 Water Year in Colorado
 Highlights of the 2006 Water Year in Colorado Nolan Doesken, State Climatologist Atmospheric Science Department Colorado State University http://ccc.atmos.colostate.edu Presented to 61 st Annual Meeting
Sierra Nevada Hydroclimatology: An Experimental Prediction of Maximum Daily Snowmelt Discharge in 2005
 Sierra Nevada Hydroclimatology: An Experimental Prediction of Maximum Daily Snowmelt Discharge in 2005 David Peterson, Jessica Lundquist, Iris Stewart, Noah Knowles, Madeline Solomon and Stephen Hager
Valenciano Reservoir Safe Yield Study. Prepared by: CSA Architects & Engineers, LLP
 Valenciano Reservoir Safe Yield Study Prepared by: CSA Architects & Engineers, LLP CSA Group Prepared for: Puerto Rico Aqueduct and Sewer Authority Planning TABLE OF CONTENTS 1 Introduction...1 1.1 Safe
NIDIS Intermountain West Drought Early Warning System November 13, 2018
 NIDIS Intermountain West Drought Early Warning System November 13, 2018 Precipitation The images above use daily precipitation statistics from NWS COOP, CoCoRaHS, and CoAgMet stations. From top to bottom,
Arizona Climate Summary February 2012
 Arizona Climate Summary February 2012 Summary of conditions for January 2012 January 2012 Temperature and Precipitation Summary January 1 st 20 th : The New Year has started on a very dry note. The La
NIDIS Intermountain West Drought Early Warning System February 12, 2019
 NIDIS Intermountain West Drought Early Warning System February 12, 2019 Precipitation The images above use daily precipitation statistics from NWS COOP, CoCoRaHS, and CoAgMet stations. From top to bottom,
Wind River Indian Reservation and Surrounding Area Climate and Drought Summary
 Northern Arapaho Tribe Wind River Indian Reservation and Surrounding Area Climate and Drought Summary Winter Events & Spring Outlook 2016-2017 Cool Temperatures and Record-Breaking Wetness During Winter
NIDIS Intermountain West Drought Early Warning System December 11, 2018
 NIDIS Drought and Water Assessment NIDIS Intermountain West Drought Early Warning System December 11, 2018 Precipitation The images above use daily precipitation statistics from NWS COOP, CoCoRaHS, and
PHYSICAL PROPERTIES TAHOE.UCDAVIS.EDU 8
 PHYSICAL PROPERTIES 8 Lake surface level Daily since 1900 Lake surface level varies throughout the year. Lake level rises due to high stream inflow, groundwater inflow, and precipitation directly onto
Drought History. for Southeast Oklahoma. Prepared by the South Central Climate Science Center in Norman, Oklahoma
 Drought History for Southeast Oklahoma Prepared by the South Central Climate Science Center in Norman, Oklahoma May 28, 2013 http://southcentralclimate.org/ info@southcentralclimate.org (This page left
NIDIS Intermountain West Drought Early Warning System November 14, 2017
 NIDIS Intermountain West Drought Early Warning System November 14, 2017 Precipitation The images above use daily precipitation statistics from NWS COOP, CoCoRaHS, and CoAgMet stations. From top to bottom,
Great Lakes Update. Volume 188: 2012 Annual Summary
 Great Lakes Update Volume 188: 2012 Annual Summary Background The U.S. Army Corps of Engineers (USACE) tracks the water levels of each of the Great Lakes. This report highlights hydrologic conditions of
The hydrologic service area (HSA) for this office covers Central Kentucky and South Central Indiana.
 for this office covers Central Kentucky and South Central Indiana.") NWS Form E-5 (04-2006) NATIONAL OCEANIC AND ATMOSPHERIC ADMINISTRATION (PRES. BY NWS Instruction 10-924) NATIONAL WEATHER SERVICE MONTHLY REPORT OF HYDROLOGIC CONDITIONS HYDROLOGIC SERVICE AREA (HSA) Louisville
NWS Form E-5 (04-2006) NATIONAL OCEANIC AND ATMOSPHERIC ADMINISTRATION (PRES. BY NWS Instruction 10-924) NATIONAL WEATHER SERVICE MONTHLY REPORT OF HYDROLOGIC CONDITIONS HYDROLOGIC SERVICE AREA (HSA) Louisville
Monthly Long Range Weather Commentary Issued: May 15, 2014 Steven A. Root, CCM, President/CEO
 Monthly Long Range Weather Commentary Issued: May 15, 2014 Steven A. Root, CCM, President/CEO sroot@weatherbank.com APRIL 2014 REVIEW Climate Highlights The Month in Review The average temperature for
Missouri River Basin Water Management Monthly Update
 Missouri River Basin Water Management Monthly Update Participating Agencies 255 255 255 237 237 237 0 0 0 217 217 217 163 163 163 200 200 200 131 132 122 239 65 53 80 119 27 National Oceanic and Atmospheric
PRECIPITATION. Last Week Precipitation:
 2/24/2015 NIDIS Drought and Water Assessment PRECIPITATION The images above use daily precipitation statistics from NWS COOP, CoCoRaHS, and CoAgMet stations. From top to bottom, and left to right: most
GIS in Water Resources Exercise #4 Solution Prepared by Irene Garousi-Nejad and David Tarboton
 GIS in Water Resources Exercise 4 Solution Prepared by Irene Garousi-Nejad and David Tarboton 1. Cell length (N-S) in m, width (E-W) in m, area in m 2 for the DEM cells in the merged DEM. N-S y = R e φ
NIDIS Intermountain West Drought Early Warning System October 30, 2018
 10/30/2018 NIDIS Drought and Water Assessment NIDIS Intermountain West Drought Early Warning System October 30, 2018 Precipitation The images above use daily precipitation statistics from NWS COOP, CoCoRaHS,
A GEOGRAPHIC ASSESSMENT OF MAJOR DISASTER DECLARATIONS ACROSS THE LOWER 48 STATES
 A GEOGRAPHIC ASSESSMENT OF MAJOR DISASTER DECLARATIONS ACROSS THE LOWER 48 STATES A summary report produced by the Southern Climate Impacts Planning Program (SCIPP) Author: James Hocker Southern Climate
Hydrologic Forecast Centre Manitoba Infrastructure, Winnipeg, Manitoba. MARCH OUTLOOK REPORT FOR MANITOBA March 23, 2018
 Page 1 of 21 Hydrologic Forecast Centre Manitoba Infrastructure, Winnipeg, Manitoba MARCH OUTLOOK REPORT FOR MANITOBA March 23, 2018 Overview The March Outlook Report prepared by the Hydrologic Forecast
A Review of the 2007 Water Year in Colorado
 A Review of the 2007 Water Year in Colorado Nolan Doesken Colorado Climate Center, CSU Mike Gillespie Snow Survey Division, USDA, NRCS Presented at the 28 th Annual AGU Hydrology Days, March 26, 2008,
Presentation Overview. Southwestern Climate: Past, present and future. Global Energy Balance. What is climate?
 Southwestern Climate: Past, present and future Mike Crimmins Climate Science Extension Specialist Dept. of Soil, Water, & Env. Science & Arizona Cooperative Extension The University of Arizona Presentation
Precipitation. Standardized Precipitation Index. NIDIS Intermountain West Drought Early Warning System September 5, 2017
 9/6/2017 NIDIS Drought and Water Assessment NIDIS Intermountain West Drought Early Warning System September 5, 2017 Precipitation The images above use daily precipitation statistics from NWS COOP, CoCoRaHS,