Microwave, portable FMCW radar: a tool for measuring snow depth, stratigraphy, and snow water equivalent
|
|
|
- Randolph Quinn
- 6 years ago
- Views:
Transcription


1 Microwave, portable FMCW radar: a tool for measuring snow depth, stratigraphy, and snow water equivalent Hans-Peter Marshall CGISS, Boise State University U.S. Army Cold Regions Research and Engineering Laboratory Snow Characterization Workshop, April 13-15,

 I/II ESA CryoSat")
2 Acknowledgements NASA Energy and Water Cycle Sponsored (NEWS) Research and Terrestrial Hydrology NASA Earth Systems Science Fellowship NSF Arctic Sciences NSF K-12 Engineering Outreach Fellowship NASA AMSR-Ice06 calibration/validation NASA Cold Lands Processes Experiment (CLPX) I/II ESA CryoSat calibration/validation 2
3 Outline Motivation - why microwave radar for snow? Brief FMCW radar overview Stationary FMCW measurements Spatial snow stratigraphy/depth measurements on alpine snow, polar firn, sea ice Snow depth measurements with highly portable system in 1st order basin Conclusions Future Work 3

4 Snow Water Equivalent (SWE) Sensitive climate change indicator Vital component of water cycle Effects global energy balance Estimates needed for water resource management, flood forecasting, prediction of available hydropower energy =? 4
5 But very difficult to estimate SWE at regional scales Can vary by more than 50% in 10 meters [Shook and Gray, 1996] Standard deviations of 65-80% of basin mean are typical [Marchand and Killingtveit, 2005] Manual measurements extremely time consuming (~1 hr for standard snowpit) 5

6 Less than 3 SNOTEL sites in most watersheds 6


7 Remote Sensing of Snow Daily to monthly repeat cycles Global coverage 7


8 But interpretation of remote sensing measurements is complex Large sub-footprint variability ground truth measurements difficult Narrowband measurements integrate over entire depth of snowpack Sensitivity to grain-size and stratigraphy Currently can map snowcover extent, but no operational SWE algorithms exist for active radar 8


9 Motivation Ground truth for remote sensing Rapidly characterize spatial distribution and structure of snow Link manual point measurements Provide framework for accurate estimates of total SWE at basin scale and remote sensing footprints 9

 Scaled laboratory")
10 Glaciology High res. measurements in near-surface firn spatial variability of annual accumulation link shallow cores/ neutron probe/snowpits Remote sensing ground-truth (CryoSat) Scaled laboratory measurements to study meltwater pathways in glaciers 10


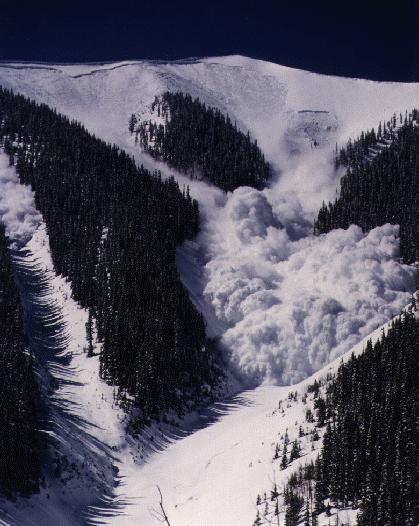
11 Snow avalanche layer thickness spatial variability of stratigraphy/storm snowfall geometry of a slab 11
 and deep")

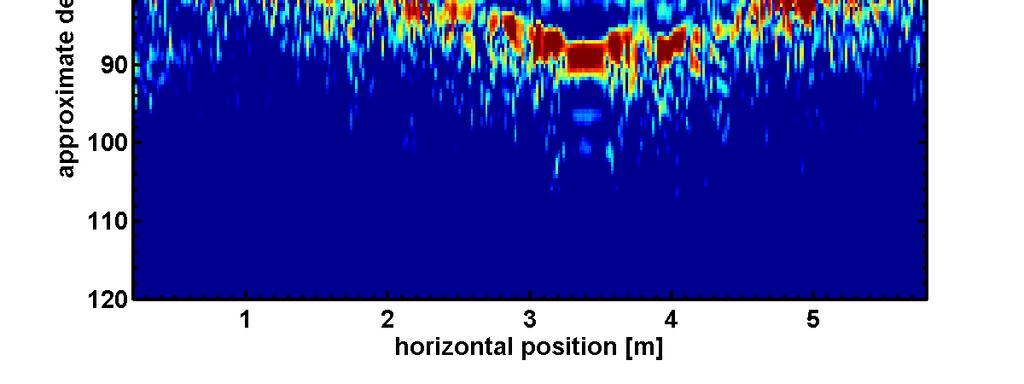
12 Antarctic radar Spatial/temporal distribution of accumulation rate link to shallow (15m) and deep (800m+) cores ice depth, + GPS -> bed topography Disturbed layers infer past location of ice streams 12
 Microwave (GHz) frequencies allow small, lightweight, directional antennas All active remote sensing measurements in")

13 FMCW radar for snow studies Instead of 1-10 MHz for ice, GHz frequencies are optimal for near surface (1-3m) snow, for maximum vertical resolution (1 cm) Microwave (GHz) frequencies allow small, lightweight, directional antennas All active remote sensing measurements in GHz range Microwave radar studies in snow since 1980 s [e.g. Ellerbruch and Boyne, 1980; Gubler and Hiller, 1984; Fujino et al., 1985; Holmgren et al., 1998; Kanagaratnam et al., 2001; Gogineni et al, 2003; Yankielun et al., 2004] See [Marshall and Koh, CRST, 2008] for a review 13


14 Melt Pathways Albert, M.A., G. Koh and F. Perron, Radar investigations of melt pathways in a natural snowpack. Hydrological Processes (13):

15 Other Applications: Lake Ice Thickness 15
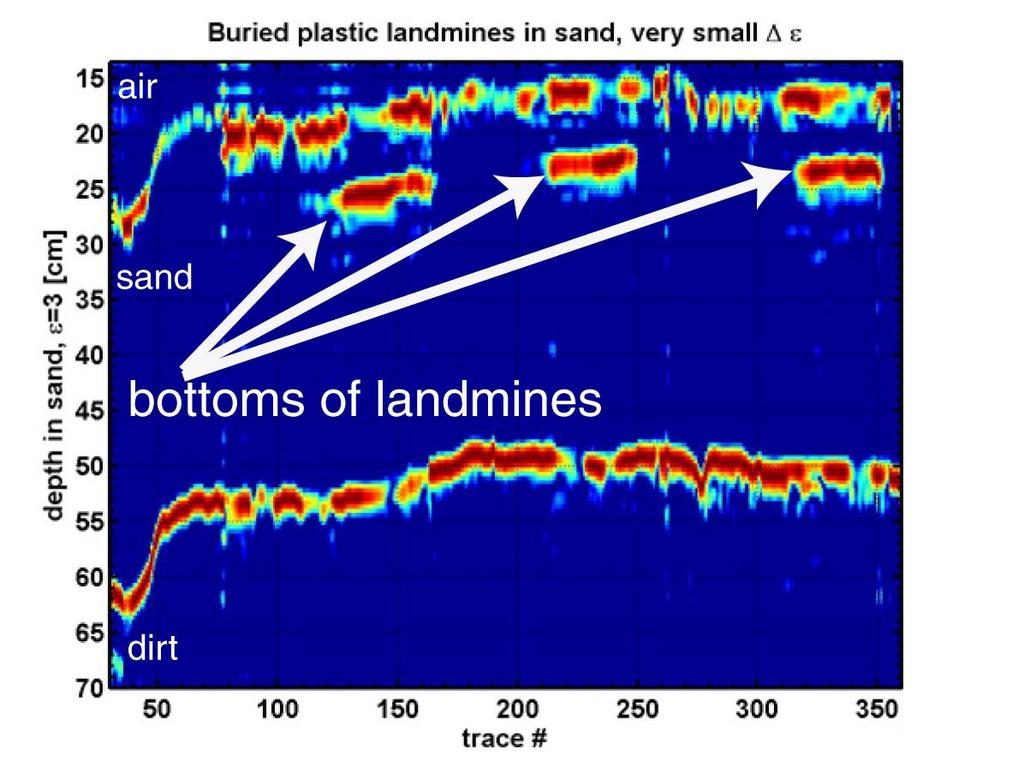
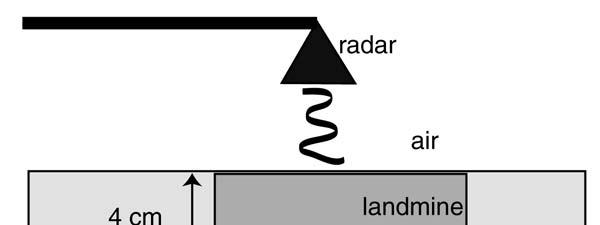
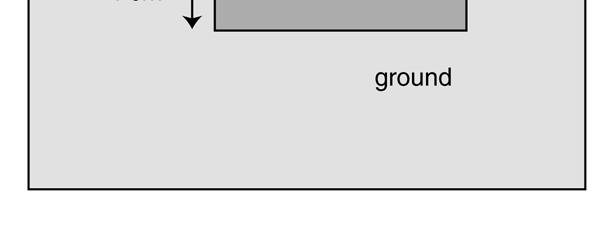
16 Other Applications: Landmine Detection 16
17 Other Applications: Landmine Detection 17
18 Linear frequency chirp transmitted (T) Received signal (R) also linear in frequency, offset by two-way travel time Frequency difference between T and R linearly related to the distance to target FMCW Theory 1) Multiply T*R 2) FFT -> find frequency differences df 3) df is proportional to travel time 18
19 High frequencies are more sensitive to subtle transitions: 19
20 High frequencies are more sensitive to subtle transitions: 20

21 High frequencies are more sensitive to subtle transitions: 21
22 But are rapidly attenuated if snowpack is wet 22
23 But are rapidly attenuated if snowpack is wet 23
24 But are rapidly attenuated if snowpack is wet 24
25 Resolution is limited by bandwidth c Δ z = 2B ε B = 1 GHz, Δz 12.5cm B = 4 GHz, Δz 3.1cm B = 8 GHz, Δz 1.5cm 25

26 Development of a Portable FMCW Radar Old radar ~350 lbs, 1 hr+ setup time Stationary, sweep ~2 m arc Extensive post-processing required, little information in field New radar <20 lbs, 10 min setup time Improved signal processing, sensitivity, resolution User-friendly MATLAB-based data acquisition software, real-time processing 20 complete radar profiles/sec Easily operated by 2 skiers 26

27 High Sensitivity (0-4 cm snow, cm SWE) 27
28 Low Variability 28
29 High Variability 29

30 Heavily Forested Site 30
31 Wind Effected Site 31
32 Spatial Variability Measurement is Repeatable 32
 has recently resulted in snow depth/swe data, covering km scales, at orders of magnitude higher resolution (10")
33 High resolution data on snow accumulation patterns is limited Standard methods are time consuming : ruler and density cutter New technology (LiDAR, radar) has recently resulted in snow depth/swe data, covering km scales, at orders of magnitude higher resolution (10 cm 1 m) 33
34 Quantifying Spatial Variability Compare values at different spacings, or lags Calculate average squared difference BUT: need ~150 pairs for accurate estimate [Webster and Oliver, 2001] 34
35 Quantifying Spatial Variability Generalized relative semi-variogram γ GR N 1 = 2N i= 1 ( u v ) i m 2 i 2 But plot: F = 100 2γ GR If F=50 at some separation, then on average, measurements separated by that distance vary by 50% 35
36 Theoretical Variogram Model 36

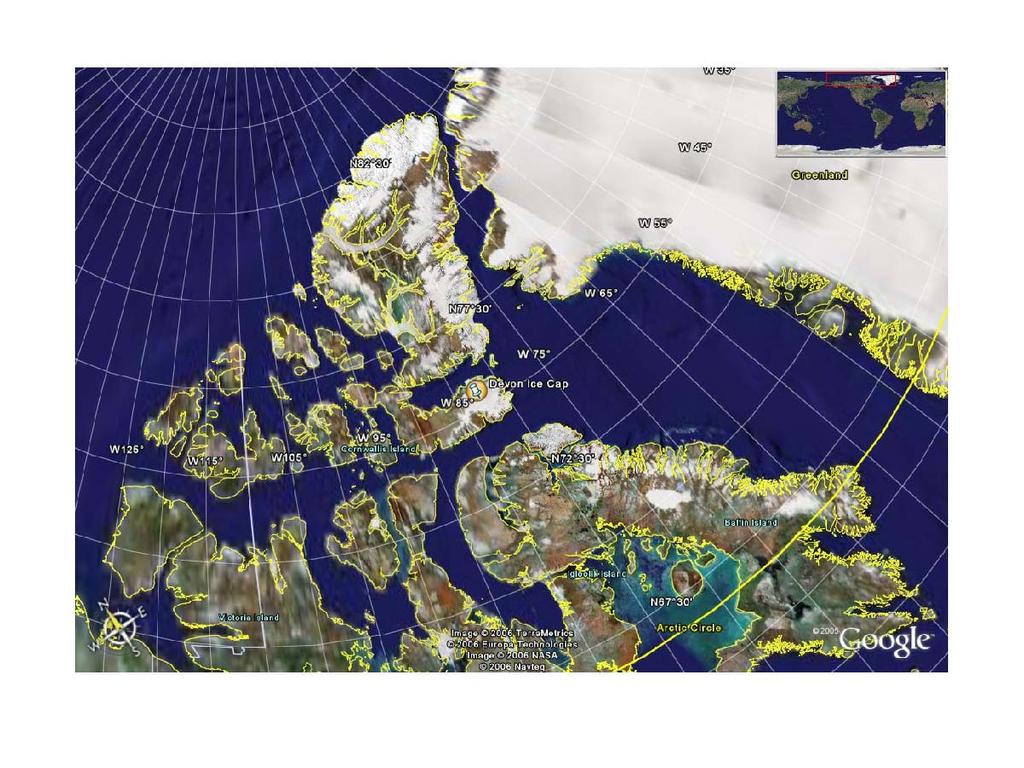
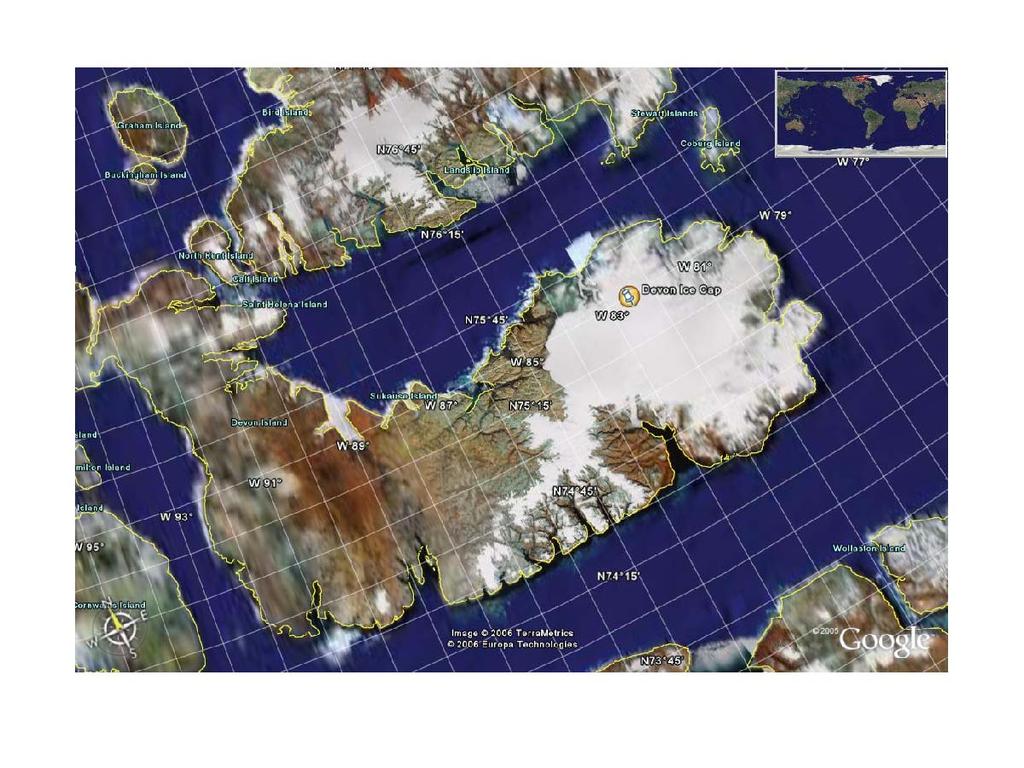
37 Effect of spatial structure NO SPATIAL STRUCTURE Constant mean, standard deviation 37

38 Effect of spatial structure MODERATE SPATIAL STRUCTURE Constant mean, standard deviation 38

39 Effect of spatial structure HIGH SPATIAL STRUCTURE Constant mean, standard deviation 39

40 LiDAR snow depth fractal analysis results 1.5 m resolution, 1km x 1km study areas Scale break in variogram meters, depending on environment [Deems et al, 2006] Scale break in power spectra 7-45m [Trullijo et al, 2007] Semivariance Buffalo Pass Walton Creek Alpine D = 2.48 D = 2.47 D = D = 2.91 D = 2.97 D = Distance (m)

41 Study sites 41
42 42

43 43

44 Barrow, Alaska 1) Variability controlled entirely by wind 2) Measurements made on 1 st year sea ice, so no small or large scale topography, no vegetation 44
45 Barrow, Alaska 1) Very similar range with 2 different instruments, good agreement with previous studies in alpine snow above treeline [Deems et al., 2006] 2) Magna probe shows more variability due to different support (1 cm vs 50 cm) 45
46 46
47 47
48 48


49 Devon Ice Cap, Canadian Arctic 1) Variability controlled by wind and smallscale topography (sastrugi) 2) Measurements made on ice cap summit; no large-scale topography or vegetation 49
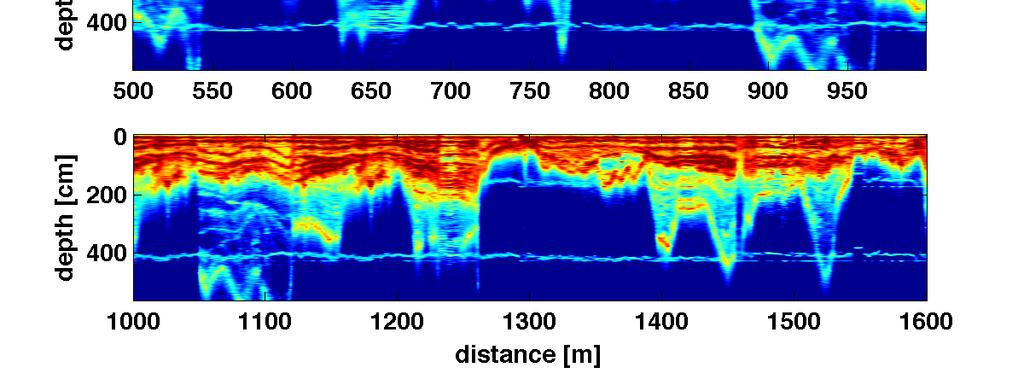
50 Scales of spatial variability in radar signal 1 km 50
51 Scales of spatial variability in radar signal 50 meters 51
52 FMCW radar depths to Fall 04 surface 1) Shorter range compared to Barrow data, due to effect of small scale topography 2) Variability beyond range almost the same as Barrow data FMCW radar layer thickness 3) Note smooth transition in lower figure; lots of spatial structure within m
53 SMP surface hardness 1) Very similar range to hardness measurements in alpine snow [Kronholm and Birkland, 2005] 2) Much greater variability in hardness than layer thickness or depth 53
54 Monte-Carlo simulations along 1km profile (~10,000 total depths) 54
55 Monte-Carlo simulations along 1km profile (~10,000 total depths) 55
56 Monte-Carlo simulations along 1km profile (~10,000 total depths) 56
 57")
57 Monte-Carlo simulations along 1km profile (~10,000 total depths) 57
58 Annual accumulation in polar firn 58
59 Annual accumulation in polar firn 59

60 Annual accumulation in polar firn 60


61 Niwot Ridge, Colorado 1) Variability controlled by wind, small and large scale topography, and vegetation 2) Highly variable snow accumulation 61
62 Niwot Ridge, Colorado 1) Range agrees with previous studies below treeline [Deems et al., 2006] 2) Note that variability beyond range is more than 100% perpendicular to wind, and ~10% parallel to wind FMCW radar snow depths 62
63 Niwot Ridge, Colorado 1) Layer thickness variability shows more than 200% variability > 20 m for deepest layer, ~50% for midpack layer, and ~2 % for uppermost layer FMCW radar snow depths 2) Small scale topography combined with wind was major cause of variability; this effect is damped out for later snowfalls63


64 Senator Beck Basin, San Juan Mountains, Colorado 64

65 Above Treeline 65
66 Above Treeline 66

67 Below Treeline 67

68 Below Treeline 68
69 Conclusions Snow depth variability ranged from less than 5% to more than 200%, depending on environment Layer thickness variability ranged from less than 2% to more than 200% Variogram ranges agree well with previous studies Mechanical properties varied much more than layer thickness and snow depth Point measurements varied much more than radar measurements due to difference in support 69

![Clemo, 2002, WRR] Subdivide basin into](/docs-images/73/69393621/images/70-2.jpg "regions/zones with similar")
70 Future Work quantifying spatial structure of snow Hierarchical geostatistics: [Barrash and Clemo, 2002, WRR] Subdivide basin into regions/zones with similar means/variances/spatial structure 70
71 Future Work estimating basin-wide SWE Ensemble stochastic simulation, optimizing solution for fit to both data and semi-variance [Johnson, Routh, Clemo, Barrash, Clement, 2007, WRR] χ = (SWE pred SWE obs ) 2 + β(γ pred γ obs ) 2 1) Determine uncertainty in basin-wide SWE estimates 2) Study optimal radar sampling patterns 3) Study minimal manual sampling patterns 4) Assimilate subsets of data into snow hydrology model - effect on accuracy of streamflow? 71
72 Future Work Use radar as tool to perform high resolution snow depth / SWE estimates for studying: Optimum snow radar sampling strategies Interpolation/extrapolation techniques in different environments Snow distribution models Scales from 0.01 m 10,000 m for remote sensing and snow hydrological modeling calibration / validation 72
HELICOPTER-BASED MICROWAVE RADAR MEASUREMENTS IN ALPINE TERRAIN
 HELICOPTER-BASED MICROWAVE RADAR MEASUREMENTS IN ALPINE TERRAIN Hans-Peter Marshall, 1,2, * Karl Birkeland, 3,4 Kelly Elder, 5 Theo Meiners 6 1 Center for Geophysical Investigation of the Shallow Subsurface,
Snow Depth Measurements using Ground-Based FMCW Radar Measurements Of Dry Snowpacks During December Of The NASA CLPX-II
 64 th EASTERN SNOW CONFERENCE St. Johns, Newfoundland, Canada 2007 Snow Depth Measurements using Ground-Based FMCW Radar Measurements Of Dry Snowpacks During December Of The 2006-07 NASA CLPX-II HANS-PETER
High resolution ground-based snow measurements during the NASA CLPX-II campaign, North Slope, Alaska
 High resolution ground-based snow measurements during the NASA CLPX-II campaign, North Slope, Alaska H.P. Marshall1, N. Rutter2, K. Tape3, M. Sturm4, R. Essery5 1 Boise State University, Department of
Novel Snotel Data Uses: Detecting Change in Snowpack Development Controls, and Remote Basin Snow Depth Modeling
 Novel Snotel Data Uses: Detecting Change in Snowpack Development Controls, and Remote Basin Snow Depth Modeling OVERVIEW Mark Losleben and Tyler Erickson INSTAAR, University of Colorado Mountain Research
THE ROLE OF MICROSTRUCTURE IN FORWARD MODELING AND DATA ASSIMILATION SCHEMES: A CASE STUDY IN THE KERN RIVER, SIERRA NEVADA, USA
 MICHAEL DURAND (DURAND.8@OSU.EDU), DONGYUE LI, STEVE MARGULIS Photo: Danielle Perrot THE ROLE OF MICROSTRUCTURE IN FORWARD MODELING AND DATA ASSIMILATION SCHEMES: A CASE STUDY IN THE KERN RIVER, SIERRA
Remote Sensing of SWE in Canada
 Remote Sensing of SWE in Canada Anne Walker Climate Research Division, Environment Canada Polar Snowfall Hydrology Mission Workshop, June 26-28, 2007 Satellite Remote Sensing Snow Cover Optical -- Snow
Dual-Frequency Ku- Band Radar Mission Concept for Snow Mass
 Dual-Frequency Ku- Band Radar Mission Concept for Snow Mass Chris Derksen Environment and Climate Change Canada Study Team: Climate Research Division/Meteorological Research Division, ECCC Canadian Space
THESIS SPATIAL ACCUMULATION PATTERNS OF SNOW WATER EQUIVALENT IN THE SOUTHERN ROCKY MOUNTAINS. Submitted by. Benjamin C.
 THESIS SPATIAL ACCUMULATION PATTERNS OF SNOW WATER EQUIVALENT IN THE SOUTHERN ROCKY MOUNTAINS Submitted by Benjamin C. Von Thaden Department of Ecosystem Science and Sustainability In partial fulfillment
ASimultaneousRadiometricand Gravimetric Framework
 Towards Multisensor Snow Assimilation: ASimultaneousRadiometricand Gravimetric Framework Assistant Professor, University of Maryland Department of Civil and Environmental Engineering September 8 th, 2014
Terrestrial Snow Cover: Properties, Trends, and Feedbacks. Chris Derksen Climate Research Division, ECCC
 Terrestrial Snow Cover: Properties, Trends, and Feedbacks Chris Derksen Climate Research Division, ECCC Outline Three Snow Lectures: 1. Why you should care about snow: Snow and the cryosphere Classes of
Observing Snow: Conventional Measurements, Satellite and Airborne Remote Sensing. Chris Derksen Climate Research Division, ECCC
 Observing Snow: Conventional Measurements, Satellite and Airborne Remote Sensing Chris Derksen Climate Research Division, ECCC Outline Three Snow Lectures: 1. Why you should care about snow 2. How we measure
RED DUST SNOWFALL EVENT FEBRUARY 15, OVERVIEW and RELATED RESEARCH at NIWOT RIDGE, COLORADO
 RED DUST SNOWFALL EVENT FEBRUARY 15, 2006 OVERVIEW and RELATED RESEARCH at NIWOT RIDGE, COLORADO MARK LOSLEBEN, THOMAS PAINTER, ALLEN TOWNSEND, KURT CHOWANSKI, LUCAS ZUKIEWICZ OUTLINE Event Origin/Synoptic
An Evaluation of Seeding Effectiveness in the Central Colorado Mountains River Basins Weather Modification Program
 2016, UCAR. All rights reserved. An Evaluation of Seeding Effectiveness in the Central Colorado Mountains River Basins Weather Modification Program for Grand River Consulting Sponsors: Colorado Water Conservation
Canadian Prairie Snow Cover Variability
 Canadian Prairie Snow Cover Variability Chris Derksen, Ross Brown, Murray MacKay, Anne Walker Climate Research Division Environment Canada Ongoing Activities: Snow Cover Variability and Links to Atmospheric
How do glaciers form?
 Glaciers What is a Glacier? A large mass of moving ice that exists year round is called a glacier. Glaciers are formed when snowfall exceeds snow melt year after year Snow and ice remain on the ground
The Canadian Land Data Assimilation System (CaLDAS)
") The Canadian Land Data Assimilation System (CaLDAS) Marco L. Carrera, Stéphane Bélair, Bernard Bilodeau and Sheena Solomon Meteorological Research Division, Environment Canada Dorval, QC, Canada 2 nd Workshop
The Canadian Land Data Assimilation System (CaLDAS) Marco L. Carrera, Stéphane Bélair, Bernard Bilodeau and Sheena Solomon Meteorological Research Division, Environment Canada Dorval, QC, Canada 2 nd Workshop
CLIMATE CHANGE AND REGIONAL HYDROLOGY ACROSS THE NORTHEAST US: Evidence of Changes, Model Projections, and Remote Sensing Approaches
 CLIMATE CHANGE AND REGIONAL HYDROLOGY ACROSS THE NORTHEAST US: Evidence of Changes, Model Projections, and Remote Sensing Approaches Michael A. Rawlins Dept of Geosciences University of Massachusetts OUTLINE
Flood Forecasting Tools for Ungauged Streams in Alberta: Status and Lessons from the Flood of 2013
 Flood Forecasting Tools for Ungauged Streams in Alberta: Status and Lessons from the Flood of 2013 John Pomeroy, Xing Fang, Kevin Shook, Tom Brown Centre for Hydrology, University of Saskatchewan, Saskatoon
Airborne Measurement of Snow Thickness Over Sea Ice
 Airborne Measurement of Snow Thickness Over Sea Ice Uniquiea B. Wade Elizabeth City State University Elizabeth City, North Carolina 27909 Abstract Snow cover on sea ice plays an important role in the climate
Observations of Arctic snow and sea ice thickness from satellite and airborne surveys. Nathan Kurtz NASA Goddard Space Flight Center
 Observations of Arctic snow and sea ice thickness from satellite and airborne surveys Nathan Kurtz NASA Goddard Space Flight Center Decline in Arctic sea ice thickness and volume Kwok et al. (2009) Submarine
P. Marsh and J. Pomeroy National Hydrology Research Institute 11 Innovation Blvd., Saskatoon, Sask. S7N 3H5
 WATER AND ENERGY FLUXES DURING THE SNOWMELT PERIOD AT AN ARCTIC TREELINE SITE P. Marsh and J. Pomeroy National Hydrology Research Institute 11 Innovation Blvd., Saskatoon, Sask. S7N 3H5 marshp@nhrisv.nhrc.skdoe.ca
MODIS True Color Terra image from from NASA WorldView (worldview.earthdata.nasa.gov)
") Estimating the snowpack with remote sensing MODIS True Color Terra image from 2016-09-07 from NASA WorldView (worldview.earthdata.nasa.gov) Edward (Ned) Bair, Ph.D. Earth Research Institute, University
Estimating the snowpack with remote sensing MODIS True Color Terra image from 2016-09-07 from NASA WorldView (worldview.earthdata.nasa.gov) Edward (Ned) Bair, Ph.D. Earth Research Institute, University
Remote sensing with FAAM to evaluate model performance
 Remote sensing with FAAM to evaluate model performance YOPP-UK Workshop Chawn Harlow, Exeter 10 November 2015 Contents This presentation covers the following areas Introduce myself Focus of radiation research
WRF Historical and PGW Simulations over Alaska
 WRF Historical and PGW Simulations over Alaska Andrew J. Newman 1, Andrew J. Monaghan 2, Martyn P. Clark 1, Kyoko Ikeda 1, Lulin Xue 1, and Jeff R. Arnold 3 GEWEX CPCM Workshop II 1 National Center for
Passive Microwave Physics & Basics. Edward Kim NASA/GSFC
 Passive Microwave Physics & Basics Edward Kim NASA/GSFC ed.kim@nasa.gov NASA Snow Remote Sensing Workshop, Boulder CO, Aug 14 16, 2013 1 Contents How does passive microwave sensing of snow work? What are
ESTIMATING SNOWMELT CONTRIBUTION FROM THE GANGOTRI GLACIER CATCHMENT INTO THE BHAGIRATHI RIVER, INDIA ABSTRACT INTRODUCTION
 ESTIMATING SNOWMELT CONTRIBUTION FROM THE GANGOTRI GLACIER CATCHMENT INTO THE BHAGIRATHI RIVER, INDIA Rodney M. Chai 1, Leigh A. Stearns 2, C. J. van der Veen 1 ABSTRACT The Bhagirathi River emerges from
Remote Sensing of Snow GEOG 454 / 654
 Remote Sensing of Snow GEOG 454 / 654 What crysopheric questions can RS help to answer? 2 o Where is snow lying? (Snow-covered area or extent) o How much is there? o How rapidly is it melting? (Area, depth,
Validation of satellite derived snow cover data records with surface networks and m ulti-dataset inter-comparisons
 Validation of satellite derived snow cover data records with surface networks and m ulti-dataset inter-comparisons Chris Derksen Climate Research Division Environment Canada Thanks to our data providers:
GLACIOLOGY LAB SNOW Introduction Equipment
 GLACIOLOGY LAB SNOW Introduction The objective of this lab is to achieve a working knowledge of the snowpack. This includes descriptions and genetic analysis of features that can be observed on the surface
Snowcover interaction with climate, topography & vegetation in mountain catchments
 Snowcover interaction with climate, topography & vegetation in mountain catchments DANNY MARKS Northwest Watershed Research Center USDA-Agricultural Agricultural Research Service Boise, Idaho USA RCEW
Meteorological Satellite Image Interpretations, Part III. Acknowledgement: Dr. S. Kidder at Colorado State Univ.
 Meteorological Satellite Image Interpretations, Part III Acknowledgement: Dr. S. Kidder at Colorado State Univ. Dates EAS417 Topics Jan 30 Introduction & Matlab tutorial Feb 1 Satellite orbits & navigation
Global SWE Mapping by Combining Passive and Active Microwave Data: The GlobSnow Approach and CoReH 2 O
 Global SWE Mapping by Combining Passive and Active Microwave Data: The GlobSnow Approach and CoReH 2 O April 28, 2010 J. Pulliainen, J. Lemmetyinen, A. Kontu, M. Takala, K. Luojus, K. Rautiainen, A.N.
Lecture 8: Snow Hydrology
 GEOG415 Lecture 8: Snow Hydrology 8-1 Snow as water resource Snowfall on the mountain ranges is an important source of water in rivers. monthly pcp (mm) 100 50 0 Calgary L. Louise 1 2 3 4 5 6 7 8 9 10
Spectral Albedos. a: dry snow. b: wet new snow. c: melting old snow. a: cold MY ice. b: melting MY ice. d: frozen pond. c: melting FY white ice
 Spectral Albedos a: dry snow b: wet new snow a: cold MY ice c: melting old snow b: melting MY ice d: frozen pond c: melting FY white ice d: melting FY blue ice e: early MY pond e: ageing ponds Extinction
ASO in Colorado: supporting resilient water management through research support & emerging partnerships
 ASO in Colorado: supporting resilient water management through research support & emerging partnerships Jeffrey S. Deems Airborne Snow Observatory Western Water Assessment National Snow and Ice Data Center
The indicator can be used for awareness raising, evaluation of occurred droughts, forecasting future drought risks and management purposes.
 INDICATOR FACT SHEET SSPI: Standardized SnowPack Index Indicator definition The availability of water in rivers, lakes and ground is mainly related to precipitation. However, in the cold climate when precipitation
TEACHER PAGE Trial Version
 TEACHER PAGE Trial Version * After completion of the lesson, please take a moment to fill out the feedback form on our web site (https://www.cresis.ku.edu/education/k-12/online-data-portal)* Lesson Title:
Impacts of snowpack accumulation and summer weather on alpine glacier hydrology
 Impacts of snowpack accumulation and summer weather on alpine glacier hydrology Caroline Aubry-Wake, Dhiraj Pradhananga, John W. Pomeroy GEWEX 8 th Open Science Meeting, Canmore AB, May 3-11 2018 Canadian
Reclamation Perspective on Operational Snow Data and Needs. Snowpack Monitoring for Streamflow Forecasting and Drought Planning August 11, 2015
 Reclamation Perspective on Operational Snow Data and Needs Snowpack Monitoring for Streamflow Forecasting and Drought Planning August 11, 2015 2 Reclamation Operational Modeling 3 Colorado Basin-wide Models
Snow Data Assimilation
 Snow Data Assimilation Andrew G. Slater 1 and Martyn P. Clark 2 1 National Snow & Ice Data Centre (NSIDC), University of Colorado 2 National Institute of Water and Atmospheric Research (NIWA), New Zealand
ECMWF. ECMWF Land Surface Analysis: Current status and developments. P. de Rosnay M. Drusch, K. Scipal, D. Vasiljevic G. Balsamo, J.
 Land Surface Analysis: Current status and developments P. de Rosnay M. Drusch, K. Scipal, D. Vasiljevic G. Balsamo, J. Muñoz Sabater 2 nd Workshop on Remote Sensing and Modeling of Surface Properties,
Snow, Snowpacks and Runoff. David G Tarboton Charles H Luce
 Snow, Snowpacks and Runoff David G Tarboton Charles H Luce Show and Tell Images from http://www.anri.barc.usda.gov/emusnow/default.htm Potential effects of climate change on snow Advance in snowmelt timing
Water information system advances American River basin. Roger Bales, Martha Conklin, Steve Glaser, Bob Rice & collaborators UC: SNRI & CITRIS
 Water information system advances American River basin Roger Bales, Martha Conklin, Steve Glaser, Bob Rice & collaborators UC: SNRI & CITRIS Opportunities Unprecedented level of information from low-cost
Helsinki Testbed - a contribution to NASA's Global Precipitation Measurement (GPM) mission
 mission") Helsinki Testbed - a contribution to NASA's Global Precipitation Measurement (GPM) mission Ubicasting workshop, September 10, 2008 Jarkko Koskinen, Jarmo Koistinen, Jouni Pulliainen, Elena Saltikoff, David
Helsinki Testbed - a contribution to NASA's Global Precipitation Measurement (GPM) mission Ubicasting workshop, September 10, 2008 Jarkko Koskinen, Jarmo Koistinen, Jouni Pulliainen, Elena Saltikoff, David
Preliminary Runoff Outlook February 2018
 Preliminary Runoff Outlook February 2018 Prepared by: Flow Forecasting & Operations Planning Water Security Agency General Overview The Water Security Agency (WSA) is preparing for 2018 spring runoff including
Drought Monitoring with Hydrological Modelling
 st Joint EARS/JRC International Drought Workshop, Ljubljana,.-5. September 009 Drought Monitoring with Hydrological Modelling Stefan Niemeyer IES - Institute for Environment and Sustainability Ispra -
Improving Streamflow Prediction in Snow- fed River Basins via Satellite Snow Assimilation
 Improving Streamflow Prediction in Snow- fed River Basins via Satellite Snow Assimilation Yuqiong Liu NASA GSFC & University of Maryland, College Park Co- authors: Christa Peters- Lidard, Sujay Kumar,
A Review of the 2007 Water Year in Colorado
 A Review of the 2007 Water Year in Colorado Nolan Doesken Colorado Climate Center, CSU Mike Gillespie Snow Survey Division, USDA, NRCS Presented at the 28 th Annual AGU Hydrology Days, March 26, 2008,
Development of the Canadian Precipitation Analysis (CaPA) and the Canadian Land Data Assimilation System (CaLDAS)
 and the Canadian Land Data Assimilation System (CaLDAS)") Development of the Canadian Precipitation Analysis (CaPA) and the Canadian Land Data Assimilation System (CaLDAS) Marco L. Carrera, Vincent Fortin and Stéphane Bélair Meteorological Research Division Environment
Development of the Canadian Precipitation Analysis (CaPA) and the Canadian Land Data Assimilation System (CaLDAS) Marco L. Carrera, Vincent Fortin and Stéphane Bélair Meteorological Research Division Environment
Supplemental Information for. Thompson, L.G., et al. Ice Core Records of Climate Variability on the Third Pole
 1 1 2 3 4 5 6 7 8 Supplemental Information for Thompson, L.G., et al. Ice Core Records of Climate Variability on the Third Pole with Emphasis on the Guliya ice cap, western Kunlun Mountains 9 10 11 12
ANALYSIS OF CLIMATIC CHANGES IN THE SAN JUAN MOUNTAIN (SJM) REGION DURING THE 20 TH CENTURY. Imtiaz Rangwala
 REGION DURING THE 20 TH CENTURY. Imtiaz Rangwala") ANALYSIS OF CLIMATIC CHANGES IN THE SAN JUAN MOUNTAIN (SJM) REGION DURING THE 20 TH CENTURY Imtiaz Rangwala imtiazr@envsci.rutgers.edu MTNCLIM 2008 1 Objectives (as proposed) Nature of climate change in
ANALYSIS OF CLIMATIC CHANGES IN THE SAN JUAN MOUNTAIN (SJM) REGION DURING THE 20 TH CENTURY Imtiaz Rangwala imtiazr@envsci.rutgers.edu MTNCLIM 2008 1 Objectives (as proposed) Nature of climate change in
Snow Cover Applications: Major Gaps in Current EO Measurement Capabilities
 Snow Cover Applications: Major Gaps in Current EO Measurement Capabilities Thomas NAGLER ENVEO Environmental Earth Observation IT GmbH INNSBRUCK, AUSTRIA Polar and Snow Cover Applications User Requirements
C o p e r n i c u s L a n d M o n i t o r i n g S e r v i c e
 C o p e r n i c u s L a n d M o n i t o r i n g S e r v i c e Integration into existing Snow and Ice Services and draft product specifications Annett BARTSCH b.geos Copernicus High Resolution Snow and
Mountain Snowpacks, Climate Change and the Silver Solution
 Mountain Snowpacks, Climate Change and the Silver Solution Climate Change Seminar Series University of Nevada Las Vegas 11 July 2012 Arlen Huggins Desert Research Institute Reno, Nevada Climate, snow and
NIDIS Intermountain West Regional Drought Early Warning System February 7, 2017
 NIDIS Drought and Water Assessment NIDIS Intermountain West Regional Drought Early Warning System February 7, 2017 Precipitation The images above use daily precipitation statistics from NWS COOP, CoCoRaHS,
Jet Propulsion Laboratory California Institute of Technology. ASO In The Tuolumne: 3 Years Of Basin SWE, and PRMS Assimilation Results
 ASO In The Tuolumne: 3 Years Of Basin SWE, and PRMS Assimilation Results Bruce J. McGurk and Thomas H. Painter & ASO Team Hydroclimate Workshop, 8 Oct. 2015 Need frequent, dense SWE data at all elevations
NIDIS Intermountain West Drought Early Warning System May 23, 2017
 NIDIS Drought and Water Assessment NIDIS Intermountain West Drought Early Warning System May 23, 2017 Precipitation The images above use daily precipitation statistics from NWS COOP, CoCoRaHS, and CoAgMet
INVISIBLE WATER COSTS
 Every Drop Every Counts... Drop Counts... INVISIBLE WATER COSTS Corn - 108.1 gallons per pound How much water it takes to produce... Apple - 18.5 gallons to grow Beef - 1,581 gallons per pound Oats - 122.7
Wyoming Pre-Workshop Survey Results August 27, 2015 Lander Wyoming
 Wyoming Pre-Workshop Survey Results August 27, 2015 Lander Wyoming WHAT AREA(S) DO YOU WORK IN?! PLANNING, MGT, OPS! DROUGHT! RESEARCH! PUBLIC LANDS MGT! AG OR RANCHING! RECREATION! ENERGY! 0! 3.5! 7!
APPLICATION OF AN ARCTIC BLOWING SNOW MODEL
 APPLICATION OF AN ARCTIC BLOWING SNOW MODEL J.W. Pomero l, P. ~arsh' and D.M. Gray2 -Hydrology Research Institute Saskatoon, Saskatchewan, Canada S7N 3H5 '~ivision of Hydrology, University of Saskatchewan
 Permafrost http://www.cbc.ca/news/canada/story/2011/11/16/north-bigfix-permafrost.html 1. What is permafrost? Permafrost is a thick layer of permanently frozen ground. 2. Large parts of northeastern Russia
Forecast Challenges for the Colorado Basin River Forecast Center
 Forecast Challenges for the Colorado Basin River Forecast Center John Lhotak, Development and Operations Hydrologist Improving Sub-Seasonal to Seasonal (S2S) Workshop May 16th, 2018 1 River Forecast Centers
Operational Perspectives on Hydrologic Model Data Assimilation
 Operational Perspectives on Hydrologic Model Data Assimilation Rob Hartman Hydrologist in Charge NOAA / National Weather Service California-Nevada River Forecast Center Sacramento, CA USA Outline Operational
Near-surface Faceted Crystal Formation and Snow Stability in a High-latitude Maritime Snow Climate, Juneau, Alaska
 Arctic, Antarctic, and Alpine Research, Vol. 37, No. 3, 2005, pp. 316 322 Near-surface Faceted Crystal Formation and Snow Stability in a High-latitude Maritime Snow Climate, Juneau, Alaska Eran Hood*à
NIDIS Intermountain West Drought Early Warning System December 11, 2018
 NIDIS Drought and Water Assessment NIDIS Intermountain West Drought Early Warning System December 11, 2018 Precipitation The images above use daily precipitation statistics from NWS COOP, CoCoRaHS, and
Topographic, meteorologic, and canopy controls on the scaling characteristics of the spatial distribution of snow depth fields
 WATER RESOURCES RESEARCH, VOL. 43,, doi:10.1029/2006wr005317, 2007 Topographic, meteorologic, and canopy controls on the scaling characteristics of the spatial distribution of snow depth fields Ernesto
Snowmelt runoff forecasts in Colorado with remote sensing
 Hydrology in Mountainous Regions. I - Hydrologjcal Measurements; the Water Cycle (Proceedings of two Lausanne Symposia, August 1990). IAHS Publ. no. 193, 1990. Snowmelt runoff forecasts in Colorado with
The National Operational Hydrologic Remote Sensing Center Operational Snow Analysis
 The National Operational Hydrologic Remote Sensing Center Operational Snow Analysis World Meteorological Organization Global Cryosphere Watch Snow-Watch Workshop Session 3: Snow Analysis Products Andrew
9. PROBABLE MAXIMUM PRECIPITATION AND PROBABLE MAXIMUM FLOOD
 9. PROBABLE MAXIMUM PRECIPITATION AND PROBABLE MAXIMUM FLOOD 9.1. Introduction Due to the size of Watana Dam and the economic importance of the Project to the Railbelt, the Probable Maximum Flood (PMF)
Instructions for Running the FVS-WRENSS Water Yield Post-processor
 Instructions for Running the FVS-WRENSS Water Yield Post-processor Overview The FVS-WRENSS post processor uses the stand attributes and vegetative data from the Forest Vegetation Simulator (Dixon, 2002)
Central Asia Regional Flash Flood Guidance System 4-6 October Hydrologic Research Center A Nonprofit, Public-Benefit Corporation
 http://www.hrcwater.org Central Asia Regional Flash Flood Guidance System 4-6 October 2016 Hydrologic Research Center A Nonprofit, Public-Benefit Corporation FFGS Snow Components Snow Accumulation and
NIDIS Intermountain West Drought Early Warning System January 15, 2019
 NIDIS Drought and Water Assessment NIDIS Intermountain West Drought Early Warning System January 15, 2019 Precipitation The images above use daily precipitation statistics from NWS COOP, CoCoRaHS, and
Hydrologic Forecast Centre Manitoba Infrastructure, Winnipeg, Manitoba. MARCH OUTLOOK REPORT FOR MANITOBA March 23, 2018
 Page 1 of 21 Hydrologic Forecast Centre Manitoba Infrastructure, Winnipeg, Manitoba MARCH OUTLOOK REPORT FOR MANITOBA March 23, 2018 Overview The March Outlook Report prepared by the Hydrologic Forecast
Sinéad Louise Farrell1,2,3 Thomas Newman1,2,, Alek Petty 1,2, Jackie Richter-Menge4, Dave McAdoo1,2, Larry Connor2
 Sinéad Louise Farrell1,2,3 Thomas Newman1,2,, Alek Petty 1,2, Jackie Richter-Menge4, Dave McAdoo1,2, Larry Connor2 1 Earth System Science Interdisciplinary Center, University of Maryland, USA 2 NOAA Laboratory
The Hydrologic Cycle
 The Hydrologic Cycle Monthly precipitation for the central Arctic Ocean based on data from the Russian North Pole manned camps with daily bias adjustments. Raw precipitation totals are shown along with
POTENTIAL DRY SLAB AVALANCHE TRIGGER ZONES ON WIND-AFFECTED SLOPES
 POTENTIAL DRY SLAB AVALANCHE TRIGGER ZONES ON WIND-AFFECTED SLOPES 1,2 Markus Eckerstorfer, 1,2 Wesley R. Farnsworth, 3 Karl W. Birkeland 1 Arctic Geology Department, University Centre in Svalbard, Norway
Reservoir Operations (FBO) (FIRO)
 (FIRO)") A Methodology for Adaptive Water Management Forecast-Based Forecast-Informed Operations Reservoir Operations (FBO) (FIRO) Mike McMahon Senior Hydro-Meteorologist/Climate Science/Resiliency Lead - HDR Engineering
A Methodology for Adaptive Water Management Forecast-Based Forecast-Informed Operations Reservoir Operations (FBO) (FIRO) Mike McMahon Senior Hydro-Meteorologist/Climate Science/Resiliency Lead - HDR Engineering
Use of Snow Data from Remote Sensing in Operational Streamflow Prediction
 Use of Snow Data from Remote Sensing in Operational Streamflow Prediction Stacie Bender 1, Thomas H. Painter 2, Paul Miller 1, Michelle Stokes 1 1 NOAA/National Wear Service Colorado Basin River Forecast
The Importance of Snowmelt Runoff Modeling for Sustainable Development and Disaster Prevention
 The Importance of Snowmelt Runoff Modeling for Sustainable Development and Disaster Prevention Muzafar Malikov Space Research Centre Academy of Sciences Republic of Uzbekistan Water H 2 O Gas - Water Vapor
GEOGRAPHIC VARIATION IN SNOW TEMPERATURE GRADIENTS IN A MOUNTAIN SNOWPACK ABSTRACT
 GEOGRAPHIC VARIATION IN SNOW TEMPERATURE GRADIENTS IN A MOUNTAIN SNOWPACK J. S. Deems 1, K. W. Birkeland 1, K. J. Hansen 1 ABSTRACT The objective of this study was to investigate the relative importance
Observed State of the Global Climate
 WMO Observed State of the Global Climate Jerry Lengoasa WMO June 2013 WMO Observations of Changes of the physical state of the climate ESSENTIAL CLIMATE VARIABLES OCEANIC ATMOSPHERIC TERRESTRIAL Surface
Challenges for Climate Science in the Arctic. Ralf Döscher Rossby Centre, SMHI, Sweden
 Challenges for Climate Science in the Arctic Ralf Döscher Rossby Centre, SMHI, Sweden The Arctic is changing 1) Why is Arctic sea ice disappearing so rapidly? 2) What are the local and remote consequences?
The Documentation of Extreme Hydrometeorlogical Events: Two Case Studies in Utah, Water Year 2005
 The Documentation of Extreme Hydrometeorlogical Events: Two Case Studies in Utah, Water Year 2005 Tim Bardsley1*, Mark Losleben2, Randy Julander1 1. USDA, NRCS, Snow Survey Program, Salt Lake City, Utah.
Investigations into the Spatial Pattern of Annual and Interannual Snow Coverage of Brøgger Peninsula, Svalbard,
 Investigations into the Spatial Pattern of Annual and Interannual Snow Coverage of Brøgger Peninsula, Svalbard, 2000-2007 Manfred F. Buchroithner Nadja Thieme Jack Kohler 6th ICA Mountain Cartography Workshop
The DMRT-ML model: numerical simulations of the microwave emission of snowpacks based on the Dense Media Radiative Transfer theory
 The DMRT-ML model: numerical simulations of the microwave emission of snowpacks based on the Dense Media Radiative Transfer theory Ludovic Brucker 1,2, Ghislain Picard 3 Alexandre Roy 4, Florent Dupont
Supplementary Materials for
 advances.sciencemag.org/cgi/content/full/3/12/e1701169/dc1 Supplementary Materials for Abrupt shift in the observed runoff from the southwestern Greenland ice sheet Andreas P. Ahlstrøm, Dorthe Petersen,
The elevations on the interior plateau generally vary between 300 and 650 meters with
 11 2. HYDROLOGICAL SETTING 2.1 Physical Features and Relief Labrador is bounded in the east by the Labrador Sea (Atlantic Ocean), in the west by the watershed divide, and in the south, for the most part,
Snowfall Detection and Rate Retrieval from ATMS
 Snowfall Detection and Rate Retrieval from ATMS Jun Dong 1, Huan Meng 2, Cezar Kongoli 1, Ralph Ferraro 2, Banghua Yan 2, Nai-Yu Wang 1, Bradley Zavodsky 3 1 University of Maryland/ESSIC/Cooperative Institute
Proceedings, International Snow Science Workshop, Innsbruck, Austria, 2018
 RELEASE OF AVALANCHES ON PERSISTENT WEAK LAYERS IN RELATION TO LOADING EVENTS IN COLORADO, USA Jason Konigsberg 1, Spencer Logan 1, and Ethan Greene 1 1 Colorado Avalanche Information Center, Boulder,
Hydrologic Forecast Centre Manitoba Infrastructure, Winnipeg, Manitoba. FEBRUARY OUTLOOK REPORT FOR MANITOBA February 23, 2018
 Page 1 of 17 Hydrologic Forecast Centre Manitoba Infrastructure, Winnipeg, Manitoba FEBRUARY OUTLOOK REPORT FOR MANITOBA February 23, 2018 Overview The February Outlook Report prepared by the Hydrologic
ATOC OUR CHANGING ENVIRONMENT Class 19 (Chp 6) Objectives of Today s Class: The Cryosphere [1] Components, time scales; [2] Seasonal snow
![ATOC OUR CHANGING ENVIRONMENT Class 19 (Chp 6) Objectives of Today s Class: The Cryosphere [1] Components, time scales; [2] Seasonal snow](/thumbs/95/126309683.jpg "ATOC OUR CHANGING ENVIRONMENT Class 19 (Chp 6) Objectives of Today s Class: The Cryosphere [1] Components, time scales; [2] Seasonal snow") ATOC 1060-002 OUR CHANGING ENVIRONMENT Class 19 (Chp 6) Objectives of Today s Class: The Cryosphere [1] Components, time scales; [2] Seasonal snow cover, permafrost, river and lake ice, ; [3]Glaciers and
ATOC 1060-002 OUR CHANGING ENVIRONMENT Class 19 (Chp 6) Objectives of Today s Class: The Cryosphere [1] Components, time scales; [2] Seasonal snow cover, permafrost, river and lake ice, ; [3]Glaciers and
Why modelling? Glacier mass balance modelling
 Why modelling? Glacier mass balance modelling GEO 4420 Glaciology 12.10.2006 Thomas V. Schuler t.v.schuler@geo.uio.no global mean temperature Background Glaciers have retreated world-wide during the last
Quenching the Valley s thirst: The connection between Sierra Nevada snowpack & regional water supply
 Quenching the Valley s thirst: The connection between Sierra Nevada snowpack & regional water supply Roger Bales, UC Merced Snow conditions Snow & climate change Research directions Sierra Nevada snow
Assimilation of Snow and Ice Data (Incomplete list)
") Assimilation of Snow and Ice Data (Incomplete list) Snow/ice Sea ice motion (sat): experimental, climate model Sea ice extent (sat): operational, U.S. Navy PIPs model; Canada; others? Sea ice concentration
Assimilation of Snow and Ice Data (Incomplete list) Snow/ice Sea ice motion (sat): experimental, climate model Sea ice extent (sat): operational, U.S. Navy PIPs model; Canada; others? Sea ice concentration
Surface Hydrology Research Group Università degli Studi di Cagliari
 Surface Hydrology Research Group Università degli Studi di Cagliari Evaluation of Input Uncertainty in Nested Flood Forecasts: Coupling a Multifractal Precipitation Downscaling Model and a Fully-Distributed
Geomorphologic Mapping by Airborne Laser Scanning in Southern Victoria Land
 Geomorphologic Mapping by Airborne Laser Scanning in Southern Victoria Land Bea Csatho, Terry Wilson, Tony Schenk, Garry McKenzie, Byrd Polar Research Center, The Ohio State University, Columbus, OH William
Abstract. 1 Introduction. 2 Experimental Setup. 2.1 Data Set
 ERAD - THE SEVENTH EUROPEAN CONFERENCE ON RADAR IN METEOROLOGY AND HYDROLOGY Comparison of the seasonal small-scale spatial variability in alpine snowfall and snow accumulation D. E. Scipión,, R. Mott,
Winter course for field snowpack measurements
 70 th Eastern Snow Conference Winter course for field snowpack measurements Sherbrooke, Québec, Canada NASA Snow Working Group Remote Sensing COURSE PROGRAM & INFORMATION March 8 th 12 th 2015 1 Winter
Snow cover measurement and variation analysis
 Snow cover measurement and variation analysis Konosuke Sugiura / Associate Professor, University of Toyama Fig.1 The rapid progression of snow cover extent in the northern hemisphere in October 2012. Red:
REQUIREMENTS FOR WEATHER RADAR DATA. Review of the current and likely future hydrological requirements for Weather Radar data
 WORLD METEOROLOGICAL ORGANIZATION COMMISSION FOR BASIC SYSTEMS OPEN PROGRAMME AREA GROUP ON INTEGRATED OBSERVING SYSTEMS WORKSHOP ON RADAR DATA EXCHANGE EXETER, UK, 24-26 APRIL 2013 CBS/OPAG-IOS/WxR_EXCHANGE/2.3