RED DUST SNOWFALL EVENT FEBRUARY 15, OVERVIEW and RELATED RESEARCH at NIWOT RIDGE, COLORADO
|
|
|
- Katrina Morrison
- 5 years ago
- Views:
Transcription

1 RED DUST SNOWFALL EVENT FEBRUARY 15, 2006 OVERVIEW and RELATED RESEARCH at NIWOT RIDGE, COLORADO MARK LOSLEBEN, THOMAS PAINTER, ALLEN TOWNSEND, KURT CHOWANSKI, LUCAS ZUKIEWICZ

 Decreased southwestern US Water Supply Increased")
2 OUTLINE Event Origin/Synoptic Conditions during Event Avalanche Implications Measurements Observations of Dust on-snow Effects Snow pack melt rate Energy transfer into snow pack Alteration of melt-water pathways (Ice column development) Differential radiative impacts of fine vs. coarse particle size Future Implications (Positive Feedback) Decreased southwestern US Water Supply Increased dry, summer season Altered phenologies Shifted ecological zones


, and seems to")
3 Event On the night of February 15-16, 2006, 6.4 cm (2 ½ /0.20 SWE) of snow fell at C1. The event began about 7 PM on the 15th and was virtually over by midnight. The lower one half was red, the upper was visibly white with a sharp distinction between the two. Begining February 21, 2006, westerly winds mixed the red dust layer with the overlying white snow, or removed it completely. Related Events In Europe reddish precipitation originating from North Africa has been known for hundreds of years (referred to as "blood rain" in Germany), and seems to happen every few years (transported right across the Mediterranean). Klaus Wolter. Behind Marr Bldg Feb 17 Feb 20 Feb 20 Feb 21


4 17 Feb 2006 above Soddie

5

6 AVALANCHE Here is a shot of my compression test column. The Column failed with only two wrist taps, on top of the dust layer Halsted Morris. Colorado Avalanche Center "SNOWPACK DISCUSSION -- A layer of dust came in with the snow yesterday across most of the state from the San Juan Mountains to the Front Range. Strong SW winds picked up the dust in the 4-Corners region where drought conditions have left the ground bare. We have received reports of small and shallow slabs releasing on this layer. Dust layers can be associated with weak layers if the conditions are right after deposition. We will have to wait and see how the snow around this layer reacts in the next few days." From SW Colorado We get these dust layers almost every season, usually in spring, and they are the bane of the snowpack! Obviously, they radically change the albedo, so melt rates are greatly increased (bad!). And, in turn, the dust also creates strong temp gradients in the uppermost pack which causes increased near-surface faceting which creates cool NSF crystals which, when buried, become a weak, fast and clean interface...(bad!). Mark Rikkers


7

8 Start of Event

9 End of Event
 and I have studied in the Front Range.")

10 MEASUREMENTS Snowpits; depth, density, temperature, stratigraphy Dan Muhs, USGS, Particle size analyses, mineralogy, and rare earth element geochemistry comparison with the alpine and subalpine soils that Jim (Benedict) and I have studied in the Front Range. Mark Williams, INSTAAR: NADP suite of cations/anions, minerals; Sr-86/87 (Phil Veplanck); C13 (Ruth Ley). David Clow, USGS: carbonate (acid neutralizing capability). Tom Painter, CIRES, CU, Effect of particle size on radiative response of snowsurface to melting. Temperature and Light Sensor Array Allen Townsend, INSTAAR, Ecological effects: plant and soil response and change, surface melt rate. Steven Fassnacht, CSU: Surface roughness
11 Temperature and light level profile Time Series Solar Intensity Julian Days Solar Intensity (lum/ft²) cm Height 230cm Height 210cm Height 190cm Height 170cm Height 85cm Height 0cm Height Julian Days Time Series Solar Intensity Julian Days Solar Intensity (lum/ft²) cm Height 230cm Height 210cm Height 190cm Height 170cm Height 85cm Height 0cm Height Julian Days


12 On JD 94, the snowpack absorbed 6709 J/M2 in one hour. This is a rate of 112 J/M2 per minute DOY 94: Energy infusion rate of 112 J/m2 per minute brought the snow pack to isothermal in one hour!


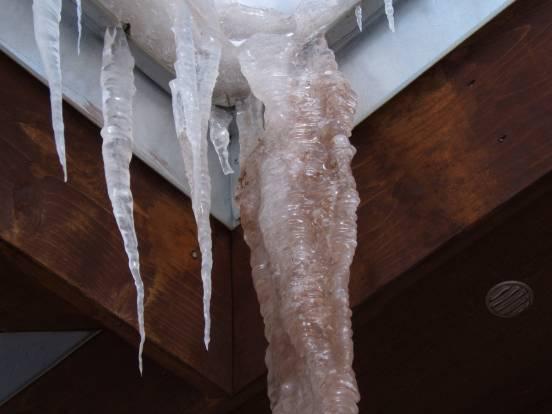
13 Ice Columns Indicators of melt-water flow paths Altered form in red snow layer


14


15 Five ice columns randomly selected for both types of snow, excavated, measured for surface diameter, length, shape, and where the column terminated. Ice columns from red snow were significantly shorter than from white snow (p =.0001), with red snow columns having a mean height of 16.4 cm. Ice columns from white snow were longer, mean length of 60 cm. The red snow columns had a conical shape and maximum diameter occurring at the top of the column. The white snow columns had a more consistent uniform shape from surface to bottom before ending in ice lenses.
 increased rates of liquid water movement through the snowpack; and (4) melted the pre-existing ice columns")

16 We speculate that increased melt rates in the red snow areas: (1) increased the volumetric water content; (2) resulted in a more uniform movement of water through the snowpack; (3) increased rates of liquid water movement through the snowpack; and (4) melted the pre-existing ice columns from top to bottom because of the increased latent heat of fusion associated with the increased volumetric liquid water content and higher rates of liquid water movement through the snowpack. Red Snow: shorter (16.4 cm), fatter White snow: longer (60 cm), thinner Both: terminated at ice layer


17 Spring Snow Surfaces Red = smooth; White = rough (10-30 cm) Effects on Soil and Vegetation Surface melt accelerated until a red/white snow surface equilibrium level was reached at ~30 cm differential. At this point, the albedo of the red and white snow surfaces was similar.
 is much deeper (~20 cm) and darker than the coarse plot, which is almost indistinguishable from the background now.")
18 Dust scattered over s now on 12 May June 2, 1200 mst. The fine dust plot (first one) is much deeper (~20 cm) and darker than the coarse plot, which is almost indistinguishable from the background now. The impression is that the coarse dust has melted into the snow, dropping away from the surface and thus no longer radiatively as active as the fine dust, which is obviously still on the surface. June 8, 0700 mst. Fine dust plot melted a hole through the snowpack. -MarkLosleben SUMMARY Suggested Effects of Red Dust on/in Snow pack, Niwot Ridge IMMEDIATE (RADIATIVE) EFFECTS - Dust layer can be radiatively activated cm below the surface - Increases surface melt rates until normal background albedo levels are reached; ~30 cm differential on Niwot Ridge, spring 2006.
19 - Alters sub-surface melt water flow paths - Increases energy flux through snowpack - Particle size matters LONGER-TERM POTENTIAL EFFECTS - Possible soil composition and soil water chemistry changes (study in progress). CONCLUDING THOUGHTS Dust-in-snowfall events present another avenue to reduce snow pack. Possible Scenario: A warmer, drier climate increases dust availability. Gustier frontal passages transport this dust further, frequently reaching the upper Colorado River Basin Potential Impacts: Reduced SW US water supplies (less snow pack) Increased dry, summer season length, Altered phenology Shifted ecological zones Positive feedback that further increases dust supply. [ By 2036, there will be an additional 86 tons per day of air-borne dust from the dry bed of the Salton Sea, if remedial actions are not taken (SW Hdrol, v.5. No 5).]
- SNOW - DEPOSITION, WIND TRANSPORT, METAMORPHISM
 ESS 431 PRINCIPLES OF GLACIOLOGY ESS 505 THE CRYOSPHERE - SNOW - DEPOSITION, WIND TRANSPORT, METAMORPHISM OCTOBER 10, 2016 Ed Waddington edw@uw.edu Homework Skating and the phase diagram See web page Sources
Basic Hydrologic Science Course Understanding the Hydrologic Cycle Section Six: Snowpack and Snowmelt Produced by The COMET Program
 Basic Hydrologic Science Course Understanding the Hydrologic Cycle Section Six: Snowpack and Snowmelt Produced by The COMET Program Snow and ice are critical parts of the hydrologic cycle, especially at
Terrestrial Snow Cover: Properties, Trends, and Feedbacks. Chris Derksen Climate Research Division, ECCC
 Terrestrial Snow Cover: Properties, Trends, and Feedbacks Chris Derksen Climate Research Division, ECCC Outline Three Snow Lectures: 1. Why you should care about snow: Snow and the cryosphere Classes of
Earth s Heat Budget. What causes the seasons? Seasons
 Earth s Heat Budget Solar energy and the global heat budget Transfer of heat drives weather and climate Ocean circulation A. Rotation of the Earth B. Distance from the Sun C. Variations of Earth s orbit
Thermal / Solar. When air is warmed it... Rises. Solar Energy. Evaporation. Condensation Forms Clouds
 Thermal / Solar Light from the Sun is transformed into what type of energy when it hits Earth's surface? Rises When air is warmed it... Solar Energy Water moves through the water cycle using what type
NIDIS Intermountain West Regional Drought Early Warning System February 7, 2017
 NIDIS Drought and Water Assessment NIDIS Intermountain West Regional Drought Early Warning System February 7, 2017 Precipitation The images above use daily precipitation statistics from NWS COOP, CoCoRaHS,
Glaciers form wherever snow and ice can accumulate High latitudes High mountains at low latitudes Ice temperatures vary among glaciers Warm
 The Cryosphere Glaciers form wherever snow and ice can accumulate High latitudes High mountains at low latitudes Ice temperatures vary among glaciers Warm (temperate) glaciers: at pressure melting point,
Earth s Heat Budget. What causes the seasons? Seasons
 Earth s Heat Budget Solar energy and the global heat budget Transfer of heat drives weather and climate Ocean circulation A. Rotation of the Earth B. Distance from the Sun C. Variations of Earth s orbit
Potential impacts of aerosol and dust pollution acting as cloud nucleating aerosol on water resources in the Colorado River Basin
 Potential impacts of aerosol and dust pollution acting as cloud nucleating aerosol on water resources in the Colorado River Basin Vandana Jha, W. R. Cotton, and G. G. Carrio Colorado State University,
1 What Is Climate? TAKE A LOOK 2. Explain Why do areas near the equator tend to have high temperatures?
 CHAPTER 17 1 What Is Climate? SECTION Climate BEFORE YOU READ After you read this section, you should be able to answer these questions: What is climate? What factors affect climate? How do climates differ
A) usually less B) dark colored and rough D) light colored with a smooth surface A) transparency of the atmosphere D) rough, black surface
 usually less B) dark colored and rough D) light colored with a smooth surface A) transparency of the atmosphere D) rough, black surface") 1. Base your answer to the following question on the diagram below which shows two identical houses, A and B, in a city in North Carolina. One house was built on the east side of a factory, and the other
1. Base your answer to the following question on the diagram below which shows two identical houses, A and B, in a city in North Carolina. One house was built on the east side of a factory, and the other
Climate Change in Colorado: Recent Trends, Future Projections and Impacts An Update to the Executive Summary of the 2014 Report
 Climate Change in Colorado: Recent Trends, Future Projections and Impacts An Update to the Executive Summary of the 2014 Report Jeff Lukas, Western Water Assessment, University of Colorado Boulder - Lukas@colorado.edu
Land Surface Processes and Their Impact in Weather Forecasting
 Land Surface Processes and Their Impact in Weather Forecasting Andrea Hahmann NCAR/RAL with thanks to P. Dirmeyer (COLA) and R. Koster (NASA/GSFC) Forecasters Conference Summer 2005 Andrea Hahmann ATEC
Mapping Temperature across Complex Terrain
 Mapping Temperature across Complex Terrain Jessica Lundquist 1, Nick Pepin 2, Phil Mote 3 1 Assistant Professor, Civil and Environmental Engineering, University of Washington 2 Lecturer, Department of
NIDIS Intermountain West Drought Early Warning System October 17, 2017
 NIDIS Drought and Water Assessment NIDIS Intermountain West Drought Early Warning System October 17, 2017 Precipitation The images above use daily precipitation statistics from NWS COOP, CoCoRaHS, and
1 A 3 C 2 B 4 D. 5. During which month does the minimum duration of insolation occur in New York State? 1 February 3 September 2 July 4 December
 INSOLATION REVIEW 1. The map below shows isolines of average daily insolation received in calories per square centimeter per minute at the Earth s surface. If identical solar collectors are placed at the
Snow II: Snowmelt and energy balance
 Snow II: Snowmelt and energy balance The are three basic snowmelt phases 1) Warming phase: Absorbed energy raises the average snowpack temperature to a point at which the snowpack is isothermal (no vertical
Light Up Your World Adapted from Reflecting on Reflectivity,
 Climate Change I m Supposed To Know What That Is? Light Up Your World Adapted from Reflecting on Reflectivity, http://www.climatechangenorth.ca Overview: Students often confuse global warming and the depletion
The PRECIS Regional Climate Model
 The PRECIS Regional Climate Model General overview (1) The regional climate model (RCM) within PRECIS is a model of the atmosphere and land surface, of limited area and high resolution and locatable over
Lecture 8: Snow Hydrology
 GEOG415 Lecture 8: Snow Hydrology 8-1 Snow as water resource Snowfall on the mountain ranges is an important source of water in rivers. monthly pcp (mm) 100 50 0 Calgary L. Louise 1 2 3 4 5 6 7 8 9 10
1. Base your answer to the following question on the weather map below, which shows a weather system that is affecting part of the United States.
 1. Base your answer to the following question on the weather map below, which shows a weather system that is affecting part of the United States. Which sequence of events forms the clouds associated with
ISSUED BY KENDRIYA VIDYALAYA - DOWNLOADED FROM
 CHAPTER -11 WATER IN THE ATMOSPHERE This chapter deals with Humidity, types of humidity, relative humidity, absolute humidity, specific humidity, dew point, condensation, saturated air, types of precipitation
The following information is provided for your use in describing climate and water supply conditions in the West as of April 1, 2003.
 Natural Resources Conservation Service National Water and Climate Center 101 SW Main Street, Suite 1600 Portland, OR 97204-3224 Date: April 8, 2003 Subject: April 1, 2003 Western Snowpack Conditions and
Webinar and Weekly Summary February 15th, 2011
 Webinar and Weekly Summary February 15th, 2011 -Assessment of current water conditions - Precipitation Forecast - Recommendations for Drought Monitor Upper Colorado Normal Precipitation Upper Colorado
GEO1010 tirsdag
 GEO1010 tirsdag 31.08.2010 Jørn Kristiansen; jornk@met.no I dag: Først litt repetisjon Stråling (kap. 4) Atmosfærens sirkulasjon (kap. 6) Latitudinal Geographic Zones Figure 1.12 jkl TØRR ATMOSFÆRE Temperature
Interactive comment on The impact of Saharan dust and black carbon on albedo and long-term glacier mass balance by J. Gabbi et al.
 The Cryosphere Discuss., 9, C553 C564, 2015 www.the-cryosphere-discuss.net/9/c553/2015/ Author(s) 2015. This work is distributed under the Creative Commons Attribute 3.0 License. The Cryosphere Discussions
What is the IPCC? Intergovernmental Panel on Climate Change
 IPCC WG1 FAQ What is the IPCC? Intergovernmental Panel on Climate Change The IPCC is a scientific intergovernmental body set up by the World Meteorological Organization (WMO) and by the United Nations
Northeast River Forecast Center s
 Northeast River Forecast Center s Apr 13 th Spring Outlook Brought to you by: Edward Capone Service Coordination Hydrologist Overview to Include: Potential flood outlook convective/synoptic conditions
The Documentation of Extreme Hydrometeorlogical Events: Two Case Studies in Utah, Water Year 2005
 The Documentation of Extreme Hydrometeorlogical Events: Two Case Studies in Utah, Water Year 2005 Tim Bardsley1*, Mark Losleben2, Randy Julander1 1. USDA, NRCS, Snow Survey Program, Salt Lake City, Utah.
Question #1: What are some ways that you think the climate may have changed in the area where you live over the past million years?
 Reading 5.2 Environmental Change Think about the area where you live. You may see changes in the landscape in that area over a year. Some of those changes are weather related. Others are due to how the
Earth s Heat Budget. What causes the seasons?
 Earth s Heat Budget Solar Energy and the global Heat Budget Transfer of heat drives weather and climate Ocean circulation Should we talk about this? What causes the seasons? Before you answer, think. What
FACETED SNOW AND DEEP SLAB INSTABILITIES IN THE MARITIME CLIMATE OF THE CASCADES. Jon Andrews* Stevens Pass Ski Area
 FACETED SNOW AND DEEP SLAB INSTABILITIES IN THE MARITIME CLIMATE OF THE CASCADES Jon Andrews* Stevens Pass Ski Area ABSTRACT: Forecasting for deep slab instabilities in dense, deep snow can be tricky,
Answers to Clicker Questions
 Answers to Clicker Questions Chapter 1 What component of the atmosphere is most important to weather? A. Nitrogen B. Oxygen C. Carbon dioxide D. Ozone E. Water What location would have the lowest surface
Climate Change 2007: The Physical Science Basis
 Climate Change 2007: The Physical Science Basis Working Group I Contribution to the IPCC Fourth Assessment Report Presented by R.K. Pachauri, IPCC Chair and Bubu Jallow, WG 1 Vice Chair Nairobi, 6 February
Presentation Overview. Southwestern Climate: Past, present and future. Global Energy Balance. What is climate?
 Southwestern Climate: Past, present and future Mike Crimmins Climate Science Extension Specialist Dept. of Soil, Water, & Env. Science & Arizona Cooperative Extension The University of Arizona Presentation
Direction and range of change expected in the future
 Direction and range of Air Temperature Over the past 30 years, air Across the greater PNW and temperature has been Columbia Basin, an ensemble increasing an average of forecast from ten of the best 0.13
NIDIS Intermountain West Drought Early Warning System February 6, 2018
 NIDIS Intermountain West Drought Early Warning System February 6, 2018 Precipitation The images above use daily precipitation statistics from NWS COOP, CoCoRaHS, and CoAgMet stations. From top to bottom,
Seasonal Outlook through September 2007
 Seasonal Outlook through September 2007 Klaus Wolter (15may) University of Colorado, CIRES & NOAA-ESRL Climate Analysis Branch klaus.wolter@noaa.gov http://www.cdc.noaa.gov/people/klaus.wolter/swcasts/
Drought and Future Water for Southern New Mexico
 Drought and Future Water for Southern New Mexico David S. Gutzler University of New Mexico gutzler@unm.edu * The big drought of 2018 * Longer term challenges for water supply * Forecasting streamflow Elephant
Extreme Weather and Climate Change: the big picture Alan K. Betts Atmospheric Research Pittsford, VT NESC, Saratoga, NY
 Extreme Weather and Climate Change: the big picture Alan K. Betts Atmospheric Research Pittsford, VT http://alanbetts.com NESC, Saratoga, NY March 10, 2018 Increases in Extreme Weather Last decade: lack
The inputs and outputs of energy within the earth-atmosphere system that determines the net energy available for surface processes is the Energy
 Energy Balance The inputs and outputs of energy within the earth-atmosphere system that determines the net energy available for surface processes is the Energy Balance Electromagnetic Radiation Electromagnetic
-Assessment of current water conditions. - Precipitation Forecast. - Recommendations for Drought Monitor
 April 27, 2010 -Assessment of current water conditions - Precipitation Forecast - Recommendations for Drought Monitor 7 Day Precipitation 19-25 April 2010 Month-to-Date Precipitation 1-25 April 2010
A R C T E X Results of the Arctic Turbulence Experiments Long-term Monitoring of Heat Fluxes at a high Arctic Permafrost Site in Svalbard
 A R C T E X Results of the Arctic Turbulence Experiments www.arctex.uni-bayreuth.de Long-term Monitoring of Heat Fluxes at a high Arctic Permafrost Site in Svalbard 1 A R C T E X Results of the Arctic
Tropical Climates Zone
 Tropical Climates Zone RAIN FOREST CENTRAL AFRICA, SOUTH AMERICA (AMAZON), CENTRAL AMERICA, S.E. ASIA HUMID/WARM ANNUAL RAINFALL 200 CM TYPE #1: TROPICAL DESERT N. AFRICA (SAHARA) & S.W. ASIA < 25 CM
NIDIS Intermountain West Drought Early Warning System January 22, 2019
 NIDIS Drought and Water Assessment NIDIS Intermountain West Drought Early Warning System January 22, 2019 Precipitation The images above use daily precipitation statistics from NWS COOP, CoCoRaHS, and
2. Fargo, North Dakota receives more snow than Charleston, South Carolina.
 2015 National Tournament Division B Meteorology Section 1: Weather versus Climate Chose the answer that best answers the question 1. The sky is partly cloudy this morning in Lincoln, Nebraska. 2. Fargo,
Week: Dates: 3/2 3/20 Unit: Climate
 clementaged.weebly.com Name: EVEN Period: Week: 28 30 Dates: 3/2 3/20 Unit: Climate Monday Tuesday Wednesday Thursday Friday 2 O 3 E *Vocabulary *Water in the Atmosphere and Clouds Notes *Cloud Drawings
WHAT CAN MAPS TELL US ABOUT THE GEOGRAPHY OF ANCIENT GREECE? MAP TYPE 1: CLIMATE MAPS
 WHAT CAN MAPS TELL US ABOUT THE GEOGRAPHY OF ANCIENT GREECE? MAP TYPE 1: CLIMATE MAPS MAP TYPE 2: PHYSICAL AND/OR TOPOGRAPHICAL MAPS MAP TYPE 3: POLITICAL MAPS TYPE 4: RESOURCE & TRADE MAPS Descriptions
World Geography Chapter 3
 World Geography Chapter 3 Section 1 A. Introduction a. Weather b. Climate c. Both weather and climate are influenced by i. direct sunlight. ii. iii. iv. the features of the earth s surface. B. The Greenhouse
1 What Is Climate? TAKE A LOOK 2. Explain Why do areas near the equator tend to have high temperatures?
 CHAPTER 17 1 What Is Climate? SECTION Climate BEFORE YOU READ After you read this section, you should be able to answer these questions: What is climate? What factors affect climate? How do climates differ
ATOC OUR CHANGING ENVIRONMENT Class 19 (Chp 6) Objectives of Today s Class: The Cryosphere [1] Components, time scales; [2] Seasonal snow
![ATOC OUR CHANGING ENVIRONMENT Class 19 (Chp 6) Objectives of Today s Class: The Cryosphere [1] Components, time scales; [2] Seasonal snow](/thumbs/95/126309683.jpg "ATOC OUR CHANGING ENVIRONMENT Class 19 (Chp 6) Objectives of Today s Class: The Cryosphere [1] Components, time scales; [2] Seasonal snow") ATOC 1060-002 OUR CHANGING ENVIRONMENT Class 19 (Chp 6) Objectives of Today s Class: The Cryosphere [1] Components, time scales; [2] Seasonal snow cover, permafrost, river and lake ice, ; [3]Glaciers and
ATOC 1060-002 OUR CHANGING ENVIRONMENT Class 19 (Chp 6) Objectives of Today s Class: The Cryosphere [1] Components, time scales; [2] Seasonal snow cover, permafrost, river and lake ice, ; [3]Glaciers and
1 Earth s Oceans. TAKE A LOOK 2. Identify What are the five main oceans?
 CHAPTER 13 1 Earth s Oceans SECTION Exploring the Oceans BEFORE YOU READ After you read this section, you should be able to answer these questions: What affects the salinity of ocean water? What affects
DEPARTMENT OF EARTH & CLIMATE SCIENCES Name SAN FRANCISCO STATE UNIVERSITY Nov 29, ERTH 360 Test #2 200 pts
 DEPARTMENT OF EARTH & CLIMATE SCIENCES Name SAN FRANCISCO STATE UNIVERSITY Nov 29, 2018 ERTH 360 Test #2 200 pts Each question is worth 4 points. Indicate your BEST CHOICE for each question on the Scantron
Microwave, portable FMCW radar: a tool for measuring snow depth, stratigraphy, and snow water equivalent
 Microwave, portable FMCW radar: a tool for measuring snow depth, stratigraphy, and snow water equivalent Hans-Peter Marshall CGISS, Boise State University U.S. Army Cold Regions Research and Engineering
Colorado State University, Fort Collins, CO Weather Station Monthly Summary Report
 Colorado State University, Fort Collins, CO Weather Station Monthly Summary Report Month: December Year: 2017 Temperature: Mean T max was 47.2 F which is 4.4 above the 1981-2010 normal for the month. This
ANALYSIS OF CLIMATIC CHANGES IN THE SAN JUAN MOUNTAIN (SJM) REGION DURING THE 20 TH CENTURY. Imtiaz Rangwala
 REGION DURING THE 20 TH CENTURY. Imtiaz Rangwala") ANALYSIS OF CLIMATIC CHANGES IN THE SAN JUAN MOUNTAIN (SJM) REGION DURING THE 20 TH CENTURY Imtiaz Rangwala imtiazr@envsci.rutgers.edu MTNCLIM 2008 1 Objectives (as proposed) Nature of climate change in
ANALYSIS OF CLIMATIC CHANGES IN THE SAN JUAN MOUNTAIN (SJM) REGION DURING THE 20 TH CENTURY Imtiaz Rangwala imtiazr@envsci.rutgers.edu MTNCLIM 2008 1 Objectives (as proposed) Nature of climate change in
What we are trying to accomplish during the winter season
 What we are trying to accomplish during the winter season Safety first None of this is worth getting hurt over. Change your observation time if you delay your normal observation for safety reasons. Accuracy
Weather and Climate Summary and Forecast March 2018 Report
 Weather and Climate Summary and Forecast March 2018 Report Gregory V. Jones Linfield College March 7, 2018 Summary: The ridge pattern that brought drier and warmer conditions from December through most
Chapter 2: Physical Geography
 Chapter 2: Physical Geography Pg. 39-68 Learning Goals for Chp2: q q q q q Explain how the Earth moves in space and why seasons change. Outline the factors that influence climate and recognize different
Climate Change a review
 a review AIChE Dallas Local Section September 2017 Page 2 AIChE Dallas Local Section September 2017 Page 3 AIChE Dallas Local Section September 2017 Page 4 How will it affect me What do we know Sun Earth
NIDIS Weekly Climate, Water and Drought Assessment Summary. Upper Colorado River Basin February 28, 2012
 NIDIS Weekly Climate, Water and Drought Assessment Summary Upper Colorado River Basin February 28, 2012 PrecipitaGon and Snowpack Fig. 1: February month- to- date precipitagon in inches. Fig. 2: February
Spring break reading. Glacial formation. Surface processes: Glaciers and deserts. The Control of Nature
 suggested Spring break reading The Control of Nature by John McPhee Surface processes: Glaciers and deserts describes our efforts to control three natural hazards: 1. The Mississippi Floods 2. The Heimaey
Fill in the blank with the word that completes the sentence. Then, find that work in the puzzle.
 Classwork #1 Name: 2 nd Grade PSI Fill in the blank with the word that completes the sentence. Then, find that work in the puzzle. 1. When the Earth is facing the sun, it is time. 2. Another word for spins
Novel Snotel Data Uses: Detecting Change in Snowpack Development Controls, and Remote Basin Snow Depth Modeling
 Novel Snotel Data Uses: Detecting Change in Snowpack Development Controls, and Remote Basin Snow Depth Modeling OVERVIEW Mark Losleben and Tyler Erickson INSTAAR, University of Colorado Mountain Research
Future Climate and Sea Level
 Future Climate and Sea Level Tonight: 2 nd night on human changes and controversy around them. three night series : 1) An Inconvenient truth 2) Impacts: Observed Warming and Projected Sea Level Changes
P. Marsh and J. Pomeroy National Hydrology Research Institute 11 Innovation Blvd., Saskatoon, Sask. S7N 3H5
 WATER AND ENERGY FLUXES DURING THE SNOWMELT PERIOD AT AN ARCTIC TREELINE SITE P. Marsh and J. Pomeroy National Hydrology Research Institute 11 Innovation Blvd., Saskatoon, Sask. S7N 3H5 marshp@nhrisv.nhrc.skdoe.ca
Colorado State University, Fort Collins, CO Weather Station Monthly Summary Report
 Colorado State University, Fort Collins, CO Weather Station Monthly Summary Report Month: January Year: 2019 Temperature: Mean T max was 47.2 F which is 3.0 above the 1981-2010 normal for the month. This
Adapted by Karla Panchuk from Physical Geology by Steven Earle
 Physical Geology, 3 rd Adapted Edition is used under a CC BY 4.0 International License Read this book online at http://openpress.usask.ca/physicalgeology/ Chapter 6. The Rock Cycle Adapted by Karla Panchuk
Land Surface Sea Ice Land Ice. (from Our Changing Planet)
") Lecture 5: Land Surface and Cryosphere (Outline) Land Surface Sea Ice Land Ice (from Our Changing Planet) Earth s s Climate System Solar forcing Atmosphere Ocean Land Solid Earth Energy, Water, and Biochemistry
Lecture 5: Land Surface and Cryosphere (Outline) Land Surface Sea Ice Land Ice (from Our Changing Planet) Earth s s Climate System Solar forcing Atmosphere Ocean Land Solid Earth Energy, Water, and Biochemistry
South Dakota Wildfire Potential Outlook - January
 January 4, 2018 South Dakota Wildfire Potential Outlook - January 2018 - Happy New Year! The Legion Lake fire in and southeast of Custer State Park was the big headline of December 2017. Climate and weather
Definitions Weather and Climate Climates of NYS Weather Climate 2012 Characteristics of Climate Regions of NYS NYS s Climates 1.
 Definitions Climates of NYS Prof. Anthony Grande 2012 Weather and Climate Weather the state of the atmosphere at one point in time. The elements of weather are temperature, t air pressure, wind and moisture.
Earth s Climate System. Surface Albedo. Climate Roles of Land Surface. Lecture 5: Land Surface and Cryosphere (Outline) Land Surface Sea Ice Land Ice
 Land Surface Sea Ice Land Ice") Lecture 5: Land Surface and Cryosphere (Outline) Earth s Climate System Solar forcing Land Surface Sea Ice Land Ice Atmosphere Ocean Land Solid Earth Energy, Water, and Biochemistry Cycles (from Our Changing
Lecture 5: Land Surface and Cryosphere (Outline) Earth s Climate System Solar forcing Land Surface Sea Ice Land Ice Atmosphere Ocean Land Solid Earth Energy, Water, and Biochemistry Cycles (from Our Changing
Don t like the weather? Wait ten minutes. has been a phrase used by many in the Great
 Climate Change in the Great Lakes Michael John Michalek Don t like the weather? Wait ten minutes. has been a phrase used by many in the Great Lakes region. With weather and temperature extremes being pushed
An ENSO-Neutral Winter
 An ENSO-Neutral Winter This issue of the Blue Water Outlook newsletter is devoted towards my thoughts on the long range outlook for winter. You will see that I take a comprehensive approach to this outlook
Weather Atmospheric condition in one place during a limited period of time Climate Weather patterns that an area typically experiences over a long
 Weather Atmospheric condition in one place during a limited period of time Climate Weather patterns that an area typically experiences over a long period of time Many factors influence weather & climate
How Will the Colorado Run? The Colorado River in a Warmer World
 How Will the Colorado Run? The Colorado River in a Warmer World The Future of the Colorado River October 13, 2018 Brad Udall Senior Scientist/Scholar Colorado State University Bradley.Udall@colostate.edu
FINAL EXAM PRACTICE #3: Meteorology, Climate, and Ecology
 FINAL EXAM PRACTICE #3: Meteorology, Climate, and Ecology 1. Clay is watching the weather to prepare for a trip to the beach tomorrow. The forecast predicts that a low-pressure system will move in overnight.
PRECIPITATION. Last Week Precipitation:
 12/3/2014 NIDIS Drought and Water Assessment PRECIPITATION The images above use daily precipitation statistics from NWS COOP, CoCoRaHS, and CoAgMet stations. From top to bottom, and left to right: most
-Assessment of current water conditions. - Precipitation Forecast. - Recommendations for Drought Monitor
 April 20 th, 2010 -Assessment of current water conditions - Precipitation Forecast - Recommendations for Drought Monitor 7 Day Precipitation 12-18 April 2010 Month-to-Date Precipitation 1-28 March 2010
NIDIS Weekly Climate, Water and Drought Assessment Summary. Upper Colorado River Basin
 NIDIS Weekly Climate, Water and Drought Assessment Summary Upper Colorado River Basin August 3, 2010 Precipitation and Snowpack Fig. 1: July precipitation in inches Fig. 2: July precip as percent of average
Global Atmospheric Circulation
 Global Atmospheric Circulation Polar Climatology & Climate Variability Lecture 11 Nov. 22, 2010 Global Atmospheric Circulation Global Atmospheric Circulation Global Atmospheric Circulation The Polar Vortex
Supplement of Carbon stocks and fluxes in the high latitudes: using site-level data to evaluate Earth system models
 Supplement of Biogeosciences, 14, 5143 5169, 2017 https://doi.org/10.5194/bg-14-5143-2017-supplement Author(s) 2017. This work is distributed under the Creative Commons Attribution 3.0 License. Supplement
The Atmosphere. All weather occurs here 99% of water vapor found here ~75 % of total mass of the atmosphere
 The Atmosphere Structure/Layers Contains 4 major layers See E.S.R.T pg 14 o Troposphere All weather occurs here 99% of water vapor found here ~75 % of total mass of the atmosphere o Stratosphere Contains
Becky Bolinger Water Availability Task Force November 13, 2018
 Colorado Climate Center WATF Climate Update Becky Bolinger Water Availability Task Force November 13, 2018 COLORADO CLIMATE CENTER Water Year 2018 Colorado s Climate in Review COLORADO CLIMATE CENTER
Winter. Here s what a weak La Nina usually brings to the nation with tempseraures:
 2017-2018 Winter Time again for my annual Winter Weather Outlook. Here's just a small part of the items I considered this year and how I think they will play out with our winter of 2017-2018. El Nino /
NIDIS Weekly Climate, Water and Drought Assessment Summary. Upper Colorado River Basin September 27, 2011
 NIDIS Weekly Climate, Water and Drought Assessment Summary Upper Colorado River Basin September 27, 2011 PrecipitaFon and Snowpack Fig. 1: Water year to date precipitafon as a percent of average. Fig.
Weather Atmospheric condition in one place during a limited period of time Climate Weather patterns that an area typically experiences over a long
 Weather Atmospheric condition in one place during a limited period of time Climate Weather patterns that an area typically experiences over a long period of time Many factors influence weather & climate
Weather and Climate Summary and Forecast April 2018 Report
 Weather and Climate Summary and Forecast April 2018 Report Gregory V. Jones Linfield College April 4, 2018 Summary: A near Miracle March played out bringing cooler and wetter conditions to the majority
Champaign-Urbana 1999 Annual Weather Summary
 Champaign-Urbana 1999 Annual Weather Summary ILLINOIS STATE WATER SURVEY 2204 Griffith Dr. Champaign, IL 61820 wxobsrvr@sws.uiuc.edu Maria Peters, Weather Observer A major snowstorm kicked off the new
DOWNLOAD PDF SCENERY OF SWITZERLAND, AND THE CAUSES TO WHICH IT IS DUE.
 Chapter 1 : The Scenery of Switzerland (Sir John Lubbock - ) (ID) ebay The scenery of Switzerland and the causes to which it is due / Related Titles Series: Collection of British authors ; vol. These diseases
Lecture 7: The Monash Simple Climate
 Climate of the Ocean Lecture 7: The Monash Simple Climate Model Dr. Claudia Frauen Leibniz Institute for Baltic Sea Research Warnemünde (IOW) claudia.frauen@io-warnemuende.de Outline: Motivation The GREB
NIDIS Intermountain West Drought Early Warning System February 12, 2019
 NIDIS Intermountain West Drought Early Warning System February 12, 2019 Precipitation The images above use daily precipitation statistics from NWS COOP, CoCoRaHS, and CoAgMet stations. From top to bottom,
ESS 431 Principles of Glaciology ESS 505 The Cryosphere
 MID-TERM November 9, 2015 ESS 431 Principles of Glaciology ESS 505 The Cryosphere Instructions: Please answer the following 5 questions. [The actual 5 questions will be selected from these 12 questions
Weather Forecasts and Climate AOSC 200 Tim Canty. Class Web Site: Lecture 27 Dec
 Weather Forecasts and Climate AOSC 200 Tim Canty Class Web Site: http://www.atmos.umd.edu/~tcanty/aosc200 Topics for today: Climate Natural Variations Feedback Mechanisms Lecture 27 Dec 4 2018 1 Climate
NIDIS Intermountain West Drought Early Warning System April 24, 2018
 NIDIS Intermountain West Drought Early Warning System April 24, 2018 Precipitation The images above use daily precipitation statistics from NWS COOP, CoCoRaHS, and CoAgMet stations. From top to bottom,
How do glaciers form?
 Glaciers What is a Glacier? A large mass of moving ice that exists year round is called a glacier. Glaciers are formed when snowfall exceeds snow melt year after year Snow and ice remain on the ground
Proceedings, International Snow Science Workshop, Breckenridge, Colorado, 2016
 CHARACTERISTICS OF AVALANCHE RELEASE AND AN APPROACH OF AVALANCHE FORECAST- ING SYSTEM USING SNOWPACK MODEL IN THE TIANSHAN MOUNTAINS, CHINA Osamu ABE 1*, Lanhai LI 2, Lei BAI 2, Jiansheng HAO 2, Hiroyuki
Land Surface: Snow Emanuel Dutra
 Land Surface: Snow Emanuel Dutra emanuel.dutra@ecmwf.int Slide 1 Parameterizations training course 2015, Land-surface: Snow ECMWF Outline Snow in the climate system, an overview: Observations; Modeling;
Coupling Climate to Clouds, Precipitation and Snow
 Coupling Climate to Clouds, Precipitation and Snow Alan K. Betts akbetts@aol.com http://alanbetts.com Co-authors: Ray Desjardins, Devon Worth Agriculture and Agri-Food Canada Shusen Wang and Junhua Li
Rooster Comb Ridge Cornice Incident
 Rooster Comb Ridge Cornice Incident April 3, 2011 Date/time: Sunday, April 3, 2011 / ~12:45pm PDT Submitted by: Patty Morrison Stevens Pass Winter Resort Snow Safety; Mark Moore NWAC Place: High point