Hydrometeor Detection using CloudSat - an Earth Orbiting 94 GHz Cloud Radar
|
|
|
- Harvey Hood
- 5 years ago
- Views:
Transcription
1 Hydrometeor Detection using CloudSat - an Earth Orbiting 94 GHz Cloud Radar Roger Marchand 1, Gerald G. Mace 2, Thomas Ackerman 1 and Graeme Stephens 4 1. Joint Institute for the Study of the Atmosphere and Ocean, University of Washington 2. Department of Meteorology, University of Utah 3. Department of Atmospheric Sciences, Colorado State University Accepted J. of Atmos. Ocean. Tech., August
2 Abstract - In late April 2006, NASA launched CloudSat, an Earth observing satellite that uses a near-nadir-pointing millimeter-wavelength radar to probe the vertical structure of clouds and precipitation. The first step in using CloudSat measurements is to distinguish clouds and other hydrometeors from radar noise. In this article we describe the operational CloudSat hydrometeor detection algorithm, discuss difficulties due to surface clutter, and show several examples from the early mission. We also provide a preliminary comparison of the CloudSat hydrometeor detection algorithm with lidarbased results from the Cloud-Aerosol Lidar and Infrared Pathfinder Satellite Observation (CALIPSO) satellite. 2
3 1. Introduction Clouds play a major role in Earth energy and water cycles. They cool the earth by reflecting sunlight back to space and warm the earth by absorbing and reemitting thermal radiation. By modulating the distribution of heating within the atmosphere and at the surface, clouds fundamentally influence the circulation of the atmosphere and oceans (Stephens et al. 2002). Much of our current knowledge of global cloud properties comes from the study of satellite-based visible and infrared passive imager data, collected over the past several decades. This imager perspective is now being enhanced with data from satellite-based radar and lidar systems that provide range-resolved data on the vertical structure of clouds and aerosols. In late April 2006, the National Aeronautics and Space Administration (NASA) launched the CloudSat and CALIPSO satellites. CloudSat uses a near nadir-pointing millimeter-wavelength radar to probe the vertical structure of clouds and precipitation, while CALIPSO combines an active lidar instrument with passive infrared and visible imagers to probe the vertical structure and properties of thin clouds and aerosols. CALIPSO and CloudSat are separate satellites that fly in formation with three other satellites (Aqua, Aura, and PARASOL). Together, these satellites are part of a constellation of Earth observing satellites known as the A-train. Thus, the CloudSat observations, while of great interest by themselves, are also part of a larger observational strategy to understand the Earth climate system (Stephens et al. 2002). The first step in using CloudSat observations is to distinguish clouds and other hydrometeors from radar noise. The CloudSat project routinely generates a cloud mask (described in section 2) that indicates which radar observations are likely hydrometeors 3
4 and provides a rough estimate of the likelihood that a given detection is false. Here we describe the CloudSat hydrometeor detection algorithm, discuss difficulties due to surface clutter and show several examples from the early mission. We also provide a preliminary comparison of the CloudSat hydrometeor detection algorithm with lidarbased results from CALIPSO. The CloudSat radar does not scan, but generates a curtain or two-dimensional crosssection through the atmosphere as the satellite moves along its orbital trajectory. In this article we refer to each element in this two-dimensional cross-section as a range bin. The radar transmits pulses with an approximate duration of 3.3 μs and thus measures cloud and precipitation reflectivity with an effective vertical range resolution of approximately 480 m. The measured return power, however, is sampled at a rate equivalent to about 240 m in range, that is, the measured data is two times over sampled. Pulses are averaged about 0.16 s along the nadir track, giving an effective field of view of approximately km in each radar profile. The minimum detectable signal from the CloudSat radar is still under evaluation, but early results show that it is slightly exceeding expectations with a sensitivity of about -30 dbz 1. 1 The sensitivity (sometimes also referred to as the minimum detectable signal) is defined as the point where the radar noise power equals the target power. Because the scattered power from distributed hydrometeors decreases as the distance from the radar squared and the noise power is reduced by the square root of the averaging time, the sensitivity is a function of the distance from the radar and the averaging time. As such, any expression of radar sensitivity should be accompanied by a reference range and averaging interval. CloudSat flies more than 700 km above the Earth surface (which can be taken as the reference range). Do to this large distance; the change in sensitivity over the troposphere is negligible. 4
5 2. Cloud Mask and Detection Algorithm a. Description of 2B-GEOPROF product The purpose of the CloudSat hydrometeor detection algorithm is to identify when the measured radar return power is likely to be due to scattering by clouds or other hydrometeors and when it is likely to contain only noise. The result of the operational algorithm is a cloud mask, which is stored in the CloudSat operational 2B-GeoProf data product. The cloud mask contains a value between 0 and 40 for each range bin with values greater than 5 indicating the location of likely hydrometeors. Increasing values indicate a reduced probability of a false detection, as summarized in Table 1. In addition to the cloud mask, this product contains the radar reflectivity (i.e., the calibrated measured return power), an estimate of gas absorption due to oxygen and water vapor on the observed reflectivity, and several quality indicator flags. Unlike typical weather radars, which operate at much longer wavelengths and are primarily designed to detect rain rather than clouds, the effect of water vapor on CloudSat observed reflectivity can be significant. Two-way attenuation from the surface to the satellite of more than 5 dbz is not unusual in the tropics. No estimate of loss in reflectivity due to absorption or scattering by hydrometeors is included in GeoProf, and users are cautioned that losses of 10 db/km or higher are possible with large liquid water contents. At times, the CloudSat radar is fully attenuated, or attenuated to the point where multiple-scattering dominates the measured return power (Mace et al. 2007). The cloud mask, reflectivity-field, and gaseous absorption are all provided on a height grid with 125 vertical range bins, where the CloudSat range bin closest to mean sea level 5
6 has been placed in vertical bin 105. The location of the range bin that is closest to the actual surface location is also provided. b. Description of the hydrometeor detection algorithm The CloudSat hydrometeor detection algorithm is similar to the algorithm developed by Clothiaux et al. (1995 and 2000) but with two significant changes. These changes are (1) a power probability weighting scheme and (2) an along-track integration scheme. The along-track integration scheme helps identify targets that are too weak to be detected at full resolution (0.16s) but which can be detected through along-track (temporal) averaging of the data. A schematic of the detection algorithm is given in Figure 1. The input to the routine is the raw radar measured return power ( P raw ), provided in the Level 1B CPR data product. An estimate of the mean and variance of the radar measured noise power is determined using the measured return power from the stratosphere where the presence of any hydrometeors such as polar stratospheric clouds would have a volume integrated backscatter cross-section much less than the detection threshold of the radar. Therefore, any power in these range bins is due primarily to microwave emission by the radar components, but also contains contributions from microwave emission by the Earth surface and gases such as water vapor in the atmospheric column. The mean noise power ( n P ) and its standard deviation (! ) at each along-track sample are calculated using a Pn moving average filter that is ten range bins in the vertical and two along-track bins wide. An initial set of hydrometeor detections is determined by comparing the target power ( P T Praw! Pn = ) with! P. Any range bin where P n T >! P potentially contains n 6
7 backscattered power due to hydrometers. However, because of random fluctuations in the noise (which is Gaussian distributed), there is about a 16% chance that any range bin will have P >! due solely to noise; i.e., a potential false detection. T Pn The detection algorithm starts by creating an initial cloud mask (with the same dimensions as the input return power matrix) with values ranging from zero to forty. For range bins where! < 2, the cloud mask is set to a value of 20; if P P n T <! Pn 2! P " P n T < 3! P n, the mask is set to 30; if P T " 3! P the mask is set to 40; otherwise it is n set to zero. We reserve values of 10 or less in the cloud mask to indicate clutter or the detection of clouds with signal power P T less then! P, which we discuss momentarily. n To reduce the occurrence of false detections (which are uniformly randomly distributed) and to identify reliably range bins with hydrometeors whose P T is not much different from P n, a spatial box-filter is applied. Following Clothiaux et al. (1995), a box is centered over each range bin of a size N w (range bins along track) by N h (range bins in the vertical). We then count the number ( N 0 ) of range bins in the box where P T >!, not counting the center range bin. If P n is Gaussian distributed and P n independent in each range bin, the probability (p) of any particular configuration with N 0, of the total ( N T = N wn h! 1) range bins would have a P T >! P solely because of n random noise is less than or equal to, p " G( L) 0.16 N 0 ( ) 0.84 N T #N ( 0 ) (1) where G is the probability that the center pixel could be a false detection for a cloud mask value of level L (G(0) = 0.84, G(20) = 0.16, G(30)=0.028, G(40)=0.002). 7
8 We expect that hydrometeor occurrence is highly spatially correlated over spatial scales of N w by N h range bins, and it is likely that, if a cloud is present, many range bins in the box will contain significant backscatter power (i. e., P >! ). Thus, if p given by T Pn Eq. 1 is found to be less than some threshold value (i. e., p < pthresh ), then the center range bin is unlikely to be noise and a hydrometeor (or other target) is likely present. In this situation, the cloud mask for the center range bin is then set to a value of 20 if it was zero in the initial cloud mask; otherwise the value in the initial cloud mask is retained. Likewise, if p > pthresh, then the measured power could well be noise and the cloud mask is set to zero, regardless of the initial cloud mask value. Following Clothiaux et al. (1995) this box filter is applied to the data several times in succession. In each pass of the box filter some nominally false-detections are removed, and the effect of removing these detections is propagated to nearby pixels in the next pass. After a few passes one begins to remove more cloud (i.e. generate more failed detections) than to remove true false-detections. Like Clothiaux et al. we found 2 or 3 passes appeared nominal. The algorithm described up to this point is identical to that given by Clothiaux et al. (1995) except for the (center pixel) power weight in equation (1), that is, the factor G. We will discuss the purpose of the power weight in section 2c. Having visually examined data from eight aircraft flights and months worth of ground-based radar data (both modified to look like less-sensitive CloudSat measurements, including the oversampling), as well as early mission CloudSat observations, we have found that, p thresh = 0.16 N thresh ( ) 0.84 N T "N thresh ( ) (2) 8
9 with N w = 7, N h = 5, N thresh = 20 ( or equivalenlty p thresh ~ ) and three passes of the box filter produces good results, by which we mean that the algorithm is stable and appeared to produce few failed detections and a low rate of false detections. These filter parameters will be periodically evaluated throughout the CloudSat mission, but are not expected to change. For the algorithm to be stable, Nthresh much be chosen larger than ½ x ( N h -1) x N w or 14 in our configuration. To understand this, imagine that we have a perfectly flat strongly reflecting cloud many kilometers wide and examine a range bin directly above the cloud layer. In this case, the bottom rows of the box filter will all have significant power so we will have a value for N 0 of at least ½ x ( N h -1) x N w. Therefore, if we do not choose Nthresh larger than this value, we will always mark any range-bin above the cloud layer ON (a positive detection), even if the range bin contains no cloud. Further, when we apply the filter repeatedly the cloud will artificially expand. In application we also don t want a few false positives above the cloud boundary to falsely activate a clear range-bin. Choosing N thresh = 20 means 6 additional range bins must have significant power (which will happen by chance only about 10% of the time for our configuration with 21 bins above the cloud boundary). We could choose Nthresh to be larger than 20 to reduce the false detections, but we also don t want to fail to detect true cloud-filled range bins. For example, imagine a perfectly square cloud and examine the bin containing the corner of the cloud. The corner has N o = ¼ x ( N +1) x ( N +1) = 15. As a result, the h w algorithm will tend to indicate corners of true clouds are likely false detections. The tendency to remove corners is partially corrected by the power weighting scheme in the 9
10 case of clouds with high signal to noise (as will be shown in section 2c). Nonetheless one wants to set Nthresh low to minimize failed detections. To improve the detection capability, the CloudSat algorithm is designed to average the raw return power in the along-track direction. The purpose of this portion of the algorithm is to find condensate that is horizontally extensive (well beyond the size of the single radar profile) but below the single-profile sensitivity limit of the radar. We used four levels of along track averaging with 3, 5, 7 and 9 bin wide averaging windows. At each level, a separate cloud mask is created and merged in sequence, starting with the cloud mask created without any along track averaging. That is, we create a new cloud mask based on 3-bin along track averaging and then merge this 3-bin-cloud-mask with a cloud mask created without any along tracking averaging (what one might call a 0-bincloud-mask). We then create a cloud mask based on 5-bin along track averaging and merge this 5-bin-cloud-mask with the already combined 3-bin + 0-bin mask, etc. By applying a moving average to the data, the noise and target power become increasingly spatially correlated, thereby violating the independence assumption used in the spatial filter, Eq. 1. By trial and error, we found that using along-track averages of 3, 5, 7, and 9 bins for CloudSat required increasing N thresh (to compensate for the additional correlation) to values of 23, 25, 27, and 29, respectively. In addition to increasing N thresh, we also only allow range bins to be marked as containing a likely hydrometeor in the moving averaged cloud masks if they initially contain a significant return (i. e., P >! ). Thus, unlike the cloud mask created without along track averaging, no range T P n bin in the 3-bin-average mask can have a value greater than zero simply because it is surrounded by other likely detections. 10
11 In order to merge each new moving-average mask with a previous mask, the new mask is compared with a reduced resolution version of the previous mask. This reduced resolution previous mask is constructed by taking a moving-average of the previous mask. The merged or combined mask is then given by the previous mask plus those range bins found to have both (a) values greater than zero in the new mask and (b) values of zero in the reduced resolution version of the previous mask. This last step prevents objects identified in the previous mask from being artificially expanded by the movingaverage process. The new detections are given a cloud mask value of 11 minus the mask level number (which varies from 1 up to 4). Thus, cloud mask values of 6 to 10 indicate weak targets and specify the number of along-track bins averaged. Finally, after all levels are complete, the cloud mask is run through the spatial box filter a final time. This last filtering does allow pixels to be turned ON because of position (e.g., if a seemingly cloud-free pixel is completely surrounded by likely detections). c. Simple test results Figure 2 shows the results of applying the hydrometeor detection algorithm of section 2b to a simple test pattern. The test pattern, shown in Panel 2a, consists of a Gaussian noise background (with uncorrelated noise in each range bin), a sequence of seven square targets (with sides ranging from 100 bins to only 3 bins long) and three line targets with widths of 1, 2, and 4 bins. In this first test, the targets are strong with a signal level set to 10 times! P. This is a strong signal, such that if we were constructing a cloud mask n based on simple threshold of the observed signal in each bin, we would be 99.99% confident that these bins contained a cloud. Panel 2b shows the cloud mask where 11
12 values of 40 are shown in white and those with values less than 40 in black. Values of 40 indicate a strong detection (at least 3 times! P ). Panel 2b shows that the hydrometeor n detection algorithm does an excellent job; detecting all seven of the square targets and two of the three line targets with almost no false detections (at level 40). The algorithm does not find the line target that is only one pixel wide, even though the signal is strong, because the spatial filter requires a greater level of spatial correlation than is present for the one-pixel wide line. CloudSat measurements are two times oversampled in the vertical, so all strong signals will occupy at least two vertical range bins. Panel 2c shows the cloud mask with values of 20 or more given in white and Panel 2d shows the cloud mask with all detections, including those found with along-track averaging. Not surprisingly, we observe an increase in the number of false detections at these lower confidence levels. In both cases, noise near the true targets tends to pass through the spatial filtering. The along-track averaging scheme (cloud mask values between six and ten), in particular, is designed to be aggressive in finding possible targets, and so also tends to identify clusters of higher-than-average noise. Earlier we mentioned that the CloudSat scheme is similar to the algorithm of Clothiaux et al. (1995) except that Clothiaux considered all detections as binary (either yes or no), while our equation (1) takes into account strength of the measured power. The power weighting makes it more difficult to remove range bins with large signal to noise ratios from the cloud mask. This reduces the tendency of the Clothiaux algorithm to round-off the edges of clouds. The rounding occurs because there is an insufficient number of cloud filled bins near the corner of objects to prevent the spatial filter from removing the edges. Figure 3 shows the results of applying the hydrometeor detection 12
13 algorithm without the power weighting to the same test data shown in Figure 2a. A similar effect is demonstrated in Figure 6 of Clothiaux et al. (1995). Comparing Figure 3 with Figure 2b shows that only five of the seven test squares are identified. The 3x3 and 5x5 squares are lost entirely, while the other squares are rounded. The 2- and 4- pixel wide line targets are detected, but the ends of the lines are also rounded. Figure 4 summarizes the performance of the hydrometeor detection algorithm for this simple test, providing the number of false detections (range bins where there is no actual target, but the hydrometeor detection algorithm indicated there likely is a target) and the number of failed detections (range bins where there is a target, but the detection algorithm indicated none was likely). The false detections and failed detections (sometime referred to as false negatives), are shown as a function of the cloud mask confidence values. Without the power weighting, more than 7% of the target bins are not detected, however, on the positive side, there are essentially no false detections. With the power weighting scheme, only a small percentage of targets are missed, and almost all of these missing pixels are the line target that was only one range bin wide. The false detections with the power weighting scheme are nearly zero at confidence level 40, and even with the along-track averaging remain less than 0.5% (by volume). It should be pointed out that Clothiaux et al. (1995) wanted only a simple yes/no cloud mask and, for their application, a minimum of false detections. They were less concerned with missing detections and specifically noted the conservative nature of the cloud mask they created, which they estimated could be missing as much as 15% of detectable hydrometeors. 13
14 Figures 5 and 6 demonstrate the performance of the CloudSat scheme for the same simple target set used in Figure 2, but the target power ( P = P! P ) has been reduced to 2 times and 0.5 times the standard deviation in the noise power (! ), respectively. This is equivalent to a target power ( P = P! P ) that is 3 db above and 3 db below!. P n T In Figure 5, we see that random noise fluctuations increase the total measured power such that some of the target bins are identified with high confidence (mask level = 40), even though none of the target bins actually have a strong signal. At mask level 20, five raw n T raw n Pn of the seven target squares and most line targets are found. Using the along-track averaging (mask level > 5) all seven targets are found, although their size is exaggerated because the along-track averaging effectively reduces the resolution of the measured power and cloud mask. The targets as shown in Figure 6 are extremely weak. The hydrometeor detection algorithm can only find the targets using the along-track averaging. As shown in panel d, the mask is able to identify the presence of five of the seven target squares and much of the line targets (Panel d). There is not enough power in the along-track direction (horizontal) to make the small squares detectable because they are not sufficiently extensive targets. After running this test many times (thereby varying the pattern of the background noise), the percentage of missed detections was found to vary from 9 to 15 % and the false detections varied from 0.6 to 1.2 % (by volume). Note that the along-track algorithm doesn t maintain the sharp boundaries of the target squares. In part, this is because the along-track scheme only averages in the alongtrack direction. Given the 480 m vertical resolution of CloudSat, averaging in the vertical 14
15 does not yield much benefit and makes spatial filtering problematic. However, the algorithm described here could be modified to take advantage of vertical averaging for radars with higher vertical resolution or greater over-sampling rates. d. Surface clutter The nature of the CloudSat measurements near the surface is an important issue. The outgoing radar pulse is not a perfect square wave, but has a finite rise time. Because the surface is typically two to five orders of magnitude more reflective than hydrometeors, interaction between the surface and the edge of the radar pulse (which extends outside the nominal 480 m resolution volume) can contribute significant signal relative to that of potential near-surface hydrometeors. Figure 7 shows an estimate of the clear-sky observed return power for a typical orbit 2. Measurements in the range bin closest to the surface and, because of oversampling, the bin directly above this bin, are expected to be dominated by the surface return. Figure 7 demonstrates that the surface clutter unfortunately extends into the second, third and fourth bins above the surface. It is only for the fifth range bin (~ 1.2 km) above the surface that the signal returns approximately to the nominal sensitivity. 2 At the beginning of the CloudSat mission, the radar was unknowningly pointed 1.7 degrees off nadir. This was corrected starting with orbit 1023, and the radar pointed directly towards nadir. However, it was found that pointing directly at nadir increased the surface reflectance and the effect of surface clutter approximately 10 db due to specular reflection. Thus, starting with orbit 1595 (August 15 at 20 UTC) the instrument was set to point 0.16 degrees of nadir. This angle put the specular reflection in the first antenna null and reduced the surface clutter to previous levels. Data from these time periods is referred to as epic E 00, 01, and 02 (given in each file name), respectively. Data shown here is typical for data in epic 00 and the data now being collected in epic
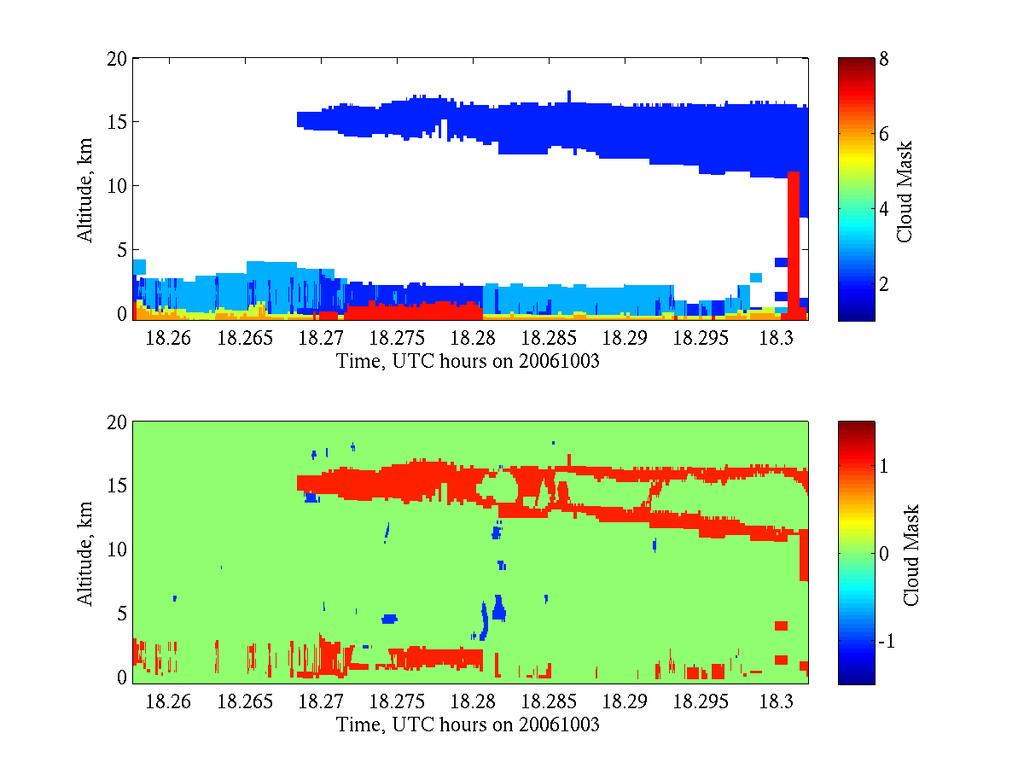
16 As a result of the surface contamination, all cloud mask detections below roughly the 99 th percentile of the clear-sky return (dashed lines in Figure 7) are currently being set to a value of 5, to indicate there is return power above the radar noise floor but the signal is indistinguishable from surface clutter. While this conservative threshold should keep the false detection rate (by volume) below 1%, it also means that typically only rain and heavy drizzle can be detected in the third bin above the surface (~ 720 m) and moderate drizzle in the fourth bin (~ 860 m). The percentage of false detections will also be larger between the surface and about 2 km, than above 2 km. Initial estimates suggest the false-detection rate is about twice as high below 2km as above it. (Note the values derived in section 3 and given in table #1 include all altitudes). Subtracting an estimate of the surface clutter from the total measured return power in the second through fourth range bins above the surface is currently being investigated and will be included in the next version of the data product (R04). Preliminary assessment of such a clutter rejection algorithm shows reductions in clutter of db over ocean surfaces. 3. Examples from CloudSat and CALIPSO. Figures 8, 9 and 10 show examples of CloudSat observed reflectivity along with the cloud mask obtained using the procedure described in section 2. Each example consists of 1000 profiles. The first example, Figure 8, consists primarily of a high-thin cirrus cloud that increases in thickness from left to right. In the CloudSat cloud mask (panel b), the detections that result from the along-track integration scheme (values of 10 or less) are represented by the light blue (cyan) color. The full extent of this cirrus layer is more 16
17 readily apparent from CALIPSO lidar observations. Panels c and d shows the CALIPSO lidar 532 nm total backscattering and derived vertical feature mask (VFM) (Vaughan et al. 2004). CALIPSO is a separate satellite from CloudSat, but flies along nearly the same orbit path, about 20 seconds behind CloudSat. The CALIPSO data in Figure 8 are plotted for the same latitude and longitude range as shown for CloudSat. The CALIPSO 532 nm lidar data shows a sharply defined cirrus cloud as well as scattering in the boundary layer by a mixture of cloud and aerosols. The CALIPSO data shown here are the first publicly released data (Prov-V1-10) and are of only provisional quality. The CALIPSO feature mask identifies where there is backscatter from cloud or aerosol particles and tries to differentiate between these feature types. Blue (value 2) indicates a cloud, cyan (value 3) indicates aerosol, and red (value 7) indicates areas where the lidar is totally attenuated. The identification of cloud in the boundary layer by the lidar is somewhat noisy, except near the middle of the image where there are distinctive water layers and the lidar is attenuated before reaching the surface. CloudSat, at best, weakly detects some of the boundary layer cloud. In order to compare the CloudSat and CALIPSO cloud masks directly, on a rangebin-by-range-bin basis, we have mapped the CALIPSO feature mask onto the CloudSat grid. The mapping is accomplished by first locating the nearest CALIPSO profile (in latitude and longitude) to each CloudSat profile. Based on the latitude and longitude coordinates supplied by each satellite project, the nearest CALIPSO profile typically intersects the surface within about 1 km of the CloudSat profile. Despite this level of collocation (1 km in space and 20 seconds in time), there are places (though not in this example) where offsets are clearly apparent. Because CALIPSO vertical resolution is 17
18 higher than CloudSat, we next locate the set of CALIPSO range bins within the 480 m CloudSat resolution volume. The Calipso lidar gathers data at about 333 m horizontal and 30 m vertical resolution, but the data is averaged to 1 km horizontal and 60 m vertical between 8.2 and 20 km altitude. If any of the CALIPSO range bins in this set has a value of 2 in the associated vertical feature mask, we set the mapped-calipso-cloud-mask to a value of 2 (meaning cloud present). Otherwise, we set the mapped-calipso-cloudmask to the largest value in the feature mask set. To compare the masks directly, we then difference a binary version of the CloudSat mask where all range bins with a cloud mask value > 5 are set to one and zero otherwise with a binary version of the CALIPSO-cloud-mask. In the binary CALIPSOcloud-mask all range bins with a value of 2 or (where the binary CloudSat mask is one and the CALIPSO-mask has a value of 3 or 7) are set to one and zero otherwise. The later condition (given in parenthesis) on the CALIPSO-mask prevents areas where the lidar is attenuated or has falsely identified aerosols rather than cloud from being considered cloud-free. The difference of the binary cloud masks (CALIPSO-CloudSat) is shown in Figure 8 panel e (bottom panel). Range bins where CALIPSO detected a cloud but CloudSat did not, appear orange-red. The orange-red bins are failed detections by CloudSat. Dark blue bins, on the other hand, represent false detections; that is, range bins where CloudSat indicates the presence of hydrometeors is likely, but CALIPSO failed to detect them and most likely would have if they were present. Given its sensitivity limit, it is not surprising that CloudSat does not detect the entire cirrus layer. This limitation was understood from the genesis of the mission. Ultimately, retrievals of cloud particle size and condensate from CloudSat and CALIPSO (in 18
19 combination other A-train sensors) will be used to characterize the clouds that are detected by CloudSat and those are not. This example was selected to highlight the strengths and weakness of the along-track integration scheme. While the along track integration scheme effectively extends the sensitivity of the CloudSat radar for horizontally extensive clouds, it also introduces a sizeable number of false detections. For this particular scene, approximately 20% of all the CloudSat detections with a cloud mask value of 10 or less are false detections. We have analyzed 16 full orbits of data and found that, for any given orbit, 35% to 65% of the CloudSat detections due to the along-track integration scheme are false detections compared to the preliminary CALIPSO operational vertical feature mask. The mean value for all analyzed orbits is about 44%. The percentage of false detections for all the CloudSat cloud mask confidence levels are shown in Table 1 (fourth column). Figure 9 shows a similar set of panels to figure 8, for a scene composed of developing convection and boundary layer clouds. The CALIPSO lidar (panel c and d) is only able to penetrate a short distance into the convective anvil. The CloudSat radar is able to penetrate through the anvil, revealing various structural elements including some cumulus congestus forming beneath the anvil. CALIPSO also reveals boundary layer clouds on both side of the convective region. On the left side, the boundary layer cloud tops are sloping upward towards the region of active convection. CloudSat is able to detect some of the boundary layer cloud mostly the cloud nearer the convective region but much of this cloud goes undetected because of the cloud s low radar reflectivity and the presence of surface clutter in the CloudSat observations. 19
20 The cloud-mask difference plot (Figure 9 panel e) shows a line of blue and orange-red around much of the anvil, indicating both false and failed detections around this boundary. Some of these apparent detection errors may well be a result of the temporal and spatial mismatch between the radar and lidar observations. However, some of the false detections may also be due to the finite rise time (shape) of the radar pulse and oversampling. In much the same way as the surface return spreads into the radar bins two to four bins above the surface (see Figure 7) strong reflectivity boundaries can be expected to generate a similar effect, albeit a factor of weaker. CloudSat frequently obtains elegant cross sections through frontal cloud systems, as shown in Figure 10. This example highlights the complementary nature of the CALIPSO lidar and CloudSat radar observations. As is often the case, the lidar shows a region of thin cloud which is not sufficiently reflective (at microwave frequencies) for CloudSat to detect. The fact that CloudSat cannot detect this cloud is useful information which places upper bounds on the water content and effective particle size that this cloud may have. Throughout much of the upper portion of the cloud, both radar and lidar obtain good quality measurements which can be used in a combined radar-lidar retrieval technique (Donovan 2003). In optically thicker portions of the cloud system, the radar continues to provide insight into the vertical structure of the cloud well after the lidar is attenuated. The difference mask (Figure 10 panel e) shows a number of blue regions, indicating bins where the lidar was not attenuated but failed to detect clouds, well inside the cloud region detected by the radar. One of the difficulties observed with the provisional CALIPSO vertical feature mask is a tendency to fail in some instances to identify bins where the lidar has been fully (or nearly fully) attenuated. In order to reduce bias in our 20
21 false detection estimates (Table 1) that would be caused by unidentified regions of lidar attenuation, we added an additional threshold on the total 532 nm backscatter signal beyond that used by the CALIPSO project operational code. 4. Summary and Discussion The purpose of the operational CloudSat hydrometeor detection algorithm is to produce a cloud mask that identifies when the measured radar return power is likely to be due to clouds or other hydrometeors and when it is likely to contain only noise. The CloudSat operational cloud mask is stored in the CloudSat 2B-GeoProf data product and contains values between 0 and 40. Values greater than 5 indicate the location of likely hydrometeors, with increasing values indicating a reduced probability of false detection, as summarized in Table 1. Several examples of the CloudSat cloud mask were given in section 3. These examples highlight both strengths and weaknesses of the CloudSat data, as well as highlight the complementary nature of the CALIPSO lidar and CloudSat radar observations. The CloudSat cloud mask is performing largely as anticipated prior to satellite launch. The percent of false detections (as estimated by comparison with CALIPSO lidar observations) for weak detections (cloud mask levels up to 20) is meeting expectations. For strong detections (cloud mask levels 30 and 40) the false detection rates are low, but not quite as low as expected. Examination of difference masks such as shown in Figures 8, 9, and 10, indicate a mixture of false and failed detections around the boundaries of clouds, especially where there is a sharp cloud edge, such as near the anvil cloud in 21
22 Figure 9. Some of these apparent detection errors are likely the result of the temporal and spatial mismatch between the radar and lidar observations and the difference in bin resolution between the two instruments. Consequently, the estimated false and failed detection rates are likely to be overestimates. While the purpose of this paper was not to evaluate the CALIPSO vertical feature mask, we can comment on some aspects of these data. Overall, the feature mask worked well for our purposes. The most significant difficulty we encountered in this research was the tendency for the feature mask to sometimes flag cloud as aerosol (and vice versa) and to not flag some areas where the lidar was fully, or nearly fully, attenuated. Both of these difficulties can clearly be improved through construction of a joint radar-lidar cloud mask. Overall, the most significant difficulty with the CloudSat data is that surface clutter effectively reduces the radar sensitivity near the surface. Algorithms to improve hydrometeor detection within the surface clutter are under investigation, but the ability to detect hydrometeors below 1.2 km is likely to remain reduced from that above 1.2 km. Given its limited sensitivity and resolution and surface clutter difficulties, CloudSat is unable to detect much of the thin cloud identified by the CALIPSO lidar. For the preliminary test set examined here, the percentage of failed detections given as the number of failed detection divided by the total successful detections exceeded 35%. Ultimately, we plan to use retrievals of cloud particle size and condensate from CloudSat and CALIPSO in combination with other A-train sensors to characterize the microphysics of those clouds that are detected by CloudSat and those that are not. Nonetheless, it is 22
23 critical when using CloudSat data in model evaluations and science studies to carefully consider the effect of CloudSat resolution and detection capabilities. 23
24 References Donovan, D. P., 2003 Ice-cloud effective particle size parameterization based on combined lidar, radar reflectivity, and mean Doppler velocity measurements, J. Geophys. Research, 108 D18. Clothiaux, E. E., T. P. Ackerman, G. G. Mace, K. Moran, R. T. Marchand, M. A. Miller, B. E. Martner, 2000: Objective determination of cloud heights and radar reflectivities using a combination of active remote sensors at the ARM CART sites. J. Applied Meteor., 39, Clothiaux, E. E., M. A. Miller, B. A. Albrecht, T. P. Ackerman, J. Verlinde, D. M. Babb, R. M. Peters, and W. J. Syrett, 1995: An evaluation of a 94-GHz radar for remote sensing of cloud properties. J. Atmos. Oceanic. Technol., 12, Mace, Gerald G., Roger Marchand, Qiquing Zhang, and Graeme Stephens 2007 Global Hydrometeor Occurrence as Observed by CloudSat; Initial Observations from Summer 2006, Submitted Geophyscial Research Letters, January Stephens, GL; Vane, DG; Boain, RJ; Mace, GG; Sassen, K; Wang, Z; Illingworth, AJ; O'Connor, EJ; Rossow, WB; Durden, SL; Miller, SD; Austin, RT; Benedetti, A; Mitrescu, C, 2002: The Cloudsat Mission And The A-Train, Bull. Am. Meteorol. Soc., 83,
25 Vaughan, M., Young, S., Winker, D., Powell, K., Omar, A., Liu, Z., Hu, Y., and Hostetler, C. (2004). Fully automated analysis of space-based lidar data: an overview of the CALIPSO retrieval algorithms and data products. Proc. SPIE, 5575, pp
26 Table 1 Description of CloudSat cloud mask values, false detection rates, and percentage of false detections. The percent of false detection is given by 100 times the number of false detections divided by the total number of detections for the specified cloud mask value. Mask Value Meaning -9 Bad or missing radar data 5 Significant return power but likely surface clutter 6-10 Very weak echo (detected using along-track averaging) 20 Weak echo (detection may be artifact of % False Detections Goal Estimated % False Detection via CALIPSO comparison < 50 % 44 % < 16% 5 % spatial correlation) 30 Good echo < 2 % 4.3 % 40 Strong echo < 0.2 % 0.6 % 26
27 Table 2 Description of CALIPSO vertical feature mask, feature types. Value Feature Type 1 "clear air" 2 cloud 3 aerosol 4 stratospheric feature 5 surface 6 subsurface 7 no signal (totally attenuated) 27
28 List of Figures Figure 1 Cloud Masking Scheme Figure 2 CloudSat algorithm applied to test pattern, with test object target signal equal to 10 sigma, (a) input to detection algorithm (b) cloud mask confidence level greater than 30, (c) cloud mask confidence level greater than 20, (d) cloud mask confidence level greater than 0. Figure 3 As Figure 2b, except without center pixel power weighting scheme. Figure 4 Summary of failed detections (places where cloud mask indicates clear where there is signal) and false detections (places where cloud mask indicates clouds, but where only radar noise is present). Figure 5 Same as Figure 2, except with test object mean signal equal to 2 sigma. Figure 6 Same as Figure 2, except with test object mean signal equal to 0.5 sigma. Figure 7 Top panel: typical (estimated) surface clutter profile (orbit 1596). Bottom panel: Bin 0 is defined as the range bin whose center is closest to the surface. Because of oversampling, bin 1 may or may not directly overlap the surface. 28
29 Figure 8 Example of thin cirrus. (a) CloudSat radar reflectivity, (b) CloudSat cloud mask, (c) CALIPSO 532 nm total backscatter, (d) CALIPSO vertical feature mask (e) difference mask. In the difference mask, blue regions denote false detections, range bins where the CloudSat mask suggests hydrometeors are likely present but there is no detection in the CALIPSO feature mask (cloud or aerosol) nor does the CALIPSO feature mask indicate the lidar is attenuated. Orange-Red regions denote failed detections, range bins where the CALIPSO feature mask identifies clouds, but where CloudSat does not detect hydrometeors. Figure 9 Example of convection and boundary layer clouds. Panels same as figure 8 Figure 10 Example of frontal cloud system. Panels same as figure 8 29
30 Figure 1 Cloud Masking Scheme 30
 cloud mask confidence level greater than 30, (c) cloud mask confidence level greater than 20, (d) cloud mask confidence level greater than 0.")
31 a b c d Figure 2 CloudSat algorithm applied to test pattern, with test object target signal equal to 10 sigma, (a) input to detection algorithm (b) cloud mask confidence level greater than 30, (c) cloud mask confidence level greater than 20, (d) cloud mask confidence level greater than 0. 31
32 Figure 3 As Figure 2b, except without center pixel power weighting scheme. 32
33 Figure 4 Summary of failed detections (places where cloud mask indicates clear where there is signal) and false detections (places where cloud mask indicates clouds, but where only radar noise is present). 33
34 a b c d Figure 5 Same as Figure 2, except with test object mean signal equal to 2 sigma. 34

35 a b c d Figure 6 Same as Figure 2, except with test object mean signal equal to 0.5 sigma. 35
36 m range bin sampling with (2x oversampling) Surface Nominal 480 m resolution volume Figure 7 Top panel: typical (estimated) surface clutter profile (orbit 1596). Bottom panel: Bin 0 is defined as the range bin whose center is closest to the surface. Because of oversampling, bin 1 may or may not directly overlap the surface. 36

37 a b c d e 37
38 Figure 8 Example of thin cirrus. (a) CloudSat radar reflectivity, (b) CloudSat cloud mask, (c) CALIPSO 532 nm total backscatter, (d) CALIPSO vertical feature mask (e) difference mask. In the difference mask, blue regions denote false detections, range bins where the CloudSat mask suggests hydrometeors are likely present but there is no detection in the CALIPSO feature mask (cloud or aerosol) nor does the CALIPSO feature mask indicate the lidar is attenuated. Orange-Red regions denote failed detections, range bins where the CALIPSO feature mask identifies clouds, but where CloudSat does not detect hydrometeors. 38


39 a b c d e Figure 9 Example of convection and boundary layer clouds. Panels same as figure 8. 39


40 a b c d e Figure 10 Example of frontal cloud system. Panels same as figure 8 40
Hydrometeor Detection Using Cloudsat An Earth-Orbiting 94-GHz Cloud Radar
 APRIL 2008 M A R C H A N D E T A L. 519 Hydrometeor Detection Using Cloudsat An Earth-Orbiting 94-GHz Cloud Radar ROGER MARCHAND Joint Institute for the Study of the Atmosphere and Ocean, University of
On the Satellite Determination of Multilayered Multiphase Cloud Properties. Science Systems and Applications, Inc., Hampton, Virginia 2
 JP1.10 On the Satellite Determination of Multilayered Multiphase Cloud Properties Fu-Lung Chang 1 *, Patrick Minnis 2, Sunny Sun-Mack 1, Louis Nguyen 1, Yan Chen 2 1 Science Systems and Applications, Inc.,
Level 2 GEOPROF Product Process Description and Interface Control Document
 CloudSat Project A NASA Earth System Science Pathfinder Mission Level 2 GEOPROF Product Process Description and Interface Control Document Product: 2B-GEOPROF Product Version: P1_R05 Document Revision:
Probability of Cloud-Free-Line-of-Sight (PCFLOS) Derived From CloudSat and CALIPSO Cloud Observations
 Derived From CloudSat and CALIPSO Cloud Observations") Probability of Cloud-Free-Line-of-Sight (PCFLOS) Derived From CloudSat and CALIPSO Cloud Observations Donald L. Reinke, Thomas H. Vonder Haar Cooperative Institute for Research in the Atmosphere Colorado
Probability of Cloud-Free-Line-of-Sight (PCFLOS) Derived From CloudSat and CALIPSO Cloud Observations Donald L. Reinke, Thomas H. Vonder Haar Cooperative Institute for Research in the Atmosphere Colorado
Orbit and Transmit Characteristics of the CloudSat Cloud Profiling Radar (CPR) JPL Document No. D-29695
 JPL Document No. D-29695") Orbit and Transmit Characteristics of the CloudSat Cloud Profiling Radar (CPR) JPL Document No. D-29695 Jet Propulsion Laboratory California Institute of Technology Pasadena, CA 91109 26 July 2004 Revised
Orbit and Transmit Characteristics of the CloudSat Cloud Profiling Radar (CPR) JPL Document No. D-29695 Jet Propulsion Laboratory California Institute of Technology Pasadena, CA 91109 26 July 2004 Revised
EFFECTS OF ALONG-TRACK INTEGRATION ON DOPPLER VELOCITY BIAS WITH A SPACEBORNE CLOUD-PROFILING RADAR
 P3.11 EFFECTS OF ALONG-TRACK INTEGRATION ON DOPPLER VELOCITY BIAS WITH A SPACEBORNE CLOUD-PROFILING RADAR Akihisa Uematsu 1 *, Yuichi Ohno 1, Hiroaki Horie 1,2, Hiroshi Kumagai 1, and Nick Schutgens 3
Title: The Impact of Convection on the Transport and Redistribution of Dust Aerosols
 Authors: Kathryn Sauter, Tristan L'Ecuyer Title: The Impact of Convection on the Transport and Redistribution of Dust Aerosols Type of Presentation: Oral Short Abstract: The distribution of mineral dust
Lecture 19: Operational Remote Sensing in Visible, IR, and Microwave Channels
 MET 4994 Remote Sensing: Radar and Satellite Meteorology MET 5994 Remote Sensing in Meteorology Lecture 19: Operational Remote Sensing in Visible, IR, and Microwave Channels Before you use data from any
Remote Sensing in Meteorology: Satellites and Radar. AT 351 Lab 10 April 2, Remote Sensing
 Remote Sensing in Meteorology: Satellites and Radar AT 351 Lab 10 April 2, 2008 Remote Sensing Remote sensing is gathering information about something without being in physical contact with it typically
Improving the CALIPSO VFM product with Aqua MODIS measurements
 University of Nebraska - Lincoln DigitalCommons@University of Nebraska - Lincoln NASA Publications National Aeronautics and Space Administration 2010 Improving the CALIPSO VFM product with Aqua MODIS measurements
In Situ Comparisons with the Cloud Radar Retrievals of Stratus Cloud Effective Radius
 In Situ Comparisons with the Cloud Radar Retrievals of Stratus Cloud Effective Radius A. S. Frisch and G. Feingold Cooperative Institute for Research in the Atmosphere National Oceanic and Atmospheric
Cloud features detected by MODIS but not by CloudSat and CALIOP
 GEOPHYSICAL RESEARCH LETTERS, VOL. 38,, doi:10.1029/2011gl050063, 2011 Cloud features detected by MODIS but not by CloudSat and CALIOP Mark Aaron Chan 1,2 and Josefino C. Comiso 1 Received 18 October 2011;
APPENDIX 2 OVERVIEW OF THE GLOBAL PRECIPITATION MEASUREMENT (GPM) AND THE TROPICAL RAINFALL MEASURING MISSION (TRMM) 2-1
 AND THE TROPICAL RAINFALL MEASURING MISSION (TRMM) 2-1") APPENDIX 2 OVERVIEW OF THE GLOBAL PRECIPITATION MEASUREMENT (GPM) AND THE TROPICAL RAINFALL MEASURING MISSION (TRMM) 2-1 1. Introduction Precipitation is one of most important environmental parameters.
APPENDIX 2 OVERVIEW OF THE GLOBAL PRECIPITATION MEASUREMENT (GPM) AND THE TROPICAL RAINFALL MEASURING MISSION (TRMM) 2-1 1. Introduction Precipitation is one of most important environmental parameters.
Cloud Occurrence from the level 2B CloudSat- CALIPSO Cloud Mask Data
 Cloud Occurrence from the level 2B CloudSat- CALIPSO Cloud Mask Data Jay Mace and Qiuqing Zhang 1. Briefly introduce Geoprof-Lidar Product 2. Examine the vertical and horizontal distribution of cloud occurrence
Atmospheric Lidar The Atmospheric Lidar (ATLID) is a high-spectral resolution lidar and will be the first of its type to be flown in space.
 is a high-spectral resolution lidar and will be the first of its type to be flown in space.") www.esa.int EarthCARE mission instruments ESA s EarthCARE satellite payload comprises four instruments: the Atmospheric Lidar, the Cloud Profiling Radar, the Multi-Spectral Imager and the Broad-Band Radiometer.
www.esa.int EarthCARE mission instruments ESA s EarthCARE satellite payload comprises four instruments: the Atmospheric Lidar, the Cloud Profiling Radar, the Multi-Spectral Imager and the Broad-Band Radiometer.
Ground-based Validation of spaceborne lidar measurements
 Ground-based Validation of spaceborne lidar measurements Ground-based Validation of spaceborne lidar measurements to make something officially acceptable or approved, to prove that something is correct
Climatologies of ultra-low clouds over the southern West African monsoon region
 Climatologies of ultra-low clouds over the southern West African monsoon region Andreas H. Fink 1, R. Schuster 1, R. van der Linden 1, J. M. Schrage 2, C. K. Akpanya 2, and C. Yorke 3 1 Institute of Geophysics
A Suite of Retrieval Algorithms for Cirrus Cloud Microphysical Properties Applied To Lidar, Radar, and Radiometer Data Prepared for the A-Train
 P1R.15 A Suite of Retrieval Algorithms for Cirrus Cloud Microphysical Properties Applied To Lidar, Radar, and Radiometer Data Prepared for the A-Train Yuying Zhang * and Gerald G. Mace Department of Meteorology,
P1.6 Simulation of the impact of new aircraft and satellite-based ocean surface wind measurements on H*Wind analyses
 P1.6 Simulation of the impact of new aircraft and satellite-based ocean surface wind measurements on H*Wind analyses Timothy L. Miller 1, R. Atlas 2, P. G. Black 3, J. L. Case 4, S. S. Chen 5, R. E. Hood
EXPERIMENTAL ASSIMILATION OF SPACE-BORNE CLOUD RADAR AND LIDAR OBSERVATIONS AT ECMWF
 EXPERIMENTAL ASSIMILATION OF SPACE-BORNE CLOUD RADAR AND LIDAR OBSERVATIONS AT ECMWF Marta Janisková, Sabatino Di Michele, Edouard Martins ECMWF, Shinfield Park, Reading, U.K. Abstract Space-borne active
The Evaluation of CloudSat and CALIPSO Ice Microphysical Products Using Ground-Based Cloud Radar and Lidar Observations
 VOLUME 27 J O U R N A L O F A T M O S P H E R I C A N D O C E A N I C T E C H N O L O G Y MAY 2010 The Evaluation of CloudSat and CALIPSO Ice Microphysical Products Using Ground-Based Cloud Radar and Lidar
Relationships among properties of marine stratocumulus derived from collocated CALIPSO and MODIS observations
 Click Here for Full Article JOURNAL OF GEOPHYSICAL RESEARCH, VOL. 115,, doi:10.1029/2009jd012046, 2010 Relationships among properties of marine stratocumulus derived from collocated CALIPSO and MODIS observations
Lecture 4b: Meteorological Satellites and Instruments. Acknowledgement: Dr. S. Kidder at Colorado State Univ.
 Lecture 4b: Meteorological Satellites and Instruments Acknowledgement: Dr. S. Kidder at Colorado State Univ. US Geostationary satellites - GOES (Geostationary Operational Environmental Satellites) US
Overview of The CALIPSO Mission
 Overview of The CALIPSO Mission Dave Winker NASA-LaRC LaRC,, PI Jacques Pelon IPSL/CNRS, co-pi Research Themes Improved understanding of the Earth s climate system is a primary goal of the Scientific Community
Synergistic Use of Spaceborne Active Sensors and Passive Multispectral Imagers for Investigating Cloud Evolution Processes
 Trans. JSASS Aerospace Tech. Japan Vol. 12, No. ists29, pp. Tn_19-Tn_24, 2014 Topics Synergistic Use of Spaceborne Active Sensors and Passive Multispectral Imagers for Investigating Cloud Evolution Processes
Study of the Influence of Thin Cirrus Clouds on Satellite Radiances Using Raman Lidar and GOES Data
 Study of the Influence of Thin Cirrus Clouds on Satellite Radiances Using Raman Lidar and GOES Data D. N. Whiteman, D. O C. Starr, and G. Schwemmer National Aeronautics and Space Administration Goddard
Instantaneous cloud overlap statistics in the tropical area revealed by ICESat/GLAS data
 GEOPHYSICAL RESEARCH LETTERS, VOL. 33, L15804, doi:10.1029/2005gl024350, 2006 Instantaneous cloud overlap statistics in the tropical area revealed by ICESat/GLAS data Likun Wang 1,2 and Andrew E. Dessler
PARCWAPT Passive Radiometry Cloud Water Profiling Technique
 PARCWAPT Passive Radiometry Cloud Water Profiling Technique By: H. Czekala, T. Rose, Radiometer Physics GmbH, Germany A new cloud liquid water profiling technique by Radiometer Physics GmbH (patent pending)
Cluster analysis of tropical clouds using CloudSat data
 GEOPHYSICAL RESEARCH LETTERS, VOL. 34, L12813, doi:10.1029/2007gl029336, 2007 Cluster analysis of tropical clouds using CloudSat data Yuying Zhang, 1 Steve Klein, 1 Gerald G. Mace, 2 and Jim Boyle 1 Received
Interpretation of Polar-orbiting Satellite Observations. Atmospheric Instrumentation
 Interpretation of Polar-orbiting Satellite Observations Outline Polar-Orbiting Observations: Review of Polar-Orbiting Satellite Systems Overview of Currently Active Satellites / Sensors Overview of Sensor
GLAS Atmospheric Products User Guide November, 2008
 GLAS Atmospheric Products User Guide November, 2008 Overview The GLAS atmospheric measurements utilize a dual wavelength (532 nm and 1064 nm) transmitting laser to obtain backscattering information on
A HIGH RESOLUTION HYDROMETEOR PHASE CLASSIFIER BASED ON ANALYSIS OF CLOUD RADAR DOPLLER SPECTRA. Edward Luke 1 and Pavlos Kollias 2
 6A.2 A HIGH RESOLUTION HYDROMETEOR PHASE CLASSIFIER BASED ON ANALYSIS OF CLOUD RADAR DOPLLER SPECTRA Edward Luke 1 and Pavlos Kollias 2 1. Brookhaven National Laboratory 2. McGill University 1. INTRODUCTION
THIN CLOUD LENGTH SCALES USING CALIPSO AND CLOUDSAT DATA. A Thesis JEREMY EDWARD SOLBRIG
 THIN CLOUD LENGTH SCALES USING CALIPSO AND CLOUDSAT DATA A Thesis by JEREMY EDWARD SOLBRIG Submitted to the Office of Graduate Studies of Texas A&M University in partial fulfillment of the requirements
Objective Determination of Cloud Heights and Radar Reflectivities Using a Combination of Active Remote Sensors at the ARM CART Sites
 645 Objective Determination of Cloud Heights and Radar Reflectivities Using a Combination of Active Remote Sensors at the ARM CART Sites EUGENE E. CLOTHIAUX,* THOMAS P. ACKERMAN,* GERALD G. MACE, KENNETH
On the Limitations of Satellite Passive Measurements for Climate Process Studies
 On the Limitations of Satellite Passive Measurements for Climate Process Studies Steve Cooper 1, Jay Mace 1, Tristan L Ecuyer 2, Matthew Lebsock 3 1 University of Utah, Atmospheric Sciences 2 University
A description of hydrometeor layer occurrence statistics derived from the first year of merged Cloudsat and CALIPSO data
 JOURNAL OF GEOPHYSICAL RESEARCH, VOL. 114,, doi:10.1029/2007jd009755, 2009 A description of hydrometeor layer occurrence statistics derived from the first year of merged Cloudsat and CALIPSO data Gerald
Marchand et al. 2008, Comparison of MMF with CloudSat Accepted JGR 05/2008 p. 1. A Comparison of Simulated Cloud Radar Output
 Marchand et al. 2008, Comparison of MMF with CloudSat Accepted JGR 05/2008 p. 1 A Comparison of Simulated Cloud Radar Output from the Multiscale Modeling Framework Global Climate Model with CloudSat Cloud
REMOTE SENSING KEY!!
 REMOTE SENSING KEY!! This is a really ugly cover page I m sorry. Name Key. Score / 100 Directions: You have 50 minutes to take this test. You may use a cheatsheet (2 pages), a non-graphing calculator,
Q-Winds satellite hurricane wind retrievals and H*Wind comparisons
 Q-Winds satellite hurricane wind retrievals and H*Wind comparisons Pet Laupattarakasem and W. Linwood Jones Central Florida Remote Sensing Laboratory University of Central Florida Orlando, Florida 3816-
Remote Sensing of Precipitation
 Lecture Notes Prepared by Prof. J. Francis Spring 2003 Remote Sensing of Precipitation Primary reference: Chapter 9 of KVH I. Motivation -- why do we need to measure precipitation with remote sensing instruments?
Spatial correlation of hydrometeor occurrence, reflectivity, and rain rate from CloudSat
 JOURNAL OF GEOPHYSICAL RESEARCH, VOL. 117,, doi:10.1029/2011jd016678, 2012 Spatial correlation of hydrometeor occurrence, reflectivity, and rain rate from CloudSat Roger Marchand 1 Received 3 August 2011;
Figure 1: A summary of the validation strategy for C3VP incorporating ground truth (GT) and physical validation (PV).
 and physical validation (PV).") 3.3 THE CANADIAN CLOUDSAT CALIPSO VALIDATION PROJECT:EVALUATION OF SENSITIVITY AND SUB-PIXEL VARIABILITY OF CLOUDSAT DATA PRODUCTS D. Hudak 1 *, H. Barker 1, K. Strawbridge 1, M. Wolde 2, A. Kankiewicz
3.3 THE CANADIAN CLOUDSAT CALIPSO VALIDATION PROJECT:EVALUATION OF SENSITIVITY AND SUB-PIXEL VARIABILITY OF CLOUDSAT DATA PRODUCTS D. Hudak 1 *, H. Barker 1, K. Strawbridge 1, M. Wolde 2, A. Kankiewicz
USING DOPPLER VELOCITY SPECTRA TO STUDY THE FORMATION AND EVOLUTION OF ICE IN A MULTILAYER MIXED-PHASE CLOUD SYSTEM
 P 1.7 USING DOPPLER VELOCITY SPECTRA TO STUDY THE FORMATION AND EVOLUTION OF ICE IN A MULTILAYER MIXED-PHASE CLOUD SYSTEM M. Rambukkange* and J. Verlinde Penn State University 1. INTRODUCTION Mixed-phase
Convective Structures in Clear-Air Echoes seen by a Weather Radar
 Convective Structures in Clear-Air Echoes seen by a Weather Radar Martin Hagen Deutsches Zentrum für Luft- und Raumfahrt Oberpfaffenhofen, Germany Weather Radar Weather radar are normally used to locate
Relationships among cloud occurrence frequency, overlap, and effective thickness derived from CALIPSO and CloudSat merged cloud vertical profiles
 Click Here for Full Article JOURNAL OF GEOPHYSICAL RESEARCH, VOL. 115,, doi:10.1029/2009jd012277, 2010 Relationships among cloud occurrence frequency, overlap, and effective thickness derived from CALIPSO
l-l Lawrence ARM-GCSS Intercomparison Study of Single-Column Models and Cloud System Models October 27,1999
 Preprint UCRL-133576 ARM-GCSS Intercomparison Study of Single-Column Models and Cloud System Models R. T. Cederwall, D. J. Rodriguez, S. K. Krueger, D.A. Randall This article was submitted to gth Atmospheric
An Annual Cycle of Arctic Cloud Microphysics
 An Annual Cycle of Arctic Cloud Microphysics M. D. Shupe Science and Technology Corporation National Oceanic and Atmospheric Administration Environmental Technology Laboratory Boulder, Colorado T. Uttal
Backscatter Color Ratios of Cirrus Clouds Measured by the Cloud Physics Lidar
 Backscatter Color Ratios of Cirrus Clouds Measured by the Cloud Physics Lidar M. A. Vaughan 1, M. J. McGill, Z. Liu 3, Y. Hu 1, and R. E. Kuehn 4, and S. D. Rodier 4 NASA Langley Research Center, Hampton
Final Review Meteorology
 Final Review Meteorology Multiple Choice Identify the choice that best completes the statement or answers the question. 1. Which of the following is an example of climate? a. A sudden snowstorm resulted
Meteorological Satellite Image Interpretations, Part III. Acknowledgement: Dr. S. Kidder at Colorado State Univ.
 Meteorological Satellite Image Interpretations, Part III Acknowledgement: Dr. S. Kidder at Colorado State Univ. Dates EAS417 Topics Jan 30 Introduction & Matlab tutorial Feb 1 Satellite orbits & navigation
Projects in the Remote Sensing of Aerosols with focus on Air Quality
 Projects in the Remote Sensing of Aerosols with focus on Air Quality Faculty Leads Barry Gross (Satellite Remote Sensing), Fred Moshary (Lidar) Direct Supervision Post-Doc Yonghua Wu (Lidar) PhD Student
1. INTRODUCTION. investigating the differences in actual cloud microphysics.
 MICROPHYSICAL PROPERTIES OF DEVELOPING VERSUS NON-DEVELOPING CLOUD CLUSTERS DURING TROPICAL CYCLOGENESIS 4B.5 Nathan D. Johnson,* William C. Conant, and Elizabeth A. Ritchie Department of Atmospheric Sciences,
Comparison of the CALIPSO satellite and ground based observations of cirrus clouds at the ARM TWP sites
 JOURNAL OF GEOPHYSICAL RESEARCH, VOL. 116,, doi:10.1029/2011jd015970, 2011 Comparison of the CALIPSO satellite and ground based observations of cirrus clouds at the ARM TWP sites Tyler J. Thorsen, 1 Qiang
Assimilation of Satellite Cloud and Precipitation Observations in NWP Models: Report of a Workshop
 Assimilation of Satellite Cloud and Precipitation Observations in NWP Models: Report of a Workshop George Ohring and Fuzhong Weng Joint Center for Satellite Data Assimilation Ron Errico NASA/GSFC Global
11D.6 DIURNAL CYCLE OF TROPICAL DEEP CONVECTION AND ANVIL CLOUDS: GLOBAL DISTRIBUTION USING 6 YEARS OF TRMM RADAR AND IR DATA
 11D.6 DIURNAL CYCLE OF TROPICAL DEEP CONVECTION AND ANVIL CLOUDS: GLOBAL DISTRIBUTION USING 6 YEARS OF TRMM RADAR AND IR DATA 1. INTRODUCTION Before the launch of the TRMM satellite in late 1997, most
Global observations from CALIPSO
 Global observations from CALIPSO Dave Winker, Chip Trepte, and the CALIPSO team NRL, Monterey, 27-29 April 2010 Mission Overview Features: Two-wavelength backscatter lidar First spaceborne polarization
We greatly appreciate the thoughtful comments from the reviewers. According to the reviewer s comments, we revised the original manuscript.
 Response to the reviews of TC-2018-108 The potential of sea ice leads as a predictor for seasonal Arctic sea ice extent prediction by Yuanyuan Zhang, Xiao Cheng, Jiping Liu, and Fengming Hui We greatly
Implications of the differences between daytime and nighttime CloudSat. Chuntao Liu, Edward J. Zipser, Gerald G. Mace, and Sally Benson
 1 2 Implications of the differences between daytime and nighttime CloudSat observations over the tropics 3 4 5 Chuntao Liu, Edward J. Zipser, Gerald G. Mace, and Sally Benson Department of Meteorology,
VALIDATION OF CROSS-TRACK INFRARED SOUNDER (CRIS) PROFILES OVER EASTERN VIRGINIA. Author: Jonathan Geasey, Hampton University
 PROFILES OVER EASTERN VIRGINIA. Author: Jonathan Geasey, Hampton University") VALIDATION OF CROSS-TRACK INFRARED SOUNDER (CRIS) PROFILES OVER EASTERN VIRGINIA Author: Jonathan Geasey, Hampton University Advisor: Dr. William L. Smith, Hampton University Abstract The Cross-Track Infrared
VALIDATION OF CROSS-TRACK INFRARED SOUNDER (CRIS) PROFILES OVER EASTERN VIRGINIA Author: Jonathan Geasey, Hampton University Advisor: Dr. William L. Smith, Hampton University Abstract The Cross-Track Infrared
CloudSat adding new insight into tropical penetrating convection
 Click Here for Full Article GEOPHYSICAL RESEARCH LETTERS, VOL. 35, L19819, doi:10.1029/2008gl035330, 2008 CloudSat adding new insight into tropical penetrating convection Zhengzhao Luo, 1 Guangyuan Y.
Evaluating Icing Nowcasts using CloudSat
 National Weather Association, Electronic Journal of Operational Meteorology, 2010-EJ2 Evaluating Icing Nowcasts using CloudSat Thomas F. Lee*, Cristian Mitrescu, Richard Bankert Naval Research Laboratory,
Impact of the 2002 stratospheric warming in the southern hemisphere on the tropical cirrus clouds and convective activity
 The Third International SOWER meeting,, Lake Shikotsu,, July 18-20, 2006 1 Impact of the 2002 stratospheric warming in the southern hemisphere on the tropical cirrus clouds and convective activity Eguchi,
P1.17 SENSITIVITY OF THE RETRIEVAL OF STRATOCUMULUS CLOUD LIQUID WATER AND PRECIPITATION FLUX TO DOPPLER RADAR PARAMETERS
 P1.17 SENSITIVITY OF THE RETRIEVAL OF STRATOCUMULUS CLOUD LIQUID WATER AND PRECIPITATION FLUX TO DOPPLER RADAR PARAMETERS Yefim L. Kogan*, Zena N. Kogan, and David B. Mechem Cooperative Institute for Mesoscale
IMPACT OF GROUND-BASED GPS PRECIPITABLE WATER VAPOR AND COSMIC GPS REFRACTIVITY PROFILE ON HURRICANE DEAN FORECAST. (a) (b) (c)
 (b) (c)") 9B.3 IMPACT OF GROUND-BASED GPS PRECIPITABLE WATER VAPOR AND COSMIC GPS REFRACTIVITY PROFILE ON HURRICANE DEAN FORECAST Tetsuya Iwabuchi *, J. J. Braun, and T. Van Hove UCAR, Boulder, Colorado 1. INTRODUCTION
9B.3 IMPACT OF GROUND-BASED GPS PRECIPITABLE WATER VAPOR AND COSMIC GPS REFRACTIVITY PROFILE ON HURRICANE DEAN FORECAST Tetsuya Iwabuchi *, J. J. Braun, and T. Van Hove UCAR, Boulder, Colorado 1. INTRODUCTION
The EarthCARE mission: An active view on aerosols, clouds and radiation
 The EarthCARE mission: An active view on aerosols, clouds and radiation T. Wehr, P. Ingmann, T. Fehr Heraklion, Crete, Greece 08/06/2015 EarthCARE is ESA s sixths Earth Explorer Mission and will be implemented
Threshold radar reflectivity for drizzling clouds
 Click Here for Full Article GEOPHYSICAL RESEARCH LETTERS, VOL. 35, L03807, doi:10.1029/2007gl031201, 2008 Threshold radar reflectivity for drizzling clouds Yangang Liu, 1 Bart Geerts, 2 Mark Miller, 2
Characteristics of the Mirror Image of Precipitation Observed by the TRMM Precipitation Radar
 VOLUME 19 JOURNAL OF ATMOSPHERIC AND OCEANIC TECHNOLOGY FEBRUARY 2002 Characteristics of the Mirror Image of Precipitation Observed by the TRMM Precipitation Radar JI LI ANDKENJI NAKAMURA Institute for
Active rain-gauge concept for liquid clouds using W-band and S-band Doppler radars
 Active rain-gauge concept for liquid clouds using W-band and S-band Doppler radars Leyda León-Colón *a, Sandra L. Cruz-Pol *a, Stephen M. Sekelsky **b a Dept. of Electrical and Computer Engineering, Univ.
McIDAS Activities Within The NASA Langley Research Center Clouds And Radiation Group
 McIDAS Activities Within The NASA Langley Research Center Clouds And Radiation Group Kristopher Bedka Science Systems and Applications Inc @ NASA LaRC In Collaboration With (in alphabetical order) J. K.
S. L. Durden and S. Tanelli Jet Propulsion Laboratory California Institute of Technology 4800 Oak Grove Dr., Pasadena, CA 91109, USA
 Progress In Electromagnetics Research Letters, Vol. 8, 115 124, 2009 APPLICATION OF CLUTTER SUPPRESSION METHODS TO A GEOSTATIONARY WEATHER RADAR CONCEPT S. L. Durden and S. Tanelli Jet Propulsion Laboratory
The TRMM Precipitation Radar s View of Shallow, Isolated Rain
 OCTOBER 2003 NOTES AND CORRESPONDENCE 1519 The TRMM Precipitation Radar s View of Shallow, Isolated Rain COURTNEY SCHUMACHER AND ROBERT A. HOUZE JR. Department of Atmospheric Sciences, University of Washington,
Lecture 14. Principles of active remote sensing: Lidars. Lidar sensing of gases, aerosols, and clouds.
 Lecture 14. Principles of active remote sensing: Lidars. Lidar sensing of gases, aerosols, and clouds. 1. Optical interactions of relevance to lasers. 2. General principles of lidars. 3. Lidar equation.
Measuring Global Temperatures: Satellites or Thermometers?
 Measuring Global Temperatures: Satellites or Thermometers? January 26, 2016 by Dr. Roy Spencer, http://www.cfact.org/2016/01/26/measuring-global-temperatures-satellites-orthermometers/ The University of
Fundamentals of Atmospheric Radiation and its Parameterization
 Source Materials Fundamentals of Atmospheric Radiation and its Parameterization The following notes draw extensively from Fundamentals of Atmospheric Physics by Murry Salby and Chapter 8 of Parameterization
For those 5 x5 boxes that are primarily land, AE_RnGd is simply an average of AE_Rain_L2B; the ensuing discussion pertains entirely to oceanic boxes.
 AMSR-E Monthly Level-3 Rainfall Accumulations Algorithm Theoretical Basis Document Thomas T. Wilheit Department of Atmospheric Science Texas A&M University 2007 For those 5 x5 boxes that are primarily
Reconciling Ground-Based and Space-Based Estimates of the Frequency of Occurrence and Radiative Effect of Clouds around Darwin, Australia
 456 J O U R N A L O F A P P L I E D M E T E O R O L O G Y A N D C L I M A T O L O G Y VOLUME 53 Reconciling Ground-Based and Space-Based Estimates of the Frequency of Occurrence and Radiative Effect of
Diurnal cycles of precipitation, clouds, and lightning in the tropics from 9 years of TRMM observations
 GEOPHYSICAL RESEARCH LETTERS, VOL. 35, L04819, doi:10.1029/2007gl032437, 2008 Diurnal cycles of precipitation, clouds, and lightning in the tropics from 9 years of TRMM observations Chuntao Liu 1 and Edward
Comparison of Millimeter-Wave Cloud Radar Measurements for the Fall 1997 Cloud IOP
 c BNLG5 555 t 4 Comparison of Millimeter-Wave Cloud Radar Measurements for the Fall 1997 Cloud IOP c o ~-p9 8 03(fj- S. M. Sekelsky, L. Li,3. Galloway, R. E. McIntosh, University of Massachusetts *M. A.
Future Opportunities of Using Microwave Data from Small Satellites for Monitoring and Predicting Severe Storms
 Future Opportunities of Using Microwave Data from Small Satellites for Monitoring and Predicting Severe Storms Fuzhong Weng Environmental Model and Data Optima Inc., Laurel, MD 21 st International TOV
Global Cloud Climatologies from satellite-based InfraRed Sounders (TOVS, AIRS, IASI) +
 +") Global Cloud Climatologies from satellite-based InfraRed Sounders (TOVS, AIRS, IASI) + AIRS-CALIPSO-CloudSat Synergy Claudia Stubenrauch * until 2010 S. Cros*, A. Guignard, N. Lamquin*, R. Armante, A.
Global Cloud Climatologies from satellite-based InfraRed Sounders (TOVS, AIRS, IASI) + AIRS-CALIPSO-CloudSat Synergy Claudia Stubenrauch * until 2010 S. Cros*, A. Guignard, N. Lamquin*, R. Armante, A.
c Copyright 2014 Tyler J. Thorsen
 c Copyright 2014 Tyler J. Thorsen Observations of tropical cirrus by elastic backscatter lidars and the development of a cloud and aerosol retrieval algorithm for Raman lidars Tyler J. Thorsen A dissertation
Abstract 1 INTRODUCTION OF WATER CLOUD PARAMETERS 1R.4 RADAR-LIDAR SYNERGY FOR SPACE-BASED RETRIEVAL
 1R.4 RADAR-LIDAR SYNERGY FOR SPACE-BASED RETRIEVAL OF WATER CLOUD PARAMETERS Gregory May Herman Russchenberg Oleg Krasnov Delft University of Technology, IRCTR, Delft, The Netherlands Abstract Knowledge
Prospects for radar and lidar cloud assimilation
 Prospects for radar and lidar cloud assimilation Marta Janisková, ECMWF Thanks to: S. Di Michele, E. Martins, A. Beljaars, S. English, P. Lopez, P. Bauer ECMWF Seminar on the Use of Satellite Observations
REMOTE SENSING TEST!!
 REMOTE SENSING TEST!! This is a really ugly cover page I m sorry. Name. Score / 100 Directions: (idk if I need to put this???) You have 50 minutes to take this test. You may use a cheatsheet (2 pages),
Correlations of Horizontally Oriented Ice and Precipitation in Marine Midlatitude Clouds using Collocated A-Train Observations
 Correlations of Horizontally Oriented Ice and Precipitation in Marine Midlatitude Clouds using Collocated A-Train Observations A Thesis Presented to The College of Letters and Sciences The University of
P4.11 SINGLE-DOPPLER RADAR WIND-FIELD RETRIEVAL EXPERIMENT ON A QUALIFIED VELOCITY-AZIMUTH PROCESSING TECHNIQUE
 P4.11 SINGLE-DOPPLER RADAR WIND-FIELD RETRIEVAL EXPERIMENT ON A QUALIFIED VELOCITY-AZIMUTH PROCESSING TECHNIQUE Yongmei Zhou and Roland Stull University of British Columbia, Vancouver, BC, Canada Robert
Validation of ECMWF global forecast model parameters using GLAS atmospheric channel measurements
 GEOPHYSICAL RESEARCH LETTERS, VOL. 32, L22S09, doi:10.1029/2005gl023535, 2005 Validation of ECMWF global forecast model parameters using GLAS atmospheric channel measurements Stephen P. Palm, 1 Angela
Course outline, objectives, workload, projects, expectations
 Course outline, objectives, workload, projects, expectations Introductions Remote Sensing Overview Elements of a remote sensing observing system 1. platform (satellite, surface, etc) 2. experimental design
GLAS Team Member Quarterly Report
 GLAS Team Member Quarterly Report Thomas A. Herring, Katherine J. Quinn, An Nguyen, Monchaya Piboon Massachusetts Institute of Technology Period: 4/1/2002 to 6/30/2002 Options for Estimating Multiple Scattering
Colorado University d Harvard University e Texas A&M University 1. INTRODUCTION
 P7.22 FORMULATION OF A SUITE OF RETRIEVAL ALGORITHMS FOR THE RETRIEVAL OF CIRRUS MICROPHYSICAL PROPERTIES USING RADAR, LIDAR AND RADIOMETER OBSERVATIONS APPLICABLE TO SATELLITE, AIRBORNE AND GROUND-BASED
The Effect of Clouds and Rain on the Aquarius Salinity Retrieval
 The Effect of Clouds and ain on the Aquarius Salinity etrieval Frank J. Wentz 1. adiative Transfer Equations At 1.4 GHz, the radiative transfer model for cloud and rain is considerably simpler than that
GLAS Atmospheric HDF5 Products User Guide July, 2012
 GLAS Atmospheric HDF5 Products User Guide July, 2012 General The final GLAS data products (rel33) exist in two formats; the original binary format and HDF5 (Hierarchical Data Format). The HDF5 products
Lecture 4: Radiation Transfer
 Lecture 4: Radiation Transfer Spectrum of radiation Stefan-Boltzmann law Selective absorption and emission Reflection and scattering Remote sensing Importance of Radiation Transfer Virtually all the exchange
Myung-Sook Park, Russell L. Elsberry and Michael M. Bell. Department of Meteorology, Naval Postgraduate School, Monterey, California, USA
 Latent heating rate profiles at different tropical cyclone stages during 2008 Tropical Cyclone Structure experiment: Comparison of ELDORA and TRMM PR retrievals Myung-Sook Park, Russell L. Elsberry and
Validation of the CloudSat precipitation occurrence algorithm using the Canadian C band radar network
 JOURNAL OF GEOPHYSICAL RESEARCH, VOL. 113,, doi:10.1029/2008jd009992, 2008 Validation of the CloudSat precipitation occurrence algorithm using the Canadian C band radar network David Hudak, 1 Peter Rodriguez,
ESA CONTRACT REPORT. Support-to-Science-Element (STSE) Study EarthCARE Assimilation WP-2100 report: Monitoring of radar data
 Study EarthCARE Assimilation WP-2100 report: Monitoring of radar data") ESA CONTRACT REPORT Contract Report to the European Space Agency Support-to-Science-Element (STSE) Study EarthCARE Assimilation WP-1 report: Monitoring of radar data January 13, updated February 1 Authors:
ESA CONTRACT REPORT Contract Report to the European Space Agency Support-to-Science-Element (STSE) Study EarthCARE Assimilation WP-1 report: Monitoring of radar data January 13, updated February 1 Authors:
1. The frequency of an electromagnetic wave is proportional to its wavelength. a. directly *b. inversely
 CHAPTER 3 SOLAR AND TERRESTRIAL RADIATION MULTIPLE CHOICE QUESTIONS 1. The frequency of an electromagnetic wave is proportional to its wavelength. a. directly *b. inversely 2. is the distance between successive
MAIN ATTRIBUTES OF THE PRECIPITATION PRODUCTS DEVELOPED BY THE HYDROLOGY SAF PROJECT RESULTS OF THE VALIDATION IN HUNGARY
 MAIN ATTRIBUTES OF THE PRECIPITATION PRODUCTS DEVELOPED BY THE HYDROLOGY SAF PROJECT RESULTS OF THE VALIDATION IN HUNGARY Eszter Lábó OMSZ-Hungarian Meteorological Service, Budapest, Hungary labo.e@met.hu
Spectrum of Radiation. Importance of Radiation Transfer. Radiation Intensity and Wavelength. Lecture 3: Atmospheric Radiative Transfer and Climate
 Lecture 3: Atmospheric Radiative Transfer and Climate Radiation Intensity and Wavelength frequency Planck s constant Solar and infrared radiation selective absorption and emission Selective absorption
Final report on the operation of a Campbell Scientific CS135 ceilometer at Chilbolton Observatory
 Final report on the operation of a Campbell Scientific ceilometer at Chilbolton Observatory Judith Agnew RAL Space 27 th March 2014 Summary A Campbell Scientific ceilometer has been operating at Chilbolton