SEISMIC REFRACTION ANALYSIS OF EAST RIVER FLATS MINNEAPOLIS MINNESOTA A THESIS SUBMITTED TO THE FACULTY OF UNIVERSITY OF MINNESOTA AUTUMN HAAGSMA
|
|
|
- Edgar Fletcher
- 5 years ago
- Views:
Transcription
1 SEISMIC REFRACTION ANALYSIS OF EAST RIVER FLATS MINNEAPOLIS MINNESOTA A THESIS SUBMITTED TO THE FACULTY OF UNIVERSITY OF MINNESOTA BY AUTUMN HAAGSMA IN PARTIAL FULFILLMENT OF THE REQUIREMENTS FOR THE DEGREE OF MASTER OF SCIENCE Justin Revenaugh October 2013
2 Seismic Refraction Analysis of East River Flats Minneapolis Minnesota Oct 2013
3 i Acknowledgements I would like to thank my advisor Justin Revenaugh for guiding and supporting me throughout my thesis. I would also like to thank my husband, Ricky Haagsma, for ripping his shorts to provide me with good data.
4 ii Dedications I dedicate this thesis to my always supportive husband and to my son.
5 iii Abstract East River Flats, a city park along the Mississippi River, was analyzed using Geometrics SmartSeis seismograph and 16 geophones. Refraction calculations and models were done using 1D and 2D time-term inversion methods. The results yielded a 3 layer model which consisted of a low velocity top soil, water saturated sand and gravel, and highly fractured Platteville formation limestone.
6 iv Table of Contents List of Tables V List of Figures VI Introduction 1 Methods 3 Data and Results 13 Conclusions 22 Bibliography 24 Appendix 25
7 v List of Tables Table 1: Equipment Specifications 4 Table 2: Compiled travel times for W-E Survey 14 Table 3: Compiled travel times for N-S Survey 15 Table 4: Calculated velocities and depths for W-E Survey 15 Table 5: Calculated velocities and depths for N-S Survey 16 Table 6: Reciprocity errors for W-E Survey 18 Table 7: Reciprocity errors for N-S Survey 18 Table 8: Measured velocities of different materials (Kohnen 1974) 21
8 vi List of Figures Figure 1: Image of East River Flats 2 Figure 2: Stratigraphic Column of Local Geology 3 Figure 3: Schematic of Survey Geometry 5 Figure 4: Images of Field equipment 5 Figure 5: Schematic of refracting waves 7 Figure 6: Examples of raw and filtered data 9 Figure 7: Travel time plot 10 Figure 8: Schematic of refracting waves 11 Figure 9: Compiled travel time plot W-E survey 16 Figure 10: Compiled travel time plot N-S survey 17 Figure 11: Model of W-E survey 19 Figure 12: Model of N-S survey 19 Figure 13: Travel times highlighting possible fracture 22
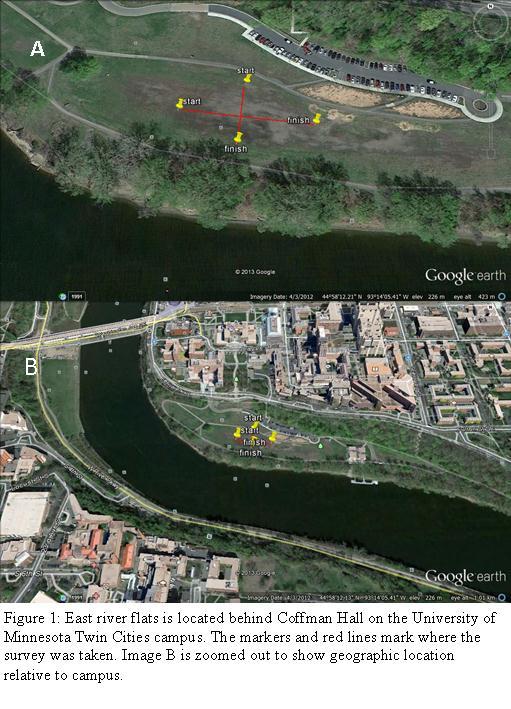
9 1 Introduction The East River Flats is a city park at 44 o N and 93 o W, which is located south of Coffman Hall on the University of Minnesota Twin Cities campus (figure 1). The area is mostly flat and lies adjacent to the Mississippi River. The Mississippi River is about 5 meter below the edge. The surface consists of patches of grass and unconsolidated sediments. The unconsolidated sediment contains soil and mostly gravel, sand, and silt of various rock types which were deposited by the Mississippi River. Underneath this layer lies the Platteville Formation which is highly fractured limestone that often contains fossils. Below this lies a thin layer of shale called the Glenwood Formation (often not seen) followed by St. Peter Sandstone which consists of loosely cemented quartz grains. These three Ordovician formations make up the Mississippi River Valley in the Twin Cities area (Figure 2). (Madigan, 2003)
10 2
11 3 The unconsolidated sediments on the surface along the Mississippi River vary in thickness at different locations due to different depositional events and methods. The thickness of these deposits could also change perpendicular to the river. A seismic refraction survey of the East River Flats area will reveal the thickness in this area and if that thickness changes with proximity to the Mississippi River. The survey can also be used to determine the height of the water table and to calculate the porosity of the overlying sediments. Methods On July travel time data was collected using a Geometrics SmartSeis exploration seismograph with 16 moving-coil geophones. July 30 th was a clear sunny day with little to no wind. The ground was dry but it rained lightly the night before making the surface less hard than usual. The first survey was set up roughly running west to east to run parallel to the Mississippi river. The SmartSeis seismograph was set up using the
. See figure 3 and 4 below for an example of the survey geometry and pictures of the equipment.")
12 4 recommended settings (table 1).The geophones were placed 4 meters apart for a total offset of 60 meters. The energy source was a 20lb sledge hammer and a metal strike plate. The first shot was 8 meters off of geophone 1 with a shot spacing of 8 meters (every other geophone). See figure 3 and 4 below for an example of the survey geometry and pictures of the equipment. 20 strikes of the hammer at each shot location were stacked to enhance results. No filters were applied in the field and when a shot occurred next to a geophone that geophone was turned off so as not to skew the data. A second survey was set up to cross the middle of the first, running perpendicular to the river, running north to south (see figure 1). Only 9 geophones were used instead of the 16 because of the available space and proximity to sidewalks. The geophones were spaced 4 meters apart and the shots were spaced 8 meters apart starting at 4 meters off of geophone 1. The same source was used and swung 20 times, with vertical stacking at each shot.

13 5 The time it takes for the seismic wave to reach each geophone (travel time) along with the geophone location is recorded. There are several methods that can be used to evaluate this data. Due to the simplicity of the geology, there is no need to use complex methods. Two methods were chosen; a 1D analysis which assumes flat, horizontal layers
14 6 with no lateral depth variations in the layers, and a 2D time-term inversion method which allows for lateral variations in depth. Both methods assume a constant velocity through each layer. 1D Model Seismic waves travel through the earth at differing velocities interacting with boundaries and responding to changes in bulk and shear modulus and density. Refracted waves can interact three ways with layer boundaries: when a wave hits the boundary it can reflect, possibly with a change in mode (P to S or vice versa), travel along the boundary as a headwave before returning to the surface, or penetrate the boundary, again with the possibility of a mode change, and continue at a different angle than before. All of these options are available and the geometry of the interactions is dictated by Snell s law (1). Figure 5 below demonstrates one of the possible paths of the refracted wave. ( ) ( ) (1)
15 7 The time it takes for the direct wave (t o ), which travels directly from the source (s) to the geophone (blue dot), is simply the distance divided by the velocity (2).The time it takes for the first refracted wave (T H ), or head wave, to reach a geophone can be derived by following the refracted wave path, green line in figure 3. (2) (3) Equation 3 can be combined with Snell s Law (1) to put it in terms of length, depth, and velocity. The derivative of equation 2 and equation 3 yields the velocities of the first and second layers (5 and 6). (4)
16 8 (5) (6) Similar methods can be applied to derive and equation to find the velocity of a third layer if one is present. The ray path would travel down through layer 1, change angles at layer 2/layer1 boundary due to density differences, and then travel along layer 3 boundary before traveling back up following a symmetric path. (7) (8) Then, after some algebra, equations 5 and 7 can be solved for the thicknesses of layer 1 and layer 2. (9) ( ) (10) Pickwin, part of the SeisImager software package provided by Geometrics, was used to identify the first arrival times at each geophone. Background noise from nearby roads, power lines, trees, and construction projects sometimes made selecting the first arrivals difficult. High and low filters were applied to each data set until the first arrivals could be identified. Pickwin has a built it first pick tool, but it was not always reliable. If

17 9 a first pick was hard to identify after applying filters, then the first pick took was used to help with identification. If a first arrival was not visible or was not in line with the others, then it was omitted. Figure 6 demonstrates the process of selecting first picks. In image (a), the unfiltered data, the first arrivals are hidden. After applying hi and low filters, the first arrivals can be identified in image (b). Lines were drawn to estimate velocity and verify the selection of the first arrivals. See appendix to view all first picks. After the first arrivals were selected, they were plotted using Plotrefa (another program which is a part of the Geometrics SmartSeis software) and Microsoft excel to calculate the velocities using equations (5,6, and 8). The inverse of the plotted slopes are the velocities of each layer. Figure 7 is an example of the plotted data from figure 6. Once the velocities were calculated for each layer, the depths of the layers were calculated using equations (9 and 10).
18 10 Time-Term Inversion Time-term inversion follows a similar reasoning as the 1D model above, with one major difference: the ray-paths do not have to be symmetric which allows for lateral variations in depths. See figure 8 below.
19 11 The derivation begins by following the ray-path (green line) through the layers. D s and D r are the time terms which accounts for different angles and depths. The subscript s denotes the source side and the subscript r denotes the geophone (receiver) side. (11) The travel times then become: ( ) ( ) (12) Where; ( ) (13)
20 12 The velocities are calculated the same way as in the 1D model. The derivative of the travel time equation yields: (14) Travel times are calculated for M shots and N stations producing MN travel time equations. There are many more equations than there are unknowns. This means there is not a singular solution to the system of equations. Instead, the least squares method is applied to reduce the system down to the best fit solution. The Geometrics PlotRefa program assumes that the travel times take on the form of: (15) where matrix A is MxN (#shotsx#stations). The vector m must be chosen so that it minimizes L 2 (equation 16). (16) Equation 16 was expanded and the derivative taken with respect to m to minimize it. This produced a solution for m: ( ) (17) The solution can further be reduced by next assuming the form: ( ) (18) where. An initial estimate of is chosen so that it is close to the correct value. The value can be chosen from the 1D model calculations. Next, the equation is
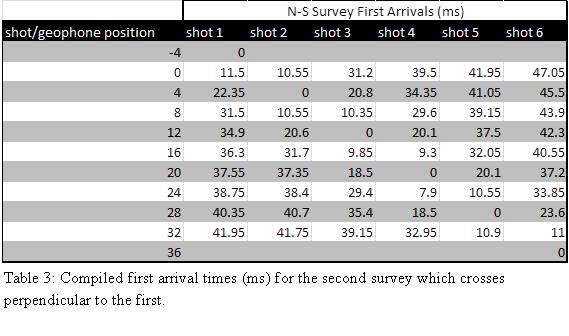
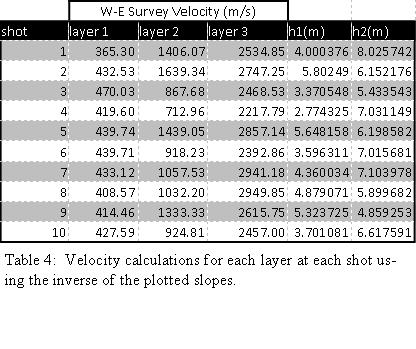
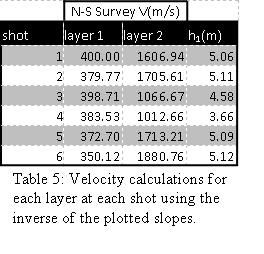
21 13 solved using least squares again to calculate. The final result will contain velocities for each layer, and depths at each geophone. Data and Results The first arrivals for each shot were selected and compiled in tables 2 and 3. The first arrivals were chosen by first using the first pick tool. Pickwin marked where it interpreted the first arrival to be. This was useful when the first arrival was obvious, otherwise the pick was off. The first arrivals could be identified by the first noticeably different spike in the signal. High and low frequency filters were used to reduce the background noise and make the first arrivals more visible. Amplitude of the signals was increased or decreased to help better locate a pick as well. If a first arrival was not visible or did not line up with the others, it was ignored. The first arrival times were plotted with the x-offset in Microsoft Excel. Figures 9 and 10 show compiled plots of all shots for the two survey lines. All of the first arrivals chosen in Pickwin and the excel plots can be found in the appendix. The velocities and depths were calculated using the 1D method and compiled into tables 3 and 4. If velocity lines from different shots crossed each other or came close, the data was reevaluated to see if a better selection of first arrivals could be made. Velocity lines of different shots should not cross. It the best case scenario they would be parallel. The calculated depths for the W-E survey (see table 3) suggests that the second survey was not long enough to observe a third layer. The survey line was 32 meters in length. Generally, depth of the survey would be ¼ of the survey length. The maximum depth that could be observed would be 8 meters. The estimated depth to the third layer

22 14 based off the W-E survey was meters. The velocities and depths for the N-S survey were calculated based on a two-layer scenario. The velocities calculated in the N-S survey were higher than those calculated for the W-E survey. This could be due to less data and the influence of end points being part of layer three. The velocity anomaly could also be due to lateral variations in velocity. The N-S survey could be been located over an area of lower velocity. The change in velocity could be from a density change.
23 15
24 16
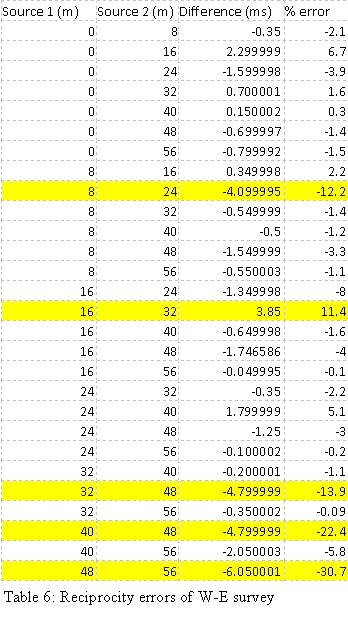
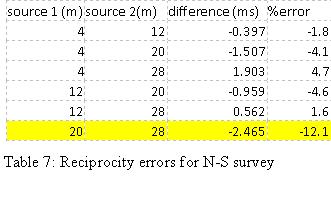
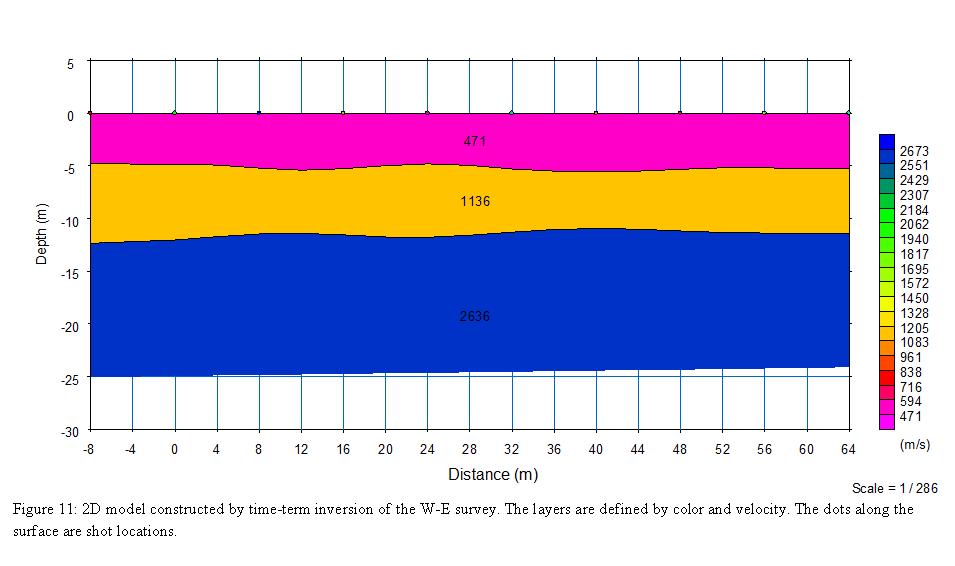
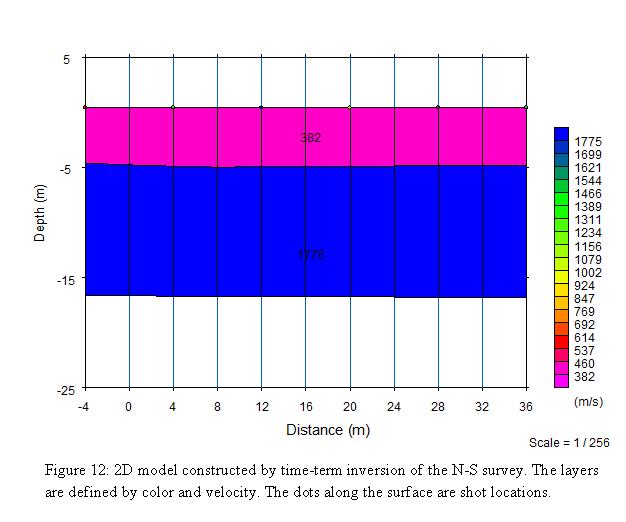
25 17 Next, time term inversion was performed on the data using the PlotRefa program. This produced 2D models of depth vs.velocity (figures 11 and 12). The W-E survey had a RMS matrix inversion error value of and the N-S survey had an RMS value of This is the error from inverting a matrix with mismatched dimensions. Plotrefa recognized any RMS value less than 1.5 to be acceptable. The quality of the data was checked by testing the reciprocity. Good data should produce the same velocities regardless of direction. Error should fall within 5%. Tables 6 and 7 below list the errors and highlight any that are too high.
26 18
27 19
28 20 The time-term models (figures 11 and 12) indicate a slow velocity top layer that is about 5 meters thick. The velocity indicates that the top layer consists of top soil and sand and gravel. The second layer is about 7 meters thick. The velocity indicates a water saturated level or the water table. The third layer has a faster velocity of 2636 m/s. Based on the local geology and the velocity, this layer is composed of fractured limestone which is the Platteville formation. Table 6 below was used to determine the material type based off the velocities.
29 21 The calculated velocity of the Platteville limestone is on the low end of the range of possible velocities according to table 6. The presence of many fractures, filled with slower velocity fluids, decreases the velocity of that layer. The study of Mavko (1993) shows the frequency and the amplitude of the signal decreases where fractures are

30 22 present. Throughout the data there are low amplitude, low frequency signals around the 40 meter mark (figure 13). This could be a location of a fracture. Conclusions East River Flats, a city park along the Mississippi River was analyzed using seismic refraction. Calculations and models were done using 1D and 2D time-term inversion methods. The results yielded a 3 layer model. The first layer has a slow velocity of m/s which indicated the layer was composed of top soil and sand and gravel. It is about 5 meters thick. The second layer has a velocity of m/s and is around 7 meters thick. The estimated depth to the water table from the edge of the flats was 5 meters. The calculated depth was also around 5 meters. The estimated and calculated are consistent. The third layer had a velocity of 2636 m/s and was located around meters deep. The third layer was identified as the Platteville formation limestone. The slower limestone velocity can be accounted for by the presence of numerous fractures.
31 23 There are many future applications for this study. First, it would be useful to collect more data which crosses the original W-E survey line to identify the boundaries of the velocity anomaly. This survey could also be done frequently (monthly, seasonally, etc.) to monitor the rise and fall of the water table. It could also be extended along the Mississippi River either locally or regionally. A larger project would be to map the fractures in the Platteville formation, highlighting areas of high and low fractures. A fracture study would be useful for water well placements and to enhance the understanding of the effects of fractures on seismic velocity.
32 24 Bibliography H.Kohnen. (1974). Temperature Dependence of Seismic Waves in Ice. Journal of Glaciology, Madigan, T. (2003, august 5). River of History. national park services. Mavko, G. (1993). Rock Physics Constraints on Seismic Signatures of Fractures.

33 25 Appendix W-E Survey Shots Shot 1 (-8 m)
 26")
34 Shot 2 (0m) 26
 27")
35 Shot 3 (8m) 27
 28")
36 Shot 4 (16m) 28
 29")
37 Shot 5 (24m) 29
 30")
38 Shot 6 (32m) 30
 31")
39 Shot 7 (40m) 31
 32")
40 Shot 8 (48m) 32
 33")
41 Shot 9 (56m) 33
 34")
42 Shot 10 (64m) 34

43 35 N-S Survey Shot 1 (-4m)
 36")
44 Shot 2 (4m) 36
 37")
45 Shot 3 (12m) 37
 38")
46 Shot 4 (20m) 38
 39")
47 Shot 5 (28m) 39
 40")
48 Shot 6 (36m) 40
P Wave Reflection and Refraction and SH Wave Refraction Data Processing in the Mooring, TN Area
 P Wave Reflection and Refraction and SH Wave Refraction Data Processing in the Mooring, TN Area Abstract: Author: Duayne Rieger Home Institution: Slippery Rock University of Pennsylvania REU Institution:
Walkaway Seismic Experiments: Stewart Gulch, Boise, Idaho
 Walkaway Seismic Experiments: Stewart Gulch, Boise, Idaho Lee M. Liberty Center for Geophysical Investigation of the Shallow Subsurface Boise State University Boise, Idaho 1. Summary CGISS conducted walkaway
ERTH2020 Introduction to Geophysics The Seismic Method. 1. Basic Concepts in Seismology. 1.1 Seismic Wave Types
 ERTH2020 Introduction to Geophysics The Seismic Method 1. Basic Concepts in Seismology 1.1 Seismic Wave Types Existence of different wave types The existence of different seismic wave types can be understood
Seismic tests at Southern Ute Nation coal fire site
 Seismic tests at Southern Ute Nation coal fire site Sjoerd de Ridder and Seth S. Haines ABSTRACT We conducted a near surface seismic test at the Southern Ute Nation coal fire site near Durango, CO. The
Appendix B: Geophysical Data (Thesis Appendix, 2013)
") Utah State University From the SelectedWorks of David J Richey 2013 Appendix B: Geophysical Data (Thesis Appendix, 2013) David J Richey, Utah State University Available at: https://works.bepress.com/david_richey/2/
Utah State University From the SelectedWorks of David J Richey 2013 Appendix B: Geophysical Data (Thesis Appendix, 2013) David J Richey, Utah State University Available at: https://works.bepress.com/david_richey/2/
Geophysical Site Investigation (Seismic methods) Amit Prashant Indian Institute of Technology Gandhinagar
 Amit Prashant Indian Institute of Technology Gandhinagar") Geophysical Site Investigation (Seismic methods) Amit Prashant Indian Institute of Technology Gandhinagar Short Course on Geotechnical Aspects of Earthquake Engineering 04 08 March, 2013 Seismic Waves
Geophysical Site Investigation (Seismic methods) Amit Prashant Indian Institute of Technology Gandhinagar Short Course on Geotechnical Aspects of Earthquake Engineering 04 08 March, 2013 Seismic Waves
Ground-Water Exploration in the Worthington Area of Nobles County: Summary of Seismic Data and Recent Test Drilling Results
 Ground-Water Exploration in the Worthington Area of Nobles County: Summary of Seismic Data and Recent Test Drilling Results Jim Berg and Todd Petersen Geophysicists, DNR Waters January 2000 Table of Contents
LECTURE 10. Module 3 : Field Tests in Rock 3.6 GEOPHYSICAL INVESTIGATION
 LECTURE 10 3.6 GEOPHYSICAL INVESTIGATION In geophysical methods of site investigation, the application of the principles of physics are used to the study of the ground. The soil/rock have different characteristics
KARST MAPPING WITH GEOPHYSICS AT MYSTERY CAVE STATE PARK, MINNESOTA
 KARST MAPPING WITH GEOPHYSICS AT MYSTERY CAVE STATE PARK, MINNESOTA By Todd A. Petersen and James A. Berg Geophysics Program Ground Water and Climatology Section DNR Waters June 2001 1.0 Summary A new
Acquisition and preliminary analysis of the Castle Mountain shallow VSP dataset
 Castle Mountain shallow VSP Acquisition and preliminary analysis of the Castle Mountain shallow VSP dataset Joe Wong, Henry C. Bland, Kevin W. Hall and Robert R. Stewart ABSTRACT As part of the 2006 geophysics
International Journal of Advanced and Applied Sciences
 International Journal of Advanced and Applied Sciences, 3(5) 2016, Pages: 65 72 Contents lists available at Science Gate International Journal of Advanced and Applied Sciences Journal homepage: http://www.science
Determination of Incompressibility, Elasticity and the Rigidity of Surface Soils and Shallow Sediments from Seismic Wave Velocities
 Journal of Earth Sciences and Geotechnical Engineering, vol. 6, no.1, 2016, 99-111 ISSN: 1792-9040 (print), 1792-9660 (online) Scienpress Ltd, 2016 Determination of Incompressibility, Elasticity and the
Seismic Velocity Measurements at Expanded Seismic Network Sites
 UK/KRCEE Doc #: P8.3 2005 Seismic Velocity Measurements at Expanded Seismic Network Sites Prepared by Kentucky Research Consortium for Energy and Environment 233 Mining and Minerals Building University
EOS 350 MIDTERM OCT 4, 2013 STUDENT NAME: TEAM #:
 EOS 350 MIDTERM OCT 4, 2013 STUDENT NAME: TEAM #: Some equations which may, or may not, be useful: Distance from sensor to a dipole z ~ x ½, Distance to line of dipoles z ~ 0.75x ½ B = μh, M = κh Seismic
Applying Seismic Refraction Method in Depicting Geological Contact at Bukit Bunuh, Lenggong, Perak, Malaysia
 2012 International Conference on Geological and Environmental Sciences IPCBEE vol.3 6(2012) (2012)IACSIT Press, Singapoore Applying Seismic Refraction Method in Depicting Geological Contact at Bukit Bunuh,
Lima Project: Seismic Refraction and Resistivity Survey. Alten du Plessis Global Geophysical
 Lima Project: Seismic Refraction and Resistivity Survey Alten du Plessis Global Geophysical Report no 0706/2006 18 December 2006 Lima Project: Seismic Refraction and Resistivity Survey by Alten du Plessis
Crosswell tomography imaging of the permeability structure within a sandstone oil field.
 Crosswell tomography imaging of the permeability structure within a sandstone oil field. Tokuo Yamamoto (1), and Junichi Sakakibara (2) (1) University of Miami and Yamamoto Engineering Corporation, (2)
ANGLE-DEPENDENT TOMOSTATICS. Abstract
 ANGLE-DEPENDENT TOMOSTATICS Lindsay M. Mayer, Kansas Geological Survey, University of Kansas, Lawrence, KS Richard D. Miller, Kansas Geological Survey, University of Kansas, Lawrence, KS Julian Ivanov,
STUDY GUIDE FOR MID-TERM EXAM KEY. Color, luster, cleavage, fracture, hardness, taste, smell, fluorescence, radioactivity, magnetism
 STUDY GUIDE FOR MID-TERM EXAM KEY 1. In which type of rock are fossils most likely to be found? Sedimentary Rocks 2. Which mineral is easily identified by smell? Sulfur 3. Which natural resource makes
GLG 471; MICHIGAN STATE UNIVERSITY INSTRUCTOR R.L. VAN DAM PROJECT: ELECTRICAL RESISTIVITY
 GLG 471; MICHIGAN STATE UNIVERSITY INSTRUCTOR R.L. VAN DAM PROJECT: ELECTRICAL RESISTIVITY General information: This is a group (2-3 students) project requiring lab-, computer-, and fieldwork. Work will
Compressional and Shear-Wave Velocity Measurements in Unconsolidated Top- Soil in Eket, South-eastern Nigeria.
 Compressional and Shear-Wave Velocity Measurements in Unconsolidated Top- Soil in Eket, South-eastern Nigeria. U.E. Essien, M.Sc. 1 and A.O. Akankpo, M.Sc. 2* 1 Department of Science and Technology, Akwa
DEPTH AND VELOCITY ESTIMATES FROM SEISMIC WAVES REFRACTION PATHS AT EBONYI STATE UNIVERSITY STAFF SCHOOL, ABAKALIKI, NIGERIA ABSTRACT
 DEPTH AND VELOCITY ESTIMATES FROM SEISMIC WAVES REFRACTION PATHS AT EBONYI STATE UNIVERSITY STAFF SCHOOL, ABAKALIKI, NIGERIA Agha, S. O. Dept. of Industrial Physics Ebonyi State University Abakaliki, NIGERIA
International Journal of Scientific & Engineering Research, Volume 6, Issue 12, December ISSN
 International Journal of Scientific & Engineering Research, Volume 6, Issue 12, December-2015 1052 Determination of Lame s Constants of Surface soils and Shallow Sediments from Seismic Wave Velocities
Seismic Reflection Imaging across the Johnson Ranch, Valley County, Idaho
 Seismic Reflection Imaging across the Johnson Ranch, Valley County, Idaho Report Prepared for the Skyline Corporation Lee M. Liberty Center for Geophysical Investigation of the Shallow Subsurface (CGISS)
The Application of Shallow Seismic Refraction Method to Study the Dynamics Properties of Soil in Atbara Area, Sudan
 International Journal of Service Science, Management and Engineering 2018; 5(3): 117-124 http://www.openscienceonline.com/journal/ssme ISSN: 2381-6031 (Print); ISSN: 2381-604X (Online) The Application
Ultra high-resolution seismic and GPR imaging of permafrost. Devon Island, Nunavut
 Ultra high-resolution seismic and GPR imaging of permafrost. Devon Island, Nunavut Carlos E. Nieto* and Robert R. Stewart CREWES. The University of Calgary, 2500 University Dr., N.W., Calgary, AB, T2N
Chapter 6 Sedimentary and Metamorphic Rock
 Chapter 6 Sedimentary and Metamorphic Rock Weathering and Erosion Wherever rock is exposed at Earth s surface, it is continuously being broken down by weathering a set of physical and chemical processes
Seismologia A Seismology A Lecture 9: Engineering seismology: seismic veloci:es in soils
 Seismologia 494304A Seismology 494304A 20.03.2018 Lecture 9: Engineering seismology: seismic veloci:es in soils h
ROCK PHYSICS DIAGNOSTICS OF NORTH SEA SANDS: LINK BETWEEN MICROSTRUCTURE AND SEISMIC PROPERTIES ABSTRACT
 ROCK PHYSICS DIAGNOSTICS OF NORTH SEA SANDS: LINK BETWEEN MICROSTRUCTURE AND SEISMIC PROPERTIES PER AVSETH, JACK DVORKIN, AND GARY MAVKO Department of Geophysics, Stanford University, CA 94305-2215, USA
A 3D seismic survey for mapping shallow targets
 A 3D seismic survey for mapping shallow targets Don C. Lawton, Robert R. Stewart, and Malcolm B. Bertram Department of Geoscience University of Calgary 2500 University Drive N.W. Calgary, Alberta T2N 1N4
Basic principles of the seismic method
 Chapter 2 Basic principles of the seismic method In this chapter we introduce the basic notion of seismic waves. In the earth, seismic waves can propagate as longitudinal (P) or as shear (S) waves. For
Groundwater Sustainability at Wadi Al Bih Dam, Ras El Khaimah, United Arab Emirates (UAE) using Geophysical methods
 using Geophysical methods") Groundwater Sustainability at Wadi Al Bih Dam, Ras El Khaimah, United Arab Emirates (UAE) using Geophysical methods Ahmed Murad, Amir Gabr, Saber Mahmoud, Hasan Arman & Abdulla Al Dhuhoori Geology Department
Groundwater Sustainability at Wadi Al Bih Dam, Ras El Khaimah, United Arab Emirates (UAE) using Geophysical methods Ahmed Murad, Amir Gabr, Saber Mahmoud, Hasan Arman & Abdulla Al Dhuhoori Geology Department
DEVELOPMENT OF EMPIRICAL CORRELATION BETWEEN SHEAR WAVE VELOCITY AND STANDARD PENETRATION RESISTANCE IN SOILS OF CHENNAI CITY
 DEVELOPMENT OF EMPIRICAL CORRELATION BETWEEN SHEAR WAVE VELOCITY AND STANDARD PENETRATION RESISTANCE IN SOILS OF CHENNAI CITY Uma Maheswari R 1, Boominathan A 2 and Dodagoudar G.R 3 1 Research Scholar,
Chapter 7: Reflection Seismology Homework Solutions (Jan. 2010)
") Chapter 7: eflection Seismology Homework Solutions (Jan. 200). Why do marine seismic reflection surveys not record (a) S waves? (b) refracted rays? 2 μ a) For ideal fluid, μ=0, thus, v s = = 0 ρ b) eflection
Chapter 7: eflection Seismology Homework Solutions (Jan. 200). Why do marine seismic reflection surveys not record (a) S waves? (b) refracted rays? 2 μ a) For ideal fluid, μ=0, thus, v s = = 0 ρ b) eflection
Geological Mapping using Geophysics
 Geological Mapping using Geophysics Pugin, A.J.M. and T.H. Larson Illinois State Geological Survey, 615 E Peabody Dr., Champaign, IL 61820; E-mail: A.J.M. Pugin at pugin@isgs.uiuc.edu Mapping Techniques.
SOIL MECHANICS SAB1713 DR. HETTY
 SOIL MECHANICS SAB1713 DR. HETTY INTRODUCTION SOIL MECHANICS -Concerned solely with soils -Concerned with the deformation and strength of bodies of soils -Concerned with the interaction of structures with
Ground-penetrating radar (GPR) and shallow seismic surveys at Calgary International Airport, Alberta
 and shallow seismic surveys at Calgary International Airport, Alberta") Ground-penetrating radar (GPR) and shallow seismic surveys at Calgary International Airport, Alberta Robert R. Stewart, Han-xing Lu, and Don C. Lawton ABSTRACT A ground-penetrating radar survey was conducted
Ground-penetrating radar (GPR) and shallow seismic surveys at Calgary International Airport, Alberta Robert R. Stewart, Han-xing Lu, and Don C. Lawton ABSTRACT A ground-penetrating radar survey was conducted
GPR surveys at Nõmmküla Detection of underground water routes
 GPR surveys at Nõmmküla 2009 Detection of underground water routes Tomi Herronen & Timo Saarenketo 2009 1. Introduction The purpose of this survey was to locate possible underground water routes (rivers)
Review of MASW and Refraction Surveys by Nicholas MacIntyre Bachelors Geology, Humboldt State University OSOP Staff Geophysicist
 Review of MASW and Refraction Surveys by Nicholas MacIntyre Bachelors Geology, Humboldt State University OSOP Staff Geophysicist Abstract The purpose of this paper is to explain the theory and methods
VolksMeter with one as opposed to two pendulums
 VolksMeter with one as opposed to two pendulums Preface In all of the discussions that follow, remember that a pendulum, which is the seismic element used in the VolksMeter, responds only to horizontal
FINAL REPORT GEOPHYSICAL INVESTIGATION WATER TOWER NO. 6 SITE PLANT CITY, FL
 APPENDIX B FINAL REPORT GEOPHYSICAL INVESTIGATION WATER TOWER NO. 6 SITE PLANT CITY, FL Prepared for Madrid Engineering Group, Inc. Bartow, FL Prepared by GeoView, Inc. St. Petersburg, FL February 28,
DOWN-HOLE SEISMIC SURVEY AND VERTICAL ELECTRIC SOUNDINGS RABASKA PROJECT, LÉVIS, QUÉBEC. Presented to :
 DOWN-HOLE SEISMIC SURVEY AND VERTICAL ELECTRIC SOUNDINGS RABASKA PROJECT, LÉVIS, QUÉBEC Presented to : TERRATECH 455, René-Lévesque Blvd. West Montreal, Québec HZ 1Z3 Presented by : GEOPHYSICS GPR INTERNATIONAL
High Resolution Geophysics: A Better View of the Subsurface. By John Jansen, P.G., Ph.D., Aquifer Science and Technology
 High Resolution Geophysics: A Better View of the Subsurface By John Jansen, P.G., Ph.D., Aquifer Science and Technology Geologist Use Only Part of the Information Available To Them Most Geologist rely
CENTER FOR INFRASTRUCTURE ENGINEERING STUDIES
 1 CENTER FOR INFRASTRUCTURE ENGINEERING STUDIES Acquisition of an Engineering Seismograph By Dr. Neil Anderson UTC RE116 University Transportation Center Program at The University of Missouri-Rolla 2 Disclaimer
Sediment and sedimentary rocks Sediment
 Sediment and sedimentary rocks Sediment From sediments to sedimentary rocks (transportation, deposition, preservation and lithification) Types of sedimentary rocks (clastic, chemical and organic) Sedimentary
Groundwater Level Monitoring of the Quaternary Aquifer at Al Ain City, United Arab Emirates (UAE) using Geophysical Methods
 using Geophysical Methods") Groundwater Level Monitoring of the Quaternary Aquifer at Al Ain City, United Arab Emirates (UAE) using Geophysical Methods Ahmed Murad & Amir Gabr Geology Department UAE University Outlines Introduction
Groundwater Level Monitoring of the Quaternary Aquifer at Al Ain City, United Arab Emirates (UAE) using Geophysical Methods Ahmed Murad & Amir Gabr Geology Department UAE University Outlines Introduction
Downhole Seismic Velocity Logging Test
 Objective Downhole Seismic Velocity Logging Test In this experiment, Velocity Logging Test (Downhole method) is done to find the physical properties of the soil ground from site investigation. Velocity
SEISMIC SURVEY METHODS
 SEISMIC SURVEY METHODS Seismic methods Seismic surveys are used in geology and geotechnical engineering to: a) define the depth of the bedrock; b) investigate the landslide areas, c) check the structural
Landslides and Ground Water Permeability with Respect to the. Contact Point of Glacial Lake Vermont and the Champlain Sea
 Landslides and Ground Water Permeability with Respect to the Contact Point of Glacial Lake Vermont and the Champlain Sea Sediments at Town Line Brook, Winooski, VT Michala Peabody Lara Vowles Abstract:
Synthetic Seismogram A Tool to Calibrate PP & PS Seismic Data
 P-475 Summary Synthetic Seismogram A Tool to Calibrate PP & PS Seismic P. Sugadha*, M. K. Jain, M. Singh, ONGC Conventional P wave technology will not meet all the requirements of the industry. Hence,
Essential Questions. What is erosion? What is mass wasting?
 Erosion Essential Questions What is erosion? What is mass wasting? What is Erosion? Erosion The transportation of sediment from one area to another Caused mainly by running water but also caused by glaciers,
Name. 4. The diagram below shows a soil profile formed in an area of granite bedrock. Four different soil horizons, A, B, C, and D, are shown.
 Name 1. In the cross section of the hill shown below, which rock units are probably most resistant to weathering? 4. The diagram below shows a soil profile formed in an area of granite bedrock. Four different
Pratice Surface Processes Test
 1. The cross section below shows the movement of wind-driven sand particles that strike a partly exposed basalt cobble located at the surface of a windy desert. Which cross section best represents the
Microseismic data illuminate fractures in the Montney
 Spectraseis White Paper August 16, 2012 2013 Spectraseis Microseismic data illuminate fractures in the Montney Brad Birkelo and Konrad Cieslik, Spectraseis High-quality data reveal fracture orientation
COMMONWEALTH OF AUSTRALIA RECORD NO. 1962/180 QUEEN VICTORIA HOSPITAL SITE SEISMIC SURVEY, LAUN CESTON TASMANIA 1961 E. J. POLAK
 COMMONWEALTH OF AUSTRALIA DEPA T:11/ICEj\IT OF NATIONAL DEVELOPMENT BUIEcAlPeF MINERAL RESOURCES, GEOLOGY AND GEOPHYSICS t 43 0,f,k. 11 RECORD NO. 1962/180 QUEEN VICTORIA HOSPITAL SITE SEISMIC SURVEY,
Which map shows the stream drainage pattern that most likely formed on the surface of this volcano? A) B)
 B)") 1. When snow cover on the land melts, the water will most likely become surface runoff if the land surface is A) frozen B) porous C) grass covered D) unconsolidated gravel Base your answers to questions
1. When snow cover on the land melts, the water will most likely become surface runoff if the land surface is A) frozen B) porous C) grass covered D) unconsolidated gravel Base your answers to questions
Effects of Surface Geology on Seismic Motion
 4 th IASPEI / IAEE International Symposium: Effects of Surface Geology on Seismic Motion August 23 26, 2011! University of California Santa Barbara MICROZONATION OF MONTREAL, VARIABILITY IN SOIL CLASSIFICATION
Static Corrections for Seismic Reflection Surveys
 Static Corrections for Seismic Reflection Surveys MIKE COX Volume Editors: Series Editor: Eugene F. Scherrer Roland Chen Eugene F. Scherrer Society of Exploration Geophysicists Tulsa, Oklahoma Contents
Seismic Surveying. Dr. Laurent Marescot. Course given at the University of Fribourg (2009) Contact:
 Contact:") Seismic Surveying Dr. Laurent Marescot Course given at the University of Fribourg (2009) Contact: laurent@tomoquest.com 1 Introduction Seismic surveying Investigation based on the propagation of man-made
Seismic Surveying Dr. Laurent Marescot Course given at the University of Fribourg (2009) Contact: laurent@tomoquest.com 1 Introduction Seismic surveying Investigation based on the propagation of man-made
MAPPING BEDROCK: Verifying Depth to Bedrock in Calumet County using Seismic Refraction
 MAPPING BEDROCK: Verifying Depth to Bedrock in Calumet County using Seismic Refraction Revised December 13, 2011 Dave Hart Wisconsin Geological and Natural History Survey INTRODUCTION Seismic refraction
Lab 7: Sedimentary Structures
 Name: Lab 7: Sedimentary Structures Sedimentary rocks account for a negligibly small fraction of Earth s mass, yet they are commonly encountered because the processes that form them are ubiquitous in the
Amplitude variation with offset AVO. and. Direct Hydrocarbon Indicators DHI. Reflection at vertical incidence. Reflection at oblique incidence
 Amplitude variation with offset AVO and Direct Hydrocarbon Indicators DHI Reflection at vertical incidence Reflection coefficient R(p) c α 1 S wavespeed β 1 density ρ 1 α 2 S wavespeed β 2 density ρ 2
Post-stack inversion of the Hussar low frequency seismic data
 Inversion of the Hussar low frequency seismic data Post-stack inversion of the Hussar low frequency seismic data Patricia E. Gavotti, Don C. Lawton, Gary F. Margrave and J. Helen Isaac ABSTRACT The Hussar
SEISMIC REFRACTION SURVEY RIPPABILITY STUDY
 SEISMIC REFRACTION SURVEY RIPPABILITY STUDY US 95A SILVER SPRINGS to FERNLEY LYON COUNTY August 2008 E.A. 73455 MATERIALS DIVISION SEISMIC REFRACTION SURVEY RIPPABILITY STUDY LYON COUNTY US 95A SILVER
Geophysics for Environmental and Geotechnical Applications
 Geophysics for Environmental and Geotechnical Applications Dr. Katherine Grote University of Wisconsin Eau Claire Why Use Geophysics? Improve the quality of site characterization (higher resolution and
BUREAU OF MINERAL RESOURCES, GEOLOGY AND GEOPHYSICS.
 COMMONWEALTH OF AUSTRALIA DEPARTMENT OF NATIONAL DEVELOPMENT BUREAU OF MINERAL RESOURCES, GEOLOGY AND GEOPHYSICS. RECORDS 1957, No.23 j^ SEISMIC REFRACTION SURVEY OFTIE LATROBE RIVER DAM SITE, YALLOURN,
depression above scarp scarp
 1 LAB 1: FIELD TRIP TO McKINLEYVILLE AND MOUTH OF THE MAD RIVER OBJECTIVES: a. to look at geomorphic and geologic evidence for large scale thrust-faulting of young sediments in the Humboldt Bay region
VMS-GeoMil. Background
 Background When using a drilling rig for cone penetration testing, a mechanical clamp can be mounted to the drilling head (by means of a special transition piece). The depth than can be achieved depends
SUBMITTAL FEASIBILITY STUDY GEOPHYSICAL INVESTIGATION SAN JUAN BASIN SAN JUAN CAPISTRANO, CALIFORNIA. GEOVision Project No
 SUBMITTAL FEASIBILITY STUDY GEOPHYSICAL INVESTIGATION SAN JUAN BASIN SAN JUAN CAPISTRANO, CALIFORNIA GEOVision Project No. 15027 Prepared for Santa Margarita Water District 26111 Antonio Parkway Rancho
In-seam GPR and 2-C seismic investigations at the Goderich, Ontario salt mine
 In-seam GPR and 2-C seismic investigations at the Goderich, Ontario salt mine Jill Belisle and Robert R. Stewart In-seam techniques ABSTRACT In-seam GPR and 2-C seismic techniques used in conjunction with
Correlation of gravel deposits from trenching project on Alder Creek fluvial terrace near Point Arena, California
 Correlation of gravel deposits from trenching project on Alder Creek fluvial terrace near Point Arena, California Aletha Lee Department of Geology and Geography, West Virginia University, White Hall, Morgantown,
Section 19.1: Forces Within Earth Section 19.2: Seismic Waves and Earth s Interior Section 19.3: Measuring and Locating.
 CH Earthquakes Section 19.1: Forces Within Earth Section 19.2: Seismic Waves and Earth s Interior Section 19.3: Measuring and Locating Earthquakes Section 19.4: Earthquakes and Society Section 19.1 Forces
Geology 12 FINAL EXAM PREP. Possible Written Response Exam Questions
 Geology 12 FINAL EXAM PREP Possible Written Response Exam Questions Use this study guide to prepare for the written response portion of the final exam. Name FINAL EXAM - POSSIBLE WRITTEN RESPONSE QUESTIONS
Observation of shear-wave splitting from microseismicity induced by hydraulic fracturing: A non-vti story
 Observation of shear-wave splitting from microseismicity induced by hydraulic fracturing: A non-vti story Petr Kolinsky 1, Leo Eisner 1, Vladimir Grechka 2, Dana Jurick 3, Peter Duncan 1 Summary Shear
MUHAMMAD S TAMANNAI, DOUGLAS WINSTONE, IAN DEIGHTON & PETER CONN, TGS Nopec Geological Products and Services, London, United Kingdom
 Geological and Geophysical Evaluation of Offshore Morondava Frontier Basin based on Satellite Gravity, Well and regional 2D Seismic Data Interpretation MUHAMMAD S TAMANNAI, DOUGLAS WINSTONE, IAN DEIGHTON
Interpretation of baseline surface seismic data at the Violet Grove CO 2 injection site, Alberta
 Violet Grove seismic interpretation Interpretation of baseline surface seismic data at the Violet Grove CO 2 injection site, Alberta Fuju Chen and Don Lawton ABSTRACT Time-lapse seismic technology has
Hybrid Seismic Survey on the Gamanjunni Rockslide Site
 Hybrid Seismic Survey on the Gamanjunni Rockslide Site by Walter Frei; info@geoexpert.ch NVE Workshop / Oslo 30.-31. January 2017 (1) Pictorial Introduction to Hybrid Seismic Profiling (2) Recommended
GEOPHYSICAL SITE CHARACTERIZATION IN SUPPORT OF HIGHWAY EXPANSION PROJECT
 GEOPHYSICAL SITE CHARACTERIZATION IN SUPPORT OF HIGHWAY EXPANSION PROJECT * Shane Hickman, * Todd Lippincott, * Steve Cardimona, * Neil Anderson, and + Tim Newton * The University of Missouri-Rolla Department
Reservoir Characteristics of a Quaternary Channel: Incorporating Rock Physics in Seismic and DC Resistivity Surveys
 Reservoir Characteristics of a Quaternary Channel: Incorporating Rock Physics in Seismic and DC Resistivity Surveys Jawwad Ahmad* University of Alberta, Edmonton, Alberta, Canada jahmad@phys.ualberta.ca
INTERROGATING LEVEES IN TEXAS, NEW MEXICO, AND NEW ORLEANS USING VARIOUS SEISMIC METHODS. Abstract
 INTERROGATING LEVEES IN TEXAS, NEW MEXICO, AND NEW ORLEANS USING VARIOUS SEISMIC METHODS Downloaded 07/03/14 to 129.237.143.21. Redistribution subject to SEG license or copyright; see Terms of Use at http://library.seg.org/
5. Which surface soil type has the slowest permeability rate and is most likely to produce flooding? A) pebbles B) sand C) silt D) clay A) B) C) D)
 pebbles B) sand C) silt D) clay A) B) C) D)") 1. During a heavy rainstorm, soil samples A and B both became saturated with water. However, 10 minutes after the storm ended, the soils appeared as shown below. Which statement best explains the observed
1. During a heavy rainstorm, soil samples A and B both became saturated with water. However, 10 minutes after the storm ended, the soils appeared as shown below. Which statement best explains the observed
We apply a rock physics analysis to well log data from the North-East Gulf of Mexico
 Rock Physics for Fluid and Porosity Mapping in NE GoM JACK DVORKIN, Stanford University and Rock Solid Images TIM FASNACHT, Anadarko Petroleum Corporation RICHARD UDEN, MAGGIE SMITH, NAUM DERZHI, AND JOEL
Sediment and Sedimentary rock
 Sediment and Sedimentary rock Sediment: An accumulation of loose mineral grains, such as boulders, pebbles, sand, silt or mud, which are not cemented together. Mechanical and chemical weathering produces
6298 Stress induced azimuthally anisotropic reservoir - AVO modeling
 6298 Stress induced azimuthally anisotropic reservoir - AVO modeling M. Brajanovski* (Curtin University of Technology), B. Gurevich (Curtin University of Technology), D. Nadri (CSIRO) & M. Urosevic (Curtin
Page 1. Name:
 Name: 1) Which event is the best example of erosion? dissolving of rock particles on a limestone gravestone by acid rain breaking apart of shale as a result of water freezing in a crack rolling of a pebble
APPLICATION OF ELECTRICAL RESISTIVITY TOMOGRAPHY FOR SAND UNDERWATER EXTRACTION
 International Scientific Conference GEOBALCANICA 2018 APPLICATION OF ELECTRICAL RESISTIVITY TOMOGRAPHY FOR SAND UNDERWATER EXTRACTION Maya Grigorova Ivaylo Koprev University of Mining and Geology St. Ivan
Structural Features and Fracture Orientation similarities between outcrops of the Ridgeley Sandstone
 The JUNIATA JOURNAL of GEOLOGY, 1, 1-8 (2014) Original article Structural Features and Fracture Orientation similarities between outcrops of the Ridgeley Sandstone Robert W. Baronner Two outcrops of the
Improved Imaging through Refraction Statics in a Sand Dune Area: A Case Study.
 P - 340 Improved Imaging through Refraction Statics in a Sand Dune Area: A Case Study. B.N. Roy*, Vikas Chandra, S.S. Singh, G.S.Ramakishna, & Randeep Guha, ONGC, Vadodara, bhupenr2000@yahoo.co.in Summary
EFFECTS OF LOCAL METEOROLOGICAL VARIABILITY ON SURFACE AND SUBSURFACE SEISMIC-ACOUSTIC SIGNALS
 EFFECTS OF LOCAL METEOROLOGICAL VARIABILITY ON SURFACE AND SUBSURFACE SEISMIC-ACOUSTIC SIGNALS Jason R. McKenna and Mihan H. McKenna U.S. Army Engineer Research & Development Center, Vicksburg, MS 39180
Estimating vertical and horizontal resistivity of the overburden and the reservoir for the Alvheim Boa field. Folke Engelmark* and Johan Mattsson, PGS
 Estimating vertical and horizontal resistivity of the overburden and the reservoir for the Alvheim Boa field. Folke Engelmark* and Johan Mattsson, PGS Summary Towed streamer EM data was acquired in October
GPR AS A COST EFFECTIVE BEDROCK MAPPING TOOL FOR LARGE AREAS. Abstract
 GPR AS A COST EFFECTIVE BEDROCK MAPPING TOOL FOR LARGE AREAS Dr. Jutta L. Hager, Hager GeoScience, Inc., Waltham, MA Mario Carnevale, Hager GeoScience, Inc., Waltham, MA Abstract Hager GeoScience, Inc.
Bandlimited impedance inversion: using well logs to fill low frequency information in a non-homogenous model
 Bandlimited impedance inversion: using well logs to fill low frequency information in a non-homogenous model Heather J.E. Lloyd and Gary F. Margrave ABSTRACT An acoustic bandlimited impedance inversion
Integration of Surface Seismic Data with Geo-electric Data
 Integration of Surface Seismic Data with Geo-electric Data ABDULRAHMAN AL-SHUHAIL Earth Sciences Department King Fahd Univesity of Petroleum & Minerals. SAUDI ARABIA s234817@kfupm.edu.sa Abstract: - The
1. The map below shows a meandering river. A A' is the location of a cross section. The arrows show the direction of the river flow.
 1. The map below shows a meandering river. A A' is the location of a cross section. The arrows show the direction of the river flow. Which cross section best represents the shape of the river bottom at
Refraction analysis of the Blackfoot 2D-3C data
 Refraction analysis of the Blackfoot 2D-3C data Refraction analysis of the Blackfoot 2D-3C data Jocelyn Dufour, and Don C. Lawton ABSTRACT A three-component 2D seismic line was acquired in the Blackfoot
Earthquakes.
 Earthquakes http://quake.usgs.gov/recenteqs/latestfault.htm An earthquake is a sudden motion or shaking of the Earth's crust, caused by the abrupt release of stored energy in the rocks beneath the surface.
P128 Subsurface Fault and Colluvial Wedge Detection Using Resistivity, Refraction Tomography and Seismic Reflection
 P128 Subsurface Fault and Colluvial Wedge Detection Using Resistivity, Refraction Tomography and Seismic Reflection S.M. Hanafy* (King Abdullah University of Science & Technology) SUMMARY Electric resistivity
QUANTITATIVE INTERPRETATION
 QUANTITATIVE INTERPRETATION THE AIM OF QUANTITATIVE INTERPRETATION (QI) IS, THROUGH THE USE OF AMPLITUDE ANALYSIS, TO PREDICT LITHOLOGY AND FLUID CONTENT AWAY FROM THE WELL BORE This process should make
Seepage Analysis for Shurijeh Reservoir Dam Using Finite Element Method. S. Soleymani 1, A. Akhtarpur 2
 Seepage Analysis for Shurijeh Reservoir Dam Using Finite Element Method S. Soleymani 1, A. Akhtarpur 2 1 Group of Dam Construction, Toossab Company, P.O. Box 917751569, Mashhad City, Iran, PH (+98) 511-7684091;