Beach Sediment Tracer Study Beach Tracer Report for Portsmouth & Hayling Island Frontage
|
|
|
- Shannon Sanders
- 5 years ago
- Views:
Transcription
1 Beach Sediment Tracer Study Beach Tracer Report for Portsmouth & Hayling Island Frontage
2 Introduction The SCOPAC Sediment Transport Study (2004) identified several limitations in the current understanding of coastal sediment transport in the East Solent. To help overcome the knowledge limitations there is a need to: 1) Confirm the presence of a drift reversal at Gunner Point, and identify the location of the resulting drift divide; 2) Ascertain both the net direction and rate of littoral drift at Southsea; 3) Estimate attrition losses to inform revised estimates of the longevity of recharged beaches; 4) Ascertain the feed of material to both Eastoke and Eastney from tidal deltas. The knowledge limitations can all be addressed, to varying degrees, using tracer pebbles to track the movement of material along the beach. Historically various tracer techniques have been utilised, ranging from painting native pebbles to aluminium tracers and copper cored resin pebbles. Each of these techniques has limitations when deployed over longer periods of time, e.g. months to years, as required to study attrition rates, and establish long-term sediment pathways. A new tracer technique has been developed and deployed in the US, utilising radio-frequency identification (RFID) technology to track objects in rivers and beaches. The system has three main components; PIT tags, an antenna & reader, and PDA or datalogger. PIT (Passive Induced Transponder) tags are small glass encapsulated capsules that broadcast a unique identification number when detected. The tags do not contain an internal power source, and can be embedded within pebbles taken from beaches in the study area. When embedded within suitable pebbles the tags can be used for long-term deployments with no risk of identification markings wearing off the exterior of the pebble. Once detected the position of the pebble can be recorded using GPS technology, and if required the pebble can be recovered from the beach to establish a precise location and burial depth. RFID Antennas & Readers Three RFID detection units have been purchased or constructed to enable the efficient location of tagged pebbles once deployed; a short-range wand, a hand-held antenna & a towed antenna array. The detection range varies between antennas, and is also affected by the size and orientation of PIT tag being detected. 2 Beach Sediment Tracer Study


3 The hand-held wand has a limited read range, typically less than 0.2m, and is used during tagging of the pebbles and to home in on individual tags for recovery from the beach. The hand-held antenna has a greater read range, upto one metre, and is used to sweep the beach on foot. The towed array consists of four antennas, covering a 5 metre width of beach. The towed array also has a read range of upto one metre, and is suitable for use on wide open flat areas of the beach where a quad bike can be used to tow the array across the surface. Short range wand Hand-held antenna Towed antenna array Tracer Tagging & Measurement A total of 2,800 23mm and 32mm PIT tags were purchased and embedded in native pebbles collected from the 2 sites. In order to insert the PIT tags, a 6mm diameter hole was professionally drilled. Initial trials indicated that drilling holes in flint using a conventional drill resulted in prohibitively high shatter rates. A new technique was developed utilising a water jet containing fine grit to drill a hole through the centre of each pebble, with virtually no shattering of the encased pebbles. Once drilled, the PIT tags are sealed in place using epoxy resin mixed with mineral filler. This could then be filed smooth to match the pebble surface. The PIT tag detection range is greatest when orientated towards the antenna, thus to increase the likelihood of the tag being orientated in this manner when lying on the beach, the tags were inserted along the short-axis of the pebble. Beach Sediment Tracer Study
4 Once the tags were inserted each pebble was individually weighed, and the long-, mediumand short-axis measured using callipers. These catalogued measurements may be used as a baseline against which to calculate attrition rates for any pebbles recovered. Tracer Deployment & Monitoring An initial trial deployment of 300 tracers was carried out on the Eastoke frontage between 13 th and 26 th September The tracers remained within three adjacent groyne bays, and the average detection rate was >70%. The Eastoke site was chosen to reduce the risk of pebble losses either offshore, or into tidal inlets, during the first deployment. These initial tracers were left in the field to allow attrition estimates to be gained over a longer period of deployment. A further 1000 pebbles were deployed at Eastoke during March 2011 and 250 at 3 sites near to the entrance to Langstone Harbour during January This made a total of 14 deployments along the Hayling Island frontage (see Figure 1). Pebbles were deployed either side of the Harbour entrance to ascertain the direction of littoral drift and location of any drift divides. There were a total of 12 deployment sites at Portsmouth, with the release of 1800 pebbles at various sites along the whole open coast frontage (Figure 2). Pebbles were released along the beach at the approximate location of Mean Sea Level (0.17mOD) During May 2012, 100 pebbles were released at MSL (0.01mOD) for a trial at Lee-On-Solent as part of the sediment transport study for the River Hamble to Portchester Strategy (RHPS). Following this trial, a further deployment of 1500 pebbles occurred at 3 sites along this frontage during March These deployments used a 12mm RFID tag as the sediment grading on these beaches was smaller than that of Portsmouth or Hayling. Monitoring surveys were conducted after the first week of deployment and then approximately every 1-2 months for the first year in the field. After the first year the frequency of survey was once per annum, with the tracers now within the field environment for over 2 years. After 300 days in the field, recovery rates for the tracer pebbles can be expected to be less than 10% of initial deployment numbers. 4 Beach Sediment Tracer Study
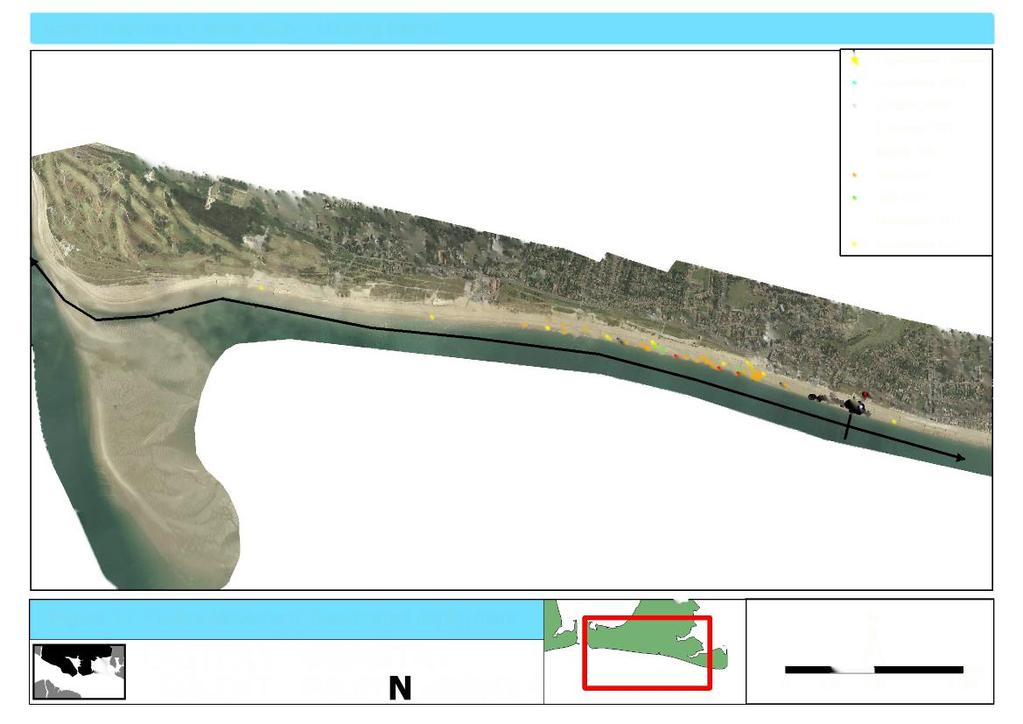
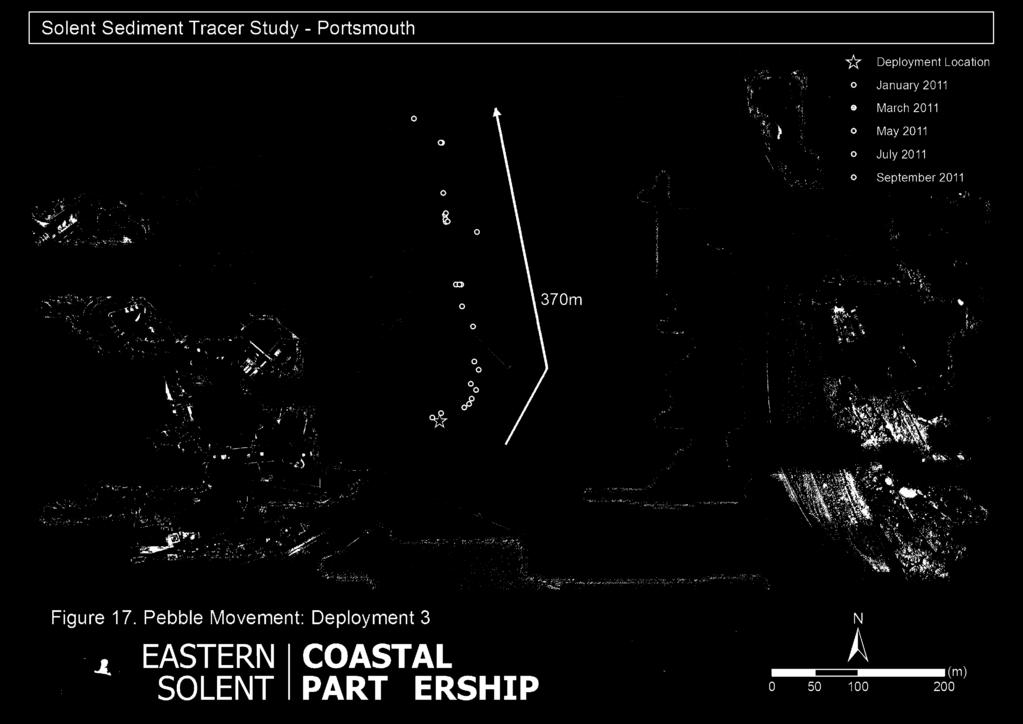
5 Results Hayling Island - Eastoke Deployments at Eastoke (Figures 3 12) would suggest the presence of a drift divide along this section of frontage, approximately at the junction of Southwood Road and Creek Road (Figures 11-12). Pebbles deployed east of this point generally move in an eastwards direction, around into the harbour entrance, at an estimated rate of up to 60m/per month. The largest movement can be found near the harbour entrance where the tidal currents are strongest. Pebbles deployed west of the drift divide generally move in a westerly direction, at an estimated rate of up to 130m/per month although these pebbles may have been artificially influenced by beach recycling activities in this area. However, a further deployment on Hayling beach frontage (Figure 13) indicates pebble movement to the west of 4800m over a 2 year period (or approximately 200m/per month). Hayling Island Gunner Point There have been 3 deployments at Gunner Point, all showing strong westerly transport towards the entrance to Langstone Harbour (Figures 14-16). Transport rates are approximately 60m/per month westwards, although within the harbour entrance there is evidence to suggest a transport direction south towards the sand banks, probably due to the strong tidal currents. However pebbles here are difficult to locate and quickly lost in deep water channels, buried or swept away. Portsmouth Eastney There have been 4 deployments at Eastney, 2 around the harbour entrance and 2 along the open frontage. The deployments within the harbour entrance both show movement of pebbles northwards into Langstone Harbour, with transport rates of approximately 50m/per month (Figure 17-18). There is evidence that the long groyne at the harbour entrance and the pier to the north, both allow sediment transport around and beyond the structures. The deployments along the open frontage both show movement west and east, although the predominate direction appears to be westerly transport (Figures 19-20). Portsmouth Southsea To the west of South Parade Pier there have been 2 deployments which have resulted in a predominately easterly sediment transport direction of approximately 50-60m/per month (Figures 21-22). For 2 deployments east of the pier the pebbles have moved in both directions, although there is a greater number found moving west (Figures 23-24). Beach Sediment Tracer Study
6 Portsmouth Clarence Parade & Old Portsmouth There have been 4 deployments along this complex stretch of heavily engineered coastline (Figure 25-28). The general trend is for pebble movement north west towards the harbour entrance. There are numerous structures, narrow beaches and a deep water channel close to the foreshore, thus pebbles here are easily lost from the system. Recovery rates are especially low for these deployments. Findings & Limitations Recovery Rates The collected data suggests that the recovery rate of the tracer pebbles decreases rapidly after deployment, with very few results returned after 1 year in the field. The poor recovery rate may be partly influenced by the nature of the bespoke detection kit, which is limited in its capabilities for long term tracer studies. Recent deployments of pebbles for the River Hamble to Portchester Strategy have resulted in a detection rate of less than 20% returned after 1 month in the field, with several locations as low as 5% detection rate. These deployments have used a smaller pebble with a smaller PIT tag which may account for these low readings. In the majority of deployments, it is generally rare to find the same pebble more than once or twice, making it difficult to draw any definitive sediment transport rates from the study. Tracer Burial Depth Following a tracer burial depth experiment conducted for SCOPAC, it has been ascertained that the detection range of the pebbles is influenced by a number of different factors. The results from the trial indicate that the detection range is greatest for the larger RFID tags and that type of sediment can have an influence on the detection range. The actual detection range is up to a maximum of 0.8m in gravel for the 23mm RFID but this is reduced to around 0.35m for the 12mm RFIDs used for the RHPS. Further details of the tracer burial depth can be found in the report presented to SCOPAC in February Attrition Initial proposals for the project were to estimate attrition rates for the beaches along this study frontage in order to estimate the longevity of recharged beaches. Attrition in the coastal environment is a form of erosion occurring to beach material, due to the regular impact between the bedload causing them to be broken up into smaller fragments. This process also produces pebbles which are rounder, smoother and over time smaller. 6 Beach Sediment Tracer Study

7 In theory the tracer pebbles released into the environment can be measured over time and compared to the initial cataloguing measurements recorded prior to deployment. However with very low recovery rates after a year and potentially ever decreasing, the practice of recovering pebbles within the field to re-measure and weigh them would be extremely costly. Localised Conditions A tracer pebble study relies on long term trends in order to produce useful and meaningful results, as localised conditions can alter the pattern of sediment transport daily. Although the greatest detection rate is within the first surveys, it should be noted that results obtained after only several weeks or months may not necessarily be representative of the longer term trends within that stretch of coastline, particularly if prevailing weather and sea conditions have been adverse. More reliable results should be built up over the longer term of the study, although the retrieval rates will be proportionately lower as time goes on. SCOPAC sediment transport model Beach Sediment Tracer Study
8 The SCOPAC sediment transport study (2004) provides a broad scale overview of sediment transport along the Portsmouth and Hayling Island frontage. It identifies several drift divides along the coastline, transport northwards in to the harbour entrances, as well as a general east to west transport rate along the open coast. Part of this tracer study was to investigate the sediment transport pathways around the coastline and in particular to 1) Confirm the presence of a drift reversal at Gunner Point, and identify the location of the resulting drift divide. The evidence to date would suggest that the sediment transport direction at Gunner Point is from east to west and then northwards in to the harbour entrance. There is little evidence to suggest that there is a drift divide at this point in the coastline although there may be movement of material further offshore that is not recorded by the tracer study. 2) Ascertain both the net direction and rate of littoral drift at Southsea The direction of littoral drift at Southsea appears to be complex, with material moving both east and west along this section of coastline. West of the pier, material generally moves east towards the pier and beyond but east of the pier material appears to move west. However further towards Eastney the net sediment transport appears to be easterly moving in to the harbour entrance. This is in agreement with the drift divide shown at this location in the current SCOPAC sediment transport model. 3) Estimate attrition losses to inform revised estimates of the longevity of recharged beaches At this stage it is unlikely this study will proceed due to the time and cost of recording the pebbles combined with the very low recovery rates. 4) Ascertain the feed of material to both Eastoke and Eastney from tidal deltas. Whilst the feed of material for both Eastney and Eastoke is from the beaches to the west, it is difficult to comment at this point in the study regarding material from the tidal deltas. They have not been surveyed due to the expanse of the sand banks and the limitations associated with the detector kit such as burial depth detection. Recommendations & Successes Whilst the tracer study has so far produced some useful results, the limitations of the study are such that the results are generally qualitative providing approximate sediment transport directions along the coastline. Whilst further detailed analysis could be performed on the results to date, it is unlikely to fundamentally alter the main findings. 8 Beach Sediment Tracer Study
9 However, as a communication tool to non technical audiences the study and the presentation of results have proved extremely successful and generated notable worldwide interest. In particular the detection of pebbles using the survey kit has been widely received as a useful engagement method with people unfamiliar with the study who would like hands on experience of coastal processes and the methods used to currently study them. The tracer results and any further analysis could provide a useful additional source of information to feed in to the latest SCOPAC sediment transport study which is currently undergoing review and updates. Much of the current findings within this report are broadly similar to the 2004 SCOPAC sediment transport study, however the level of detail could prove a useful addition. The main limitations currently associated with the study lie in the detection range of the pebbles and the uncertain nature of the survey kit itself. The results become more valuable as the length of time the pebbles are in the field increases, however this also increases the associated time and costs of detecting the remaining tracers along with ever diminishing returns. At present this technique would be useful for short term localised projects to examine the movement of material around a structure or short section of coastline. However, longer term studies of complex beach frontages are not realistically possible with the present setup of survey equipment used or the PIT tags employed in the pebbles. Beach Sediment Tracer Study


10


11

12


13

14


15


16


17


18


19


20

21


22

23


24
25


26


27


28


29


30


31
32 Solent Sediment Tracer Study - Portsmouth ^_ Deployment Location September 2011 November 2011 March 2011 July 2011 January 2012 December 2012 ^_ 1020m Figure 23. Pebble Movement: Deployment 10 ± (m)


33

34


35


36


37
38 10 Beach Sediment Tracer Study
Coastal Ocean Circulation Experiment off Senegal (COCES)
") DISTRIBUTION STATEMENT A. Approved for public release; distribution is unlimited. Coastal Ocean Circulation Experiment off Senegal (COCES) Pierre-Marie Poulain Istituto Nazionale di Oceanografia e di Geofisica
DISTRIBUTION STATEMENT A. Approved for public release; distribution is unlimited. Coastal Ocean Circulation Experiment off Senegal (COCES) Pierre-Marie Poulain Istituto Nazionale di Oceanografia e di Geofisica
QU: Where does sand do jail time? AIM: To explain the sediment cell concept as a system and what human and natural factors create/upset a dynamic
 QU: Where does sand do jail time? AIM: To explain the sediment cell concept as a system and what human and natural factors create/upset a dynamic equilibrium. ST: On your copy draw and label future depositional
CHANGES IN BEACH SURFACE SEDIMENT COMPOSITION
 CHANGES IN BEACH SURFACE SEDIMENT COMPOSITION Compiled by Tamsin Watt. Edited by Rendel Williams and Cherith Moses 1 Aims...2 2 Introduction...2 3 Sites...2 4 Survey methodology...2 5 Analysis procedure...3
Supplemental Slides. Shore: Junction of Land & Water. Junction of Land & Water. Sea Level Variations. Shore vs. Coast. Sea Level Variations
 Shore: Junction of Land & Water Supplemental Slides Sediments come off land Most get dumped at the beach Sediment interacts with ocean waves and currents Junction of Land & Water Features: Breaking waves,
Shore: Junction of Land & Water. Sediments come off land Most get dumped at the beach Sediment interacts with ocean waves and currents
 Shore: Junction of Land & Water Supplemental Slides Sediments come off land Most get dumped at the beach Sediment interacts with ocean waves and currents Junction of Land & Water Features: Breaking waves,
Coastal Storms of the New Jersey Shore
 Coastal Storms of the New Jersey Shore Dr. Steven G. Decker Dept. of Environmental Sciences School of Environmental and Biological Sciences Rutgers University May 25, 2011 Overview Threats Historical Examples
Northern Sea Wall, Kent
 Northern Sea Wall, Kent The North Kent Shoreline Management Plan (SMP) defines management units along the North Kent coast ranging from Management Unit 4a - 1A at the Isle of Grain, to Management Unit
8.1 Attachment 1: Ambient Weather Conditions at Jervoise Bay, Cockburn Sound
 8.1 Attachment 1: Ambient Weather Conditions at Jervoise Bay, Cockburn Sound Cockburn Sound is 20km south of the Perth-Fremantle area and has two features that are unique along Perth s metropolitan coast
SHORELINE AND BEACH PROCESSES: PART 2. Implications for Coastal Engineering
 SHORELINE AND BEACH PROCESSES: PART 2 Implications for Coastal Engineering Objectives of the lecture: Part 2 Show examples of coastal engineering Discuss the practical difficulties of ocean engineering
BYPASS IN GROYNE FIELDS: CASE STUDY ALONG THE LOBITO SPIT
 BYPASS IN GROYNE FIELDS: CASE STUDY ALONG THE LOBITO SPIT Sten Esbjørn Kristensen 1, Nils Drønen 2, Rolf Deigaard 3, Berry Elfrink 4 Abstract The Lobito spit, in Angola, is fronted by a groyne field along
Seaton to Seaton Hole SUMMARY OF PREFERRED PLAN RECOMMENDATIONS AND JUSTIFICATION
 Location reference: Policy Unit reference: Plan: Seaton to Seaton Hole 6a29 and 6a30 SUMMARY OF PREFERRED PLAN RECOMMENDATIONS AND JUSTIFICATION The large number of properties and assets at risk in the
The Urban Sea and Coastal Zone Management
 The Urban Sea and Coastal Zone Management David NEALE, Trinidad and Tobago Key words: hydrography, Caribbean, coastal zone management, land use. SUMMARY Within the coastal zone of Eastern Caribbean States,
Map 2: Cowal Peninsula: Lazaretto Point to Dunoon Harbour North Map Content Descriptions
 Map 2: Cowal Peninsula: Lazaretto Point to Dunoon Harbour North Map Content Descriptions 1. Built Heritage and Archaeology A total of thirteen sites were recorded in the area covered by Map 2. Of these
EDUCATION PROGRAMS GUIDE
 EDUCATION PROGRAMS GUIDE Inner Space Center University of Rhode Island Graduate School of Oceanography innerspacecenter.org ABOUT THE ISC The Inner Space Center (ISC) is an international leader in ocean
Holderness Erosion and Evolution of the Spurn Peninsula
 Holderness Erosion and Evolution of the Spurn Peninsula Prof. Ken Pye and Dr. Simon Blott Kenneth Pye Associates Ltd. Outline of the Presentation Overview of historical erosion trends Effects of coast
NIWA Outlook: October - December 2015
 October December 2015 Issued: 1 October 2015 Hold mouse over links and press ctrl + left click to jump to the information you require: Overview Regional predictions for the next three months: Northland,
Prepared by the North American Ice Service. 4 December Seasonal Outlook Great Lakes Winter
 Prepared by the North American Ice Service A collaboration of the Canadian Ice Service and the National/Naval Ice Center 4 December 2008 Seasonal Outlook Great Lakes Winter 2008-2009 - 1 - Table of contents
Erosion and Deposition
 CHAPTER 3 LESSON 2 Erosion and Deposition Landforms Shaped by Water and Wind Key Concepts What are the stages of stream development? How do water erosion and deposition change Earth s surface? How do wind
DESIGN ENGINEERING ANALYSIS FOR TERMINAL GROIN LENGTH
 APPENDIX F DESIGN ENGINEERING ANALYSIS FOR TERMINAL GROIN LENGTH (Prepared by Olsen Associates, Inc.) DRAFT Environmental Impact Statement Village of Bald Head Island Shoreline Protection Project Brunswick
Looking after Lyme Regis
 Looking after Lyme Regis Lyme Regis sits on one of the most unstable stretches of coastline in the country. The highly active and unstable nature of the land which Lyme Regis is built upon can easily be
The Coast: Beaches and Shoreline Processes
 1 2 3 4 5 6 7 8 9 The Coast: es and Shoreline Processes Trujillo & Thurman, Chapter 10 Oceanography 101 Chapter Objectives Recognize the various landforms characteristic of beaches and coastal regions.
Year 6. Geography. Revision
 Year 6 Geography Revision November 2017 Rivers and World knowledge How the water cycle works and the meaning of the terms evaporation, condensation, precipitation, transpiration, surface run-off, groundwater
The Coast: Beaches and Shoreline Processes Trujillo & Thurman, Chapter 10
 The Coast: es and Shoreline Processes Trujillo & Thurman, Chapter 10 Oceanography 101 Chapter Objectives Recognize the various landforms characteristic of beaches and coastal regions. Identify seasonal
Sediment Connectivity and Exchange in Ameland Inlet
 Sediment Connectivity and Exchange in Ameland Inlet Stuart G. Pearson, Bram C. van Prooijen, Zheng Bing Wang, and Jasper P. Bak January 11 th, 2017 NCK Symposium on Sediment Sorting Study Site: Ameland
Map 4: Cowal Peninsula: Cluniter to Ardyne Point Map Content Descriptions
 Map 4: Cowal Peninsula: Cluniter to Ardyne Point Map Content Descriptions 1. Built Heritage and Archaeology A total of twenty four sites were recorded in the area covered by Map 4. Of these six were previously
Monitoring Report No. 022 GREENCASTLE BURIALS GREEN CASTLE COUNTY DOWN LICENCE NO. N/A PHILIP MACDONALD
 Monitoring Report No. 022 GREENCASTLE BURIALS GREEN CASTLE COUNTY DOWN LICENCE NO. N/A PHILIP MACDONALD Monitoring Report No. 022 Greencastle Burials (SMR No. Down 057:017) Greencastle Co. Down Philip
East Head, West Wittering and Cakeham: Interpretation of beach changes
 East Head, West Wittering and Cakeham: Interpretation of beach changes 2004-09 Draft Report to: Chichester District Council and East Head Coastal Issues Advisory Group Malcolm Bray University of Portsmouth
Term Knowledge Using and applying Grade Criteria Autumn 1 Assessment window October Natural hazards pose major risks to people and property.
 Assessment Schedule Year 9 2015/6 Term Knowledge Using and applying Grade Criteria Autumn 1 Assessment window October 2015 3.1.1.2 Tectonic Natural hazards pose major risks to people and property. Definition
OLD BAR BEACH SAND TRACING STUDY: ILLUMINATING THE PATHWAYS
 OLD BAR BEACH SAND TRACING STUDY: ILLUMINATING THE PATHWAYS P Lawless 1, M Griffith 2, J Marsh 3, P Evans 4, G Blumberg 1 1 Royal HaskoningDHV, Sydney 2 Greater Taree City Council, Taree 3 ETS (Worldwide),
What is weathering and how does it change Earth s surface? Answer the question using
 7 th Grade Lesson What is weathering and how does it change Earth s surface? Answer the question using the sentence frame. You have 4 minutes. Weathering is. This changes the Earth s surface because. 1
Developed in Consultation with Florida Educators
 Developed in Consultation with Florida Educators Table of Contents Next Generation Sunshine State Standards Correlation Chart... 7 Benchmarks Chapter 1 The Practice of Science...................... 11
South Bay Coastal Ocean Observing System California Clean Beaches Initiative
 South Bay Coastal Ocean Observing System California Clean Beaches Initiative Third Quarterly Report April, 2003 to City of Imperial Beach Eric Terrill 1 1 Scripps Institution of Oceanography, University
Flood Risk Mapping and Forecasting in England
 Flood Risk Mapping and Forecasting in England Mark Franklin Environment Agency, England NORDESS Workshop on Risk Assessment and Acceptable Risk Outline Flood risk in England Who we are and how we work
Map 10: Ayrshire Coast: Barassie to Prestwick North Map Content Descriptions
 Map 10: Ayrshire Coast: Barassie to Prestwick North Map Content Descriptions 1. Built Heritage and Archaeology A total of thirteen sites were recorded in the area covered by Map 10. Of these nine were
3.0 ROBERTS BANK TIDAL FLAT MORPHOLOGY
 Vancouver Port Authority Northwest Hydraulic Consultants Ltd. /Triton Consultants Ltd. Roberts Bank Container Expansion File: 33863 Coastal Geomorphology Study - 19 - November 2004 3.0 ROBERTS BANK TIDAL
Dynamic preservation of the coastline
 Dynamic preservation of the coastline Content Introduction The Dutch coastal defence by dynamic processes Data collection Management of the sand resources Growing importance of marine sand and gravel resources
1 Shoreline Landforms 2. 2 Emergent v. Submergent 2. 3 Wavecutting 3. 4 Planview 4. 5 Marine Terraces 5. 6 California 7. 7 Tombolos, Sea Stacks 8
 Shorelines November 9, 2008 Contents 1 Shoreline Landforms 2 2 Emergent v. Submergent 2 3 Wavecutting 3 4 Planview 4 5 Marine Terraces 5 6 California 7 7 Tombolos, Sea Stacks 8 8 Active Processes 9 9 Emergence
Seasonal Summary Eastern Canada Winter By The
 Seasonal Summary Eastern Canada Winter 2017-2018 By The Summary for the East Coast The winter 2017-2018 ice season was marked by two separate phases in ice growth and destruction, which often is not a
This file is part of the following reference: Access to this file is available from:
 This file is part of the following reference: Page, Geoff () Mass Transport Evaluation using consolidated VHF Radar and Acoustic Doppler Current Profiler data. Masters (Research) thesis, James Cook University.
Addendum to the Essex and South Suffolk Second Generation Shoreline Management Plan
 Addendum to the Essex and South Suffolk Second Generation Shoreline Management Plan September 2012 CONTENTS 1. Introduction 1 2. Changes in saltmarsh habitat 1 3. Preferred managed realignment policy options
The Upper Course of a River
 The Upper Course of a River I. Introduction A river is split along the long profile into three different sections; the upper, middle and lower course. As GCSE students you are expected to know the characteristics
New Zealand Climate Update No 223, January 2018 Current climate December 2017
 New Zealand Climate Update No 223, January 2018 Current climate December 2017 December 2017 was characterised by higher than normal sea level pressure over New Zealand and the surrounding seas. This pressure
Produced by Canadian Ice Service of. 2 December Seasonal Outlook Gulf of St Lawrence and East Newfoundland Waters Winter
 Environment Canada Environnement Canada Produced by Canadian Ice Service of Environment Canada 2 December 2010 Seasonal Outlook Gulf of St Lawrence and East Newfoundland Waters Winter 2010-2011 2010 Canadian
Name: Which rock layers appear to be most resistant to weathering? A) A, C, and E B) B and D
 A, C, and E B) B and D") Name: 1) The formation of soil is primarily the result of A) stream deposition and runoff B) precipitation and wind erosion C) stream erosion and mass movement D) weathering and biological activity 2)
Name: 1) The formation of soil is primarily the result of A) stream deposition and runoff B) precipitation and wind erosion C) stream erosion and mass movement D) weathering and biological activity 2)
STUDY AREA AND METHODOLOGY
 . CHAPTER 2 STUDY AREA AND METHODOLOGY 26 CHAPTER 2 STUDY AREA AND METHODOLOGY Kundalika is a major river in konkan region of Maharashtra. River originates in Western Ghats at an altitude of 820 m ASL
Bob Van Dolah. Marine Resources Research Institute South Carolina Department of Natural Resources
 Bob Van Dolah Marine Resources Research Institute South Carolina Department of Natural Resources Shoreline Change Will Occur! On our front beaches where it is not easy to retreat Shoreline Change Will
Map 12: Ayrshire Coast: Doonfoot Beach to Dunure Map Content Descriptions
 Map 12: Ayrshire Coast: Doonfoot Beach to Dunure Map Content Descriptions 1. Built Heritage and Archaeology A total of twenty three sites were located in the area covered by Map 12. Of these seventeen
Annual transport rates at two locations on the fore-slope.
 Sediment Transport by Currents Fore-slope Sediment transport rates and sediment concentrations were computed from the hydrodynamic model runs as well as from direct measurements of current velocities at
SEGMENTED BREAKWATERS AND THEIR USE IN COASTAL LOUISIANA
 SEGMENTED BREAKWATERS AND THEIR USE IN COASTAL LOUISIANA Prepared by: Louisiana Coastal Protection and Restoration Authority Engineering Division March 2016 The geology of Louisiana s coastal zone is intimately
2013 Tide Newsletter and occasionally by much more. What's more,
 The Official Newsletter for the Nor easters Metal Detecting Club! Tide s Ed it io n HTTP://WWW.NOR EASTER S.NET Year ly Ti des for 2013 The Metal Detecting Creed By Jessie Thompson We are Metal Detectorists.
Form 4 of Schedule 5 of the Exclusive Economic Zone and Continental Shelf (Environmental Effects Permitted Activities) Regulations 2013
 Regulations 2013") FORM 4 Permitted activities: Post-activity report Form 4 of Schedule 5 of the Exclusive Economic Zone and Continental Shelf (Environmental Effects Permitted Activities) Regulations 2013 How to use this
FORM 4 Permitted activities: Post-activity report Form 4 of Schedule 5 of the Exclusive Economic Zone and Continental Shelf (Environmental Effects Permitted Activities) Regulations 2013 How to use this
6.11 Naas River Management Unit
 6.11 Naas River Management Unit 6.11.1 Site 41 Issue: Bed and bank erosion Location: E 0685848 N 6058358 Waterway: Naas River Management Unit: Naas River Facing downstream from Bobeyan Rd bridge Facing
South Carolina BMA. Jurisdictional Line Revisions
 South Carolina BMA Jurisdictional Line Revisions 40 Year Retreat Policy A forty year policy of retreat from the shoreline is established. The department must implement this policy and utilize the best
 Page 1 of 9 Name: Base your answer to the question on the diagram below. The arrows show the direction in which sediment is being transported along the shoreline. A barrier beach has formed, creating a
ENGINEERING APPROACHES TO SHORELINE PLACEMENT FROM COAST TO COAST
 ENGINEERING APPROACHES TO SHORELINE PLACEMENT FROM COAST TO COAST 237 237 237 217 217 217 200 200 200 0 0 0 163 163 163 131 132 122 80 119 27 252 174.59 83 36 118 110 135 120 112 92 56 62 102 130 Comparing
NIWA Outlook: March-May 2015
 March May 2015 Issued: 27 February 2015 Hold mouse over links and press ctrl + left click to jump to the information you require: Overview Regional predictions for the next three months: Northland, Auckland,
SHORELINE MANAGEMENT PLAN FOR OWEN ANCHORAGE AND COCKBURN SOUND SHORELINE MONITORING PLAN
 SHORELINE MANAGEMENT PLAN FOR OWEN ANCHORAGE AND COCKBURN SOUND SHORELINE MONITORING PLAN CHAPTER EIGHT OF DOCUMENT: LONG-TERM SHELLSAND DREDGING, OWEN ANCHORAGE ENVIRONMENTAL MANAGEMENT PROGRAMME JUNE
Teacher s Pack Key Stage 3 GEOGRAPHY
 Teacher s Pack Key Stage 3 GEOGRAPHY Geography Key Stage 3 Fieldwork Worksheet Rivers: 1. Is the water fresh or salty? (test its resistance or specific gravity) 2. Do you know where the water is coming
Relatively little hard substrate occurs naturally in the
 CHAPTER FIVE Rock Habitats Relatively little hard substrate occurs naturally in the estuary, owing mainly to the vast quantities of fine sediment that have been deposited by the rivers. Rock habitat is
Ireland: Predictions. NMP Current closures ASP AZP DSP PSP
 HAB Bulletin [status of harmful and toxic algae] Ireland: Predictions ASP event: Low AZP event: High DSP event: High PSP event: High (site specific, moderate in general) Week 30: July 17 th - July 22 nd
Coastal Sediment Properties and Longshore Sediment Transport
 Coastal Sediment Properties and Longshore Sediment Transport Julie Rosati Julie.D.Rosati@erdc.usace.army.mil 601-634-3005 Coastal Planning Course Lesson #8 Tuesday 8:00-9:00 am CEM III-1, III-2 1. Coastal
The Geology of Sebago Lake State Park
 Maine Geologic Facts and Localities September, 2002 43 55 17.46 N, 70 34 13.07 W Text by Robert Johnston, Department of Agriculture, Conservation & Forestry 1 Map by Robert Johnston Introduction Sebago
YEAR 9 (13+) SCHOLARSHIP. February 2014 for entry in September 2014 GENERAL PAPER. Your Name: Your School:
 SCHOLARSHIP. February 2014 for entry in September 2014 GENERAL PAPER. Your Name: Your School:") YEAR 9 (13+) SCHOLARSHIP February 2014 for entry in September 2014 GENERAL PAPER Your Name: Your School: Time allowed: 1 hour 15 minutes (including 5 minutes reading time) Equipment needed: Map and photograph
YEAR 9 (13+) SCHOLARSHIP February 2014 for entry in September 2014 GENERAL PAPER Your Name: Your School: Time allowed: 1 hour 15 minutes (including 5 minutes reading time) Equipment needed: Map and photograph
What Maintains the Western Gulf of Maine Cod Stock?
 What Maintains the Western Gulf of Maine Cod Stock? James Churchill Woods Hole Oceanographic Inst.; Woods Hole MA, jchurchill@whoi.edu, Jeffrey Runge School of Marine Sciences, University of Maine, Gulf
BOEM Marine Minerals Program
 BOEM Marine Minerals Program Restoring and Protecting Our Nation s Coasts through Stewardship of OCS Sand Resources SECOORA 2018 Annual Meeting May 22-24 Doug Piatkowski Douglas.piatkowski@boem.gov 703-787-1833
Ireland: Predictions. NMP Current closures ASP AZP DSP PSP DSP event: Low. AZP event: Moderate. PSP event: Very low. Why do we think this?
 HAB Bulletin [status of harmful and toxic algae] Ireland: Predictions Week 12: Mar 12 th Mar 18 th 2017 Week runs from Sunday to Saturday Week 35: 21 st - 27 h Aug, 2016 ASP event: Low AZP event: Moderate
Developing a Seabed Resurvey Strategy: A GIS approach to modelling seabed changes and resurvey risk
 Developing a Seabed Resurvey Strategy: A GIS approach to modelling seabed changes and resurvey risk A. M. Bakare, J. G. Morley, R. R. Simons Department of Geomatic Engineering, University College London,
Erich Gundlach, Ph.D.
 Oil Shoreline Interactions: Deepwater Horizon SETAC Boston, November 2011 Erich Gundlach, Ph.D. E-Tech International Inc. New York, USA ErichEti@ cs.com www.oil-spill-info.com What s Going On Shorelines
Freeze-Up Studies of the Alaskan Beaufort and Chukchi Seas: through Coastal Frontiers Corporation Vaudrey & Associates, Inc.
 Freeze-Up Studies of the Alaskan Beaufort and Chukchi Seas: 2009-10 through 2015-16 Coastal Frontiers Corporation Vaudrey & Associates, Inc. Joint-Industry Sponsors U.S. Department of the Interior Bureau
Prediction of changes in tidal system and deltas at Nakdong estuary due to construction of Busan new port
 Prediction of changes in tidal system and deltas at Nakdong estuary due to construction of Busan new port H. Gm1 & G.-Y. park2 l Department of Civil & Environmental Engineering, Kookmin University, Korea
Pratice Surface Processes Test
 1. The cross section below shows the movement of wind-driven sand particles that strike a partly exposed basalt cobble located at the surface of a windy desert. Which cross section best represents the
A Sedimentological and Granulometric Atlas of the Beach Sediments of Florida s Southwest Coast and Keys
 A Sedimentological and Granulometric Atlas of the Beach Sediments of Florida s Southwest Coast and Keys Daniel C. Phelps, Michelle M. L. Ladle, and Adel A. Dabous The Florida Geological Survey Coastal
DSP: This is currently a low risk period for early DSP events. All sites are currently below regulatory limits.
 HAB Bulletin [status of harmful and toxic algae] Ireland: Predictions Week 9: Feb 18 th Feb 25 th 2017 Week runs from Sunday to Saturday Week 35: 21 st - 27 h Aug, 2016 ASP event: Low AZP event: Moderate
Using Weather Pattern Analysis to Identify Periods of Heightened Coastal Flood Risk in the Medium to Long Range
 UEF 2017 - Storms Using Weather Pattern Analysis to Identify Periods of Heightened Coastal Flood Risk in the Medium to Long Range David Price (FFC) and Robert Neal (Met Office) Thursday 15 June The Flood
Coastal erosion in the eastern half of Christchurch Bay. RJ Nicholls & NB Webber. Abstract
 Coastal erosion in the eastern half of Christchurch Bay RJ Nicholls & NB Webber Abstract Christchurch Bay has a long history of shoreline recession and this has given rise to some major coastal engineering
Built Heritage & Archaeology Crown copyright. All rights reserved. Historic Scotland Licence No [2007] a
![Built Heritage & Archaeology Crown copyright. All rights reserved. Historic Scotland Licence No [2007] a](/thumbs/92/110316004.jpg "Built Heritage & Archaeology Crown copyright. All rights reserved. Historic Scotland Licence No [2007] a") : Tràigh an Tobair Fhuair to Meall Lamalum This map section stretches along s west coast from Tràigh an Tobair Fhuair to Meall Lamalum. The entire coastline comprises a rock platform, with the exception
: Tràigh an Tobair Fhuair to Meall Lamalum This map section stretches along s west coast from Tràigh an Tobair Fhuair to Meall Lamalum. The entire coastline comprises a rock platform, with the exception
Submission on: Draft Conservation Services Programme Strategic and Research Plan:
 Submission on: Draft Conservation Services Programme Strategic and Research Plan: 2012-17 From: Yellow-eyed Penguin Trust PO Box 5409 Dunedin Contact Person: Field Manager, David McFarlane, Phone 03-479-0011
Geol 117 Lecture 18 Beaches & Coastlines. I. Types of Coastlines A. Definition:
 I. Types of Coastlines A. Definition: 1. Shore = narrow zone where ocean meets land (e.g. beach) 2. Coast is a broad area where both ocean and land processes act a. Includes onshore marshes, dunes, sea
Read Across America. Listen as I read for facts about Volcanoes. In the Shadow of the Volcano
 Read Across America Listen as I read for facts about Volcanoes. In the Shadow of the Volcano Constructive & Destructive Processes Earth s surface is always changing. Blowing wind and flowing water causes
Coastal Study Delimara Peninsula
 Coastal Study Delimara Peninsula Edward Gilson Fieldwork Report Coastal Study Coastal Processes Delimara Peninsula Location:. Date: Time:. Apparatus:. Weather Conditions: Objectives / Aims: Geography Option
SECURITY REGULATED PORT BOUNDARY DESCRIPTION
 SECURITY REGULATED PORT BOUNDARY DESCRIPTION Description of State: Northern Territory Map Number: 68738 The Security Regulated is all of that area of land and water contained within and bounded by a line
What are the different ways rocks can be weathered?
 Romano - 223 What are the different ways rocks can be weathered? Weathering - the breakdown of rocks and minerals at the Earth s surface 1. 2. PHYSICAL WEATHERING Rock is broken into smaller pieces with
Update on Archaeological Resources Assessment for Phase 1 Dredge Areas
 Update on Archaeological Resources Assessment for Phase 1 Dredge Areas Prepared by URS Corp for General Electric Presented by John Vetter, USEPA CAG Meeting December 8, 2005 1 Presentation Outline Overview
The Systems Approach. Alun Williams, ABPmer
 The Systems Approach Alun Williams, ABPmer Overview What is A Systems Approach? Behavioural / Qualitative Modelling? System Definition / Mapping (Behavioural Statements Objective) What is a Systems Approach?
Phillip Island Nature Parks Coastal Process Study 8 October 2014
 Phillip Island Nature Parks Coastal Process Study 8 October 2014 Project Overview Coastal Geology Basaltic and fragmented lavas, granite at Pyramid Rock and Cape Woolamai Weathered basalt (>10m thick)
CE415L Applied Fluid Mechanics Laboratory
 Applied Fluid Mechanics Laboratory Learning Objective Following completion of this experiment and the analysis of the data, you should be able to 1. generalize results of introducing changes to a natural
Changes to Land 5.7B. landforms: features on the surface of Earth such as mountains, hills, dunes, oceans and rivers
 All the landforms on Earth have changed over time and continue to change. Many of the changes were caused by wind, moving water, and moving ice. Mountains have grown and shrunk. Rivers have cut away land
Map 9: Ayrshire Coast: Stevenston Pier to Barassie Map Content Descriptions
 Map 9: Ayrshire Coast: Stevenston Pier to Barassie Map Content Descriptions 1. Built Heritage and Archaeology A total of thirteen sites were recorded in the area covered by Map 9. Of these five were previously
Think about the landforms where you live. How do you think they have changed over time? How do you think they will change in the future?
 reflect All the landforms on Earth have changed over time and continue to change. Many of the changes were caused by wind, moving water, and moving ice. Mountains have grown and shrunk. Rivers have cut
Understanding and Managing Morphological Change in Estuaries
 PRESENTATION OF FINDINGS This chapter: Explores ways in which the findings from coastal studies can be communicated to others and provides a number of worked examples of the techniques outlined; Reviews
Level 1 Geography, 2013
 91010 910100 1SUPERVISOR S Level 1 Geography, 2013 91010 Apply concepts and basic geographic skills to demonstrate understanding of a given environment 9.30 am Friday 22 November 2013 Credits: Four Achievement
Weathering and Erosion
 Have you ever looked at the land around you and wondered how it was shaped? The geologic features that help define the world are still being shaped by the natural processes of weathering, erosion, and
Name. 4. The diagram below shows a soil profile formed in an area of granite bedrock. Four different soil horizons, A, B, C, and D, are shown.
 Name 1. In the cross section of the hill shown below, which rock units are probably most resistant to weathering? 4. The diagram below shows a soil profile formed in an area of granite bedrock. Four different
3.12 Geology and Topography Affected Environment
 3 Affected Environment and Environmental Consequences 3.12 Geology and Topography 3.12.1 Affected Environment 3.12.1.1 Earthquakes Sterling Highway MP 45 60 Project Draft SEIS The Kenai Peninsula is predisposed
Landslide & Coastal Erosion Risk Reduction at Oregon s Water/Wastewater Networks
 Landslide & Coastal Erosion Risk Reduction at Oregon s Water/Wastewater Networks Laura Gabel, RG (with Bill Burns, RG & Jonathan Allan, Ph. D) Oregon Department of Geology and Mineral Industries (541)
Coastal Processes and Shoreline Erosion on the Oregon Coast, Cascade Head to Cape Kiwanda
 State of Oregon Department of Geology and Mineral Industries Vicki S. McConnell, State Geologist Open File Report OFR O-04-11 Coastal Processes and Shoreline Erosion on the Oregon Coast, Cascade Head to
ENGINEERING WITH NATURE: NEARSHORE BERM PLACEMENTS AT FORT MYERS BEACH AND PERDIDO KEY, FLORIDA, USA
 1 ENGINEERING WITH NATURE: NEARSHORE BERM PLACEMENTS AT FORT MYERS BEACH AND PERDIDO KEY, FLORIDA, USA KATHERINE E. BRUTSCHÉ 1, PING WANG 2, JULIE D. ROSATI 1, CHERYL E. POLLOCK 1 1. U.S. Army Engineer
Weather Outlook: 2015 Growing Season
 Weather Outlook: 2015 Growing Season Leon F. Osborne Chester Fritz Distinguished Professor Regional Weather Information Center University of North Dakota Grand Forks, North Dakota Why Should We Be Concerned?
C E C U R R I C U L U M I E N S C B L E I T A. i N T E G R A T I N G A R T S i n O N A T I D U C B L I P U. Student Learning Objectives:
 We athering E Q U I T A B L E S C I E N C E C U R R I C U L U M Lesson 1 i N T E G R A T I N G A R T S i n P U B L I C E D U C A T I O N NGSS Science Standard: 4-ESS1-1 Identify evidence from patterns
PROSPECTING REPORT. Broken Hill Property. EVENT # TENURE # Tenure Name: Broken Hill. New Westminster Mining Division Map 092H
 2009-2010 PROSPECTING REPORT Broken Hill Property EVENT # 4514071 TENURE # 600988 Tenure Name: Broken Hill New Westminster Mining Division Map 092H Central Coordinate Reference 121 24 26.2 W Longitude