Geotechnical Engineering Services
|
|
|
- Richard Bridges
- 5 years ago
- Views:
Transcription


1 Geotechnical Engineering Services Energize Eastside Phase II Project Redmond to Renton, Washington for Puget Sound Energy June 6, 2016
2 Geotechnical Engineering Services Energize Eastside Phase II Project Redmond to Renton, Washington for Puget Sound Energy June 6, th Avenue NE Redmond, Washington
3
4 Table of Contents INTRODUCTION... 1 SITE DESCRIPTION... 1 Geologic Setting... 1 Surface Conditions... 2 Segment G Segment J... 2 Segment I... 2 Segment K Utilities Subsurface Explorations and Laboratory Testing... 3 Field Explorations... 3 Laboratory Testing... 3 Available Subsurface Information From Other Projects... 4 Subsurface Conditions... 4 Soil Profile Soil Profile Soil Profile Soil Profile Overall Summary of Soil Conditions... 5 Field Screening Results... 6 Groundwater... 6 CONCLUSIONS AND RECOMMENDATIONS... 6 Seismic Design Considerations International Building Code Design Considerations... 7 Surface Fault Rupture... 8 Liquefaction Potential... 8 Lateral Spreading... 9 Drilled Shafts... 9 Lateral Load Response Axial Capacity Downdrag Corrosion Evaluation Construction Considerations Temporary Construction Access Drilled Shaft Excavations Direct Embedment Excavations Micropiles Casing Foundations Access Road Fill Materials Excavation Cut and Fill Slopes Erosion Control Considerations for BP/Olympic Pipelines LIMITATIONS REFERENCES June 6, 2016 Page i File No
5 Table of Contents (continued) LIST OF FIGURES Figure 1. Vicinity Map Figures 2 through 8. Site Plans APPENDICES Appendix A. Field Explorations Figure A-1 Key to Exploration Logs Figure A-2 Log of Monitoring Well Figures A-3 through A-12 Log of Borings Appendix B. Geotechnical Laboratory Testing Figures B-1 through B-3 Sieve Analysis Results Appendix C. Previous Explorations Appendix D. Recommended Soil Parameters and LPILE Data Appendix E. Report Limitations and Guidelines for Use June 6, 2016 Page ii File No
6 INTRODUCTION This report presents the results of our Phase II geotechnical engineering services for design of deep foundation support for the proposed Energize Eastside Transmission Line project located in Bellevue, Washington. The Phase II project includes new 230kV service supported on new transmission poles. This phase includes Segments G2, I, and K2, which are outside existing Puget Sound Energy (PSE) easements. The Phase II alignment extends west along SE 30 th Street from the existing pole yard to Richards Road, continuing south along Richards Road and Factoria Boulevard, then southeast along Coal Creek Parkway until it intersects Segment J. The general alignment of the proposed transmission line is shown on the Vicinity Map, Figure 1. The alignment is shown in relation to surrounding physical features on the Site Plans, Figures 2 through 8. This report was initially submitted as a draft on February 9, Subsequently, boring I-1 was completed and the information obtained has been added to the report. These services are a continuation of our involvement on the project. We previously completed a study for Segments A, C, E, J, M, and N which follow existing PSE easements through Redmond, Bellevue, Newcastle, Renton and King County. One boring (J-4) previously planned for Segment J was delayed until after submission of the initial report. In addition, another boring (J-6) was also completed along Segment J at the request of PSE. A description of subsurface conditions and recommendations for the area where J-4 and J-6 were completed are included in this report. SITE DESCRIPTION Geologic Setting A more detailed description of geologic conditions is presented in our Geologic Hazards Evaluation and Preliminary Geotechnical Engineering Services report dated December 19, A summary is presented below. Our understanding of geology in the Energize Eastside project vicinity and along the potential PSE segments and routes is based on review of 1:100,000 scale geologic maps published by the Department of Natural Resources (DNR) and on a review of geologic maps published by King County. The native soils in the vicinity of the site are the result of glacial and post glacial processes. The glacial deposits are derived from several regional glaciations. The most recent, the Fraser glaciation included three phases (stades) with the last phase, called the Vashon glaciation, occurring from about 13,500 to 15,000 years ago. Based on our review, surface geology along the project segments can be grouped into two primary categories: glacial and recent alluvial deposits. Bedrock is also present, but only across limited portions of the project segments south of I-90. In general, segments in the Factoria area cross deposits of the most recent glacial period (Fraser age) and include recessional outwash (Qgo), glacial till (Qgt), and alluvium (Qa). Glacial outwash consists of fluvially-deposited sediments sourced from the front of glaciers, and is typically comprised of poorly sorted, well rounded gravel with sand. Glacial till was deposited after being transported and dropped by a glacier, and typically consists of dense, unsorted and unstratified deposits of silt, clay, sand, gravel, cobbles, and June 6, 2016 Page 1 File No
7 occasional boulders. Alluvium typically consists of soft to medium stiff silt and loose to medium dense sand deposited through fluvial processes. Peat deposits can also be present in closed depressions, typically in and adjacent to wetlands. Bedrock is present across portions of Segments I, K2, and J. The bedrock consists of Oligocene-Miocene marine rocks (OEm) which include the Tertiary Renton, Blakely, and Tukwila formations. These formations typically include fine to medium grained sandstone with beds of coal, siltstone, and claystone. Surface Conditions The proposed Phase II project alignment crosses mainly lowland/valley areas situated between higher hills and along the base of the Newport/Somerset Hills complex, with the exception of the area where boring J-4 was completed along Segment J in the Somerset/Newport Hills area. The segments typically follow existing roadways. Specific pole locations have not yet been identified. Geologic hazards along the alignment including mapped erosion, steep slope, landslide, seismic and volcanic hazards are addressed in our Geologic Hazards Evaluation and Preliminary Geotechnical Engineering Services report dated December 19, This geotechnical report addresses liquefaction and lateral spreading potential, where appropriate. Based on elevations shown on Google Earth which uses the NAVD88 datum, elevations across these segments range from a low of about Elevation 70 feet to a high of about Elevation 250 feet with the exception of the boring done in the Somerset area, which is at an elevation of about 400 feet. Elevations shown on the boring logs were obtained from Google Earth and should be considered approximate. A summary of the surface conditions along each segment is summarized as follows: Segment G2 Segment G2 starts at the Lakeside substation, runs west of and parallel to Segment J for about 650 feet, and then angles to the southwest to parallel SE 30 th Street, then turns south along Richard Road and terminates at the intersection of Richards Road and SE 32 nd Street. Segment G2 covers a total distance of about two-thirds of a mile. Topographically, the alignment is situated on the lower portion of a slope, and then in a valley area through which small creeks are present. The northern portion of the segment crosses an existing wetland area, then skirts the west side of the PSE poleyard which is surfaced with gravel. It then follows an existing access driveway for the poleyard, and then follows existing roadways SE 30 th Street and Richards Road. Most of the area is west of PSE s poleyard is commercially developed on both side of the roadways. Segment J The description of Segment J is presented in the initial report. Two additional borings were completed during this phase within Segment J. Boring J-4 was completed on 136 th Place SE is in a cul-de-sac and residential area. Boring J-6 was completed south of Forest Drive within a PSE easement area vegetated with grass and blackberry bushes. Segment I Segment I continues south from Segment G2, follows the southern portion of Richards Road and Factoria Boulevard SE, and terminates at the intersection of Factoria Boulevard SE and Coal Creek Parkway SE. June 6, 2016 Page 2 File No
8 Topographically, the alignment is in a lower lying area and is relatively level except for climbing in elevation south of Factoria Mall. Commercial properties are present along most of this segment. Newport High School is located on the west side of the southern portion of this segment. Segment K-2 Segment K-2 starts at the south end of Segment I and follows along the west side of Coal Creek Parkway SE, although a portion might be situated slightly west of the roadway. This segment is in the Coal Creek drainage located between the Newport/Somerset hills to the east and an upland area to the west. The alignment and roadway along this segment are situated east of the Coal Creek channel. West of the alignment the ground surface generally slopes downward towards the creek. The roadway is relatively level with minor grade changes. Utilities Utilities along the segments include a large City of Seattle water main which intersects and crosses Coal Creek Parkway about 1,000 feet south of the intersection with Factoria Boulevard. Olympic pipeline has a gas line located on the east side of Richards Road, Factoria Boulevard, and Coal Creek Parkway, and also has a line which follows the existing PSE right of way along the north portion of Segment G2 and along Segment J. PSE has a main gas line on the west side of Coal Creek Parkway. Subsurface Explorations and Laboratory Testing Field Explorations Subsurface conditions along a portion of Segment J and Segments G2, I, and K2 were explored by drilling 11 borings (G2-1, G2-2,I-1, I-2, I-3, I-4, I-5, J-4, J-6, K2-1, and K2-1) completed between November 19, 2015 and March 14, The borings were completed to depths of 33 to 51.5 feet using equipment under subcontract to GeoEngineers. Details of our exploration program, including boring logs and sampling methods are included in Appendix A. We installed a monitoring well in boring G2-1 to allow for subsequent measurements of groundwater levels following drilling. The monitoring well is the property of PSE. The well should be decommissioned by a licensed well driller in accordance with Chapter of the Washington Administrative Code (WAC) when it is no longer needed for data collection. Alternatively, the well could be kept intact for use during project bidding and then be decommissioned under the construction contract. Laboratory Testing Soil samples were obtained during drilling and taken to our Redmond geotechnical laboratory for further evaluation and testing. Selected samples were tested for moisture content, percent fines content (particles passing the U.S. No. 200 sieve), grain size distribution, strength parameters using the direct shear test (completed by another lab under subcontract to GeoEngineers), and corrosivity tests. Appendix B presents a discussion of the laboratory testing procedures and test results. June 6, 2016 Page 3 File No
9 Available Subsurface Information From Other Projects In addition to the explorations completed for this project, we obtained subsurface information available from borings completed by GeoEngineers and others along the proposed corridor. The information obtained came from the following boring logs: A boring (Agra B-7) completed in 1995 by Agra Earth & Environmental from a project to widen Richards Road (Segment G2). Two borings (EC B-1 and B-2) completed in 1989 by Earth Consultants for a signal pole project at the intersection of Factoria Boulevard and SE 36 th Street (Segment I). Five borings (AMEC B-1, B-2, B-3, B-5 and B-10) completed in 2002 by Amec for Factoria Boulevard improvements (Segment I). Two borings (CC B-1 and B-2) completed in 1984 by Converse Consultants for a Lake Young east side supply line (Segment K2). One boring (CC B-1) completed in 1991 by Converse Consultants for modifications to Forest Drive (Segment J). One boring (GEI B-8) completed in 2001 by GeoEngineers for W&H Pacific (Segment J). The locations of these explorations are shown on the Site Plans and copies are included in Appendix C. Subsurface Conditions Subsurface conditions encountered in our recent explorations along the alignment are generally consistent with published geologic information and with previous explorations we and others have completed for nearby projects. Subsurface conditions encountered across most of the project limits consist of alluvium, recessional outwash, glacially consolidated deposits consisting of very dense glacial till, bedrock and soils derived from highly weathered bedrock. As much of the alignment is along developed properties, fill was also encountered. The soil conditions have been divided into four generalized profiles as follows: Soil Profile 1 Soil profile 1 consists of 35 to 45 feet of alluvial or outwash deposits consisting of loose to medium dense sand, to medium stiff to stiff silt and clay, with occasional thin layers of soft peat or clay. The alluvium/recessional deposits are underlain at depth by medium dense outwash deposits consisting of sand with variable amounts of silt or dense to very dense glacially consolidated deposits. This soil profile was only encountered in boring G2-1 at the entrance of the access road to the pole yare and in boring I-2 completed near the intersection of Factoria Boulevard and SE 36 th Street. We anticipate that this profile might also be present across portions of the north end of Segment G2 and on the north side of I-90 near the intersection of Richards Road and SE Eastgate Way based on topography and the presence of Richards Creek. Soil Profile 2 Soil profile 2 consists of about 10 to 20 feet of loose to medium dense fill, alluvium, recessional deposits, or highly weathered bedrock underlain by very dense glacially consolidated soils or bedrock. This soil profile June 6, 2016 Page 4 File No
10 was encountered in borings G2-2 on SE 30 th Street, and I-4, located in the northeast corner of the high school property. Boring G2-2 encountered very dense glacial till or advance deposits similar in character to glacial till at a depth of about 17 feet, and boring I-4 encountered sandstone at a depth of 15 feet. The glacial till typically consists of dense to very dense silty sand with gravel and cobbles. Rough and hard drilling occasionally occurred in the glacial till because of the density of the till and the presence of cobbles and boulders, and drilling progress was very slow in several instances (see boring logs for notes on the depths at which rough and hard drilling, and slow drilling progress occurred). The bedrock encountered in boring I-4 consisted of weathered sandstone. The sandstone was weathered such that the drill was able to advance more than 30 feet into the bedrock. Soil Profile 3 Soil profile 3 is similar to soil profile 2 but consists of a thinner upper zone of loose to medium dense fill or recessional deposits, underlain by 5 to 10 feet of medium dense to dense recessional deposits or silty sand or silt derived from highly weathered sandstone or siltstone. At a depth ranging from 15 to 20 feet, very dense glacially consolidated deposits or weathered bedrock was encountered. This profile was encountered along portions of Segment I and K-2, and for the boring completed along Segment J south of Forest Drive. Bedrock encountered in these areas varied from weathered sandstone to weathered siltstone. Soil Profile 4 Soil profile 4 consists of a relatively shallow deposit of loose to medium dense fill and weathered till or bedrock overlying very dense glacially consolidated deposits or bedrock. Soil profile 4 was only encountered in boring K-1, located on the east side of Coal Creek Parkway near the Seattle water line, and boring J-4, situated up in the Somerset neighborhood. Overall Summary of Soil Conditions In general, we anticipate that the thickness of loose and soft alluvial soils is highly variable along Segment G-2, and significantly different soil conditions might be present depending on the pole locations. For this segment, we anticipate that the design parameters for the drilled shafts will need to be reevaluated once the final pole locations are selected. Along most of Segments I and K-2, we anticipate that most pole locations will encounter 10 to 20 feet of loose to medium dense fill or granular deposits overlying glacial till or bedrock. In most locations, the bedrock was drillable with the exploration equipment, however variability in rock composition and strength should be expected. At a few locations along Coal Creek Parkway and portions of Segment J across the Newport Hills area, bedrock is within 5 feet of the surface. Table 1 below summarizes each segment and the soil profile encountered, along with the approximate depth to dense soils and/or bedrock. June 6, 2016 Page 5 File No
11 TABLE 1. SUMMARY OF SUBSURFACE CONDITIONS Segment Area Soil Profile Approximate Depth to Dense Soils/Bedrock 1 (feet) G-2 North end to eastern half of SE 30 th Street 1 25 to 40 G-2 West half of SE 30 th Street to south end of segment 2 15 to 20 I North end to 500 feet south of SE 36 th Street 1 20 to 30 I 500 feet south of SE 36 th Street to south end 3 10 to 15 K2 Entire segment ¾ 2 5 to 15 Notes: J Portion across Newport/Somerset Hills ¾ 3 5 to 15 J Portion near and south of Forest Drive 3 10 to 20 1 Soil conditions are expected to vary depending on actual pole locations. 2 Anticipate mainly soil profile 3 but areas of shallow bedrock are likely present at some locations. 3 Anticipate mainly soil profile 4 across the higher elevations of Segment J Field Screening Results The soil samples in the upper 15 feet of each boring were field screened for indications of evidence of petroleum hydrocarbon contamination using visual and water sheen screening. No visual indication of contamination or sheen was detected on any sample. Groundwater Groundwater level observations were made during drilling and measured subsequent to drilling in the monitoring well installed in boring G2-1. Groundwater seepage was encountered during drilling in most of the borings at depths ranging from about 7 to 17 feet. Groundwater is at or near the surface along SE 30 th Street. Groundwater was difficult to detect in some of the borings where bedrock is near the surface. Some of the observed groundwater seepage is attributable to zones of perched water within or on top of the glacial till or weathered bedrock, or in more permeable zones within the bedrock. We measured the groundwater level in monitoring well G2-1 on February 9, At that time, groundwater was encountered at the ground surface, approximately Elevation 84 feet. We expect that the presence of groundwater seepage and groundwater levels will fluctuate seasonally and will change due to precipitation. In the area along SE 30 th Street where there are multiple creeks, we anticipate that groundwater is at or near the ground surface during much of the year. CONCLUSIONS AND RECOMMENDATIONS Variable soil conditions are present across Segments G2, I, and K2. Along Segment G2, we anticipate that alluvial and recessional soils underlain by glacially consolidated soils will be present. Along Segment I, we anticipate that recessional and glacially consolidated deposits overlie bedrock. Along Segment K2, we anticipate relatively shallow deposits of soil over bedrock. In our opinion, foundation support for the poles may be provided using conventional drilled shafts or direct embedment, where appropriate. Excavation for both drilled shafts and direct embedment will need to address the presence of cobbles and boulders in the June 6, 2016 Page 6 File No
12 glacial soils, drilling in very dense deposits and bedrock, zones of groundwater seepage and the presence of groundwater and the potential for caving or sloughing soils. Portions of Segment G2 are underlain by 15 to 40 feet of loose to medium dense alluvial deposits underlain by medium dense to dense recessional outwash or glacially consolidated deposits. A high groundwater table was also encountered in this area. Upper deposits of alluvium or loose recession deposits were also encountered at the north end of Segment I. Drilling through these deposits will likely require casing to control caving, groundwater and sloughing. Casing may be required in other areas where the surficial soils are loose. We do not recommend using direct embedment in these areas. As discussed above, portions of the alignment are underlain by weathered or unweathered bedrock. Assuming the drilled shafts extend a minimum depth of 30 feet, we anticipate that bedrock will be encountered along Factoria Boulevard near the intersection with SE Newport Way, along Segment K2, and along portions of Segment J crossing the Newport/Somerset hill. In general, the bedrock was drillable with the drilling equipment used for the explorations to the depth explored, with the exception of boring K2-2, were refusal was encountered at a depth of 33 feet, approximately 10 feet into the bedrock. The following sections of this report present our recommendations for drilled shafts, and micropiles, and considerations for direct embedment foundations. Seismic Design Considerations The project alignment is located in western Washington, which is seismically active. Seismicity in this region is attributed primarily to the interaction between the Pacific, Juan de Fuca and North American plates. The Juan de Fuca plate is subducting beneath the North American plate at the Cascadia Subduction Zone (CSZ). This activity produces both intercrustal (between plates) and intracrustal (within a plate) earthquakes. Research is ongoing regarding large magnitude CSZ-related intercrustal earthquake activity along the Washington and Oregon coasts. Geologists are reporting evidence that suggests several large magnitude earthquakes (magnitude 8 to 9) have occurred along the CSZ in the last 1,500 years, the most recent of which occurred in January Five large subduction zone earthquakes have been observed globally since 1960: (1) in 1960, a magnitude 9.5 earthquake occurred in Chile; (2) in 1964, a magnitude 9.2 earthquake occurred in Alaska; (3) in 2006, a magnitude 9.2 earthquake occurred in Indonesia; (4) in 2010 a magnitude 8.8 earthquake occurred off the coast of Chile; and (5) in 2011 a magnitude 9.0 occurred in Japan. No documented earthquakes of this magnitude have occurred along the CSZ during the recorded history of the Pacific Northwest. Hundreds of smaller intracrustal earthquakes have been recorded in western Washington. Four of the most recent significant intracrustal earthquakes were: (1) a magnitude 7.2 earthquake that occurred in 1946 in the Vancouver Island, British Columbia area; (2) a magnitude 7.1 earthquake that occurred in 1949 in the Olympia area; (3) a magnitude 6.5 earthquake that occurred in 1965 between Seattle and Tacoma; and (4) a magnitude 6.8 earthquake that occurred on February 28, 2001 at Nisqually near Olympia International Building Code Design Considerations Seismic parameters vary slightly between the different segments of the project. Seismic parameters also vary depending on the soil conditions present. Most of the site soils may be characterized as Site Class C or Site Class D. We recommend the 2012 International Building Code (IBC) parameters for short period June 6, 2016 Page 7 File No
13 spectral response acceleration (SS), 1-second period spectral response acceleration (S1), and Seismic Coefficients FA and FV presented in Table 2. TABLE 2. IBC SEISMIC PARAMETERS Segment Extent Site Class Spectral Response Acceleration (percent g) Seismic Coefficient SS S1 FA FV Peak Ground Acceleration, PGAm (percent g) G2 Entire segment D I Northern 1,500 feet D I Remainder C K2 Entire C The spectral Response values are based on the 2008 United States Geologic Survey (USGS) Seismic Hazard Maps available at Surface Fault Rupture A portion of the alignment immediately north and south of I-90, is mapped within the Seattle Fault Zone, which is thought to have a recurrence interval on the order of 1,000 years. However, based on the long recurrence interval of the fault, it is our opinion there is a low risk of fault rupture over the design life of the poles. Liquefaction Potential Liquefaction refers to a condition where vibration or shaking of the ground, usually during earthquakes, causes development of excess pore water pressures in saturated soils and subsequent loss of strength in a soil unit so affected. In general, soils that are susceptible to liquefaction include loose to medium dense sand to silty sand and soft to stiff sandy silt, which are below the groundwater level. Most of the soils along Segments I and K2 are typically in a medium dense to very dense condition, and/or are above the anticipated normal groundwater level and are therefore not considered liquefiable. The portions of the alignment which have liquefiable soils include most of Segment G2 and the northern portion of Segment I. We evaluated the liquefaction potential of the site soils based on the information from the borings using the Simplified Procedure (Youd and Idriss, 2001). The Simplified Procedure is based on comparing the cyclic resistance ratio (CRR) of a soil layer (the cyclic shear stress required to cause liquefaction) to the cyclic stress ratio (CSR) induced by an earthquake. The factor of safety against liquefaction is determined by dividing the CRR by the CSR. Liquefaction hazards, including settlement and related effects, were evaluated when the factor of safety against liquefaction was calculated as less than 1.0. Estimated ground settlement resulting from earthquake-induced liquefaction was analyzed using empirical procedures by Tokimatsu and Seed (1987) that relate settlement to the boring data. Liquefaction potential of the site soils was evaluated using the peak ground acceleration listed in the table above. June 6, 2016 Page 8 File No
14 Analysis of the boring data indicates that there is a potential for liquefaction within the saturated alluvium encountered in Segment G2. The northern portion of Segment I also has some deposits susceptible to liquefaction, however, the depth to groundwater is likely deeper and thus the zone of looser deposits below the water table is anticipate to be less than 10 feet thick. We estimate that the factor of safety is less than 1 during the design-level earthquake for the loose to medium dense alluvial/recessional deposits encountered in these areas. For Segment G2, we anticipate that the depth of liquefiable deposits varies from about 15 to 30 feet, based on boring J1 and G2-1 and G2-2 and on the borings completed for the proposed Richards Creek substation. For this area, liquefaction-induced ground settlement of the potentially liquefiable zones is estimated to be on the order of 2 to 6 inches for a design-level earthquake. For the northern portion of Segment I, we anticipate that the depth of liquefiable deposits varies from about 5 to 15 feet, and liquefaction-induced ground settlement of the potentially liquefiable zones is estimated to be on the order of 1 to 3 inches for a design-level earthquake. Lesser amounts of settlement from liquefaction could be experienced after an earthquake with a magnitude less than the design-level earthquake. The magnitude of liquefaction-induced ground settlement will vary as a function of the characteristics of the earthquake (earthquake magnitude, location, duration and intensity) and the soil and groundwater conditions. Our recommended soil input parameters for lateral load design included in Appendix D consider the effects of liquefaction through the application of p-multipliers for LPILE parameters where considered appropriate. Lateral Spreading Lateral spreading involves lateral displacements of large volumes of liquefied soil. Lateral spreading can occur on near-level-ground as blocks of surface soils are displaced toward a nearby slope or free-face such as a riverbank. Flow failures occur when soil liquefies and flows by gravity without further seismic input. For the north portion of Segment G2 in the vicinity of the proposed Richards Creek substation, in our study for that substation we concluded that there is a risk for lateral spreading along the west edge where the topography slopes downward to the west. We should reevaluate the risk to the proposed poles in this area once their final location has been determined. Drilled Shafts Based on recent 230 kv projects we have completed for PSE, we anticipate that the preliminary downward axial loads on the pole foundations will be in the range of 10 to 50 kips. The lateral loads on these foundations typically range between 10 and 90 kips of shear force, and between 600 kip-feet and 7,000 kip-feet of applied bending moment. We also understand the foundations will be roughly 7 feet in diameter and embedded to depths of typically at least 25 feet, although some of the tangent pole foundations might only require embedment depths as shallow as 15 to 20 feet. For the pole foundation design, the depth of embedment is typically governed by lateral loading conditions. Direct embedment foundations will be used instead of drilled shafts for some of the tangent structures where dense to very dense soils are present. Where liquefiable deposits are present, we recommend that foundations extend below the loose to medium dense liquefiable deposits into underlying dense, non-liquefiable soils. June 6, 2016 Page 9 File No
15 Lateral Load Response Lateral load design and analysis will be performed by the project structural engineer, Power Engineers. Soil input parameters for the LPILE program are provided in Appendix D. We also provide p-multipliers for strength loss under seismic loading conditions based on Brandenberg, et al (2007) for foundations where liquefiable deposits are present. As mentioned above, the foundations for poles near the proposed Richards Creek substation could be subjected to additional lateral loads imposed by lateral spreading resulting from the design earthquake, depending on the location of the poles relative to the slope to the west. We recommend that we reevaluate the potential impacts once the location of the poles in this area have been finalized. Axial Capacity The applied axial loads on the pole foundations are generally very small in comparison to the applied overturning moments resulting from the tension in the wires along with ice and wind loads. The axial capacity of the foundations will be developed primarily from friction and end bearing in the dense glacially consolidated soils and bedrock. The results of our analyses of axial capacities for drilled shafts are presented in Table 3. These allowable capacities include a factor of safety of about 2 for skin friction and about 3 for end bearing. TABLE 3. AXIAL CAPACITY OF DRILLED SHAFTS Soil Profile Diameter (feet) Minimum Embedment 1,2 (feet) Allowable End Bearing Pressure (ksf) Allowable Skin Friction 3,4 (kips/feet) feet or 10 feet into dense deposits 35 feet or 10 feet into dense deposits feet or 10 feet into very dense deposits/bedrock 25 feet or 10 feet into very dense deposits/bedrock feet or 10 feet into very dense deposits/bedrock 25 feet or 10 feet into very dense deposits/bedrock feet or 10 feet into very dense deposits/bedrock 15 feet or 10 feet into very dense deposits/bedrock Notes: 1 Might need to extend deeper where liquefiable deposits present (in vicinity of boring G2-1 and I-2). 2 Might need to extend deeper for lateral response requirements. 3 Presented skin friction is averaged from the ground surface to the minimum embedment. 4 Recommend excluding skin friction through liquefiable layers. See discussion in the Liquefaction Potential section of this report. ksf kips per square foot June 6, 2016 Page 10 File No
16 The subsurface conditions vary, especially across the Segments G2 and I. We recommend that we reevaluate the axial capacity of the pole foundations once the final locations are selected. The total allowable downward capacity of the pole foundations is based on the strength of the supporting soils and interaction between the foundation and the soil. The structural characteristics of the pole foundation materials and other structural considerations may impose more stringent limitations and should be evaluated by the structural engineer. Foundation settlement between similarly loaded foundations is anticipated to be less than ½ inch and essentially elastic in nature. We expect settlement will occur as axial loads are applied. Downdrag Liquefaction-induced settlement could also apply a downdrag force on these foundations. The downdrag force is a function of the liquefiable soils (thickness and density) and foundation diameter. We estimate the downdrag forces could be on the order of 100 to 200 kips for pole foundation diameters of about 6 to 8 feet for profiles 1 and 2 across Segment G2 and the north portion of Segment I and should be considered when estimating the axial capacity of the foundations where liquefiable soils are present. We recommend that we reevaluate potential downdrag effects once the pole locations are finalized. Corrosion Evaluation GeoEngineers completed limited laboratory testing on soil samples along the alignment to evaluate factors related to corrosion, as described in Appendix B. One of the test results resulted in a DIPRA value of greater than 10, indicating a moderate to high potential for corrosion. GeoEngineers does not provide corrosion engineering services and if further evaluation of corrosion is required, we recommend engaging a corrosion engineer. Construction Considerations The project alignment presents several potential difficulties for construction activities posed by surface and subsurface conditions, including temporary access, existing overhead power lines, the presence of the Olympic and PSE natural gas pipelines and other utilities, very dense glacial till, occurrence of cobbles and boulders in the subsurface deposits, bedrock, and groundwater. Access will also be difficult along these segments as the poles will likely be situated near the edge of busy roadways. We anticipate that drilled shafts will be used for a majority of the poles, although direct embedment might be used for tangent poles in some areas. Where bedrock is near the surface, additional options such as rock anchors or micropiles might be appropriate as an alternative to drilled shafts. These options have not been discussed with the design team but general guidelines for micropiles are presented in this section of the report. These and other construction considerations are discussed in the following sections. Temporary Construction Access We anticipate earthwork activities will be related primarily to temporary construction access and support and not a significant part of permanent structures. June 6, 2016 Page 11 File No
17 Access conditions vary significantly along the alignment, with most areas accessible by existing paved parking lots or roads. The northern end of Segment G2 crosses an existing wetland area which will require additional clearing and effort to build an access road, depending on the final pole locations. We anticipate that construction at many pole locations will require traffic control and lane closures, some pole locations might be accessible by existing dirt roads, some will require additional clearing or some localized grading to create level surfaces for equipment and for staging areas may require grading for access. The existing fills, recessional and glacial till soils may be used for construction of temporary access roads if this work takes place during the normally dry months of the year. In wet weather, it may be necessary to use imported sand and gravel or quarry spalls to construct these roads (see discussion below under Fill Materials). In general, most of the near-surface soils along most of the segments will likely provide adequate support for construction equipment. Soft, loose and/or wet areas are present across the wetland in the north portion of Segment G2; this area will likely not provide adequate support for construction equipment. The particular requirements of temporary access roads and staging areas will depend on the construction equipment selected. We anticipate that construction work pads at the pole locations, access routes and staging areas will be removed and mitigated prior to project completion. Drilled Shaft Excavations We recommend the contractor submit a detailed drilled shaft installation plan describing casing and drilled shaft construction methods for review and comment by the engineer before construction. A similar plan should also be submitted for drilled holes for direct embedment pole foundation. The submittal should include a narrative describing the contractor s understanding of the anticipated subsurface conditions, the overall construction sequence, access to the pole locations, and the proposed pole foundation installation equipment. Gravel and cobbles were encountered at some of the locations explored. In addition, we anticipate that many of the shafts may penetrate bedrock. The selected foundation contractor should be prepared to deal with cobbles and boulders, rock and very dense soils during drilled shaft construction. Based on the subsurface conditions encountered in our explorations, we anticipate that some caving could occur, especially within the upper 5 to 15 feet where weathered or less dense deposits or fill are present and that casing for at least a portion of the hole may be needed. Casing will also likely be required where groundwater is near the surface and loose alluvial deposits are present, mainly along portions of Segment G2 and the north end of Segment I. Once the design bottom elevation of the shafts is reached, the bottom of the drilled holes should be cleaned of loose or disturbed soil before placing concrete. Loose, disturbed soils left in the bottom of shaft foundation excavations may result in additional settlement. We encountered heaving conditions in some of the borings within the alluvial deposits. Heaving could also occur if the bottoms of the holes encounter artesian or high groundwater. Drilling fluids may be required to control heave of the excavation base before placing grout if groundwater is encountered during drilling. If drilled shafts are used where groundwater is present, we recommend that the concrete for drilled shafts be placed using the tremie method. Temporary casing should be pulled back as the shaft concrete is poured from the bottom up. Care should be taken to ensure a positive head of concrete is maintained at all times June 6, 2016 Page 12 File No
18 above the bottom of the temporary casing during casing removal. We recommend that a positive concrete head of at least 5 feet be maintained inside the casing during removal. Because of the methods used to install drilled shafts, no direct information regarding the capacity (e.g., driving resistance data) is obtained. It is, therefore, our recommendation that we monitor the installation of the drilled shafts. This will allow us to observe and confirm that soil conditions are as anticipated and that the shafts are installed in accordance with our recommendations and project plans and specifications, or to document variations in the field if necessary, and to provide consultation as required should conditions vary from those anticipated. Direct Embedment Excavations We recommend that direct embedment only be considered where the bottom of the excavation will be in dense to very dense glacial till or bedrock. Where the upper soils consist of loose to medium dense deposits, or where cobble and boulders are encountered, we anticipate that casing will be necessary. Casing will also likely be required if foundations are constructed close to existing BP/Olympic pipelines or other underground utilities. Similar to the drilled shafts, we recommend the contractor submit a detailed direct embedment pole installation plan describing including both uncased and temporary casing methods. Direct embedment poles can be backfilled with a variety of materials, including crushed rock, controlled density fill (CDF), or normal strength concrete. We recommend the crushed rock, if used, consist of 1¼-inch minus material conforming to Crushed Surfacing Base Course, Section (3) of the 2014 Washington State Department of Transportation (WSDOT) Standard Specifications for Road, Bridge and Municipal Construction. The placement of the backfill will need to be carefully coordinated with removal of temporary casing so that the potential for creating voids around the embedded portion of the poles is reduced. The backfill should be placed evenly around the pole and compacted to the extent possible with mechanical or hand operated equipment. Depending on the groundwater level in the drilled hole, it may be necessary to place CDF or normal concrete using the tremie method. Micropiles Micropiles are small- to moderate-diameter (typically less than 12 inches) drilled piles. Micropiles are constructed by drilling a hole with a permanent casing, placing reinforcement, grouting the hole, and then removing the portion of the casing within the load-bearing soils. The grouting operations impact micropile capacity. Micropiles installed by gravity grouting have lower capacities, and micropiles installed by pressure grouting or post-grouting (two-stage grouting process) have higher capacities. Micropiles might be appropriate where bedrock is encountered as an alternative to drilled shafts. We recommend that the micropiles for this project be designed and constructed in accordance with the FHWA Micropile Design and Construction Guidelines Implementation Manual. We recommend that the micropiles consist of minimum 5½-inch-diameter casing that extends a minimum of 8 feet into the glacially consolidated soils/bedrock. Below this depth, the micropiles can be completed open-hole in the bedrock. We recommend a minimum of 20-foot embedment into the load-bearing bedrock. For cased, pressure-grouted micropiles, we anticipate that capacities for micropiles into bedrock would June 6, 2016 Page 13 File No
19 likely be on the order of 6 to 10 kips per square foot (ksf). Therefore, a 30-foot-long micropile which extends 15 feet into bedrock might have an allowable micropile capacity on the order of 130 to 200 kips, depending on the diameter of the micropile and grouting techniques used. Higher anchorage capacity values may be developed using post-grouting installation techniques. However, the final design capacities for the micropiles should be determined by a specialty contractor installing the foundation elements. The specialty contractor should be given the opportunity to use higher anchorage capacities by conducting load tests (discussed below) prior to the start of installation of the production micropiles. Micropile capacities can be better defined once pole locations are finalized and loading information is available. We recommend the contractor submit a detailed micropile installation plan for review by the engineer before construction. The submittal should include a narrative describing the contractor s understanding of the anticipated surface conditions, the overall construction sequence, access to the pole location and proposed micropile installation equipment. Once the design tip elevation for the micropile is established, the bottom of the drilled hole should be cleaned of loose or disturbed soil before placing grout. Care must be taken to ensure a positive head of concrete is maintained at all times above the bottom of the temporary casing during removal of the casing. We recommend a minimum 5-foot head of grout be maintained inside the casing during removal. Because of the methods used to install micropiles, no direct information regarding the capacity (e.g., driving resistance data) is obtained. It is, therefore, our recommendation that we monitor the installation of the micropiles. This will allow us to observe and confirm that soil conditions are as anticipated and that the micropiles are installed in accordance with our recommendations, or to document variations in the field if necessary, and to provide consultation as required should conditions vary from those anticipated. We recommend axial capacity of installed micropiles be confirmed through a testing program. The testing program should be designed to demonstrate that the required axial resistance is achieved. The Federal Highway Administration (FHWA) publication No. FHWA-SA , dated June 2000 provides guidelines for development of a load test program. We recommend this publication be consulted for development of the load testing program. A minimum of two micropiles at each pole location should be tested. These may be production piles provided they meet the performance requirements of the testing program. The testing should occur prior to proceeding with installation of additional micropiles to confirm the design capacities. If the micropiles are used for developing lateral capacity, we recommend performing a lateral load test program. We recommend installing two test piles and applying a tension force between the piles. The micropiles used in the axial testing program may be used for the lateral testing program. Elements of a lateral tensioning devise are chains, a come-along, a manually operated hydraulic actuator, and digital dynamometer to measure the applied force. The tensioning devise should be constructed to allow for total movement on the order of 24 inches between the piles (about 12 inches of deflection each). Casing Foundations Casing foundations consist of a large diameter steel casing driven into the soil using a vibratory hammer or oscillator. Once the casing has reached the design tip elevation, soil inside the upper portion of the casing is partially removed and a concrete plug/top cap poured to provide anchorage and form a base for connection to the above-ground pole. June 6, 2016 Page 14 File No
20 Some obstructions such as cobbles, boulders and logs could be encountered during installation. It may be necessary to remove obstructions using auger drilling or coring techniques to advance the casing. Also, shallow groundwater levels should be expected during foundation installation. It might be necessary to maintain a positive head of water inside the casing to reduce the potential for heave at the level to which the soil is removed. Concrete for the plug and top cap may need to be poured using the tremie method. Vibrations from installation of the casings will be transmitted some distance away from the pole foundation locations. These vibrations could potentially affect nearby structures, and will likely be noticed by people within a limited area at and near the pole locations. Based on information provided in the FHWA document, Drilled Shafts Construction Procedures and LRFD Design Methods (2010), the attenuation of the vibrations with distance is affected by the size of the vibratory hammer and casing, operating frequency of the hammer, soil properties and stratigraphy, groundwater and other factors. The document further notes that, in most cases, vibrations from casing installation are extremely small at distances of 50 to 70 feet from the source. Where sensitive structures may be present within about 100 feet of the work area, we recommend that vibration monitoring be performed to help avoid potential damage and to provide documentation in the event of claims of damage caused by the vibratory casing installation. Access Road Fill Materials Where access roads are required, material used for temporary road fill should be free of debris, organic and man-made contaminants, and rock fragments larger than 6 inches. The suitability of material for use as fill will depend on the gradation and moisture content of the soil. As the amount of fines (particles passing the No. 200 sieve) increases, soil becomes increasingly sensitive to small changes in moisture content and adequate compaction and trafficability become more difficult to achieve. The on-site soils contain a significant percentage of fines and may be suitable for use as fill during extended dry weather conditions (such as typically occurs from May to October), provided that the soils can be properly moisture conditioned for compaction. Alternatively, fill soil used for extended dry weather conditions can consist of Gravel Borrow conforming to Section (1) of the 2014 WSDOT Standard Specifications. During the months of October through May and during other periods of extended wet weather, we recommend that road fill consist of soil conforming to Gravel Backfill for Walls, Section (2) of the 2014 WSDOT Standard Specifications. Quarry spalls conforming to Section of the 2014 WSDOT Standard Specifications may be used for construction entrances and as the initial layer of fill over soft or wet subgrade soils. Excavation Cut and Fill Slopes Based on our explorations, shallow excavations for temporary access road construction may experience caving. Excavations deeper than 4 feet should be shored or their cut slopes laid back at a stable slope if workers are required to enter them. Shoring and temporary slope inclinations must conform to the provisions of Title 296 WAC, Part N, Excavation, Trenching and Shoring. Regardless of the soil type encountered in the excavation, shoring, June 6, 2016 Page 15 File No
21 trench boxes or sloped sidewalls will be required under the Washington Industrial Safety and Health Act (WISHA). The contract documents should specify that the contractor be responsible for selecting excavation and dewatering methods, monitoring the excavations for safety and providing shoring, as required, to protect personnel and structures. In general, temporary cut slopes should be inclined no steeper than about 1½H:1V (horizontal to vertical). Slopes excavated below groundwater should be inclined no steeper than about 2H:1V. This guideline assumes that all surface loads are kept at a minimum distance of at least one half the depth of the cut away from the top of the slope and that significant seepage is not present on the slope face. Flatter cut slopes will be necessary where significant seepage occurs or if large voids are created during excavation. Some sloughing and raveling of the cut slopes should be expected. Temporary covering with heavy plastic sheeting should be used to protect slopes during periods of wet weather. If temporary fill slopes are to be constructed we recommend a maximum inclination of 1½H:1V. Temporary protection should be used while slopes are in use. We recommend that permanent cut and fill slopes be inclined at 2H:1V or flatter. Erosion Control Based on existing site grades and the anticipated temporary access road configurations, we anticipate that erosion control measures such as silt fences, straw bales, wattles and sand bags will generally be adequate for project construction. However, if construction and grading is staged, slopes may be created and additional erosion control measures may have to be implemented. Temporary erosion control should be provided during construction activities and until permanent erosion control measures are functional. Surface water runoff should be properly contained and channeled using drainage ditches, berms and swales. Permanent site grading should be accomplished in such a manner that stormwater runoff is not concentrated and surface water is not directed to excavated areas of the alignment or over steep slopes. This can be accomplished by grading to direct the flow to appropriate collection points away from the excavations and steep slope areas. Specific requirements for erosion control within and near the wetlands will be addressed in a separate wetlands report and permit. Considerations for BP/Olympic Pipelines We understand that the BP/Olympic natural gas pipelines consist of a 16- and 20-inch pipelines which are typically embedded 3 to 6 feet below grade. In the Factoria area, the pipelines cross the north end of Segment G2, and are present along the east side of Richards Road, Factoria Boulevard, and Coal Creek Parkway. In general, the subsurface soils in the upper 10 feet across most of the alignment ranged from loose to medium dense silty sand. We recommend that provisions such as steel plates or mats be placed over the pipelines to distribute vehicle loads where construction equipment needs to cross over the pipelines. BP (which now owns the Olympic pipelines) may have stricter requirements. June 6, 2016 Page 16 File No
22 Where excavations will be within 10 to 20 feet of a BP/Olympic pipeline, temporary casing in the upper 10 to 15 feet should be considered to reduce the risk of sloughing under the pipeline. The need for casing can be better evaluated once the pole locations are finalized. Utility settlement monitoring points, similar to that shown below, could also be established on the BP/Olympic pipelines where drilled shafts will be within 15 feet if requested by BP, to monitor settlement during installation of the drilled shafts. In this case, the settlement monitoring points should be installed so that base-line readings of the settlement monitoring points may be completed prior to the contractor mobilizing to the site. Monitoring should continue during construction on a daily basis and twice a week in the 3 weeks following construction. The monitoring readings should be reviewed by the Engineer on a daily basis. If measured settlement exceeds 1 inch, or the amount specified by the utility owner, the integrity of the utility should be tested and the contractor should be required to repair any damage to the utilities as a result of construction. A schematic for a typical utility settlement monitoring point is provided below. Utility Settlement Monitoring Point LIMITATIONS We have prepared this report for PSE for the Phase II Energize Eastside 230 kv Transmission Line project in Redmond, Bellevue, Newcastle, Renton and King County, Washington. PSE may distribute copies of this report to their authorized agents and regulatory agencies as may be required for the project. Within the limitations of scope, schedule and budget, our services have been executed in accordance with generally accepted practices in the field of geotechnical engineering in this area at the time this report was prepared. The conclusions, recommendations and opinions presented in this report are based on our professional knowledge, judgment and experience. No warranty or other conditions, express or implied, should be understood. Any electronic form, facsimile or hard copy of the original document ( , text, table, and/or figure), if provided, and any attachments should be considered a copy of the original document. The original document is stored by GeoEngineers, Inc. and will serve as the official document of record. June 6, 2016 Page 17 File No
23 Please refer to Appendix E titled Report Limitations and Guidelines for Use for additional information pertaining to use of this report. REFERENCES American Society of Civil Engineers, ASCE Standard ASCE/SEI 7-10, Minimum Design Loads for Buildings and Other Structures, Brandenberg, S.J., Boulanger, R.W., Kutter, B.L., and Chang, D., Static Pushover Analysis of Pile Groups in Liquefied and Lateral Spreading Ground in Centrifuge Tests, Journal of Geotechnical and Geoenvironmental Engineering, September Federal Highway Administration, Drilled Shafts Construction Procedures and LRFD Design Methods, Geotechnical Engineering Circular No. 10, FHWA-NHI , GeoEngineers, Inc., draft Report, Geotechnical Engineering Services, Richards Creek Substation, Bellevue, Washington, March 30, Idriss, I. M. and R. W. Boulanger, Soil Liquefaction During Earthquakes, Earthquake Engineering Institute, 2008, p International Code Council, 2012 International Building Code, Tokimatsu, K. and Seed, H.B., Evaluation of Settlements in Sands Due to Earthquake Shaking, Journal of Geotechnical Engineering, ASCE, 113(GT8), 1987, pp U.S. Geological Survey, Earthquake Hazards Program, Interpolated Probabilistic Ground Motion for the Conterminous 48 States by Latitude Longitude, 2008 Data, accessed using Earthquake Ground Motion Parameters Java Program Version in October Washington State Department of Transportation, Standard Specifications for Road, Bridge and Municipal Construction, Youd, et al., Liquefaction Resistance of Soils: Summary Report from the 1996 NCEER and 1998 NCEER/NSF Workshops on Evaluation of Liquefaction Resistance of Soils, Journal of Geotechnical and Geoenvironmental Engineering, ASCE, October 2001, pp June 6, 2016 Page 18 File No
24 FIGURES

25 Path: P:\0\ \GIS\MXD\ _ProjectDesign_Phase2_VicinityMap.mxd Map Revised: 2/9/2016 glohrmeyer Notes: 1. The locations of all features shown are approximate. 2. This drawing is for information purposes. It is intended to assist in showing features discussed in an attached document. GeoEngineers, Inc. cannot guarantee the accuracy and content of electronic files. The master file is stored by GeoEngineers, Inc. and will serve as the official record of this communication. 3. It is unlawful to copy or reproduce all or any part thereof, whether for personal use or resale, without permission. Data Sources: Open Street Map 2015 Transverse Mercator, Zone 10 N North, North American Datum 1983 North arrow oriented to grid north Site µ 2, ,000 Feet Vicinity Map PSE Energize Eastside Phase II Project Bellevue, Washington Figure 1

26 LAKESIDE SE 27th Pl A1 3 6th SE ve Lakeside Substation G2 I J SE 28th Pl Richards Rd J K2 City of Bellevue P:\0\ \GIS\MXD\ _ProjectDesign_Phase2_SitePlan2.mxd Date Exported: 04/28/16 by ccabrera G2-2 Notes: 1. The locations of all features shown are approximate. 2. This drawing is for information purposes. It is intended to assist in showing features discussed in an attached document. GeoEngineers, Inc. cannot guarantee the accuracy and content of electronic files. The master file is stored by GeoEngineers, Inc. and will serve as the official record of this communication. Projection: NAD 1983 HARN StatePlane Washington North FIPS 4601 Feet Legend SE 30th St G2 G2-1 SE 32nd St Feet G2-1 Agra B-7 Legend J Site Plan Segment J and G2 Boring by GeoEngineers Boring by Others Route Segment PSE Energize Eastside Phase II Project Bellevue, Washington Figure 2

27 LAKESIDE 125th Ave SE SE 32nd St 128th Ave SE Agra B-7 G2 Richards Rd I G2 I J I-1 City of Bellevue K2 I-90 W SE Eastgate Way I-90 E P:\0\ \GIS\MXD\ _ProjectDesign_Phase2_SitePlan2.mxd Date Exported: 04/28/16 by ccabrera Notes: 1. The locations of all features shown are approximate. 2. This drawing is for information purposes. It is intended to assist in showing features discussed in an attached document. GeoEngineers, Inc. cannot guarantee the accuracy and content of electronic files. The master file is stored by GeoEngineers, Inc. and will serve as the official record of this communication. Projection: NAD 1983 HARN StatePlane Washington North FIPS 4601 Feet Legend Factoria Blvd SE EC B-1 EC B-2 I-2 SE 36th St 131st Ave S E 132nd Ave SE Feet G2-1 Agra B-7 Legend J Site Plan Segment G2 and I Boring by GeoEngineers Boring by Others Route Segment PSE Energize Eastside Phase II Project Bellevue, Washington Figure 3
28 130th Ln SE SE SE 38th St Factoria Blvd SE G2 LAKESIDE 124th Ave N I-405 I J Amec B-6 Amec B-5 131st Ave SE K2 Factoria Square Mall SE I City of Bellevue Ave SE 132nd P:\0\ \GIS\MXD\ _ProjectDesign_Phase2_SitePlan2.mxd Date Exported: 04/28/16 by ccabrera Notes: 1. The locations of all features shown are approximate. 2. This drawing is for information purposes. It is intended to assist in showing features discussed in an attached document. GeoEngineers, Inc. cannot guarantee the accuracy and content of electronic files. The master file is stored by GeoEngineers, Inc. and will serve as the official record of this communication. Projection: NAD 1983 HARN StatePlane Washington North FIPS 4601 Feet Legend Amec B-10 I-3 Amec B-3 SE 40th Pl SE 40th Ct SE 40th Ln Pl SE 12 9th SE 39th Feet Ln 1 31st L n SE 131st Pl SE SE 41st St G2-1 Agra B-7 Legend J Site Plan Segment I Boring by GeoEngineers Boring by Others Route Segment PSE Energize Eastside Phase II Project Bellevue, Washington Figure 4


29 131st Ave SE LAKESIDE G2 I Amec B-2 SE 41st Pl SE 42nd Pl Amec B-1 I 124th Ave SE City of Bellevue Factoria Blvd SE SE 41st Ln K2 J SE 42nd St P:\0\ \GIS\MXD\ _ProjectDesign_Phase2_SitePlan2.mxd Date Exported: 04/28/16 by ccabrera Notes: 1. The locations of all features shown are approximate. 2. This drawing is for information purposes. It is intended to assist in showing features discussed in an attached document. GeoEngineers, Inc. cannot guarantee the accuracy and content of electronic files. The master file is stored by GeoEngineers, Inc. and will serve as the official record of this communication. Projection: NAD 1983 HARN StatePlane Washington North FIPS 4601 Feet Legend I-4 129th Pl SE SE Newport Way Pl SE Feet 130th Newport Way G2-1 Agra B-7 Legend J Site Plan Segment I Boring by GeoEngineers Boring by Others Route Segment PSE Energize Eastside Phase II Project Bellevue, Washington Figure 5

30 130th Ave SE LAKESIDE Coal Creek Pkwy SE 44th Pl G2 SE I-5 lvd F acto ria B SE I I SE 45th L n J SE 45th Ct K2 City of Bellevue SE 45th Pl 130th Pl S E K2 1 25th Ave SE SE 46th St Legend G2-1 P:\0\ \GIS\MXD\ _ProjectDesign_Phase2_SitePlan2.mxd Date Exported: 04/28/16 by ccabrera Notes: 1. The locations of all features shown are approximate. 2. This drawing is for information purposes. It is intended to assist in showing features discussed in an attached document. GeoEngineers, Inc. cannot guarantee the accuracy and content of electronic files. The master file is stored by GeoEngineers, Inc. and will serve as the official record of this communication. Projection: NAD 1983 HARN StatePlane Washington North FIPS 4601 Feet Legend K Ln S E t h SE 46th Ln SE 47th St Feet Agra B-7 J Site Plan Segment I and K2 Boring by GeoEngineers Boring by Others Route Segment PSE Energize Eastside Phase II Project Bellevue, Washington Figure 6


31 SE 47th St LAKESIDE G2 Ave SE 125th I SE 47th Pl J CC B-1 K2 City of Bellevue CC B-2 S E l P t h st e Av SE K2-2 P:\0\ \GIS\MXD\ _ProjectDesign_Phase2_SitePlan2.mxd Date Exported: 04/28/16 by ccabrera SE 50th Pl Notes: 1. The locations of all features shown are approximate. 2. This drawing is for information purposes. It is intended to assist in showing features discussed in an attached document. GeoEngineers, Inc. cannot guarantee the accuracy and content of electronic files. The master file is stored by GeoEngineers, Inc. and will serve as the official record of this communication. Projection: NAD 1983 HARN StatePlane Washington North FIPS 4601 Feet Ave SE 126th Legend SE 51st S t 127th Pl SE SE 49th Pl C oal Cre ek Pkwy SE 13 0t h Av e S E K Feet SE 49th St 131st SE l P G2-1 Agra B-7 Legend J Site Plan Segment K2 Boring by GeoEngineers Boring by Others Route Segment PSE Energize Eastside Phase II Project Bellevue, Washington Figure 7
32 Ave Coal Creek Pkwy SE LAKESIDE S E 49th St G2 K2 131st Pl SE 134th Pl SE SE 50th Pl I SE 51st Pl J Forest Dr SE GEI B-8 SE 5 1 st St CC B-1 City of Bellevue J6 K2 J SE 52nd St P:\0\ \GIS\MXD\ _ProjectDesign_Phase2_SitePlan2.mxd Date Exported: 04/28/16 by ccabrera 128th SE Notes: 1. The locations of all features shown are approximate. 2. This drawing is for information purposes. It is intended to assist in showing features discussed in an attached document. GeoEngineers, Inc. cannot guarantee the accuracy and content of electronic files. The master file is stored by GeoEngineers, Inc. and will serve as the official record of this communication. Projection: NAD 1983 HARN StatePlane Washington North FIPS 4601 Feet Legend J5 SE 52nd Pl S E 54th Pl Feet SE 53rd St S omerset Dr SE 135th Pl SE 134th Ave SE G2-1 Agra B-7 Legend J Site Plan Segment K2 and J Boring by GeoEngineers Boring by Others Route Segment PSE Energize Eastside Phase II Project Bellevue, Washington Figure 8
33 APPENDICES
34 APPENDIX A Field Explorations
35 APPENDIX A FIELD EXPLORATIONS The subsurface conditions along Segments G2, I, and K2 were explored by drilling 11 borings completed between November 19, 2015 and March 14, The borings were completed to depths of 33 to 51.5 feet by two drilling contractors, Geologic Drill Explorations, Inc. and Holt Services, Inc. under subcontract to GeoEngineers. As the locations for the new poles have not yet been finalized, exploration locations were selected by Puget Sound Energy (PSE) and GeoEngineers along the proposed corridor. The locations of the explorations were determined by pacing and measuring from existing poles and other existing features. The surface elevation of each exploration are based on Google Earth (NAVD88); exploration locations and elevations should be considered accurate only to the degree implied by the methods used. Borings The borings were completed using both track-mounted and truck-mounted drill rigs. Each boring was advanced using hollow-stem auger methods. Our field representatives located the borings, classified the soils encountered, observed and recorded groundwater seepage conditions, obtained disturbed and undisturbed samples of the soils, and prepared a detailed field log of each boring. Our representative also assisted in the installation of a groundwater monitoring well in one of the borings. Samples of the subsurface soils were typically obtained in the borings at 5-foot intervals by driving a 1.4-inch inside-diameter standard penetration test (SPT) split-barrel sampler (ASTM D 1586). A 2.4-inch inside-diameter California sample was typically obtained at 15 feet below existing grades. GeoEngineers selected several California samples to be submitted for density and direct shear tests. The boring logs include a notation of where a California sample was obtained. The SPT and California samples were obtained using a 140-pound hammer falling approximately 30 inches. The number of blows required to drive the sampler the final 12 inches or other specified distance is recorded on the boring logs. We visually classified the soils using the system described in Figure A-1. Figure A-1 also includes a key to the boring log symbols. The logs of our borings are presented in Figures A-2 through A-12. The logs reflect our interpretation of the field conditions and the results of laboratory evaluation and testing of soil samples. They also indicate the depths at which the soil types or their characteristics change, although the change might actually be gradual. If the change occurred between samples, it was interpreted. The densities noted on the boring logs are based on moisture-density laboratory tests and our judgment based on the conditions encountered. Because of the gravel, cobbles, and boulders encountered in some of the borings, the soil classifications indicated on the logs are based on our observation of the soil recovered in the samplers, soil observed coming up the surface around the augers, drilling action, and laboratory tests conducted on the samples obtained. It is important to note that the laboratory tests were typically conducted on only the portion of the soil smaller than the sampler diameters. June 6, 2016 Page A-1 File No
36 The borings were subsequently backfilled or completed as groundwater monitoring wells (see below) in accordance with Washington Department of Ecology regulations. Holes made in pavement core holes were patched with asphalt patch. Groundwater Level Observations and Measurements We made observations of groundwater conditions as the borings were completed. These observations represent a short-term condition and may not be representative of the long-term groundwater conditions at the pole locations. Groundwater conditions observed during drilling should be considered approximate. A 2-inch-diameter monitoring well was installed in one boring to allow measurement of groundwater levels after drilling. Well screen elevations were installed with GeoEngineers assistance based on observations during drilling. We measured groundwater levels in the monitoring well on November 20, The measurement is noted on the respective boring log. The monitoring well is the property of PSE. The well should be decommissioned by a licensed well driller in accordance with Chapter of the Washington Administrative Code (WAC) when they are no longer needed for data collection. Alternatively, the well could be kept intact for use during project bidding and then be decommissioned under the construction contract. Environmental Field Screening of Soil Samples Soil samples obtained in the upper 15 feet of the explorations for this project were typically screened in the field for evidence of contamination using: (1) visual examination and (2) sheen screening. Visual screening consists of observing the soil for stains indicative of petroleum-related contamination. Visual screening is generally more effective when contamination is related to heavy petroleum hydrocarbons, such as motor oil or hydraulic oil, or when hydrocarbon concentrations are high. Sheen screening and headspace vapor screening are more sensitive methods that have been effective in detecting contamination at concentrations less than regulatory cleanup guidelines. Sheen screening involves placing soil in a pan of water and observing the water surface for signs of sheen. Sheen classifications are as follows: No Sheen (NS) Slight Sheen (SS) Moderate Sheen (MS) Heavy Sheen (HS) No visible sheen on water surface. Light, colorless, dull sheen; spread is irregular, not rapid; sheen dissipates rapidly. Light to heavy sheen, may have some color/iridescence; spread is irregular to flowing; few remaining areas of no sheen on water surface. Heavy sheen with color/iridescence; spread is rapid; entire water surface may be covered with sheen. No sheen was observed in any of the samples. June 6, 2016 Page A-2 File No
37 MAJOR DIVISIONS SOIL CLASSIFICATION CHART SYMBOLS GRAPH LETTER TYPICAL DESCRIPTIONS ADDITIONAL MATERIAL SYMBOLS SYMBOLS TYPICAL GRAPH LETTER DESCRIPTIONS GRAVEL AND GRAVELLY SOILS CLEAN GRAVELS (LITTLE OR NO FINES) GW GP WELL-GRADED GRAVELS, GRAVEL - SAND MIXTURES POORLY-GRADED GRAVELS, GRAVEL - SAND MIXTURES AC CC Asphalt Concrete Cement Concrete COARSE GRAINED SOILS MORE THAN 50% RETAINED ON NO. 200 SIEVE FINE GRAINED SOILS MORE THAN 50% PASSING NO. 200 SIEVE MORE THAN 50% OF COARSE FRACTION RETAINED ON NO. 4 SIEVE SAND AND SANDY SOILS MORE THAN 50% OF COARSE FRACTION PASSING NO. 4 SIEVE SILTS AND CLAYS SILTS AND CLAYS GRAVELS WITH FINES (APPRECIABLE AMOUNT OF FINES) CLEAN SANDS (LITTLE OR NO FINES) SANDS WITH FINES (APPRECIABLE AMOUNT OF FINES) LIQUID LIMIT LESS THAN 50 LIQUID LIMIT GREATER THAN 50 GM GC SW SP SM SC ML CL OL MH CH OH SILTY GRAVELS, GRAVEL - SAND - SILT MIXTURES CLAYEY GRAVELS, GRAVEL - SAND - CLAY MIXTURES WELL-GRADED SANDS, GRAVELLY SANDS POORLY-GRADED SANDS, GRAVELLY SAND SILTY SANDS, SAND - SILT MIXTURES CLAYEY SANDS, SAND - CLAY MIXTURES INORGANIC SILTS, ROCK FLOUR, CLAYEY SILTS WITH SLIGHT PLASTICITY INORGANIC CLAYS OF LOW TO MEDIUM PLASTICITY, GRAVELLY CLAYS, SANDY CLAYS, SILTY CLAYS, LEAN CLAYS ORGANIC SILTS AND ORGANIC SILTY CLAYS OF LOW PLASTICITY INORGANIC SILTS, MICACEOUS OR DIATOMACEOUS SILTY SOILS INORGANIC CLAYS OF HIGH PLASTICITY ORGANIC CLAYS AND SILTS OF MEDIUM TO HIGH PLASTICITY CR TS Crushed Rock/ Quarry Spalls Topsoil/ Forest Duff/Sod Groundwater Contact Measured groundwater level in exploration, well, or piezometer Measured free product in well or piezometer Graphic Log Contact Distinct contact between soil strata Approximate contact between soil strata Material Description Contact Contact between geologic units Contact between soil of the same geologic unit HIGHLY ORGANIC SOILS NOTE: Multiple symbols are used to indicate borderline or dual soil classifications Sampler Symbol Descriptions 2.4-inch I.D. split barrel PT Standard Penetration Test (SPT) Shelby tube Piston Direct-Push Bulk or grab Continuous Coring Blowcount is recorded for driven samplers as the number of blows required to advance sampler 12 inches (or distance noted). See exploration log for hammer weight and drop. A "P" indicates sampler pushed using the weight of the drill rig. A "WOH" indicates sampler pushed using the weight of the hammer. PEAT, HUMUS, SWAMP SOILS WITH HIGH ORGANIC CONTENTS NS SS MS HS NT Laboratory / Field Tests Percent fines Percent gravel Atterberg limits Chemical analysis Laboratory compaction test Consolidation test Direct shear Hydrometer analysis Moisture content Moisture content and dry density Organic content Permeability or hydraulic conductivity Plasticity index Pocket penetrometer Parts per million Sieve analysis Triaxial compression Unconfined compression Vane shear Sheen Classification No Visible Sheen Slight Sheen Moderate Sheen Heavy Sheen Not Tested NOTE: The reader must refer to the discussion in the report text and the logs of explorations for a proper understanding of subsurface conditions. Descriptions on the logs apply only at the specific exploration locations and at the time the explorations were made; they are not warranted to be representative of subsurface conditions at other locations or times. %F %G AL CA CP CS DS HA MC MD OC PM PI PP PPM SA TX UC VS KEY TO EXPLORATION LOGS FIGURE A-1 Rev. 02/16
38 Start End Drilled 11/20/ /20/2015 Total Depth (ft) 51.5 Logged By Checked By NLP NLT Driller Geologic Drill Inc. Drilling Method Hollow-stem Auger Hammer Data Surface Elevation (ft) Vertical Datum Latitude Longitude Auto 140 (lbs) / 30 (in) Drop 84 Drilling Equipment Top of Casing Elevation (ft) Horizontal Datum D50 Track Rig Geographic DOE Well I.D.: BIK 311 A 1.5 (in) well was installed on 11/20/2015 to a depth of 35 (ft). Groundwater Date Measured 2/9/2016 Depth to Water (ft) 0.0 Elevation (ft) 84.0 Notes: Field screening was completed to a depth of 15 feet; no sheen was observed. FIELD DATA WELL LOG Elevation (feet) Depth (feet) Interval Recovered (in) Blows/foot Collected Sample Sample Name Testing Water Level Graphic Log Group Classification MATERIAL DESCRIPTION Moisture Content (%) Fines Content (%) Steel surface monument Dipra, MC SM PT SP-SM Brown silty sand and gravel (loose, moist to wet) (fill) Brown peat (soft, moist to wet) (Dipra = 14.5) Gray fine to medium sand with silt and gravel (medium dense, wet) Concrete surface seal Bentonite seal 1.5-inch Schedule 80 PVC well casing With lenses of fine to coarse sand with gravel SA /20 Colorado silica sand inch Schedule 80 PVC screen, inch slot width Redmond: Date:4/15/16 Path:P:\0\ \GINT\ GPJ DBTemplate/LibTemplate:GEOENGINEERS8.GDT/GEI8_GEOTECH_WELL_%F SA SM/SP-SM SM ML-SM SP-SM SM Note: Please see Figure A-1 for explanation of symbols Gray-brown interbedded silty fine sand and fine to medium sand with silt (loose to medium dense, wet) (4 feet of heaving sand at 30 feet) Gray silty fine sand (medium dense, wet) Gray interbedded silt with sand and silty fine sand (stiff/medium dense, wet) Grades to stiff, dense Gray fine to coarse sand with silt (dense, wet) Gray silty fine to medium sand with lenses of fine to medium sand (dense, wet) Log of Monitoring Well G2-1 Project: Project Location: Project Number: PSE Energize Eastside Phase II Project Bellevue, Washington Bentonite chips Figure A-2 Sheet 1 of 1
39 Drilled Start 1/8/2016 Surface Elevation (ft) Vertical Datum Latitude Longitude End 1/8/2016 Total Depth (ft) Hammer Data System Datum Logged By Checked By NLP NLT Notes: Field screening was completed to a depth of 15 feet; no sheen was observed. Driller Geologic Drill Inc. Auto 140 (lbs) / 30 (in) Drop Geographic Drilling Equipment Groundwater Date Measured Drilling Method Hollow-stem Auger D50 Track Rig Depth to Water (ft) Elevation (ft) FIELD DATA Elevation (feet) 65 Depth (feet) Interval Recovered (in) Blows/foot Collected Sample Sample Name Testing Water Level Graphic Log Group Classification MATERIAL DESCRIPTION Moisture Content (%) Fines Content (%) REMARKS 0 AC SP-SM 6-inches hot mix pavement Gray fine to medium sand with silt and gravel (loose, moist) (fill?) %F ML SM Gray silt (medium stiff, moist to wet) Dark gray silty fine sand (loose, wet) ML SP-SM Gray silt (soft, wet) Gray fine to coarse sand with silt (loose, wet) %F SM Gray-brown silty fine sand with gravel with lenses of cleaner sand (very dense, moist to wet) (glacial till?) Driller notes gravel below 17 feet MD 9.7 DD = 128 pcf Slow, hard drilling with cobbles at 25 feet 40 Redmond: Date:4/28/16 Path:P:\0\ \GINT\ GPJ DBTemplate/LibTemplate:GEOENGINEERS8.GDT/GEI8_GEOTECH_STANDARD_%F /5.5" 50/4" 6 7 MD Note: Please see Figure A-1 for explanation of symbols Log of Boring G2-2 Project: Project Location: Project Number: PSE Energize Eastside Phase II Project 13 Factoria, Washington DD = 102 pcf Figure A-3 Sheet 1 of 1
40 Drilled Start 3/14/2016 Surface Elevation (ft) Vertical Datum Latitude Longitude End 3/14/2016 Total Depth (ft) Undetermined 50.5 Hammer Data System Datum Logged By Checked By KMS NLT Notes: Field screening was completed to a depth of 15 feet; no sheen was observed. Driller Geologic Drill Inc. Auto 140 (lbs) / 30 (in) Drop Geographic Drilling Equipment Groundwater Date Measured Drilling Method Hollow-stem Auger Diedrich D-50 Turbo Depth to Water (ft) See Remarks Elevation (ft) FIELD DATA Elevation (feet) Depth (feet) Interval Recovered (in) Blows/foot Collected Sample Sample Name Testing Water Level Graphic Log Group Classification MATERIAL DESCRIPTION Moisture Content (%) Fines Content (%) REMARKS 0 SM Brown silty fine to coarse sand with occasional gravel (loose, moist to wet) (fill) A %F 2B 3 MC SP-SM SM SP-SM SM/ML Gray-brown fine to medium sand with silt (medium dense, moist to wet) Brown mottled silty fine to medium sand (medium dense, moist to wet) Brown-gray fine to medium sand with silt (medium dense, moist to wet) Gray-brown mottled silty fine sand to sandy silt with trace gravel (dense/hard, moist to wet) /10" 4 MC SM Gray-brown silty fine to medium sand with gravel, lenses of fine to medium sand (very dense, moist) (glacial till) /5.5" 5 Redmond: Date:4/28/16 Path:P:\0\ \GINT\ GPJ DBTemplate/LibTemplate:GEOENGINEERS8.GDT/GEI8_GEOTECH_STANDARD_%F /5.5" /5" 50/5" 50/6" 50/4" MD ML SM GW Note: Please see Figure A-1 for explanation of symbols ML Gray silt with lenses of silty fine sand (hard, moist) Grayish brown silty fine sand with occasional gravel (very dense, moist) With lenses of sand with gravel Gray fine to coarse gravel with sand (very dense, wet) (advance outwash?) Gray sandy silt (hard, moist) Project: Log of Boring I-1 Project Location: Project Number: PSE Energize Eastside Phase II Project 10 Bellevue, Washington Groundwater observed at approximately 31½ feet during drilling 1 foot of heave Dry Density = 110 pcf Figure A-4 Sheet 1 of 1
41 Start Drilled 11/19/2015 Surface Elevation (ft) Vertical Datum Latitude Longitude End 11/19/2015 Total Depth (ft) Hammer Data System Datum Logged By Checked By NLP NLT Notes: Field screening was completed to a depth of 15 feet; no sheen was observed. Driller Geologic Drill Inc. Auto 140 (lbs) / 30 (in) Drop Geographic Drilling Equipment Groundwater Date Measured Drilling Method Hollow-stem Auger D50 Track Rig Depth to Water (ft) See Remarks Elevation (ft) FIELD DATA Elevation (feet) Depth (feet) Interval Recovered (in) Blows/foot Collected Sample Sample Name Testing Water Level Graphic Log Group Classification MATERIAL DESCRIPTION Moisture Content (%) Fines Content (%) REMARKS 95 0 AC CR SM 4-inches hot mix pavement 6-inches crushed surface base course Gray silty fine to medium sand with gravel and cobbles (loose, moist) (fill) p, ph p = 11,000 ohm-cm, ph = DS 4 SM Gray silty fine to medium sand (loose to medium dense, moist) Redmond: Date:4/15/16 Path:P:\0\ \GINT\ GPJ DBTemplate/LibTemplate:GEOENGINEERS8.GDT/GEI8_GEOTECH_STANDARD_%F Dipra SA CL SP-SM CL CL SP ML SP SM Note: Please see Figure A-1 for explanation of symbols Mottled gray clay (medium stiff, moist to wet) With lenses of sand Brown fine to medium sand with silt (loose, wet) Blue-gray clay (soft, moist to wet) Mottled gray clay with silt (medium stiff, wet) Gray fine to medium sand (loose to medium dense, wet) Light brown silty clay (medium stiff, wet) Gray fine to medium sand (medium dense to dense, moist to wet) Gray silty fine to medium sand with lenses of sand (very dense, wet) Project: Log of Boring I-2 Project Location: Project Number: PSE Energize Eastside Phase II Project 17 Bellevue, Washington Dipra = 1 Groundwater encountered at approximately 21 feet at time of drilling Heave Figure A-5 Sheet 1 of 1
42 Start Drilled 11/18/2015 Surface Elevation (ft) Vertical Datum Latitude Longitude End 11/18/2015 Total Depth (ft) Hammer Data System Datum Logged By Checked By NLP NLT Notes: Field screening was completed to a depth of 15 feet; no sheen was observed. Driller Geologic Drill Inc. Auto 140 (lbs) / 30 (in) Drop Geographic Drilling Equipment Groundwater Date Measured Drilling Method Hollow-stem Auger D50 Track Rig Depth to Water (ft) See Remarks Elevation (ft) FIELD DATA Elevation (feet) Depth (feet) Interval Recovered (in) Blows/foot Collected Sample Sample Name Testing Water Level Graphic Log Group Classification MATERIAL DESCRIPTION Moisture Content (%) Fines Content (%) REMARKS AC CR SM 4-inches hot mix asphalt 12-inches crushed surface base course (fill) Brown-gray silty fine to medium sand (medium dense, moist) (fill?) SA 2 OL SM/ML SP-SM Black organic silt (medium stiff, moist) Light brown silt and silty sand (medium dense, moist) Gray-brown fine to medium sand with silt (medium dense to dense, wet) DS 3A SP-SM/SM Brown interbedded fine sand with silt and silty fine sand (dense, wet) Groundwater observed at 12 feet during drilling SP-SM Gray fine to medium sand with silt and occasional gravel (very dense, moist to wet) /6" 5 MD, %F SM Gray silty fine to coarse sand with gravel (very dense, moist to wet) (glacial till) DD = 122 pcf Redmond: Date:4/15/16 Path:P:\0\ \GINT\ GPJ DBTemplate/LibTemplate:GEOENGINEERS8.GDT/GEI8_GEOTECH_STANDARD_%F /5" 50/6" 60/6" 50/6" 94/10" MD Note: Please see Figure A-1 for explanation of symbols Grades to mottled brown-gray Project: Log of Boring I-3 Project Location: Project Number: PSE Energize Eastside Phase II Project 11 Bellevue, Washington Slow drilling DD = 132 pcf Figure A-6 Sheet 1 of 1
43 Start Drilled 11/21/2015 Surface Elevation (ft) Vertical Datum Latitude Longitude End 11/21/2015 Total Depth (ft) 183 Hammer Data System Datum Logged By Checked By NLP NLT Notes: Field screening was completed to a depth of 15 feet; no sheen was observed. 50 Driller Geologic Drill Inc. Auto 140 (lbs) / 30 (in) Drop Geographic Drilling Equipment Groundwater Date Measured Drilling Method Hollow-stem Auger D50 Track Rig Depth to Water (ft) See Remarks Elevation (ft) FIELD DATA Elevation (feet) Depth (feet) Interval Recovered (in) Blows/foot Collected Sample Sample Name Testing Water Level Graphic Log Group Classification MATERIAL DESCRIPTION Moisture Content (%) Fines Content (%) REMARKS SM Brown silty fine to medium sand with occasional gravel (loose, moist) (fill) Dipra, MD, SA SM Mottled brown-gray silty fine sand (loose to medium dense, moist) (highly weathered sandstone) DD = 55 pcf Dipra = /4" 50/2" 3 DS 4 SSTN SSTN Yellow-brown weathered sandstone Dark gray weathered sandstone Very hard drilling Groundwater observed at 17 feet during drilling /3" /3" Redmond: Date:4/15/16 Path:P:\0\ \GINT\ GPJ DBTemplate/LibTemplate:GEOENGINEERS8.GDT/GEI8_GEOTECH_STANDARD_%F /2" 50/3" 50/3" 50/3" 50/4" %F 10 MD Note: Please see Figure A-1 for explanation of symbols 11 Thin coal seam at 46 feet Project: Log of Boring I-4 Project Location: Project Number: PSE Energize Eastside Phase II Project Bellevue, Washington DD = 95 pcf Figure A-7 Sheet 1 of 1
44 Start Drilled 11/21/2015 Surface Elevation (ft) Vertical Datum Latitude Longitude End 11/21/2015 Total Depth (ft) Hammer Data System Datum Logged By Checked By NLP NLT Notes: Field screening was completed to a depth of 15 feet; no sheen was observed. Driller Geologic Drill Inc. Auto 140 (lbs) / 30 (in) Drop Geographic Drilling Equipment Groundwater Date Measured Drilling Method Hollow-stem Auger D50 Track Rig Depth to Water (ft) See Remarks Elevation (ft) FIELD DATA Elevation (feet) Depth (feet) Interval Recovered (in) Blows/foot Collected Sample Sample Name Testing Water Level Graphic Log Group Classification MATERIAL DESCRIPTION Moisture Content (%) Fines Content (%) REMARKS SM Brown silty fine to coarse sand with gravel (loose, moist) (fill?) Grades to wet SM Gray fine to medium silty sand with gravel (very dense, moist to wet) /9" 85/10" 3 MD 4 SA SM Gray silty fine sand with gravel (very dense, moist to wet) (glacial till?) With lenses of silty sand DD = 133 pcf Groundwater observed at 17 feet during drilling Drilling becomes slow, rough /5" 5 MD 12 DD = 121 pcf /5" 6 Redmond: Date:4/15/16 Path:P:\0\ \GINT\ GPJ DBTemplate/LibTemplate:GEOENGINEERS8.GDT/GEI8_GEOTECH_STANDARD_%F /6" 50/5" 50/5" 50/6" 50/6" MD SSTN Note: Please see Figure A-1 for explanation of symbols Black weathered sandstone Project: Log of Boring I-5 Project Location: Project Number: PSE Energize Eastside Phase II Project 16 Bellevue, Washington DD = 94 pcf Very slow drilling Figure A-8 Sheet 1 of 1
45 Start Drilled 11/23/2015 Surface Elevation (ft) Vertical Datum Latitude Longitude End 11/23/2015 Total Depth (ft) 414 Hammer Data System Datum Logged By Checked By NLP NLT Notes: Field screening was completed to a depth of 15 feet; no sheen was observed. 51 Driller Holt Services Auto 140 (lbs) / 30 (in) Drop Geographic Drilling Equipment Groundwater Date Measured Drilling Method Hollow-stem Auger D50 Track Rig Depth to Water (ft) Elevation (ft) FIELD DATA Elevation (feet) Depth (feet) Interval Recovered (in) Blows/foot Collected Sample Sample Name Testing Water Level Graphic Log Group Classification MATERIAL DESCRIPTION Moisture Content (%) Fines Content (%) REMARKS SM AC SM SSTN Brown silty sand with organics (loose, moist) (fill) 3-inches asphalt concrete Brown silty sand with angular gravel (loose, moist) Light brown highly to completely weathered fine sandstone /7" /5" 3 SLST Gray highly weathered siltstone 50/3" /5" /5" Redmond: Date:5/2/16 Path:P:\0\ \GINT\ GPJ DBTemplate/LibTemplate:GEOENGINEERS8.GDT/GEI8_GEOTECH_STANDARD /9" 50/5" 75/10" 83/10" 50/4" 7 8 MD MD Note: Please see Figure A-1 for explanation of symbols Project: Log of Boring J-4 Project Location: Project Number: PSE Energize Eastside Phase II Project Bellevue, Washington Wet zone DD = 50 pcf DD = 56 pcf Figure A-9 Sheet 1 of 1
46 Start Drilled 11/19/2015 Surface Elevation (ft) Vertical Datum Latitude Longitude End 11/19/2015 Total Depth (ft) Hammer Data System Datum Logged By Checked By NLP NLT Notes: Field screening was completed to a depth of 15 feet; no sheen was observed. Driller Geologic Drill Inc. Auto 140 (lbs) / 30 (in) Drop Geographic Drilling Equipment Groundwater Date Measured Drilling Method Hollow-stem Auger D50 Track Rig Depth to Water (ft) See Remarks Elevation (ft) FIELD DATA Elevation (feet) Depth (feet) Interval Recovered (in) Blows/foot Collected Sample Sample Name Testing Water Level Graphic Log Group Classification MATERIAL DESCRIPTION Moisture Content (%) Fines Content (%) REMARKS 0 SM Red-brown silty sand with gravel (loose, wet) SA GP-GM Brown fine to coarse gravel with silt and sand (dense, wet) Groundwater observed at 7 feet during drilling SM Gray silty fine to medium sand (dense, wet) MD, SA SM ML Gray silty fine sand (dense, wet) Gray silt with sand (hard, moist) (glacial till) DD = 124 pcf /5" 6 Redmond: Date:4/15/16 Path:P:\0\ \GINT\ GPJ DBTemplate/LibTemplate:GEOENGINEERS8.GDT/GEI8_GEOTECH_STANDARD_%F /2" 50/3" 100/4.5" 100/4" MD SM SM Note: Please see Figure A-1 for explanation of symbols Gray silty fine sand (very dense, moist) Dark gray-brown silty fine sand with gravel (dense to very dense, moist) Project: Log of Boring J-6 Project Location: Project Number: PSE Energize Eastside Phase II Project 32 Bellevue, Washington DD = 81 pcf Figure A-10 Sheet 1 of 1
47 Start Drilled 11/18/2015 Surface Elevation (ft) Vertical Datum Latitude Longitude End 11/18/2015 Total Depth (ft) Hammer Data System Datum Logged By Checked By NLP NLT Notes: Field screening was completed to a depth of 15 feet; no sheen was observed. Driller Geologic Drill Inc. Auto 140 (lbs) / 30 (in) Drop Geographic Drilling Equipment Groundwater Date Measured Drilling Method Hollow-stem Auger D50 Track Rig Depth to Water (ft) Elevation (ft) FIELD DATA Elevation (feet) Depth (feet) Interval Recovered (in) Blows/foot Collected Sample Sample Name Testing Water Level Graphic Log Group Classification MATERIAL DESCRIPTION Moisture Content (%) Fines Content (%) REMARKS 0 SM Brown silty fine sand with gravel (dense, moist) (fill) /5" 1 SM Gray silty fine sand with gravel (very dense, moist) (glacial till) SA /4" 50/5" 3 MD DD = 113 pcf /4" /5" 6 Redmond: Date:4/15/16 Path:P:\0\ \GINT\ GPJ DBTemplate/LibTemplate:GEOENGINEERS8.GDT/GEI8_GEOTECH_STANDARD_%F /3" 100/6" 100/6" 50/3" 100/4" %F ML/SM SSTN Note: Please see Figure A-1 for explanation of symbols Mixed brown and gray silt and silty fine sand with trace gravel (hard/very dense, moist) Dark gray weathered siltstone/sandstone Log of Boring K2-1 Project: Project Location: Project Number: PSE Energize Eastside Phase II Project Bellevue, Washington Figure A-11 Sheet 1 of 1
48 Start Drilled 12/16/2015 Surface Elevation (ft) Vertical Datum Latitude Longitude End 12/16/2015 Total Depth (ft) 232 Hammer Data System Datum Logged By Checked By NLP NLT Notes: Field screening was completed to a depth of 15 feet; no sheen was observed. 33 Driller Geologic Drill Inc. Rope & Cathead 140 (lbs) / 30 (in) Drop Geographic Drilling Equipment Groundwater Date Measured Drilling Method Hollow-stem Auger XL Trailer Rig Depth to Water (ft) Elevation (ft) FIELD DATA Elevation (feet) Depth (feet) Interval Recovered (in) Blows/foot Collected Sample Sample Name Testing Water Level Graphic Log Group Classification MATERIAL DESCRIPTION Moisture Content (%) Fines Content (%) REMARKS MD AC SM ML Approximately 8 inches asphalt concrete pavement Dark brown to brown silty sand with gravel (medium dense, moist) (weathered glacial till?) With cobbles Dark gray sandy silt (hard, moist) (highly weathered siltstone) 26 Slow, rough drilling Driller noted smooth, hard drilling DD = 78 pcf Driller noted gravel at 17 feet SSTN With fragments of siltstone Dark gray moderately weathered siltstone Water added MD 32 DD = 68 pcf Water added Redmond: Date:4/15/16 Path:P:\0\ \GINT\ GPJ DBTemplate/LibTemplate:GEOENGINEERS8.GDT/GEI8_GEOTECH_STANDARD_%F MD 7 SSTN Note: Please see Figure A-1 for explanation of symbols Dark gray weathered siltstone Log of Boring K2-2 Project: Project Location: Project Number: PSE Energize Eastside Phase II Project 30 Bellevue, Washington DD = 79 pcf Refusal at 33 feet Figure A-12 Sheet 1 of 1
49 APPENDIX B Geotechnical Laboratory Testing
50 APPENDIX B GEOTECHNICAL LABORATORY TESTING Soil samples obtained from the borings were transported to our Redmond geotechnical laboratory and evaluated to confirm or modify field classifications, as well as to evaluate engineering and index properties of the soil samples. Representative samples were selected for laboratory testing consisting of moisture content tests, percent fines tests, grain size distribution (sieve analyses), and plasticity tests. Direst shear tests were completed at another laboratory under subcontract to GeoEngineers. We also conducted tests on selected soil samples to assist in the evaluation of corrosion potential. This testing program included resistivity, ph, redox potential, and sulfide tests. We performed the tests using methods of the American Society for Testing and Materials (ASTM) or other applicable procedures. Soil Classification Soil samples obtained from the borings were visually classified in the field and in our laboratory using a system based on the Unified Soil Classification System (USCS) and ASTM classification methods. ASTM Test Method D 2488 was used to visually classify the soil samples, while ASTM D 2487 was used to classify the soils based on laboratory tests results. These classification procedures are incorporated in the boring logs presented in Figures A-2 through A-12. Moisture Content and Dry Density Moisture content and /or density tests were completed for representative samples obtained from the borings using the ASTM D 2216 and D2937 test methods. The results of these tests are presented on the boring logs at the depths at which the samples were obtained. Percent Fines Testing Tests to evaluate the percent fines (particles passing the No. 200 sieve) were completed on several samples using ASTM D The wet sieve method was used to determine the percentage of soil particles larger than the U.S. No. 200 sieve. The results of the percent fines tests are presented on the boring logs at the depths at which the samples were obtained. Sieve Analyses Sieve analyses were completed on several samples using the ASTM D 422 test method to determine the sample grain size distribution. The wet sieve analysis method was used to determine the percentage of soil particles larger than the U.S. No. 200 mesh sieve. The results of the sieve analyses were plotted and classified using the USCS, and are presented in Figures B-1 through B-3. Direct Shear Tests Direct shear tests were conducted on selected soil samples by an outside laboratory using the ASTM D 3080 test method. This test method evaluates the friction angle and cohesion intercept under consolidated drained conditions. The direct shear tests are presented in the back of this appendix. June 6, 2016 Page B-1 File No
51 Corrosion Evaluation Tests Soil properties related to corrosivity were evaluated using Ductile Iron Pipe Research Association (DIPRA) tests performed on selected samples. DIPRA testing consisted of resistivity, ph, redox potential, and sulfides. The results of the DIPRA testing are presented in Table B-1. In addition, ph and resistivity tests were performed on one sample at a depth of 5 feet in boring I-2, the results of which are also presented in Table B-1. TABLE B-1. CORROSION EVALUATION TEST DATA Boring Depth (feet) Resistivity (Ohm-cm) ph Redox Potential (millivolts) Sulfides Moisture Dipra Points G , Fair 14.5 I , Fair 6 I , I , Fair 1 June 6, 2016 Page B-2 File No
52 Date Exported: 12/7/15 U.S. STANDARD SIEVE SIZE /4 3/8 #4 #10 #20 #40 #60 #100 #200 PERCENT PASSING BY WEIGHT Figure B-1 PSE Energize Eastside Phase II Project Bellevue, Washington Sieve Analysis Results Symbol COBBLES 100 Boring Number G2-1 G2-1 I-2 I-3 COARSE GRAVEL Depth (feet) FINE GRAIN SIZE IN MILLIMETERS 1 SAND COARSE MEDIUM FINE Moisture (%) SILT OR CLAY Soil Description Fine to course sand with silt and gravel (SP-SM) Silty sand (SM) Fine to medium sand (SP) Fine to medium sand with silt (SP-SM) Note: This report may not be reproduced, except in full, without written approval of GeoEngineers, Inc. Test results are applicable only to the specific sample on which they were performed, and should not be interpretedas representative of any othersamples obtainedat othertimes, depths or locations, or generatedby separate operations or processes The grain size analysis results were obtained in general accordance with ASTM D 6913.
53 Date Exported: 12/7/15 U.S. STANDARD SIEVE SIZE /4 3/8 #4 #10 #20 #40 #60 #100 #200 PERCENT PASSING BY WEIGHT Figure B-2 PSE Energize Eastside Phase II Project Bellevue, Washington Sieve Analysis Results Symbol COBBLES 100 Boring Number I-4 I-5 J-5 J-5 COARSE GRAVEL Depth (feet) FINE GRAIN SIZE IN MILLIMETERS 1 SAND COARSE MEDIUM FINE Moisture (%) SILT OR CLAY Soil Description Silty sand with gravel (SM) Silty sand with gravel (SM) Silty sand with gravel (SM) Silty sand (SM) Note: This report may not be reproduced, except in full, without written approval of GeoEngineers, Inc. Test results are applicable only to the specific sample on which they were performed, and should not be interpretedas representative of any othersamples obtainedat othertimes, depths or locations, or generatedby separate operations or processes The grain size analysis results were obtained in general accordance with ASTM D 6913.
54 Date Exported: 12/7/15 U.S. STANDARD SIEVE SIZE /4 3/8 #4 #10 #20 #40 #60 #100 #200 PERCENT PASSING BY WEIGHT Figure B-3 PSE Energize Eastside Phase II Project Bellevue, Washington Sieve Analysis Results Symbol COBBLES 100 Boring Number COARSE GRAVEL Depth (feet) 10 FINE GRAIN SIZE IN MILLIMETERS 1 SAND COARSE MEDIUM FINE Moisture (%) 0.1 Soil Description K Silty sand (SM) 0.01 SILT OR CLAY Note: This report may not be reproduced, except in full, without written approval of GeoEngineers, Inc. Test results are applicable only to the specific sample on which they were performed, and should not be interpretedas representative of any othersamples obtainedat othertimes, depths or locations, or generatedby separate operations or processes The grain size analysis results were obtained in general accordance with ASTM D 6913.
55 APPENDIX C Previous Explorations
56 APPENDIX C PREVIOUS EXPLORATIONS GeoEngineers obtained and reviewed subsurface information available from borings completed by others along the proposed corridor. The information obtained includes the following: The log of one boring completed in 1995 by Agra Earth & Environmental in the report entitled Geotechnical Engineering Report, Richards Road Widening, 3600 Block to SE 26 th Street, Bellevue, Washington. The logs of two borings completed in 1989 by Earth Consultants in the report entitled Signal Light Foundation, Northeast and Southeast Corners of Southeast 36 th Street and Richards Road, Bellevue, Washington. The logs of five borings completed in 2002 by Amec in the report entitled Geotechnical Engineering Report, Factoria Boulevard Improvements, S.E. 41 st Place to 3600 Block, Bellevue, Washington. The logs of two borings completed in 1984 by Converse Consultants in the technical memorandum entitled Field Explorations and Laboratory Testing, East Side Supply Line adjacent to Coal Creek Parkway, King County, Washington. The log of one boring completed in 1991 by Converse Consultants in the report entitled Geotechnical Engineering Report, Modifications to Forest Drive, Bellevue, Washington. The log of one boring completed in 2001 by GeoEngineers in the report entitled Geotechnical Engineering Services, Forest Drive Southeast Improvements, Coal Creek Parkway SE to SE 63 rd Street, Bellevue, Washington. June 6, 2016 Page C-1 File No
57
58
59
60
61
62
63
64
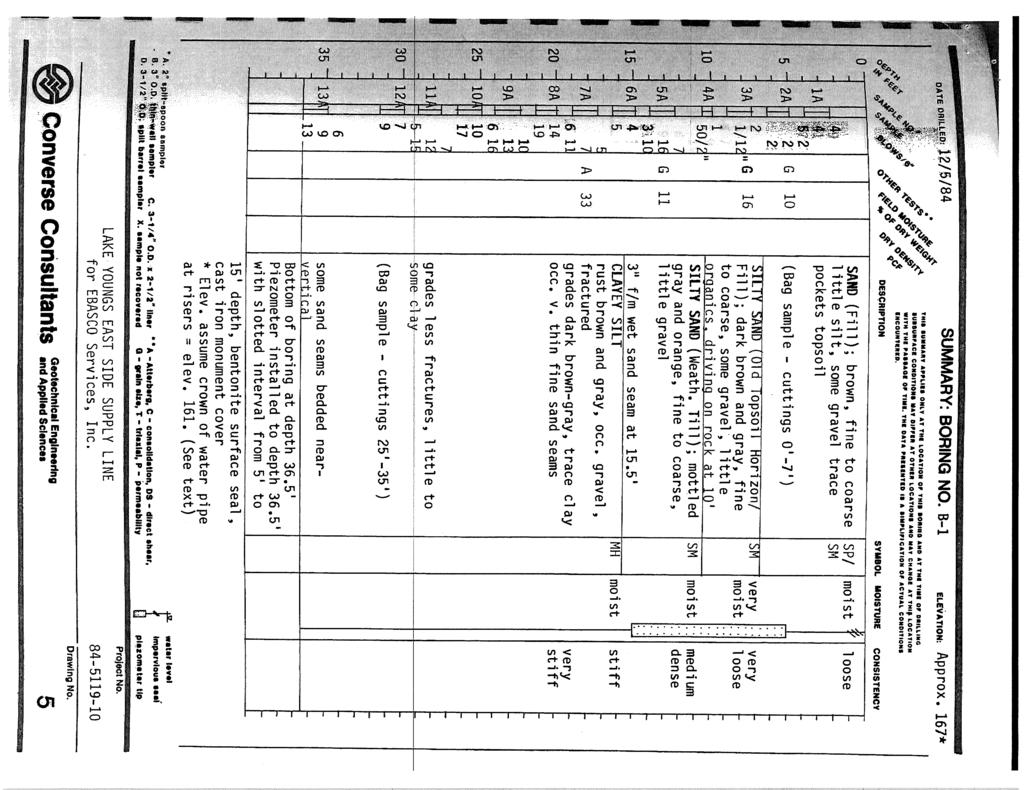
65
IV. ENVIRONMENTAL IMPACT ANALYSIS G. GEOLOGY AND SOILS
 IV. ENVIRONMENTAL IMPACT ANALYSIS G. GEOLOGY AND SOILS The following section is a summary of the geotechnical report conducted for the proposed project. The Report of Geotechnical Investigation Proposed
Date: April 2, 2014 Project No.: Prepared For: Mr. Adam Kates CLASSIC COMMUNITIES 1068 E. Meadow Circle Palo Alto, California 94303
 City of Newark - 36120 Ruschin Drive Project Draft Initial Study/Mitigated Negative Declaration Appendix C: Geologic Information FirstCarbon Solutions H:\Client (PN-JN)\4554\45540001\ISMND\45540001 36120
June 9, R. D. Cook, P.Eng. Soils Engineer Special Services Western Region PUBLIC WORKS CANADA WESTERN REGION REPORT ON
 PUBLIC WORKS CANADA WESTERN REGION REPORT ON GEOTECHNICAL INVESTIGATION PROPOSED MARTIN RIVER BRIDGE MILE 306.7 MACKENZIE HIGHWAY Submitted by : R. D. Cook, P.Eng. Soils Engineer Special Services Western
Impact : Changes to Existing Topography (Less than Significant)
") 4.2 Land Resources 4.2.1 Alternative A Proposed Action Impact 4.2.1-1: Changes to Existing Topography (Less than Significant) Development of the project site would involve grading and other earthwork as
4.2 Land Resources 4.2.1 Alternative A Proposed Action Impact 4.2.1-1: Changes to Existing Topography (Less than Significant) Development of the project site would involve grading and other earthwork as
Preliminary Geotechnical Evaluation Gooseberry Point Pedestrian Improvements Whatcom County, Washington SITE AND PROJECT DESCRIPTION
 File No. 12-100 Geotechnical & Earthquake Engineering Consultants Mr. Kevin Brown, P.E. Gray & Osborne, Inc. 3710 168 th Street NE, Suite B210 Arlington, Washington 98223 Subject: Draft Report Preliminary
Appendix F4.11 Geologic Unit Summaries, Hazard Areas, and Boring Locations
 Appendix F4.11 Geologic Unit Summaries, Hazard Areas, and Boring Locations Appendix F4.11 Geologic Unit Summaries and Hazard Areas TABLE F4.11-1 Summary of Geologic Units and their Engineering Properties
3.12 Geology and Topography Affected Environment
 3 Affected Environment and Environmental Consequences 3.12 Geology and Topography 3.12.1 Affected Environment 3.12.1.1 Earthquakes Sterling Highway MP 45 60 Project Draft SEIS The Kenai Peninsula is predisposed
3.18 GEOLOGY AND SOILS
 3.18 GEOLOGY AND SOILS This section discusses geologic resource concerns as they relate to the environment, public safety, and project design both during construction and after completion of the project.
 R-1 Conveyor Relocation Project Legend 0 500 1000 1500 ft. This map is a user generated static output from an Internet mapping site and is for general reference only. Data layers that appear on this map
4.11 Geology and Soils
 4.11 Geology and Soils 4.11.1 Introduction to Resources and Regulatory Requirements Geology and soil considerations important to the East Link Project include topography, geology, soil characteristics,
14 Geotechnical Hazards
 Volume 2: Assessment of Environmental Effects 296 14 Geotechnical Hazards Overview This Chapter provides an assessment of the underlying geotechnical conditions to identify: any potential liquefaction
Mitigation of Liquefaction Potential Using Rammed Aggregate Piers
 ASCE 2011 557 Mitigation of Liquefaction Potential Using Rammed Aggregate Piers R.W. Rudolph, M. ASCE, G.E. 1, B. Serna, M. ASCE, P.E. 2, and T. Farrell, M. ASCE, G.E. 3 1 Principal Consultant, ENGEO,
4.11 Geology and Soils
 4.11 Geology and Soils 4.11.1 Introduction to Resources and Regulatory Requirements Geology and soil considerations important to the East Link Project include topography, geology, soil characteristics,
2. Initial Summary of Preliminary Expert Opinion of Converse and Psomas Reports
 UNITED WALNUT TAXPAYERS PRELIMINARY REVIEW OF NEGATIVE GEOTECHNICAL AND GEOLOGICAL ASPECTS OF CONSTRUCTING EARTHFILL PAD FOR A SOLAR FARM ON THE WEST PARCEL - DRAFT 1. Introduction A licensed Engineering
IV. ENVIRONMENTAL IMPACT ANALYSIS E. GEOLOGY AND SOILS
 IV. ENVIRONMENTAL IMPACT ANALYSIS E. GEOLOGY AND SOILS The following section is a summary of the geotechnical report conducted for the Proposed Project. The Geotechnical Engineering Investigation (the
Geotechnical Engineering Study, Conifer Senior High School Football Field Improvements, Conifer, Colorado
 2390 South Lipan Street Denver, CO 80223 phone: (303) 742-9700 fax: (303) 742-9666 email: kadenver@kumarusa.com www.kumarusa.com Office Locations: Denver (HQ), Colorado Springs, Fort Collins, and Frisco,
Converse Consultants Geotechnical Engineering, Environmental & Groundwater Science, Inspection & Testing Services
 Converse Consultants Geotechnical Engineering, Environmental & Groundwater Science, Inspection & Testing Services Ms. Rebecca Mitchell Mt. San Antonio College Facilities Planning & Management 1100 North
SLOPE STABILITY EVALUATION AND ACCEPTANCE STANDARDS
 INFORMATION BULLETIN / PUBLIC - BUILDING CODE REFERENCE NO.: LABC 7006.3, 7014.1 Effective: 01-01-2017 DOCUMENT NO.: P/BC 2017-049 Revised: 12-21-2016 Previously Issued As: P/BC 2014-049 SLOPE STABILITY
Downtown Anchorage Seismic Risk Assessment & Land Use Regulations to Mitigate Seismic Risk
 Prepared for: The Municipality of Anchorage Planning Department and the Geotechnical Advisory Commission Downtown Anchorage Seismic Risk Assessment & Land Use Regulations to Mitigate Seismic Risk Prepared
IV. ENVIRONMENTAL IMPACT ANALYSIS E. GEOLOGY AND SOILS
 IV. ENVIRONMENTAL IMPACT ANALYSIS E. GEOLOGY AND SOILS The following analysis is based on the Geotechnical Investigation Report, Proposed Mid-Rise Multi- Family Residential Development Project Wetherly
IV. ENVIRONMENTAL IMPACT ANALYSIS E. GEOLOGY AND SOILS
 IV. ENVIRONMENTAL IMPACT ANALYSIS E. GEOLOGY AND SOILS INTRODUCTION This section evaluates potential impacts related to geology, including seismicity, and soils associated with development of the proposed
R.M.HARW & ASSOCIATES LTD. GEOTECHNICAL INVESTIGATION PROPOSED BRIDGE SITE. HELAVA CREEKl MILE MACKENZIE HIGHWAY E-2510 OCTOBER 16, 1973
 El R.M.HARW & ASSOCIATES LTD. GEOTECHNICAL INVESTIGATION PROPOSED BRIDGE SITE HELAVA CREEKl MILE 616.4 MACKENZIE HIGHWAY E-2510 OCTOBER 16, 1973 R,M,HARDV & ASSOCIATES LTD. CONSULTING ENGINEERING & TESTING
How & Where does infiltration work? Summary of Geologic History Constraints/benefits for different geologic units
 June 26, 2007: Low Impact Development 1 Associated Earth Sciences, Inc. Associated Earth Sciences, Inc. Presented by: Matthew A. Miller, PE April 24, 2012 How & Where does infiltration work? Summary of
APPENDIX P4.10 Background Information for Section 4.10, Geology and Soils
 Central Link Light Rail Transit Project Final Supplemental Environmental Impact Statement North Link APPENDIX P4.10 Background Information for Section 4.10, Geology and Soils Appendix P4.10 Background
Geotechnical Investigation Juneau Seawalk - Taku Fisheries to Miner s Wharf Juneau, Alaska DM&A Job No
 Duane Miller & Associates 5821 Arctic Boulevard, Suite A Anchorage, AK 99518-1654 (907) 644-3200 Fax 644-0507 Arctic & Geotechnical Engineering May 4, 2006 Tetra Tech/KCM, Inc. 1971 First Avenue Seattle,
(THIS IS ONLY A SAMPLE REPORT OR APPENDIX OFFERED TO THE USERS OF THE COMPUTER PROGRAM
 C A U T I O N!! (THIS IS ONLY A SAMPLE REPORT OR APPENDIX OFFERED TO THE USERS OF THE COMPUTER PROGRAM EQLique&Settle2. THE AUTHOR IS HEREBY RELEASED OF ANY LIABILITY FOR ANY INCORRECT USE OF THIS SAMPLE
Slope Stability Evaluation Ground Anchor Construction Area White Point Landslide San Pedro District Los Angeles, California.
 Slope Stability Evaluation Ground Anchor Construction Area White Point Landslide San Pedro District Los Angeles, California Submitted To: Mr. Gene Edwards City of Los Angeles Department of Public Works
Pierce County Department of Planning and Land Services Development Engineering Section
 Page 1 of 7 Pierce County Department of Planning and Land Services Development Engineering Section PROJECT NAME: DATE: APPLICATION NO.: PCDE NO.: LANDSLIDE HAZARD AREA (LHA) GEOLOGICAL ASSESSMENT REPORT
GEOLOGY, SOILS, AND SEISMICITY
 4.9 GEOLOGY, SOILS, AND SEISMICITY 4.9.1 Introduction Information about the geological conditions and seismic hazards in the study area was summarized in the FEIR, and was based on the Geotechnical Exploration
ATTACHMENT A PRELIMINARY GEOTECHNICAL SUMMARY
 ATTACHMENT A PRELIMINARY GEOTECHNICAL SUMMARY Kevin M. Martin, P.E. KMM Geotechnical Consultants, LLC 7 Marshall Road Hampstead, NH 0384 603-489-6 (p)/ 603-489-8 (f)/78-78-4084(m) kevinmartinpe@aol.com
IV. ENVIRONMENTAL IMPACT ANALYSIS G. GEOLOGY AND SOILS
 IV. ENVIRONMENTAL IMPACT ANALYSIS G. GEOLOGY AND SOILS The following section is based upon the City of El Segundo General Plan and General Plan EIR and addresses the following geologic issues: soil erosion,
KDOT Geotechnical Manual Edition. Table of Contents
 KDOT Geotechnical Manual 2007 Edition The KDOT Geotechnical Manual is available two volumes. Both volumes are very large electronic (pdf) files which may take several minutes to download. The table of
Guidelines for Site-Specific Seismic Hazard Reports for Essential and Hazardous Facilities and Major and Special-Occupancy Structures in Oregon
 Guidelines for Site-Specific Seismic Hazard Reports for Essential and Hazardous Facilities and Major and Special-Occupancy Structures in Oregon By the Oregon Board of Geologist Examiners and the Oregon
Liquefaction and Foundations
 Liquefaction and Foundations Amit Prashant Indian Institute of Technology Gandhinagar Short Course on Seismic Design of Reinforced Concrete Buildings 26 30 November, 2012 What is Liquefaction? Liquefaction
GEOLOGY AND SOILS. This chapter summarizes geologic and geotechnical aspects of the site as they relate to the Project.
 9 GEOLOGY AND SOILS INTRODUCTION This chapter summarizes geologic and geotechnical aspects of the site as they relate to the Project. This chapter utilizes information from the following reports prepared
IV. ENVIRONMENTAL IMPACT ANALYSIS E. GEOLOGY/SOILS
 IV. ENVIRONMENTAL IMPACT ANALYSIS E. GEOLOGY/SOILS Except where otherwise noted, the following Section is based on the Preliminary Geotechnical Investigation, Proposed Medical Office Buildings and Mixed-Use
REPORT OF PRELIMINARY GEOTECHNICAL EXPLORATION
 REPORT OF PRELIMINARY GEOTECHNICAL EXPLORATION ENKA INTERMEDIATE SCHOOL Sand Hill Road Candler, North Carolina Prepared For: BUNCOMBE COUNTY SCHOOLS Prepared By: AMEC ENVIRONMENT & INFRASTRUCTURE, INC.
IV. ENVIRONMENTAL IMPACT ANALYSIS E. GEOLOGY/SOILS
 IV. ENVIRONMENTAL IMPACT ANALYSIS E. GEOLOGY/SOILS The following discussion is based upon information contained in the Hollywood Redevelopment Plan Amendment EIR and a letter prepared by Geotechnologies,
SLOPE STABILITY EVALUATION AND ACCEPTANCE STANDARDS
 INFORMATION BULLETIN / PUBLIC - BUILDING CODE REFERENCE NO.: LAMC 98.0508 Effective: 1-26-84 DOCUMENT NO. P/BC 2002-049 Revised: 11-1-02 Previously Issued As: RGA #1-84 SLOPE STABILITY EVALUATION AND ACCEPTANCE
3.4 Typical Soil Profiles
 SEI.UoC.0002.11 Figure 4. Streams in central Christchurch as mapped in March 1850, superposed on aerial photography captured on 24 February 2011. Streams digitised from the Black Map of Christchurch (March
APPENDICES. Appendix A City Standard Details Appendix B Engineering Geology Report
 APPENDICES Appendix A City Standard Details Appendix B Engineering Geology Report APPENDIX A CITY STANDARDS DETAILS APPENDIX B ENGINEERING GEOLOGY REPORT ENGINEERING GEOLOGY REPORT WATER
3.0 SUMMARY OF POTENTIAL GEOTECHNICAL IMPACTS AND MITIGATION MEASURES
 3.0 SUMMARY OF POTENTIAL GEOTECHNICAL IMPACTS AND MITIGATION MEASURES This section summarizes the principal geotechnical conditions that occur in the project area. The potential impact that each condition
10. GEOTECHNICAL EXPLORATION PROGRAM
 Geotechnical site investigations should be conducted in multiple phases to obtain data for use during the planning and design of the tunnel system. Geotechnical investigations typically are performed in
CHAPTER GEOLOGICALLY HAZARDOUS AREAS Applicability Regulations.
 CHAPTER 19.07 GEOLOGICALLY HAZARDOUS AREAS 19.07.010 Applicability. Geologically hazardous areas may pose a threat to the health and safety of citizens when incompatible development is sited in areas of
Case History of Observed Liquefaction-Induced Settlement Versus Predicted Settlement
 Case History of Observed Liquefaction-Induced Settlement Versus Predicted Settlement M. Lew and L. Tran AMEC Environment & Infrastructure, Inc., Los Angeles, CA USA SUMMARY: A comparison of the predicted
GEOTECHNICAL REPORT. Matanuska-Susitna Borough. Parks Highway Connections Museum Drive. Matanuska-Susitna Borough, Alaska.
 Matanuska-Susitna Borough GEOTECHNICAL REPORT Parks Highway Connections Museum Drive Matanuska-Susitna Borough, Alaska March 2, 20 Prepared By: John Thornley, PE Geotechnical Engineer 333 Arctic Blvd.,
ENGINEER S CERTIFICATION OF FAULT AREA DEMONSTRATION (40 CFR )
") PLATTE RIVER POWER AUTHORITY RAWHIDE ENERGY STATION BOTTOM ASH TRANSFER (BAT) IMPOUNDMENTS LARIMER COUNTY, CO ENGINEER S CERTIFICATION OF FAULT AREA DEMONSTRATION (40 CFR 257.62) FOR COAL COMBUSTION RESIDUALS
PLATTE RIVER POWER AUTHORITY RAWHIDE ENERGY STATION BOTTOM ASH TRANSFER (BAT) IMPOUNDMENTS LARIMER COUNTY, CO ENGINEER S CERTIFICATION OF FAULT AREA DEMONSTRATION (40 CFR 257.62) FOR COAL COMBUSTION RESIDUALS
Deep Foundations 2. Load Capacity of a Single Pile
 Deep Foundations 2 Load Capacity of a Single Pile All calculations of pile capacity are approximate because it is almost impossible to account for the variability of soil types and the differences in the
Geotechnical issues in seismic assessments: When do I need a geotechnical specialist?
 Geotechnical issues in seismic assessments: When do I need a geotechnical specialist? B.H. Rama & S.J. Palmer Tonkin & Taylor Ltd (T+T), Wellington, New Zealand. 2016 NZSEE Conference ABSTRACT: The Canterbury
Hydrogeological Assessment for Part of Lots 2 and 3, Concession 5, Township of Thurlow, County of Hastings 1.0 INTRODUCTION. 1.
 February 10,2017 25506400 Ontario Ltd. Foxboro, ON Attention: Brad Newbatt Re: Hydrogeological Assessment for Part of Lots 2 and 3, Concession 5, Township of Thurlow, County of Hastings 1.0 INTRODUCTION
Geology, Soils, and Seismicity
 Section 3.8 Geology, Soils, and Seismicity Introduction This section generally evaluates the effects of the alternatives analyzed in this Supplemental DEIS with regard to geology, soils and seismicity.
ENCE 3610 Soil Mechanics. Site Exploration and Characterisation Field Exploration Methods
 ENCE 3610 Soil Mechanics Site Exploration and Characterisation Field Exploration Methods Geotechnical Involvement in Project Phases Planning Design Alternatives Preparation of Detailed Plans Final Design
USE OF GEOPHYSICAL SURVEYS FOR FILL CHARACTERIZATION AND QUANTITY ESTIMATION AT BROWNFIELD SITES A CASE HISTORY. Abstract
 USE OF GEOPHYSICAL SURVEYS FOR FILL CHARACTERIZATION AND QUANTITY ESTIMATION AT BROWNFIELD SITES A CASE HISTORY John A. Mundell, Mundell & Associates, Inc., Indianapolis, IN Gregory B. Byer, Mundell &
General. DATE December 10, 2013 PROJECT No TO Mary Jarvis Urbandale/Riverside South Development Corporation
 DATE December 10, 201 PROJECT No. 10-1121-0260- TO Mary Jarvis Urbandale/Riverside South Development Corporation CC Justin Robitaille, Urbandale Jonathan Párraga, J.L. Richards & Associates Limited FROM
DRAFT ONONDAGA LAKE CAPPING AND DREDGE AREA AND DEPTH INITIAL DESIGN SUBMITTAL H.4 SEISMIC SLOPE STABILITY ANALYSES
 DRAFT ONONDAGA LAKE CAPPING AND DREDGE AREA AND DEPTH INITIAL DESIGN SUBMITTAL H.4 SEISMIC SLOPE STABILITY ANALYSES Parsons P:\Honeywell -SYR\444576 2008 Capping\09 Reports\9.3 December 2009_Capping and
Horizontal Directional Drilling: An Approach to Design and Construction. Presenter: John Briand, PE Co-Author: Danielle Neamtu, PE
 Horizontal Directional Drilling: An Approach to Design and Construction Presenter: John Briand, PE Co-Author: Danielle Neamtu, PE Presentation Outline General HDD overview Conceptual-level evaluation Detailed
Depth (ft) USCS Soil Description TOPSOIL & FOREST DUFF
 USCS Soil Description TOPSOIL & FOREST DUFF") Test Pit No. TP-6 Location: Latitude 47.543003, Longitude -121.980441 Approximate Ground Surface Elevation: 1,132 feet Depth (ft) USCS Soil Description 0 1.5 1.5 5.0 SM 5.0 8.0 SM Loose to medium dense,
Test Pit No. TP-6 Location: Latitude 47.543003, Longitude -121.980441 Approximate Ground Surface Elevation: 1,132 feet Depth (ft) USCS Soil Description 0 1.5 1.5 5.0 SM 5.0 8.0 SM Loose to medium dense,
Geotechnical Engineering and Resilience
 Chapter 14 Part G VOLUME 2 Geotechnical Engineering and Resilience Page 192 Overview Key geotechnical aspects of the Project include: Cut slopes in dune sand, including erodibility and erosion protection;
GEOTECHNICAL REPORT CBSA Facility Redevelopment Thousand Islands International Crossing Lansdowne, Ontario
 GEOTECHNICAL REPORT CBSA Facility Redevelopment Thousand Islands International Crossing Lansdowne, Ontario Prepared For: The Federal Bridge Corporation Limited SPL Project No.: 10001084 Report Date: January
Micro Seismic Hazard Analysis
 Micro Seismic Hazard Analysis Mark van der Meijde INTERNATIONAL INSTITUTE FOR GEO-INFORMATION SCIENCE AND EARTH OBSERVATION Overview Site effects Soft ground effect Topographic effect Liquefaction Methods
Portland Water Bureau. Preparing Portland s Water Supply for The Big One. July 11, Tim Collins, P.E., G.E.
 Portland Water Bureau Preparing Portland s Water Supply for The Big One July 11, 2018 Tim Collins, P.E., G.E. Presentation Outline Portland water system overview Pacific Northwest seismic hazards Building
GEOTECHNICAL REPORT Loup Loup Bridge Replacement Okanogan County, Washington
 GEOTECHNICAL REPORT Loup Loup Bridge Replacement Okanogan County, Washington Prepared for: Nicholls Engineering Project No. 130182 May 15, 2014 ASPECT CONSULTING Contents 1 Introduction... 1 2 Scope of
IMAGING OF DEEP SINKHOLES USING THE MULTI-ELECTRODE RESISTIVITY IMPLANT TECHNIQUE (MERIT) CASE STUDIES IN FLORIDA
 CASE STUDIES IN FLORIDA") IMAGING OF DEEP SINKHOLES USING THE MULTI-ELECTRODE RESISTIVITY IMPLANT TECHNIQUE (MERIT) CASE STUDIES IN FLORIDA David Harro The G3 Group, 2509 Success Drive, Suite 1, Odessa, FL 33556, david.harro@geo3group.com
IMAGING OF DEEP SINKHOLES USING THE MULTI-ELECTRODE RESISTIVITY IMPLANT TECHNIQUE (MERIT) CASE STUDIES IN FLORIDA David Harro The G3 Group, 2509 Success Drive, Suite 1, Odessa, FL 33556, david.harro@geo3group.com
,Baynes Lake. TO...?&.?...A 2...KO.?'!!&... Sr. *logical Engineer
 > i evernment OF BRITISH COLUMBIA a TO...?&.?...A 2....KO.?'!!&... Sr. *logical Engineer... Grou,,water. Section Hydrology Division Wat.er... In~.~s.tiga.ti.On.s..Branck.... 5 u BJECT...C;.roun.dw.ater...Snve
Earth Mechanics, Inc. Geotechnical & Earthquake Engineering
 TECHNICAL MEMORANDUM EMI PROJECT NO: 13-116 DATE: October 29, 2013 PREPARED FOR: Mr. Todd W. Dudley / AECOM PREPARED BY: SUBJECT: (Raja) S. Pirathiviraj and Lino Cheang / (EMI) Preliminary Foundation Report
1 PROJECT BACKGROUND. August 14, Alberta Transportation Central Region #401, Street Red Deer, Alberta T4N 6K8
 August 14, 2013 Alberta Transportation Central Region #401, 4902 51 Street Red Deer, Alberta T4N 6K8 Mr. Dennis Grace, P.Eng. Construction Engineer Dear Mr. Grace: Central Region Geohazard Assessment 2013
Evaluation of Geotechnical Hazards
 Evaluation of Geotechnical Hazards by Geoffrey R. Martin Appendix B: Evaluation of Geotechnical Hazards Describes Evaluation Procedures Soil Liquefaction Soil Settlement Surface Fault Rupture Flooding
Limited Geotechnical Engineering Evaluation Classroom Additions Albany County Campus Laramie, Wyoming
 Limited Geotechnical Engineering Evaluation Classroom Additions Albany County Campus 2300 Missile Drive, Cheyenne, Wyoming 82001 Phone 307-635-0222 www.stratageotech.com Limited Geotechnical Engineering
Civil Engineering, Surveying and Environmental Consulting WASP0059.ltr.JLS.Mich Ave Bridge Geotech.docx
 2365 Haggerty Road South * Canton, Michigan 48188 P: 734-397-3100 * F: 734-397-3131 * www.manniksmithgroup.com August 29, 2012 Mr. Richard Kent Washtenaw County Parks and Recreation Commission 2330 Platt
Geology and Soils. Geology. Soils [ 251 ]
![Geology and Soils. Geology. Soils [ 251 ]](/thumbs/89/97974301.jpg "Geology and Soils. Geology. Soils [ 251 ]") December 2010 Geology and Soils This section describes the local geology, soils, groundwater, and seismology in the Sunrise Project area. All of these factors affect the constructability of the project
December 2010 Geology and Soils This section describes the local geology, soils, groundwater, and seismology in the Sunrise Project area. All of these factors affect the constructability of the project
Drilled Shaft Foundations in Limestone. Dan Brown, P.E., Ph.D. Dan Brown and Associates
 Drilled Shaft Foundations in Limestone Dan Brown, P.E., Ph.D. Dan Brown and Associates Foundation Engineering How we teach our students Fundamental understanding of soil and rock behavior (good!) Focus
Mass Wasting. Revisit: Erosion, Transportation, and Deposition
 Mass Wasting Revisit: Erosion, Transportation, and Deposition While landslides are a normal part of erosion and surface processes, they can be very destructive to life and property! - Mass wasting: downslope
SURFACE GEOLOGY AND LIQUEFACTION SUSCEPTIBILITY IN THE INNER RIO GRANDE VALLEY NEAR ALBUQUERQUE, NEW MEXICO
 SURFACE GEOLOGY AND LIQUEFACTION SUSCEPTIBILITY IN THE INNER RIO GRANDE VALLEY NEAR ALBUQUERQUE, NEW MEXICO Keith I. Kelson, Christopher S. Hitchcock, and Carolyn E. Randolph William Lettis & Associates,
Appendix M Preliminary Geotechnical Report, SR 32 Widening Project Study Report
 Appendix M Preliminary Geotechnical Report, SR 32 Widening Project Study Report November 3, 2005 Mr. Chris Rockway 7300 Folsom Boulevard, Suite 203 Sacramento, California 95826 Attention: Matt Brogan
Setting MOUNTAIN HOUSE NEIGHBORHOODS I AND J INITIAL STUDY 5. ENVIRONMENTAL CHECKLIST 6. GEOLOGY AND SOILS. Issue
 Issue Less Than Significant or No Impact Potential Significant Impact Adequately Addressed in MEIR MEIR Required Additional Review: No Significant Impact Less Than Significant Impact Due to Mitigation
3.12 Geology and Topography Affected Environment
 3 Affected Environment and Environmental Consequences 3.12 Geology and Topography 3.12.1 Affected Environment 3.12.1.1 Earthquakes Sterling Highway MP 45 60 Project Final EIS The Kenai Peninsula is predisposed
INTRODUCTION TO STATIC ANALYSIS PDPI 2013
 INTRODUCTION TO STATIC ANALYSIS PDPI 2013 What is Pile Capacity? When we load a pile until IT Fails what is IT Strength Considerations Two Failure Modes 1. Pile structural failure controlled by allowable
REPORT NO 12/115/D NOVEMBER 2012 GEOTECHNICAL INVESTIGATION FOR THE PROPOSED SOLAR PHOTOVOLTAIC FACILITY, GROOTVLEI POWER STATION
 Consulting Geotechnical Engineers & Engineering Geologists P.O.Box 3557 Cramerview 2060. Tel: (011) 465-1699. Fax: (011) 465-4586. Cell 082 556 7302 & 076 966 8445 REPORT NO 12/115/D NOVEMBER 2012 GEOTECHNICAL
Prepared By: John Blair Sean Donahue Celeste Hoffman Kimberly Klinkers Megan Slater
 Prepared By: John Blair Sean Donahue Celeste Hoffman Kimberly Klinkers Megan Slater Green River Basin Location Green River Basin Stratigraphic Correlation Chart showing Study Map Units Sample of Existing
FINAL REPORT GEOTECHNICAL STUDY HYDE STREET HARBOR FUEL DOCK
 FINAL REPORT GEOTECHNICAL STUDY LIFORNIA Prepared for: PORT OF SAN FRANCISCO Submitted by: AGS, INC. NOVEMBER 29 FINAL REPORT GEOTECHNICAL STUDY LIFORNIA AGS Job No. KF26 Prepared for: PORT OF SAN FRANCISCO
Northern Colorado Geotech
 PRELIMINARY GEOTECHNICAL ENGINEERING REPORT PROPOSED CECIL FARMS DEVELOPMENT WELD COUNTY ROAD 7, BETWEEN ROADS 7 AND 7 SEVERANCE, COLORADO NORTHERN COLORADO GEOTECH PROJECT NO. 0-6 APRIL 0, 06 Prepared
4.5 GEOLOGY AND SOILS
 4.5.1 Setting 4.5 GEOLOGY AND SOILS a. Regional Geology. The is located in the south central Santa Cruz Mountains in the heart of the Central Coast ranges of California. This is a seismically active region
3.8 Geology/Soils. Environmental Setting. Topography. Geology and Soils
 3.8 Geology/Soils This section examines whether implementation of the 2004 Land Use Mobility Elements, Zoning Code Revisions, and Central District Specific Plan the will expose people or structures to
Geotechnical Engineering Report
 Geotechnical Engineering Report Turner Turnpike Widening Polecat Creek Bridge (Bridge A) June 1, 2016 Terracon Project No. 04155197 Prepared for: Garver, LLC Prepared by: Terracon Consultants, Inc. TABLE
MAPPING BEDROCK: Verifying Depth to Bedrock in Calumet County using Seismic Refraction
 MAPPING BEDROCK: Verifying Depth to Bedrock in Calumet County using Seismic Refraction Revised December 13, 2011 Dave Hart Wisconsin Geological and Natural History Survey INTRODUCTION Seismic refraction
Design and Construction of Compaction Grouting for Foundation Soil Improvements
 Missouri University of Science and Technology Scholars' Mine International Conference on Case Histories in Geotechnical Engineering (2013) - Seventh International Conference on Case Histories in Geotechnical
Gotechnical Investigations and Sampling
 Gotechnical Investigations and Sampling Amit Prashant Indian Institute of Technology Gandhinagar Short Course on Geotechnical Investigations for Structural Engineering 12 14 October, 2017 1 Purpose of
Geotechnical Aspects of the Seismic Update to the ODOT Bridge Design Manual. Stuart Edwards, P.E Geotechnical Consultant Workshop
 Geotechnical Aspects of the Seismic Update to the ODOT Bridge Design Manual Stuart Edwards, P.E. 2017 Geotechnical Consultant Workshop Changes Role of Geotechnical Engineer Background Methodology Worked
APPENDIX F GEOTECHNICAL MEMORANDUM BY STRATA INC.
 PUD No. 1 of Pend Oreille County Sullivan Lake Cold Water Intake APPENDIX F GEOTECHNICAL MEMORANDUM BY STRATA INC. 95% Draft Design Documentation Report January 19, 2011 Appendix F Geotechnical Memorandum
APPENDIX E SOILS TEST REPORTS
 Otsego County, NY Site Work Specifications APPENDIX E SOILS TEST REPORTS Blue Wing Services, Inc. July 1, 2010 Blue Wing Services May 20, 2010 Page 2 the site, was not made available to Empire at this
M E M O R A N D U M. Mr. Jonathan K. Thrasher, P.E., Mr. Ian Kinnear, P.E. (FL) PSI
 PSI") M E M O R A N D U M TO: FROM: Mr. Mark Schilling Gulf Interstate Engineering Mr. Jonathan K. Thrasher, P.E., Mr. Ian Kinnear, P.E. (FL) PSI DATE: November 11, 2014 RE: Summary of Findings Geotechnical
M E M O R A N D U M TO: FROM: Mr. Mark Schilling Gulf Interstate Engineering Mr. Jonathan K. Thrasher, P.E., Mr. Ian Kinnear, P.E. (FL) PSI DATE: November 11, 2014 RE: Summary of Findings Geotechnical
Roy Pyle March 24, 2017 Chief Facilities Planner Contra Costa Community College District 500 North Court Street Martinez, CA 94533
 State of California Natural Resources Agency Edmund G. Brown Jr., Governor Department of Conservation John G. Parrish, Ph.D., State Geologist California Geological Survey 801 K Street MS 12-31 Sacramento,
Sacramento Modesto Roseville Pleasanton September 19, 2013 Marcia Medina GHD Inc. 417 Montgomery Street, Suite 700 San Francisco, CA Subject: GE
 Sacramento Modesto Roseville Pleasanton September 19, 2013 Marcia Medina GHD Inc. 417 Montgomery Street, Suite 700 San Francisco, CA 94104 Subject: GEOTECHNICAL REPORT AMENDMENT Stonybrook Creek Crossings
Converse Consultants Geotechnical Engineering, Environmental & Groundwater Science, Inspection & Testing Services
 Converse Consultants Geotechnical Engineering, Environmental & Groundwater Science, Inspection & Testing Services July 27, 2017 Ms. Rebecca Mitchell Mt. San Antonio College Facilities Planning & Management
GEOTECHNICAL ENGINEERING II. Subject Code : 06CV64 Internal Assessment Marks : 25 PART A UNIT 1
 GEOTECHNICAL ENGINEERING II Subject Code : 06CV64 Internal Assessment Marks : 25 PART A UNIT 1 1. SUBSURFACE EXPLORATION 1.1 Importance, Exploration Program 1.2 Methods of exploration, Boring, Sounding
Foundations on Deep Alluvial Soils
 Canterbury Earthquakes Royal Commission Hearings 25 October 2011, Christchurch GEO.CUB.0001.1-35.1 Foundations on Deep Alluvial Soils Misko Cubrinovski, Ian McCahon, Civil and Natural Resources Engineering,
SD-100 SD-200 SITE AND EXPLORATION PLAN SODO SEGMENT. FIG. 3 Sheet 4 of 9. Seattle Monorail Project Seattle, Washington Scale in Feet
 Central Parking Lot potential downhole arrary location (site visit //) PREFERRED New Parking Area File: I: \Drafting \\- \plans \-- Plans.dwg Date: -- Author: LR Current downhole array location LEGEND
CITY OF CAPE CORAL NORTH 2 UTILITIES EXTENSION PROJECT CONTRACT 3
 GEOTECHNICAL REPORT CITY OF CAPE CORAL NORTH UTILITIES EXTENSION PROJECT CONTRACT City of Cape Coral Procurement Division Cultural Park Boulevard, nd Floor Cape Coral, FL ISSUED FOR BID VOLUME of GEOTECHNICAL
Table 5-1 Sampling Program Summary for Milltown Ford Avenue Redevelopment Area, NJ.
 Table 5- Sampling Program Summary for Milltown Ford Avenue Redevelopment Area, NJ. Transformer Pads (9 pads: PAD 9) Evaluate if PCBs presently exist in soils adjacent to, and/or beneath the transformer
3.0 SUMMARY OF FINDINGS
 AECOM 500 W Jefferson St. Suite 1600 Louisville, KY 40202 www.aecom.com 502-569-2301 tel 502-569-2304 fax October 17, 2018 Big Rivers Electric Corporation Sebree Generating Station 9000 Highway 2096 Robards,