CHAPTER FOUR GEOPHYSICAL INTERPRETATION AND DISCUSSION
|
|
|
- Adrian Hoover
- 5 years ago
- Views:
Transcription
1 CHAPTER FOUR GEOPHYSICAL INTERPRETATION AND DISCUSSION 4.1. DATA PROCESSING AND INTERPRETATION Introduction Processing of potential field data entails the application of various filters to the data in order to accentuate certain chosen features as an aid in the interpretation of the data. The process of quantitative interpretation of both gravity and magnetic anomalies endeavours to determine a source distribution whose anomalous field matches as closely as possible the actual field on the surface of measurement. The non-uniqueness of the potential field problem results in the introduction of constraints in the form of simplification of geometry, limits to size or depth, range limits on density or susceptibility, or whatever other parameters may seem justified in the context of what is known or can be reasonably inferred about the geologic environment (Paterson and Reeves, 1985). A short discussion of the effects of the various filters used in the processing of the magnetic and/or gravity data used in this research project follows Vertical Derivative Delivatives tend to sharpen the edges of anomalies and enhance shallow features. The vertical derivative map is much more responsive to local influences than to broad or regional effects and therefore tends to give sharper picture than the map of the total field 46
2 intensity. Thus the smaller anomalies are more readily apparent in area of strong regional disturbances. In fact the first vertical derivative is used to delineate high frequency features more clearly where they are shadowed by large amplitude, low frequency anomalies. From GEOSOFT Inc., 1996; L(r} =r n with: n =order of differentiation Analytical signal This is a filter applied to magnetic data and is aimed at simplifying the fact that magnetic bodies usually have a positive and negative peak associated with it, which in many cases make it difficult to determine the exact location of the causative body. Nabighian (1972) has shown that for two-dimensional bodies, a bell-shaped symmetrical function can be derived which maximises exactly over the top of the magnetic contact. The three-dimensional case was derived in 1984 also by Nabighian. This function is the amplitude of the analytical signal. The only assumptions made are uniform magnetisation and that the cross section of all causative bodies can be represented by polygons of finite or infinite depth extent. This function and its derivatives are therefore independent of strike, dip, magnetic declination, inclination and remanent magnetism (Oebeglia and Corpel, 1997). The 3-0 analytical signal, A, of a potential field anomaly can be defined (Nabighian, 1984) A(x, y) ~ [ :]x+ [ : as: ]Y + [ ~Jz With: M =Magnetic field. 47
3 The analytical signal amplitude can now be calculated (Debeglia and Corpel, 1997) as: ( OM)2 (OM)2 (OM)2 / A(x,y)/ = Ox + Oy +---;;; Upward continuation This is the calculation of the potential field at an elevation higher than that at which the field is measured and is applied to both magnetic and gravity data. The continuation involves the application of Green's theorem and is unique if the field is completely known over the lower surface (which is usually true for gravity and magnetic fields) and where all sources above the lower surface are known (usually all are zero). Upward continuation is used to smooth out near surface effects. For upward continuation (where z is positive downward) (Telford, 1990) F(x y -h) =~fj F(x,y,O)OxOy " 21C tx r -xy + (y - y')2 + h 2 Where F (x', y',-h) =Total field at the point P(x', y',-h) above the surface on which F(x, y,o) is known. H =elevation above the surface Downward continuation Downward continuation is used to enhance features at a specified depth/elevation, lower than the acquisition level. This procedure accentuates near surface anomalies and can be used as an interpretation tool to determine the depth to a causative body. The filter can be 48
4 applied to both gravity and magnetic data. Downward continuation is done using the expression (Geosoft Inc., 1996): L(r) =e hr With h the distance in meters to be continued downward Reduction to the magnetic pole This is a method of removing the dependence of magnetic data on the angle of magnetic inclination. This filter converts data which have been recorded in the inclined earth's magnetic field to what the data would have looked like if the magnetic field had been vertical. A reduction to the pole transform will provide a symmetrical anomaly over a vertically dipping, non-remanent body and is again used as an interpretation aid under certain conditions. At low latitudes, however, an amplitude correction is required to prevent northsouth signals from dominating the data. This filter can be described as (Geosoft Inc., 1996): L(8) = 1 [sin(/j + i cos(l). cos(d 8)] With: geomagnetic inclination la inclination for amplitude correction (Ia >1) D geomagnetic declination For two-dimensional structures, the anomaly peaks correlate very closely with the analytical Signal peaks, indicating that the effect of remanent magnetism is relatively small. 49
5 4.2. MAGNETIC DATA PROCESSING AND INTERPRETATION Introduction Flight lines ran north-south and interpretation of the data was done in two stages: A basic interpretation delineating all major structural features. Cross sections along five selected profiles were modeled using 2,SO modeling software. The basic interpretation was facilitated using the following filtered presentations of the data: The total field magnetic contour map, Figure 4.1 The first vertical derivative contour map, Figure 4.2 The analytical signal contour map, Figure 4.3 Upward continued data (to SOOm), Figure 4.4 Upward continued data (to 1000m). Figure 4.S Upward continued data (to 2000m), Figure 4.6 Reduction to the pole, Figure Total magnetic intensity contour map Figure 4.1 is a presentation map that gives the vector sum of all components of the magnetic field. In this study, the remanence observed in the mafic rocks was low and from laboratory determinations do not have any undue influence on the observed magnetic intensity used for the modeling. The total field magnetic contour map reveals the magnetic characteristics of the various lithological units in the study area. Unfortunately, the nature of a magnetic anomaly is a function of the strike of the body. For example, a north-south striking dolerite dyke will have a different associated magnetic anomaly than the same dyke striking eastwest. The total field magnetic contour map is consequently primarily used to identify various lithologies. 50

6
7

8

9

10

11

12
13 Vertical Derivative map Comparison of the vertical derivative map (Figure 4.2), with the total field map (Figure 4.1), shows a marked increase in 'visibility' of structural features, especially in the southern part of the study area Analytical signal This filter was applied to the airborne total magnetic field data. Comparing this map (Figure 4.3), with the total field magnetic contours (Figure 4.1), the difference is immediately obvious along the edges of the dolerite dyke in the south-west and the central portion of the Swartkop Marble Hall anticline. The analytical signal amplitude maximises over the edge of the magnetic structures. This map was used to delineate the edges of lithological units and to determine the centres of two-dimensional structural features Upward continuation The total field data was upward continued to SOOm (Figure 4.4), 1000m (Figure 4.5) and 2000m (Figure 4.6). Upward continuation to SOOm did not have a significant effect on the original total field data. Upward continuation to 1000m did however have a significant filtering effect leaving only the fold closure of the Swartkop Marble Hall Anticline to the north, the magnetic highs at the central portion and the north-south lineament towards the eastern boundary. Upward continuation to 2000m reveals a marked distinction between any of the other upward continued data and the original data, in that the fold closures are no longer apparent and the magnetic high at the central part has disappeared leaving just a faint 58
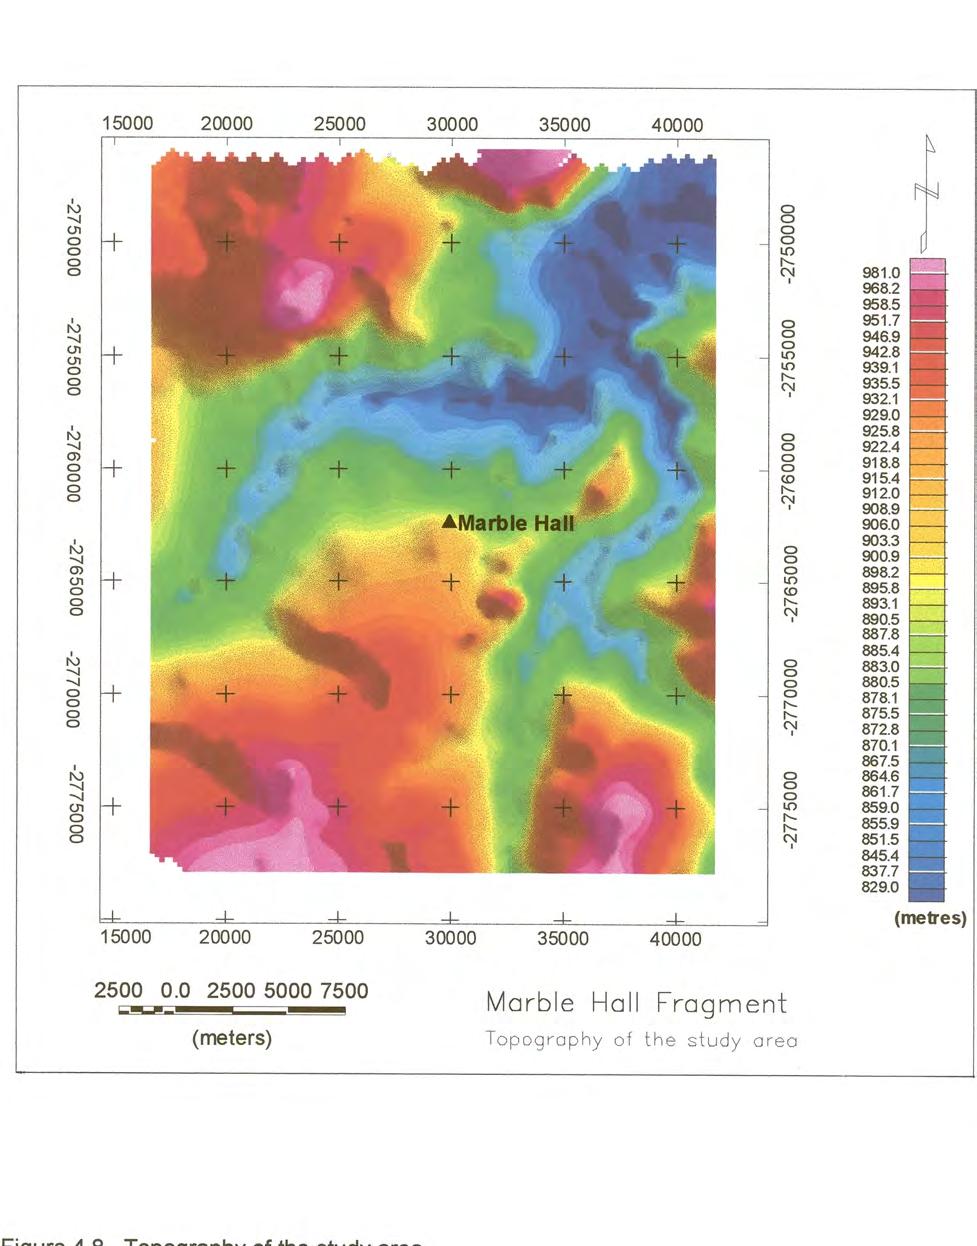
14 outline. Also, the north south lineament to the eastern boundary is better defined, the magnetic low to the south of Marble Hall is more pronounced, and, finally, the highest magnetic signature (pink) is more confined to the extreme north eastern border Reduction to the Pole (RTP) The reduction to the pole transform (Figure 4.7), resembles to a large extent the total field data except in the west where the Wonderkop fault appears to be better defined. In the northern part of the fragment where the faulting on the fold also seems to be better defined which would indicate that the influence of magnetic data on the angle of magnetic inclination has been removed. Thus, in removing the anomaly asymmetry caused by the magnetic inclination, the anomalies are better located relative to the causative bodies Processing of gravity data Reduction to Bouguer values Processing of the data to obtain the Bouguer values was done using the Oasis Montaj software from GEOSOFT. First, the base station at Marble Hall was tied in to the absolute values known for the station at Groblersdal. Second, the other base station values were tied in to the absolute value calculated for the station at Marble Hall. These base stations were then tied to the International Gravity Standardisation Network values (Morelli et ai., 1974) and were referred to the gravity formula based on the 1967 Geodetic Reference System (Moritz, 1968). Terrain corrections were not applied since the main area of interest for this research was fairly flat as is evident from the elevation contour map given in Figure 4.8. The Bouguer gravity map is shown in Figure
15 4.4. Interpretation of potential field data General The interpretation of the data was done in three stages. These consisted of: Correlating geological units with features identified on the magnetic and gravity contour maps. Do a structural interpretation of the magnetic and gravity contour maps. Do a vertical profile interpretation along a number of profiles across the study area Correlate known geology with observed geophysical anomalies. In the first stage a simplified outline of the geology was superimposed onto: the total field airborne magnetic data downward continued to ground level (Figure 4.10), the vertical derivative of the magnetic data (Figure 4.11), the bouguer gravity map (Figure 4.12), the bouguer gravity map with contour lines, emphasising the steepness of gradients in certain areas (Figure 4.13). 60
16

17
18

19

20

21

22
23 Structural interpretation ofmagnetic and gravity contour maps Gravity There is a good measure of correlation between several of the mapped geological features and the observed gravity values. The very large anomaly has a shape which roughly follows the northeast-southwest trend of the Fragment. The maximum amplitude of the gravity high is in the order of 30 mgal. This is too high to relate to either the surface geology or the topography of the area.. The steep gravity gradient observed in the north-western corner (Figure 4.13), is interpreted as a fault controlled contact between two lithologies. The interpreted fault trends from the western boundary to the northeast at a strike angle of approximately 45 degrees and is interpreted as the Wonderkop fault delineated by Lee and Sharpe (1983) and many others. The gravity data suggest the presence of high density rocks at the centre of the Marble Hall Fragment. This gravity high is situated between the prominent Wonderkop fault to the west and a suspected north-south trending fault to the east (see next section). Though the Marble Hall Fragment is bordered to the east and north-east by the Bushveld Complex granite, both the magnetic and gravity data associated with the eastern and northeastern parts of the Fragment suggest that the Bushveld granite in these areas is underlain by relatively thick mafic rocks at great depth. 68
24 Magnetics To correlate observed magnetic features with topography, the magnetic data were draped over the topography using ERMapper software. The Wonderkop fault and an interpreted north-south fault are shown in Figure A large number of dykes and faults have been identified using the various filtered airbome magnetic contour maps. These features are shown in Figure In this figure, feature 1 is identified as the Wonderkop fault, while feature 2 is interpreted as the major north-south trending fault. This fault has no surface geological expression D modeling ofselected profiles. Initially three east-west striking profiles were selected on both the total field magnetic data as well as the gravity data. These lines are labeled M', 88', and CC' in Figures 4.16(a) and (b), where the relative positions of the profiles are indicated. The software used for the interpretation of the data is MAGIXP (MAGIX PLUs ) which is an interactive, graphically oriented, modeling program designed for the interpretation of gravity and magnetic data (potential field data). For the magnetic data, the magnetic susceptibility value for the background and each body comprising the model is expressed in 81 units. A magnetic inclination and declination of and _17 0 respectively were used. The susceptibilities used for the various lithological units are given in Table 7. 69


25

26
27 A prominent magnetic signature with an amplitude in the order of 290 nt is observed in the centre of the Fragment, in about the same position as the gravity high. This anomaly remains prominent even when the data are upward continued to a height of 2000m, (Figure 4.6). The KT-9 Kappmeter (susceptibility meter) supplied by the Council for Geoscience was used in determining the magnetic sucseptibility of outcrops. Laboratory determination at the Council for Geoscience, of susceptibilities of rock samples taken from the few exposed outcrops, mostly granites and Transvaal Supergroup rocks, revealed that the samples were not remanently magnetised. Hattingh (1991), however, described the dominance of remanent magnetism in all the structural mafic zones of the Bushveld Complex, except the weakly magnetic Critical Zone. The Main Zone has a low susceptibility despite having a high natural remanent magnetism (NRM) because the carriers of magnetisation are single domain grains which are very small with little or no contribution to the susceptibility of the rock unit (Hattingh, 1986b). Larger magnetic grains which can support higher susceptibilities are very scarce or in many cases absent Hattingh (1986a, b). Hattingh (1989, 1991), indicated that the NRM in the Upper Zone is nearly 200% larger than the induced magnetisation and assumed that 80% of the NRM of the Upper Zone consist of random secondary magnetisation. This, according to Hattingh (1991), reflects that for the interpretation of magnetic anomalies associated with this zone, the induced component of the anomaly is more important than the permanent remanent magnetisation of the Upper Zone. 72
28 The susceptibilities of the Upper and Main Zones used in the modeling were taken from Hattingh (1991). Table 7 shows the susceptibilities of the various rock units. Table 7: Susceptibilities used for rocks in the research area. Rock Formation Susceptibility (SI units) Makeckaan Formation 0,003 i Nebo Granite 0,002 Pretoria Group 0,003 I Dolomite 0,000 Bushveld Upper zone 0,11129 basic rocks Main Zone 0,0025, Bloempoort Formation 0,000 Archaean Granite 0,000 I I I The regional was estimated for the magnetic profiles by fitting a second order polynomial to the TMI contour map. For the gravity data a straight or very slow curving datum line, was subtracted from the data. Starter models representing the structure of the Marble Hall Fragment as interpreted from surface geological mapping and excluding, on purpose, the mafic rocks known to exist in the central part of the Fragment, were used. The topography along these profiles are given in Figure The gravity and magnetic data and the various geological cross sections are given in Figure 4.18 (a) and (b) for profiles AA', BB' and CC' respectively. 73

29

30
31

32
33
34

35

36


37
38
39
40
41
42 LIMITATIONS. The process of quantitative interpretation of both gravity and magnetic anomalies endeavours to determine a source distribution whose anomalous field matches as closely as possible the actual field on the surface of measurement (Patterson and Reeves, 1985). The interpretation is inherently ambiguous and this ambiguity arises because any given anomaly could be caused by an infinite number of possible sources. For example concentric spheres of constant mass but differing density and radius will all produce the same anomaly, since their mass acts as though located at the centre of the sphere. This ambiguity represents the inverse problem of potential field interpretation, which states that although the anomaly of a given body may be calculated uniquely, there are an infinite number of bodies that could give rise to any specified anomaly. Another limitation to this interpretation is that a large deep body can also give the same anomaly as a small shallow body. This means that the amplitude and shape of an anomaly produced by a large body at great depth can be similar to that of a small body closer to the surface. In the same vein, a steeply dipping body and a vertical body might produce the same anomaly. Removal of regional field to isolate the residual anomalies also provides a limitation in potential field interpretation especially in gravity surveying. This is because, if the regional field subtracted is too much, part of the residual anomalies of interest could be omitted and if too little a regional field is subtracted, fictitious residual anomalies could arise which are not supposed to be part of the anomalies of interest. In this study, several samples of each particular rock type from surface outcrops have been 88
43 used for density determinations in order to obtain a reliable mean density and variance. In sedimentary rock sequences however, density tends to increase with depth due to compaction, and with age, due to progressive diagenesis, hence, non-availability of borehole information at depth from every part of the study area, might have an effect on the gravity models interpreted. A major consolation in this regard is that, the mean densities obtained for the different rock samples are compatible with that obtained in this area by Button (1973), Hattingh (1980), and Comer et al. (undated). Due to non-uniqueness of potential field interpretation such as in the gravity and magnetic methods used in this study, constraints have been introduced in the form of simplification of geometry, limits to size or depth, range limits on density and susceptibility, location and extent of outcrops and other parameters seemed justifiable in the context of what is known or can be reasonably inferred about the Marble Hall geological environment CONCLUSIONS Based on the data presented in the previous sections, the following conclusions can be made: 1. The high magnetic signature associated with the eastern limb of the Swartkop-Marble Hall Anticline, running from the south towards the north-east as observed on the total field map, is the surface expression of the Hekpoort Andesite Formation. 2. A well-defined fault, trending north-south, forms the eastern boundary of the Marble Hall Fragment. The dip of this fault could not be determined because there is no surface expression of the fault. 89
44 3. A highly magnetic, dense rock mass is situated in the centre of the Fragment. This rock mass is interpreted as an intrusive body with a central sub-vertical core section, surrounded at shallower levels, by sub-horizontal sill-like sections. 4. Due to non-uniqueness in potential field interpretation discussed above, the exact depth and thickness of the mafic sills cannot be categorically stated. It is conceivable that the sills might be thinner than indicated (Figures 4.19(a) and (b), 4.22, 4.23 Ii but much closer to the surface. 5. The crescent shaped body with high magnetic signature along the axis of the Swartkop-Marble Hall Anticline and truncated by a fault to the north, is well defined but its origin is not obvious. The outcropping lithologies in that area can not explain the high magnetic signature. It is postulated that it might be a covered sill related to the Rustenburg Layered Suite. 6. Overall, the structure of the Marble Hall Fragment can be regarded as folded floor of Transvaal Supergroup rocks between two faults - the Wonderkop fault in the northwest and the delineated north-south trending fault in the east. 7. From model interpretations, it can be suggested that the intrusion of the Bushveld mafics post-dates the folding and perhaps some of the faults in the Fragment. 8. The dips of the faulting is given as vertical in this interpretation but it is conceivable that this might not be so. 90
45 Further investigation of the Marble Hall Fragment by other geophysical methods and finally drilling, will assist in confirming the presence and exact location in depth of the main intrusive mafic body which might have potential economic value. 91
3D Geometry of the Xade Complex inferred from Gravity and Magnetic Data
 Geophysical Case Histories 3D Geometry of the Xade Complex inferred from Gravity and Magnetic Data 1. British Geological Survey, Edinburgh, United Kingdom Paper 92 Pouliquen, G. [1], Key, R. [1] ABSTRACT
Imaging VTEM Data: Mapping Contamination Plumes In Tarlton, South Africa
 Imaging VTEM Data: Mapping Contamination Plumes In Tarlton, South Africa M. Combrinck Geotech Airborne Limited Summary VTEM data were acquired during a test survey flown over the Tarlton region in South
Available online Journal of Scientific and Engineering Research, 2016, 3(2):1-7. Research Article
:1-7. Research Article") Available online www.jsaer.com, 2016, 3(2):1-7 Research Article ISSN: 2394-2630 CODEN(USA): JSERBR Assessment of the Reliability of Magnetic Method to Delineate Geologic Features in a Basement Complex:
Available online www.jsaer.com, 2016, 3(2):1-7 Research Article ISSN: 2394-2630 CODEN(USA): JSERBR Assessment of the Reliability of Magnetic Method to Delineate Geologic Features in a Basement Complex:
Magnetic Case Study: Raglan Mine Laura Davis May 24, 2006
 Magnetic Case Study: Raglan Mine Laura Davis May 24, 2006 Research Objectives The objective of this study was to test the tools available in EMIGMA (PetRos Eikon) for their utility in analyzing magnetic
C5 Magnetic exploration methods data analysis techniques
 C5 Magnetic exploration methods data analysis techniques C5.1 Data processing and corrections After magnetic field data have been collected a number of corrections are applied to simplify the interpretation.
Euler Deconvolution Technique for Gravity Survey
 Journal of Applied Sciences Research, 6(11): 1891-1897, 2010 2010, INSInet Publication Euler Deconvolution Technique for Gravity Survey 12,3 Piyaphong Chenrai, 2 Jayson Meyers, 1,4 Punya Charusiri 1 Earthquake
Distortion Effects of Faults on Gravity Worm Strings Robin O Leary
 Distortion Effects of Faults on Gravity Worm Strings Robin O Leary Problem Can upward continued gravity anomaly worm strings be used as a tool to determine the dip direction of an offsetting structure
MEMORANDUM. Interpretation of Magnetic and Volterra-3DIP survey MC Claims
 11966 95A Avenue, Delta, BC V4C 3W2 Canada Tel +1 (604) 582-1100 www.sjgeophysics.com MEMORANDUM Date: September 13, 2017 From: To: SUBJECT: E. Trent Pezzot Bonanza Mining Corporation Interpretation of
Pasco project ground magnetics
 Pasco project ground magnetics Survey information Magnetic results Comments Conclusions General data information 13 June 2017 Piura Trujillo Lima Pasco Cusco Arequipa Survey information General geographic
Horizontal gradient and band-pass filter of aeromagnetic data image the subsurface structure; Example from Esh El Mellaha Area, Gulf of Suez, Egypt.
 Horizontal gradient and band-pass filter of aeromagnetic data image the subsurface structure; Example from Esh El Mellaha Area, Gulf of Suez, Egypt. Essam Aboud 1, Serguei Goussev 2, Hassan Hassan 2, Suparno
GEOPHYSICS GRAVITY DATA COVERAGE
 GEOPHYSICS DATA COVERAGE The Mudgee-Gulgong district lies within the Dubbo 1:250,000 sheet area. This area is now covered by high res_olution gravity, magnetic and radiometric data. The aeromagnetic and
KEMESS SOUTH MAGNETIC MODELING. CONDOR CONSULTING, INC. OCTOBER 2017
 KEMESS SOUTH MAGNETIC MODELING. CONDOR CONSULTING, INC. OCTOBER 2017 INTRODUCTION Magnetic data in the vicinity of the Kemess South Mine in the Yukon has been analyzed and modeled in order to try to explain
2) First Order Resistivity Effects. The first order effects discussed above in the main reflect vertical resistivity features. (1) Surficial Zone (R3)
 First Order Resistivity Effects. The first order effects discussed above in the main reflect vertical resistivity features. (1) Surficial Zone (R3)") The first and second order effects represent clear and obvious features in the data, while the third order effects are subtle, appearing real and consistent, but on the limit of interpretability. A number
The first and second order effects represent clear and obvious features in the data, while the third order effects are subtle, appearing real and consistent, but on the limit of interpretability. A number
Darnley Bay Resources Preliminary Airborne Survey Results
 4 King Street West, Suite 1103 Toronto, Ontario M5H 1B6, Canada Tel:(416) 862-7885 Fax:(416) 862-7889 dbr@darnleybay.com UPDATE Trading Symbol: DBL. TSX Venture Exchange April 19, 2010 Darnley Bay Resources
Structural Geology Lab. The Objectives are to gain experience
 Geology 2 Structural Geology Lab The Objectives are to gain experience 1. Drawing cross sections from information given on geologic maps. 2. Recognizing folds and naming their parts on stereoscopic air
LAB 1: ORIENTATION OF LINES AND PLANES
 LAB 1: ORIENTATION OF LINES AND PLANES Read the introductory section, chapter 1, pages 1-3, of the manual by Rowland et al (2007) and make sure you understand the concepts of bearing, strike, dip, trend,
5. Gravity. 5.1 Geoid Variations. The Australian Continent: A Geophysical Synthesis Gravity
 34 The Australian Continent: A Geophysical Synthesis Gravity 5. Gravity Gravity data map subtle changes in the Earth s gravitational field caused by variations in the density of the underlying materials.
Airborne gravity gradiometer surveying of petroleum systems under Lake Tanganyika, Tanzania
 Airborne gravity gradiometer surveying of petroleum systems under Lake Tanganyika, Tanzania D. Roberts Beach Energy P. Roy Chowdhury CGG S. J. Lowe CGG A. N. Christensen CGG Outline Introduction Geology
September 16, 2010 Magnetic surveying
 September 16, 2010 Magnetic surveying After today, you will be able to Sketch anomalies over objects at any location, and explain how you derived the pattern. Explain the relation between dipoles and real
OZ SEEBASE TM. Datasets. Digital Elevation Model
 Digital Elevation Model 10 Digital Elevation Models (DEM s) often show the youngest structures, and any active geological structures. They are widely used for neotectonic analysis. The composition of eroding
GRAVITY AND MAGNETIC SURVEY NECHAKO BASIN STUDY ACQUISITION AND PROCESSING PHASE
 GRAVITY AND MAGNETIC SURVEY NECHAKO BASIN STUDY ACQUISITION AND PROCESSING PHASE Report prepared for the B.C. Ministry of Energy and Mines Resource Development Division New Ventures Branch by Bemex Consulting
Introducti on. Land Survey. Geomagnetic Survey. Geomagnetic Results and Interpretati ons - Conclusions and Recommendations C
 m M 42A86SW8281 63.42 PRICE 010 C O H T E H l 42A86SW828I 63.42 PRICE 010C Introducti on Land Survey Geomagnetic Survey Geomagnetic Results and Interpretati ons - Conclusions and Recommendations - - -
GRAVITY AND MAGNETIC METHODS
 Presented at Short Course IX on Exploration for Geothermal Resources, organized by UNU-GTP, GDC and KenGen, at Lake Bogoria and Lake Naivasha, Kenya, Nov. 2-24, 2014. Kenya Electricity Generating Co.,
MEMORANDUM. Al Maynard, Francesco Fucilla - Yellow Resources Pty. Ltd. Lake Darlot - Gravity and Passive Seismic Processing Interpretation/Modelling
 Southern Geoscience Consultants Pty Ltd ACN 067 552 461 Level 1, 183 Great Eastern Highway, Belmont WA 6104 AUSTRALIA PO Box 694, Belmont WA 6984 AUSTRALIA T +61 (8) 6254 5000 F +61 (8) 6254 5099 E geophysics@sgc.com.au
Integrated Geophysical Interpretation On The Groundwater Aquifer (At The North Western Part of Sinai, Egypt)
") Integrated Geophysical Interpretation On The Groundwater Aquifer (At The North Western Part of Sinai, Egypt) Sultan Awad Sultan Araffa 1, Hassan S. Sabet 2, Ahmed M, Al Dabour 3 1 National Research Institute
Integrated Geophysical Interpretation On The Groundwater Aquifer (At The North Western Part of Sinai, Egypt) Sultan Awad Sultan Araffa 1, Hassan S. Sabet 2, Ahmed M, Al Dabour 3 1 National Research Institute
Mine Scale Constrained Geophysical Inversion; A Case Study at the Darlot-Centenary Gold Mine
 Page 1 Mine Scale Constrained Geophysical Inversion; A Case Study at the Darlot-Centenary Gold Mine Sarah Monoury, SRK Consulting, Ben Jupp, SRK Consulting and Andrew Foley, Gold Fields This article was
Answers: Internal Processes and Structures (Isostasy)
") Answers: Internal Processes and Structures (Isostasy) 1. Analyse the adjustment of the crust to changes in loads associated with volcanism, mountain building, erosion, and glaciation by using the concept
Answers: Internal Processes and Structures (Isostasy) 1. Analyse the adjustment of the crust to changes in loads associated with volcanism, mountain building, erosion, and glaciation by using the concept
What have we learned from the Case Histories
 What have we learned from the Case Histories Earth materials have a range of physical properties. Application of geophysics is carried out in a 7 Step process. Physical property of the target must be different
OUTLINE. Many of us secretly dream of six months without gravity COURSE DESCRIPTION
 GEOL 481.3 OUTLINE POTENTIAL FIELD METHODS GEOL 481.3 email: jim.merriam@usask.ca POTENTIAL FIELD METHODS Many of us secretly dream of six months without gravity Allan Fotheringham COURSE DESCRIPTION This
Delineation of Zones at Risk from Groundwater Inflows at an Underground Platinum Mine in South Africa
 Delineation of Zones at Risk from Groundwater Inflows at an Underground Platinum Mine in South Africa Mr Andreas Stoll andreas.stoll@erm.com Environmental Resources Management Swiss GmbH (ERM), Switzerland
Walkaway Seismic Experiments: Stewart Gulch, Boise, Idaho
 Walkaway Seismic Experiments: Stewart Gulch, Boise, Idaho Lee M. Liberty Center for Geophysical Investigation of the Shallow Subsurface Boise State University Boise, Idaho 1. Summary CGISS conducted walkaway
COOMALIE RIDGES RADIOMETRIC SURVEY, RUM JUNGLE AREA,
 COMMONWEALTH OF AUSTRALIA DEPARTMENT OF NATIONAL DEVELOPMENT BUREAU OF MINERAL RESOURCES, GEOLOGY AND GEOPHYSICS RECORD No. 1966/51 500917 COOMALIE RIDGES RADIOMETRIC SURVEY, RUM JUNGLE AREA, NORTHERN
Analytic Signal and Euler Depth Interpretation of Magnetic Anomalies: Applicability to the Beatrice Greenstone Belt
 Journal of Geography and Geology; Vol. 7, No. 4; 15 ISSN 1916-9779 E-ISSN 1916-9787 Published by Canadian Center of Science and Education Analytic Signal and Euler Depth Interpretation of Magnetic Anomalies:
MAGNETIC MODELING OF THE SUBSURFACE STRUCTURE OF SHIP ROCK, NEW MEXICO
 MAGNETIC MODELING OF THE SUBSURFACE STRUCTURE OF SHIP ROCK, NEW MEXICO ANDISHEH BEIKI University of Toronto Research Advisor: Dr. Charly Bank INTRODUCTION Ship Rock is a prominent volcanic neck of the
 http://foundation.aapg.org/students/undergraduate/weeks.cfm Tim Carr - West Virginia University 3 Potential Fields Indirect Visualization Density and Magnetization Gravity and Magnetic Exploration Locate
REPORT ON GEOPHYSICAL SURVEYS ON THE BAMAJI LAKE PROPERTY CROBIE PROJECT, NW ONTARIO OF UMEX INC.
 S20e3NWe«28 S20«3NWee37 FRY LAKE 0 1 0 REPORT ON GEOPHYSICAL SURVEYS ON THE BAMAJI LAKE PROPERTY CROBIE PROJECT, NW ONTARIO OF UMEX INC. Patricia Mining Division NTS 52 0/3 Latitude 51 10'N Longitude 91
GE 2400 Test #2 3/26/03. Name
 GE 2400 Test #2 3/26/03 Name 9. Fill in the blank. a. minerals have a negative magnetic susceptibility. b. Ground surveys that use gradiometer magnetometers generally measure the. c. Horizontal derivatives
Raster Data Enhancement and Tectonic Element Interpretation in ArcMap
 Raster Data Enhancement and Tectonic Element Interpretation in ArcMap Vsevolod Egorov ESRI Petroleum User Group Conference Houston, TX 2005 Abstract ArcMap Spatial Analyst provides quick, but powerful
Integrated Interpretation of Gravity, Magnetic & Seismic data for delineation of Basement Configuration in Sadiya Block, Upper Assam, India
 P-225 Integrated Interpretation of Gravity, Magnetic & Seismic data for delineation of Basement Summary G.K.Ghosh *, S.K.Basha, V.K. Kulshreshth Gravity and magnetic data were collected jointly by National
Quaternary clays alluvial sands of the Shepparton Formation overlie the basement rocks.
 NAGAMBIE GOLDFIELD Regional Geological Setting The Nagambie Project is located within the Melbourne Structural Zone of Victoria. The lithologies range in age from the Upper Silurian Broadford Formation
APPENDIX C GEOLOGICAL CHANCE OF SUCCESS RYDER SCOTT COMPANY PETROLEUM CONSULTANTS
 APPENDIX C GEOLOGICAL CHANCE OF SUCCESS Page 2 The Geological Chance of Success is intended to evaluate the probability that a functioning petroleum system is in place for each prospective reservoir. The
Environmental Scoping Report for the proposed establishment of a New Coal-Fired Power Station in the Lephalale Area, Limpopo Province
 8. GEOLOGY, SOILS AND AGRICULTURAL POTENTIAL 8.1. Geology 8.1.1. Candidate Site Geology Due to the layered natured of the geology and various structures the candidate sites are underlain by differing geological
Quantitative Magnetization Vector Inversion
 Quantitative Magnetization Vector Inversion I. N. MacLeod, R. G. Ellis 1. Geosoft Inc., Canada, ian.macleod@geosoft.com 2. Geosoft Inc., Canada, robert.ellis@geosoft.com BIOGRAPHY Ian MacLeod (BSc, Geology,
Determination of Subsurface Bulk Density Distribution for Geotechnical Investigation using Gravity Technique
 Journal of Earth Sciences and Geotechnical Engineering, vol. 7, no.2, 2017, 63-69 ISSN: 1792-9040 (print), 1792-9660 (online) Scienpress Ltd, 2017 Determination of Subsurface Bulk Density Distribution
Structural Geology Lab. The Objectives are to gain experience
 Geology 2 Structural Geology Lab The Objectives are to gain experience 1. Drawing cross sections from information given on geologic maps. 2. Recognizing folds and naming their parts on stereoscopic air
Potential-field studies supporting the seismic data in the Georgina Basin-Arunta Province region, Northern Territory
 Potential-field studies supporting the seismic data in the Georgina Basin-Arunta Province region, Northern Territory Richard Chopping 1, Clarke Petrick 2, Indrajit Roy 1, Tony Meixner 1 1 Geoscience Australia
GEOPHYSICAL MAPS AND PETROPHYSICAL DATA OF MOZAMBIQUE
 Geophysical maps and petrophysical data of Mozambique GTK Consortium Geological Surveys in Mozambique 2002 2007, edited by Yrjö Pekkala, Tapio Lehto & Hannu Mäkitie, 65 80, 2008 GEOPHYSICAL MAPS AND PETROPHYSICAL
GEOPHYSICAL REPORT THE CAVZ CLAIMS
 GEOPHYSICAL REPORT Magnetometer Survey on THE CAVZ CLAIMS CAVZ M.C.'s 1 to 12, 15 to 26, 29 to 40, 45 to 54 Trail Peak, Omineca M.D. 13 miles northeast of Fort Babine 550 ) 126 S.E. by G.Podolsky J.Russell
NOTES ON THE RESPONSE OF THE PECORS MAGNETIC ANOMALY
 L.E. Reed Geophysical Consultant Inc. 11331 Fourth Line Nassagaweya R.R. 2 Rockwood, Ont. N0B 2K0, Canada PHONE:905 854 0438 FAX: 905 854 1355 E-mail: lereed@aztec-net.com NOTES ON THE RESPONSE OF THE
The Gulf of Mexico - From Various Vantage Points John E. Bain, Kenton J. Hamilton
 The Gulf of Mexico - From Various Vantage Points John E. Bain, Kenton J. Hamilton Oftentimes in exploration geophysics we tend to focus on specific near-term exploration prospects, as dictated by the current
MEMO. TO: Dennis Lapoint CC: FROM: Eriaan Wirosono DATE: April, 20 th 2014 SUBJECT: Exploration activity report March-April 2014_EW
 TO: Dennis Lapoint CC: FROM: Eriaan Wirosono DATE: April, 20 th 2014 SUBJECT: Exploration activity report March-April 2014_EW MEMO 1. Highlights and Productivity Overview pan sampling on target Areas 1
KEYSTONE PROPERTY GRAVITY GIS DATABASE. Residual Gravity Looking Down to Northwest
 KEYSTONE PROPERTY GRAVITY - 2018 GIS DATABASE Residual Gravity Looking Down to Northwest James L. Wright M.Sc. May 11, 2018 TABLE OF CONTENTS INTRODUCTION......................... 2 SURVEY PROCEDURE......................
The 2nd South Asain Geoscience Conference and Exhibition,GEOIndia2011, 12-14th Jan,2011,Gearter Noida,New Delhi,India
 Summary Jaisalmer basin of western Rajasthan: a gravity perspective K. Arora, K. Suman, M.M. Dixit and D. Sarkar The sedimentary basins of western Rajasthan constitute a part of the shelf zone of the Indus
Predictive Modelling of Ag, Au, U, and Hg Ore Deposits in West Texas Carl R. Stockmeyer. December 5, GEO 327G
 Predictive Modelling of Ag, Au, U, and Hg Ore Deposits in West Texas Carl R. Stockmeyer December 5, 2013 - GEO 327G Objectives and Motivations The goal of this project is to use ArcGIS to create models
Relinquishment Report for Licence Number P1356, Block 48/8c March 2008
 Relinquishment Report for Licence Number P1356, Block 48/8c March 2008 Table of Contents 1.0 Header...3 2.0 Synopsis...3 3.0 Exploration Activities...4 4.0 Prospectivity Analysis...11 5.0 Conclusions...12
UNDERSTANDING GEOLOGIC M APS
 Name: Lab Section: work in groups, but each person turns in his/her own GEOSCIENCE 001 L AB UNDERSTANDING GEOLOGIC M APS Geologic maps are colorful and even beautiful, but they also contain an amazing
ENVI.2030L - Plate Tectonics - Geomagnetism, Earthquakes, and Gravity
 I. Geomagnetism Name ENVI.2030L - Plate Tectonics - Geomagnetism, Earthquakes, and Gravity The earth's magnetic field can be viewed as a simple bar magnet located near the center of the earth and inclined
AND HORSEFLY PROSPECTS, N.W. BRITISH COLUMBIA NTS, 103H/ll, 14 FOR ATNA RESOURCES LTD DELTA GEOSCIENCE LTD
 AND HORSEFLY PROSPECTS, N.W. BRITISH COLUMBIA NTS, 103H/ll, 14 FOR ATNA RESOURCES LTD BY DELTA GEOSCIENCE LTD FE T A. HENDRICKSON, P.GEO. 1 . TABLE OF CONTENTS Introduction............. Page 1. Personnel..........
Note that gravity exploration is different to seismic exploration in the following way:
 224B3 Other factors that cause changes in g and need to be corrected Note that gravity exploration is different to seismic exploration in the following way: In a seismic survey, the travel time depends
Structural Geology, GEOL 330 Fold mapping lab: Even folds get parasites Spring, 2012
 Structural Geology, GEOL 330 Name: Fold mapping lab: Even folds get parasites Spring, 2012 This exercise is meant to mimic a field experience in which you, the student, will measure beddingcleavage relationships
QUALITATIVE INTERPRETATION OF POTENTIAL FIELD PROFILES: SOUTHERN NECHAKO BASIN
 QUALITATIVE INTERPRETATION OF POTENTIAL FIELD PROFILES: SOUTHERN NECHAKO BASIN By Melvyn E. Best Bemex Consulting International 5288 Cordova Bay Road Victoria, B.C. V8Y 2L4 KEYWORDS: potential fields,
Geophysical Evaluation of Magnetic Data of Okenugbo Area, Ago - Iwoye, Southwestern, Nigeria
 Geophysical Evaluation of Magnetic Data of Okenugbo Area, Ago - Iwoye, Southwestern, Nigeria 1 Oladunjoye H.T. 2 Olasunkanmi, N. K. 3 Olaleye, A.O 1 Department of Physics, Olabisi Onabanjo University,
Summary of Rover Metals Geologic Mapping Program at the Up Town Gold Project, Northwest Territories
 October 13, 2017 Summary of Rover Metals Geologic Mapping Program at the Up Town Gold Project, Northwest Territories Vancouver, British Columbia, Canada - Rover Metals Corp., Rover, is pleased to provide
2D-Euler Deconvolution technique and Electrical Self-Potential analysis for subsurface structures delineation in Matuu, Machakos County, Kenya
 IOSR Journal of Applied Geology and Geophysics (IOSR-JAGG) e-issn: 2321 99, p-issn: 2321 982.Volume 3, Issue 6 Ver.II (Nov. - Dec. 215), PP 3-36 www.iosrjournals.org 2D-Euler Deconvolution technique and
ERTH 4121 Gravity and Magnetic Exploration Session 4. Introduction to magnetics - 2
 ERTH 4121 Gravity and Magnetic Exploration Session 4 Introduction to magnetics - 2 Lecture schedule (subject to change) Minimum 10 x 3 hour lecture sessions: 1:30pm Tuesdays Aug 2 : 1. Introduction to
Investigation of the topography effect on the shape and polarity of the magnetic anomalies
 Bollettino di Geofisica Teorica ed Applicata Vol. 56, n. 1, pp. 43-54; March 2015 DOI 10.4430/bgta0135 Investigation of the topography effect on the shape and polarity of the magnetic anomalies M. Kangazian
COPPERSTONE RESOURCES AB INTERCEPTS ZONE OF CHALCOPYRITE-ARSENOPYRITE- BORNITE MINERALIZATION AT SVARTLIDEN IN FIRST DEEP DRILLHOLE FROM 720m-810m
 COPPERSTONE RESOURCES AB INTERCEPTS ZONE OF CHALCOPYRITE-ARSENOPYRITE- BORNITE MINERALIZATION AT SVARTLIDEN IN FIRST DEEP DRILLHOLE FROM 720m-810m In mid-january 2017 Copperstone Resource published a geological
2D DC Resistvity Data Interpretation Using Analytical Signal Approach
 2D DC Resistvity Data Interpretation Using Analytical Signal Approach 1 Rambhatla G. Sastry, 2 Mukesh Gupta* 1 Department of Earth Sciences, IIT, Roorkee 2. ONGC, Wls Mehsana, India-384003 E-Mail: rgssastry@yahoo.com
Airborne Geophysical Survey Report River Jordan Property
 Airborne Geophysical Survey Report River Jordan Property Prepared for: Inc. September 3, 2009 Precision GeoSurveys Inc. 520-355 Burrard Street, Vancouver, Canada V6C 2G8 www.precisiongeosurveys.com Table
Gravity Support for Hydrocarbon Exploration at the Prospect Level
 Journal of Emerging Trends in Engineering and Applied Sciences (JETEAS) 2 (1): 1-6 Scholarlink Research Institute Journals, 2011 (ISSN: 2141-7016) jeteas.scholarlinkresearch.org Journal of Emerging Trends
PART A: Short-answer questions (50%; each worth 2%)
") PART A: Short-answer questions (50%; each worth 2%) Your answers should be brief (just a few words) and may be written on these pages if you wish. Remember to hand these pages in with your other exam pages!
PART A: Short-answer questions (50%; each worth 2%) Your answers should be brief (just a few words) and may be written on these pages if you wish. Remember to hand these pages in with your other exam pages!
Report of Gridding and Magnetic Surveys. On the. Munro Property. Munro and Beatty Townships, Ontario. Larder Lake Mining Division
 Report of Gridding and Magnetic Surveys On the Munro Property Munro and Beatty Townships, Ontario Larder Lake Mining Division Claims: 39 4244 For Big Red Diamond Corporation October 3, 2 Timmins, Ontario
Geological & Geophysical Interpretation of ZTEM EM and Magnetic Survey. Kemess Project, BC. for AuRico Metals Inc. September, 2016 Nicole Pendrigh
 Geological & Geophysical Interpretation of ZTEM EM and Magnetic Survey Kemess Project, BC for AuRico Metals Inc. September, 2016 Nicole Pendrigh SUMMARY REPORT Regional setting Located in North central
SITE SURVEY FOR SITE 410, AN EXAMPLE OF THE USE OF LONG-RANGE SIDE-SCAN SONAR (GLORIA)
") 10. SITE SURVEY FOR SITE 410, AN EXAMPLE OF THE USE OF LONG-RANGE SIDE-SCAN SONAR (GLORIA) R. C. Searle and A. S. Laughton, Institute of Oceanographic Sciences, Wormley, GU8 5UB, UK and B. D. Loncarevic,
10. SITE SURVEY FOR SITE 410, AN EXAMPLE OF THE USE OF LONG-RANGE SIDE-SCAN SONAR (GLORIA) R. C. Searle and A. S. Laughton, Institute of Oceanographic Sciences, Wormley, GU8 5UB, UK and B. D. Loncarevic,
Airborne Geophysical Techniques
 University of Wollongong Research Online Coal Operators' Conference Faculty of Engineering and Information Sciences 2006 Airborne Geophysical Techniques M. Armstrong Illawarra Coal, BHP Billiton A. Rodeghiero
Last week we obtained a general solution: 1 cos αdv
 GRAVITY II Surface Gravity Anomalies Due to Buried Bodies Simple analytical solution may be derived for bodies with uniform density contrast simple shape, such as: Sphere Horizontal/vertical cylinders
Contribution Of Potential Field Data In Delineating The Structural-Tectonic Set-Up Of The Eastern Qattara Depression Area, Western Desert, Egypt.
 Australian Journal of Basic and Applied Sciences, 6(3): 204-223, 2012 ISSN 1991-8178 Contribution Of Potential Field Data In Delineating The Structural-Tectonic Set-Up Of The Eastern Qattara Depression
Magnetic and Gravity Methods for Geothermal Exploration
 Magnetic and Gravity Methods for Geothermal Exploration Dr. Hendra Grandis Geophysics - ITB method and survey procedure Aero- or ground magnetic (covers a large area) Schlumberger resistivity mapping and
Gravity data reduction
 Gravity data reduction REDUCTION: raw data à gravity anomaly data Temporal corrections tides and instrument drift Spatial corrections latitude and elevation GRS67 = gravity variation with latitude at sea
Gravity Methods (VII) more wrap up
 more wrap up") Environmental and Exploration Geophysics II Gravity Methods (VII) more wrap up tom.h.wilson tom.wilson@mail.wvu.edu Department of Geology and Geography West Virginia University Morgantown, WV 0.4 0.35
Environmental and Exploration Geophysics II Gravity Methods (VII) more wrap up tom.h.wilson tom.wilson@mail.wvu.edu Department of Geology and Geography West Virginia University Morgantown, WV 0.4 0.35
Interpretation of magnetic anomaly using cos( ) map and SED for automatic source edge location in Assam-Arakan basin of Mizoram state, India
 map and SED for automatic source edge location in Assam-Arakan basin of Mizoram state, India") Interpretation of magnetic anomaly using cos( ) map and SED for automatic source edge location in Assam-Arakan basin of Mizoram state, India G. K.Ghosh*, R. Dasgupta, A. N. Borthakur and S. N. Singh, Oil
Interpretation of magnetic anomaly using cos( ) map and SED for automatic source edge location in Assam-Arakan basin of Mizoram state, India G. K.Ghosh*, R. Dasgupta, A. N. Borthakur and S. N. Singh, Oil
Total Magnetic Field and VLF Surveys on the Swayze Property. Claim Swayze Township. Porcupine Mining Division
 1 January, 016 NTS: 041 O 15 Total Magnetic Field and VLF Surveys on the Swayze Property Claim 475471 Swayze Township Porcupine Mining Division 380850E, 599450N UTM Z17N NAD83 Report Prepared for: 540
INTERPRETED FAULTING PATTERNS IN NORTHEAST ALBERTA USING HIGH RESOLUTION AEROMAGNETIC DATA. Canadian Journal of Exploration Geophysicists, 1998
 INTERPRETED FAULTING PATTERNS IN NORTHEAST ALBERTA USING HIGH RESOLUTION AEROMAGNETIC DATA M. E. Best 1, H. J. Abercrombie 2 and J. W. Peirce 3 Canadian Journal of Exploration Geophysicists, 1998 ABSTRACT
Work with Gravity Data in GM-SYS Profile
 Work with Gravity Data in GM-SYS Profile In GM-SYS Profile, a "Station" is a location at which an anomaly component is calculated and, optionally, was measured. In order for GM-SYS Profile to calculate
POTENTIAL OF THE DONGWE COPPER GOLD PROJECT
 POTENTIAL OF THE DONGWE COPPER GOLD PROJECT By Nathan Sabao, P.Geo. September 2015 1 TABLE OF CONTENTS Page 1.0 EXECUTIVE SUMMARY 1 2.0 LOCATION 2 3.0 ACCESS 2 4.0 GEOLOGY 3 5.0 PREVIOUS DRILLING 5 6.0
Use of Geostatistically-constrained Potential Field Inversion and Downhole Drilling to Predict Distribution of Sulphide and Uranium Mineralisation
 Use of Geostatistically-constrained Potential Field Inversion and Downhole Drilling to Predict Distribution of Sulphide and Uranium Mineralisation Matthew Zengerer Talk Outline Introduction Purpose and
Potential Field investigation of Williston Basin Basement
 Potential Field investigation of Williston Basin Basement Jiakang Li* and Igor Morozov, University of Saskatchewan, Canada Summary Major faults and domains are identified in the Precambrian basement of
For personal use only
 AVZ Minerals Limited 19 September 2016 ACQUISITION OF MANONO EXTENSION LITHIUM, TIN AND TANTALUM PROJECT IN THE DEMOCRATIC REPUBLIC OF CONGO Company to acquire, subject to due diligence, the Manono Extension
Separation of regional and residual magnetic field data
 GEOPHYSICS, VOL. 63, NO. 2 (MARCH-APRIL 1998); P 431-439,13 FIGS. Separation of regional and residual magnetic field data Yaoguo Li* and Douglas W. Oldenburg* ABSTRACT We present a method for separating
Seismic Reflection Imaging across the Johnson Ranch, Valley County, Idaho
 Seismic Reflection Imaging across the Johnson Ranch, Valley County, Idaho Report Prepared for the Skyline Corporation Lee M. Liberty Center for Geophysical Investigation of the Shallow Subsurface (CGISS)
BUREAU OF MINERAL RESOURCES GEOLOGY AND GEOPHYSICS.
 COMMONWEALTH OF AUSTRALIA. DEPARTMENT OF NATIONAL DEVELOPMENT. BUREAU OF MINERAL RESOURCES GEOLOGY AND GEOPHYSICS. RECORDS: 1962/33 GEOLOGY OF THE B.W. IRON CLAIM, HUNDRED OF WATERHOUSE, NORTHERN TERRITORY.
Aeromagnetic map of the Death Valley ground-water model area, Nevada and California
 Aeromagnetic map of the Death Valley ground-water model area, Nevada and California By D.A. Ponce and R.J. Blakely Prepared in cooperation with the Nevada Operations Office National Nuclear Security Administration
GEOSYNTEC CONSULTANTS
 GEOSYNTEC CONSULTANTS 2100 Main Street, Suite 150 Huntington Beach, CA 92648 USA Tel (714) 969-0800 Fax (714) 969-0820 15 February 2006 Ms. Tamara Zeier, P.E. Project Manager Project Navigator, Ltd. One
In this lab, we will study and analyze geologic maps from a few regions, including the Grand Canyon, western Wyoming, and coastal California.
 Name: Lab Section: work in groups, but each person turns in his/her own GEOSCIENCE 001 LAB UNDERSTANDING GEOLOGIC MAPS Geologic maps are colorful and even beautiful, but they also contain an amazing amount
POTASH DRAGON CHILE GEOPHYSICAL SURVEY TRANSIENT ELECTROMAGNETIC (TEM) METHOD. LLAMARA and SOLIDA PROJECTS SALAR DE LLAMARA, IQUIQUE, REGION I, CHILE
 METHOD. LLAMARA and SOLIDA PROJECTS SALAR DE LLAMARA, IQUIQUE, REGION I, CHILE") POTASH DRAGON CHILE GEOPHYSICAL SURVEY TRANSIENT ELECTROMAGNETIC (TEM) METHOD LLAMARA and SOLIDA PROJECTS SALAR DE LLAMARA, IQUIQUE, REGION I, CHILE OCTOBER 2012 CONTENT Page I INTRODUCTION 1 II FIELD
POTASH DRAGON CHILE GEOPHYSICAL SURVEY TRANSIENT ELECTROMAGNETIC (TEM) METHOD LLAMARA and SOLIDA PROJECTS SALAR DE LLAMARA, IQUIQUE, REGION I, CHILE OCTOBER 2012 CONTENT Page I INTRODUCTION 1 II FIELD
Name. GEOL.5220 Structural Geology Faults, Folds, Outcrop Patterns and Geologic Maps. I. Properties of Earth Materials
 I. Properties of Earth Materials GEOL.5220 Structural Geology Faults, Folds, Outcrop Patterns and Geologic Maps Name When rocks are subjected to differential stress the resulting build-up in strain can
Morphometric Analysis of Chamundi Hills, Mysuru, India Using Geographical Information System
 Volume-7, Issue-1, January-February 2017 International Journal of Engineering and Management Research Page Number: 279-283 Morphometric Analysis of s, Mysuru, India Using Geographical Information System
Blocks Module Content Guide
 Blocks Module Content Guide This guide covers the basics of the content within the Interactive 3D Geologic Blocks Module. The content guide is intended to assist you, the teacher, in creating effective
Stratigraphic Cross-Section
 Stratigraphic cross-sections are used to show stratigraphic relationships of strata along some path. They differ from structural cross-sections in three ways. First, their goals differ. Stratigraphic cross-sections
Detour West Gold Project Technical Overview. April, 2018
 Detour West Gold Project Technical Overview April, 2018 Detour West Project Overview Detour West is a 7,680 hectare property located at the northwest margin of the Abitibi Greenstone Belt, 20 km west of