Gravity Support for Hydrocarbon Exploration at the Prospect Level
|
|
|
- Aldous Robertson
- 5 years ago
- Views:
Transcription
1 Journal of Emerging Trends in Engineering and Applied Sciences (JETEAS) 2 (1): 1-6 Scholarlink Research Institute Journals, 2011 (ISSN: ) jeteas.scholarlinkresearch.org Journal of Emerging Trends in Engineering and Applied Sciences (JETEAS) 2 (1): 1-6 (ISSN: ) Gravity Support for Hydrocarbon Exploration at the Prospect Level 1 B. S. Badmus, 1. K. Sotona and 2 Krieger, M 1 Department of Physics, University of Agriculture, Abeokuta, Nigeria 2 Terrays Geophysics, GmbH and Co., KG Hamburg, Germany. Corresponding Author: B. S. Badmus Abstract Exploration sites with complex geophysical structures like salt bodies, significant to hydrocarbon exploration are difficult in seismic interpretation to delineate. An integrated approach using land gravity information with integrated seismic horizons in building a model for these complex structures via a 3-D gravity forward modelling was used. The acquired Bouguer gravity data was filtered using low, high and band pass filter, removing regional trends and high frequency anomalies. First horizontal derivatives and second vertical derivative maps were obtained from the Bouguer gravity, revealing the pattern of faulting and enhance nearsurface features. A 3-D body was created and modelled with seismic horizons as constraint until the calculated gravity effects of the model match the observed gravity or are deemed close enough. Keywords: bouguer gravity, salt domes, hydrocarbon traps, contour maps and seismic horizons I TRODUCTIO The study of the earth s gravity is a modern application of classical Newtonian physics. The gravity method measures small spatial differences in the gravitational pull of the earth. Traditionally, seismic reflection method is the most effective method for detailed oil and gas exploration but can only image flat layered geometry. In the case of complex geometrical geologic area where there are complex features like salt domes, it will be difficult for seismic method to image and interpret around the feature as well as predicting the geologic features below the salt. The crystalline structure of salt makes the reflection of seismic waves to be irregular and inconsistence in this area. It is difficult and sometimes impossible to interpret these seismic reflections. The salt body is always a problem in seismic method for hydrocarbon exploration. Shadow zone are usually formed by seismic method below the salt and this poor illumination makes it sometimes difficult to image the potential hydrocarbon traps. In such cases, a potential field method for joint interpretation is required. The integrated geophysical interpretation approach is the use of several geophysical techniques in the same area. This is important because the exploration geophysicist selecting suitable different methods obtain much more information. Gravity method which is more preferable was used for integrated interpretation coupled with the seismic data, since magnetic data interpretation is theoretically more complex because of the dipolar nature, latitude and longitude dependent nature of the induced magnetic response for a given body as well as rapid magnetic field changes in space. Gravity measurements are simple and moderate source of information about the subsurface of an exploration target. 1 Gravity information has for several decades, been successfully used in the Gulf of Mexico to address the problem of defining the salt/sediment boundary, where the best quality 3-D seismic data task cannot meet the challenges (Nafe and Drake 1957, Bain et al 1993). Gravity fields at the Earth s surface contain anomalies from sources of various size and depth. To interpret these fields, it is desirable to separate anomalies caused by certain features from anomalies caused by others. Salt diapirs play an important role in hydrocarbon development and are significant for petroleum exploration in highly matured areas. Salt domes are emplaced when buried salt layer, because of its low density and ability to flow, rises through over laying denser strata in a series of approximately cylindrical bodies. Locating the base of a salt body is difficult with seismic reflection data. Gravity data in combination with seismic reflection data can be used to give joint interpretation. The relatively low density of salt with respect to its surrounding renders the salt dome a zone of anomalously low mass. Gravity surveys provide a powerful method for the location of features of this type because it shows strong regional effect and regional gradient because of the low gravity effect of the salt compare to the surrounding sedimentary rocks. Analysis and interpretation of this kind of geological structure generally requires a 3-D structural model. There are numerous contributions in the literature in which the gravity method has been used to support hydrocarbon exploration. Wallace, 1970 addresses the difficulties of determining the shape and storage capacity of basins by combining gravimetric and seismic refraction interpretations to avoid drilling, which can be expensive and difficult because of the depth of alluvium and the large areas involved. The
2 result showed that the gravity-seismic method of basin analysis provides useful numerical data in arriving at a ground water storage capacity estimate. And the basin configuration can be obtained from profiles taken across the gravity contour map and also the average depth to basement is noted from the gravity profiles. The total volume of alluvium can then be established from this depth and the surface area. Wallace, 1970 concluded that the gravityseismic method of estimating storage capacity in deep alluvium is best adapted to regional surveys. Shin ya Onizawa et al., 2002, formulated a method for simultaneous velocity and density inversion using travel times of local earthquakes and gravity data to investigate the subsurface structure of Izu-Oshima volcano. In order to constrain the velocity inversion and increase the spatial resolution of shallow velocity structures, additional gravity data was introduced. Gravity data contributes to the P-wave and S-wave velocity models by imposing constraints between seismic velocities and density. Huston et al, 2004 used gravity data in conjunction with prestack depth migration of the seismic data in an iterative way to build a better velocity cube, thereby leading to clearer images of the base of the salt. Henrick et al., 2005, carried out a detailed high-resolution land gravity survey over the southern part of Bolivia in South America, at station intervals of 500m along survey lines spaced 800m apart. The area covered by the gravity data generally extended beyond that of the seismic data sets, and offered the opportunity to extend the structures interpreted solely from the seismic data. With an indication that interesting structures may exist outside the existing seismic data coverage and also that there is sufficient density contrast across the various stratigraphic sections and that more detailed gravity data should add useful structural information where the seismic method is at a disadvantage. The result obtained showed that gravity information generally supports the existing geological model and concepts, but indicated the possibility of prospective areas outside the available seismic data. Helen and Donald, 2007 illustrated how a gravity derived model can be used effectively to assist the construction of a seismic velocity model for depth migration of seismic data collected in a difficult data area where carbonates outcrop at subsurface. The results showed that integrated analysis of the two data sets support a thin skinned deformational model; for the Norman Range with a décollement in Upper Cambrian salt strata of the Saline River Formation. Seismic method usually encounters difficulties in imaging and interpreting complex structures like salt body in hydrocarbon exploration process. As a result of crystalline nature of the salt body, the reflection of seismic waves is irregular and inconsistence. It is difficult and sometimes impossible to interpret these seismic reflections. Shadow zones are usually formed by seismic method below the salt and this poor illumination makes it sometimes difficult to image the potential hydrocarbon traps. All these motivated the idea of integrated approach by using a potential field method with seismic horizon as constraint for joint interpretation and 3-D structural model. LOCATIO OF THE STUDY AREA This study was carried out within Giforn, Northern Germany covering an area in the range of o ~10.48 o E longitude and o ~52.51 o W latitude. METHODOLOGY The objectives of geophysical data interpretation are to locate anomalous material, its depth, dimensions, and properties. Gravity and seismic data were used to study the subsurface geology by developing an integrated interpretation which includes updated transformations of the potential fields, anomalies filtering and 3-D forward gravity modelling with seismic horizons as a constraint. This research work started with gravity measurements covering over an area approximately 29.2km by 22.9km. The gravity data was reduced to complete Bouguer anomaly using a reduction density of 1.90g/cm 3, which is comparable to typical North Germany average crustal density. The Bouguer was gridded to form an evenly spaced data to be able to make a contour map from it. This next step of anomalies separation is very important for the analysis and interpretation of the Bouguer gravity, because the anomalies of interest were superposed on a regional field caused by sources larger than the scale of study or too deep to be of interest. The regional effects correspond to low frequencies or large wavelength while the residual corresponds to high frequency or low wavelength. The separation is easier done in the frequency or wavelength domain rather than in spatial domain. Data from spatial domain was transformed to wavelength domain by fast Fourier transform computer algorithm and Geosoft s Oasis Montaj software. Low pass filter was then used to remove high frequency and small scale spatial detail, so as to smoothen data or enhancing larger weak features. This filter passes longer wavelength and cut out all wavelengths shorter than the cut off wavelengths. High pass filter was used to remove low frequency, large scale spatial detail and also enhances shorter wavelengths and cut out all wavelengths longer than the cut off wavelengths. While band pass filter were created from the low pass filters and high pass filters after choosing the best from the low pass and high pass. These filters are applied to keep or pass only a portion of the wavelength (residual) and remove the rest (regional). The horizontal derivatives of the Bouguer anomaly emphasize changes in the horizontal gradient. This is an alternative way of removing the regional trends in the data and 2
3 providing a view of the overall pattern of faulting. The second vertical derivatives (SVD) of gravity data was applied to attenuate low-frequency signals, enhances high frequency signals usually caused by near-surface sources and separates anomalies horizontally. Gravity model was created to determine the density, depth and geometry of the subsurface bodies. Bouguer gravity, filtered data, and seismic horizons were used as constraint to determine the density, depth and geometry of the subsurface anomaly. Forward modelling technique using 3-D irregularly shaped bodies and seismic horizons to constrain the geometry of the model was performed. A model of the density structure up to depth of 4.9km, produced through a 3-D forward modelling of the Bouguer anomaly was produced. The gravitational field due to the model was calculated and compared to the observed gravity anomalies. The model parameters were changed and re-calculated until the calculated gravity effect of the model match the observed gravity or are deemed close enough. The geomaster s software suite was used to combine the gravity data and the seismic horizons for joint integrated solution for these geological structures. This software put emphasis on integrating various types of information with high diligence on seismic processing. For all application levels of potential field data, the software has the right tools for joint modelling and reliable geological interpretation. Gravity anomaly data, filtered data and seismic horizons were loaded into the geomaster s software, created an initial body and assigned density values to the horizons and the newly formed body. Gravity effects of the horizons and the initial body was calculated and compare to the observed gravity. The shape of this body and the density value of the seismic horizons and that of the body were adjusted until the observed and calculated gravity anomaly are deemed close enough. This structure was positioned at various depths and stationed to the depth that makes the best fit between the calculated and observed anomalies. The entire process was carried out repeatedly until we obtain a model almost having the same gravity effect as the observed gravity and with the lowest standard deviation. RESULTS A D CO CLUSIO S The Bouguer gravity anomalous map comprises of both the regional and residual anomalies from both deep and shallow sources. In this research work, the gravity data in good coverage shows values between and 16.5 mgal. The Bouguer gravity anomaly map displays three main positive anomaly and four main negative anomaly trends. The main negative areas are in the northwest, central, and south-eastern part of the study area. Also the main positive anomaly zones are in the south western part and south southern part of the study area (Fig. 1.0). The gravity values decrease from southern part to the northern direction. The lowest gravity value is at the centre and this shows the presence of a very low density anomaly, which may be due to the presence of a low density sediments probably salt dome. The horizontal derivative map showed that the NW, central, SE and SW parts of the study area have strong horizontal gradient anomalies. The area of the strong horizontal gradient can seen in the North western part area showing short anomalies of NW-SE orientation, and South western part area showing short anomalies of E-W trends. The central part area shows long anomalies of NW-SE strong orientation. The south southern and south eastern parts show short anomalies of NW-SE orientations as shown in figure 3.0. The SVD map emphasizes the expressions of local features and removes the effects of large anomalies or regional influences. The principal usefulness of this enhancement is that the zero value contour lines on the map follows sub-vertical edges of intra-basement blocks or the edges of supra-basement disturbances or faults. The centre of the SVD map indicated an anomaly of very low density compared to the surrounding regional geology and the 0mGal/km 2 contour lines around this feature signifies the boundary between this anomaly of lower density and the surrounding geology (Fig 4.0). The band pass filter showed anomalies at the centre with very low density compared to the surrounding geological trends. These anomalies may be a salt body because the density is relatively much lower than the density of the surrounding area (Fig 2.0). The proposed 3-D model has an internal geometrical consistency; it is compatible with available geophysical data as shown in figures 5.0a-d. The gravity model revealed the occurrence of a relatively low density body at the central part of the site. This deep low density body accounts for intermediate wavelength-negative gravity anomaly observed at the central. The modelled feature reveals a fair cylindricity of a deep structure which exhibits a broad negative anomaly of about -9mGal. The best fit between the calculated and the observed is obtained assuming an uplift of the crystalline body of density 2.15g/cm 3. It can be interpreted as a result of relative uplift of salt dome at the centre of the study area because the density value lies in the range of pure salt density value. The model generated consists of 37 parallel NE-SE planes (Figs. 6.0 & 7.0). The final 3-Ddensity structure shows a very good fit between measured and modelled gravity field (Figs ), and the standard deviation difference of 900µGal (Figs. 8.0 & 9.0). The top of the low density body is at 0.06km depth and the bottom is 3.392km deep. The width of the central uplift at the top is about ~4km, at a depth of ~0.56km; the width is about ~7km at depth of about ~1.56km, while the width is about ~9km and at the bottom is about ~13km. 3


4 Journal of Emerging Trends in Engineering and Applied Sciences (JETEAS) 2 (1): 1-6 (ISSN: ) Nafe, J. E., and C. L. Drake, (1957). Variation with depth in shallow and deep water marine sediments of porosity, density, and the velocity of compressional and shear waves, Geophysics, 22, , 1957 CO CLUSIO This study has demonstrated how 3-D gravity modeling with integrating geophysical and geological information can help to reveal the subsurface structures that are difficult for seismic method in hydrocarbon exploration within area of complex geological setting. The study emphasizes the need of 3-D modeling and gravity integrated interpretation in highly complex geological terrain. The needs of an integrated geological and geophysical approach to improve the understanding of the subsurface structures were revealed. The integrated approach of the gravity and seismic have high reliability in resolution and accuracy, and the model is realistic in the sense that the density, depth and geometry of the subsurface causative body were suggested. The calculated and the observed anomalies are deemed sufficiently alike and a standard deviation of 900µGal was obtained. Shin ya, O., Hitoshi, M., Hidefumi, W and Shikou, S, (2002) A method for simultaneous velocity and density inversion and its application to exploration of subsurface structure beneath Izu-Oshima volcano, Japan. Earth Planets Space, 54, , Wallace D. E. (1970). Estimating storage capacity in deep allunium by gravity-seismic methods. Bulletin of the international association of scientific hydrocology, XV, 2 6/1970 The model also revealed an uplift of a fair cylindrical, deep, crystalline structure of density 2.15g/cm3; which is an average density of salt, at depth between 0.06km and 3.392km. For a research of this kind, where salt dome occurring at the site of hydrocarbon exploration, the integration of gravity with seismic makes a lot of sense as low density body displays a negative anomaly effect best detected by gravity analysis using seismic horizons as a constraint. The integration procedure superflows as the density of the body suggests and also predicts which type of body is present beneath the subsurface via the density information predicted. The 3-D modelling is very useful in complex geologic setting and interpretations of the geological data with a view to have a fore site of what is most is likely to be present in the exploration site, even before any analysis. Figure 1.0: Buguer Gravity Anomaly Map REFERE CES Bain, J.E., Weyand, J., Horscroft, T.R., Saad, A.H., and Bulling, D.N (1993). Complex Salt Features Resolved by Integrating Seismic, Gravity, and Magnetics. EAEG/EAPG 1993 Annual Conference and Exhibition, expanded abstracts. Henrik T. A and Timothy R. B (2005). AMG Mc Phar Integration of seismic and non-seismic methods for hydrocarbon Exploration: a Bolivian case history GEOHORIZONS July 2005/27-29 Helen I. J. and Donald. C. L (2007). Benefit of integrated seismic and gravity exploration. An example from Norman wells NWT. Fold-Fault Research Project, University of Calgary. Figure 2.0: Band pass filter 1-60km Huston, D. C., Huston D. E. and Johnson, E. (2004). Geostatistical integration of velocity cube and log data to constrain 3-D gravity modelling, deepwater Gulf of Mexico: The Leading Edge, 23,


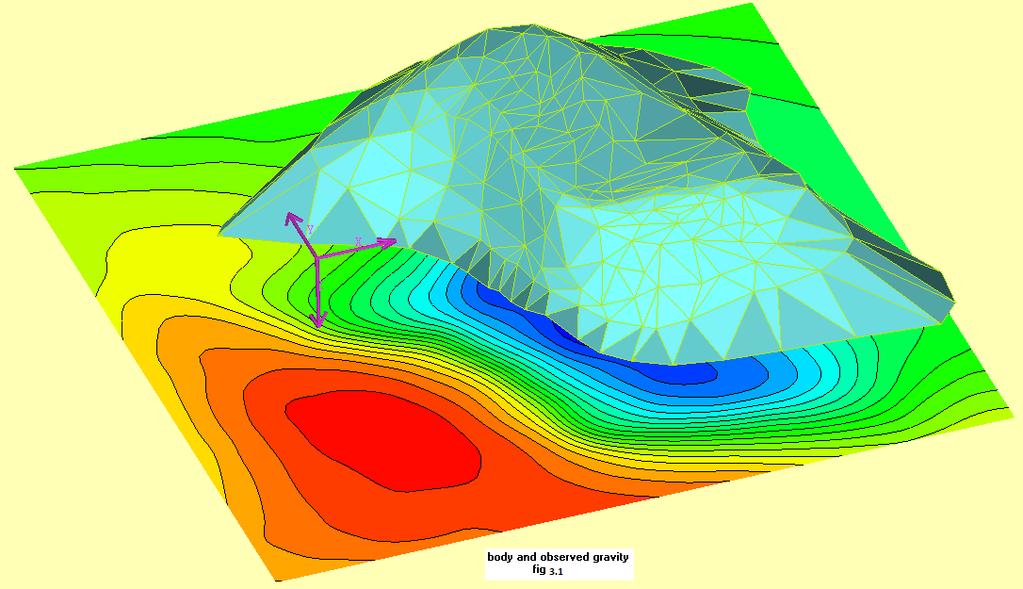
5 Figure 3.0: First Horizontal Derivative Figure 5.0b: Body and Observe Gravity Figure 4.0: Second Vertical Derivative Figure 5.0c: Body and Observe Gravity Figure 5.0a: Body and Observe Gravity Figure 5.0d: Body and Observe Gravity 5


6 Figure 6.0:Calculated Gravity Effect Figure 9.0: The Geomasters window showing the std Dev of the modeled body Figure 7.0: Observed Gravity Effect Figure 8.0: The Geomasters window showing the std Dev of Cubic body 6
The Gulf of Mexico - From Various Vantage Points John E. Bain, Kenton J. Hamilton
 The Gulf of Mexico - From Various Vantage Points John E. Bain, Kenton J. Hamilton Oftentimes in exploration geophysics we tend to focus on specific near-term exploration prospects, as dictated by the current
3D Geometry of the Xade Complex inferred from Gravity and Magnetic Data
 Geophysical Case Histories 3D Geometry of the Xade Complex inferred from Gravity and Magnetic Data 1. British Geological Survey, Edinburgh, United Kingdom Paper 92 Pouliquen, G. [1], Key, R. [1] ABSTRACT
C5 Magnetic exploration methods data analysis techniques
 C5 Magnetic exploration methods data analysis techniques C5.1 Data processing and corrections After magnetic field data have been collected a number of corrections are applied to simplify the interpretation.
Benefits of Integrated Seismic and Gravity Exploration: An example from Norman Wells, NWT
 Benefits of Integrated Seismic and Gravity Exploration: An example from Norman Wells, NWT J. Helen Isaac* and Donald C. Lawton Fold-Fault Research Project, University of Calgary 2500 University Drive NW,
Deep geological structures as revealed by 3D gravity stripping: western part of the Moesian Platform, Romania
 JOURNAL OF BALKAN GEOPHYSICAL SOCIETY, Vol.8, No 3, August 2005, p.129-138 Deep geological structures as revealed by 3D gravity stripping: western part of the Moesian Platform, Romania D. Ioane*, C. Calota*,
Airborne gravity gradiometer surveying of petroleum systems under Lake Tanganyika, Tanzania
 Airborne gravity gradiometer surveying of petroleum systems under Lake Tanganyika, Tanzania D. Roberts Beach Energy P. Roy Chowdhury CGG S. J. Lowe CGG A. N. Christensen CGG Outline Introduction Geology
Potential Field investigation of Williston Basin Basement
 Potential Field investigation of Williston Basin Basement Jiakang Li* and Igor Morozov, University of Saskatchewan, Canada Summary Major faults and domains are identified in the Precambrian basement of
Integrated Interpretation of Gravity, Magnetic & Seismic data for delineation of Basement Configuration in Sadiya Block, Upper Assam, India
 P-225 Integrated Interpretation of Gravity, Magnetic & Seismic data for delineation of Basement Summary G.K.Ghosh *, S.K.Basha, V.K. Kulshreshth Gravity and magnetic data were collected jointly by National
PETROLEUM GEOSCIENCES GEOLOGY OR GEOPHYSICS MAJOR
 PETROLEUM GEOSCIENCES GEOLOGY OR GEOPHYSICS MAJOR APPLIED GRADUATE STUDIES Geology Geophysics GEO1 Introduction to the petroleum geosciences GEO2 Seismic methods GEO3 Multi-scale geological analysis GEO4
Mapping Magnetic Lineaments in the Foothills of Northeastern British Columbia using 2-D Wavelet Transform
 Mapping Magnetic Lineaments in the Foothills of Northeastern British Columbia using 2-D Wavelet Transform Hassan Hassan* GEDCO, Calgary, Alberta, Canada hassan@gedco.com Abstract Summary This work describes
Available online Journal of Scientific and Engineering Research, 2016, 3(2):1-7. Research Article
:1-7. Research Article") Available online www.jsaer.com, 2016, 3(2):1-7 Research Article ISSN: 2394-2630 CODEN(USA): JSERBR Assessment of the Reliability of Magnetic Method to Delineate Geologic Features in a Basement Complex:
Available online www.jsaer.com, 2016, 3(2):1-7 Research Article ISSN: 2394-2630 CODEN(USA): JSERBR Assessment of the Reliability of Magnetic Method to Delineate Geologic Features in a Basement Complex:
Improved image aids interpretation: A case history
 Ye Zheng, Scott Cheadle (Veritas GeoServices, Calgary, Canada) Glenn M. Rising (Perez Companc Norcen Corod, Venezuela) SUMMARY The Oritupano-Leona 3D of Eastern Venezuela was originally acquired and processed
APPENDIX C GEOLOGICAL CHANCE OF SUCCESS RYDER SCOTT COMPANY PETROLEUM CONSULTANTS
 APPENDIX C GEOLOGICAL CHANCE OF SUCCESS Page 2 The Geological Chance of Success is intended to evaluate the probability that a functioning petroleum system is in place for each prospective reservoir. The
PART A: Short-answer questions (50%; each worth 2%)
") PART A: Short-answer questions (50%; each worth 2%) Your answers should be brief (just a few words) and may be written on these pages if you wish. Remember to hand these pages in with your other exam pages!
PART A: Short-answer questions (50%; each worth 2%) Your answers should be brief (just a few words) and may be written on these pages if you wish. Remember to hand these pages in with your other exam pages!
Petroleum Exploration
 Petroleum Exploration Upstream Petroleum Exploration The role of exploration is to provide the information required to exploit the best opportunities presented in the choice of areas, and to manage research
Improved Exploration, Appraisal and Production Monitoring with Multi-Transient EM Solutions
 Improved Exploration, Appraisal and Production Monitoring with Multi-Transient EM Solutions Folke Engelmark* PGS Multi-Transient EM, Asia-Pacific, Singapore folke.engelmark@pgs.com Summary Successful as
Multiattributes and Seismic Interpretation of Offshore Exploratory Block in Bahrain A Case Study
 Multiattributes and Seismic Interpretation of Offshore Exploratory Block in Bahrain A Case Study Suresh Thampi, Aqeel Ahmed, Yahya Al-Ansari, Ali Shehab, Ahmed Fateh, Anindya Ghosh, Ghada Almoulani. The
B033 Improving Subsalt Imaging by Incorporating MT Data in a 3D Earth Model Building Workflow - A Case Study in Gulf of Mexico
 B033 Improving Subsalt Imaging by Incorporating MT Data in a 3D Earth Model Building Workflow - A Case Study in Gulf of Mexico E. Medina* (WesternGeco), A. Lovatini (WesternGeco), F. Golfré Andreasi (WesternGeco),
Vertical Hydrocarbon Migration at the Nigerian Continental Slope: Applications of Seismic Mapping Techniques.
 ROAR HEGGLAND, Statoil ASA, N-4035 Stavanger, Norway Vertical Hydrocarbon Migration at the Nigerian Continental Slope: Applications of Seismic Mapping Techniques. Summary By the use of 3D seismic data,
INTEGRATED GEOPHYSICAL INTERPRETATION METHODS FOR HYDROCARBON EXPLORATION
 INTEGRATED GEOPHYSICAL INTERPRETATION METHODS FOR HYDROCARBON EXPLORATION Instructor : Kumar Ramachandran 31 July 4 August 2017 Jakarta COURSE OUTLINE The course is aimed at imparting working knowledge
Horizontal gradient and band-pass filter of aeromagnetic data image the subsurface structure; Example from Esh El Mellaha Area, Gulf of Suez, Egypt.
 Horizontal gradient and band-pass filter of aeromagnetic data image the subsurface structure; Example from Esh El Mellaha Area, Gulf of Suez, Egypt. Essam Aboud 1, Serguei Goussev 2, Hassan Hassan 2, Suparno
Depth to basement analysis from gravity field over the Guelb Ahmer horst (Ghadames petroleum province, Southern Tunisia, North Africa)
") IOSR Journal of Applied Geology and Geophysics (IOSR-JAGG) e-issn: 2321 0990, p-issn: 2321 0982.Volume 2, Issue 5 (Jul-Aug. 2014), PP 122-127 Depth to basement analysis from gravity field over the Guelb
IOSR Journal of Applied Geology and Geophysics (IOSR-JAGG) e-issn: 2321 0990, p-issn: 2321 0982.Volume 2, Issue 5 (Jul-Aug. 2014), PP 122-127 Depth to basement analysis from gravity field over the Guelb
SEDIMENTARY BASINS Red Sea Coast of Egypt. by Prof. Dr. Abbas Mansour
 SEDIMENTARY BASINS Red Sea Coast of Egypt by Prof. Dr. Abbas Mansour Sedimentary basins Sedimentary basins are, in a very broad sense, all those areas in which sediments can accumulate to considerable
We A Multi-Measurement Integration Case Study from West Loppa Area in the Barents Sea
 We-16-12 A Multi-Measurement ntegration Case Study from West Loppa Area in the Barents Sea. Guerra* (WesternGeco), F. Ceci (WesternGeco), A. Lovatini (WesternGeco), F. Miotti (WesternGeco), G. Milne (WesternGeco),
6162 Upper Rhine Graben: 3D Seismic - A New Approach to Geothermal Exploration in a Structurally Complex Tectonic Enviroment
 6162 Upper Rhine Graben: 3D Seismic - A New Approach to Geothermal Exploration in a Structurally Complex Tectonic Enviroment C. G. Eichkitz* (Joanneum Research), M.G. Schreilechner (Joanneum Research),
We A10 12 Common Reflection Angle Migration Revealing the Complex Deformation Structure beneath Forearc Basin in the Nankai Trough
 We A10 12 Common Reflection Angle Migration Revealing the Complex Deformation Structure beneath Forearc Basin in the Nankai Trough K. Shiraishi* (JAMSTEC), M. Robb (Emerson Paradigm), K. Hosgood (Emerson
FUNDAMENTALS OF SEISMIC EXPLORATION FOR HYDROCARBON
 FUNDAMENTALS OF SEISMIC EXPLORATION FOR HYDROCARBON Instructor : Kumar Ramachandran 10 14 July 2017 Jakarta The course is aimed at teaching the physical concepts involved in the application of seismic
P105 Particularities of Astrakhan Gas Field Deep Structure Resulting from Microseismic Sounding Technique Application
 P105 Particularities of Astrakhan Gas Field Deep Structure Resulting from Microseismic Sounding Technique Application A.V. Gorbatikov* (Institute of Physics of the Earth, Rus.Acad.Sci.), M.Y. Stepanova
QUALITATIVE INTERPRETATION OF POTENTIAL FIELD PROFILES: SOUTHERN NECHAKO BASIN
 QUALITATIVE INTERPRETATION OF POTENTIAL FIELD PROFILES: SOUTHERN NECHAKO BASIN By Melvyn E. Best Bemex Consulting International 5288 Cordova Bay Road Victoria, B.C. V8Y 2L4 KEYWORDS: potential fields,
TOM 2.6. SEG/Houston 2005 Annual Meeting 2581
 Oz Yilmaz* and Jie Zhang, GeoTomo LLC, Houston, Texas; and Yan Shixin, PetroChina, Beijing, China Summary PetroChina conducted a multichannel large-offset 2-D seismic survey in the Yumen Oil Field, Northwest
Summary. Introduction
 Detailed velocity model building in a carbonate karst zone and improving sub-karst images in the Gulf of Mexico Jun Cai*, Hao Xun, Li Li, Yang He, Zhiming Li, Shuqian Dong, Manhong Guo and Bin Wang, TGS
FAULT SLICING IN THE INTERPRETATION OF FAULTS IN SEISMIC DATA PROC- ESSING IN ATALA PROSPECT OF RIVER STATE, NIGERIA
 FAULT SLICING IN THE INTERPRETATION OF FAULTS IN SEISMIC DATA PROC- ESSING IN ATALA PROSPECT OF RIVER STATE, NIGERIA Egbai, J.C. Department of Physics, Delta State University, Abraka ABSTRACT e-mail: jamesegbai@yahoo.com
Constrained Fault Construction
 Constrained Fault Construction Providing realistic interpretations of faults is critical in hydrocarbon and mineral exploration. Faults can act as conduits or barriers to subsurface fluid migration and
Depth and shape solutions from residual gravity anomalies due to simple geometric structures using a statistical approach
 Contributions to Geophysics and Geodesy Vol. 47/2, 2017 (113 132) Depth and shape solutions from residual gravity anomalies due to simple geometric structures using a statistical approach El-Sayed ABDELRAHMAN,
Depth Imaging through Surface Carbonates: A 2D example from the Canadian Rocky Mountains
 Depth Imaging through Surface Carbonates: A 2D example from the Canadian Rocky Mountains Yong Hua* University of Calgary, Calgary, AB yhua@ucalgary.ca and Don Lawton University of Calgary, Calgary, AB,
Blind fault Configuration in Osaka, Japan based on 2D gravity inversion
 Blind fault Configuration in Osaka, Japan based on 2D gravity inversion N. Inoue & N. Kitada Geo-research Institute, Osaka, Japan K. Takemura Institute for Geothermal Sciences, Kyoto University, Beppu,
Petroleum geology framework, West Coast offshore region
 Petroleum geology framework, West Coast offshore region James W. Haggart* Geological Survey of Canada, Vancouver, BC jhaggart@nrcan.gc.ca James R. Dietrich Geological Survey of Canada, Calgary, AB and
Use of Geostatistically-constrained Potential Field Inversion and Downhole Drilling to Predict Distribution of Sulphide and Uranium Mineralisation
 Use of Geostatistically-constrained Potential Field Inversion and Downhole Drilling to Predict Distribution of Sulphide and Uranium Mineralisation Matthew Zengerer Talk Outline Introduction Purpose and
MUHAMMAD S TAMANNAI, DOUGLAS WINSTONE, IAN DEIGHTON & PETER CONN, TGS Nopec Geological Products and Services, London, United Kingdom
 Geological and Geophysical Evaluation of Offshore Morondava Frontier Basin based on Satellite Gravity, Well and regional 2D Seismic Data Interpretation MUHAMMAD S TAMANNAI, DOUGLAS WINSTONE, IAN DEIGHTON
Darnley Bay Resources Preliminary Airborne Survey Results
 4 King Street West, Suite 1103 Toronto, Ontario M5H 1B6, Canada Tel:(416) 862-7885 Fax:(416) 862-7889 dbr@darnleybay.com UPDATE Trading Symbol: DBL. TSX Venture Exchange April 19, 2010 Darnley Bay Resources
Bulletin of Earth Sciences of Thailand. Evaluation of the Petroleum Systems in the Lanta-Similan Area, Northern Pattani Basin, Gulf of Thailand
 Evaluation of the Petroleum Systems in the Lanta-Similan Area, Northern Pattani Basin, Gulf of Thailand Sirajum Munira Petroleum Geoscience Program, Department of Geology, Faculty of Science, Chulalongkorn
Feasibility and design study of a multicomponent seismic survey: Upper Assam Basin
 P-276 Summary Feasibility and design study of a multicomponent seismic survey: Upper Assam Basin K.L.Mandal*, R.K.Srivastava, S.Saha, Oil India Limited M.K.Sukla, Indian Institute of Technology, Kharagpur
LEBANON. neobasin Program
 LEBANON neobasin Program SURVEY COMPLETE: DATA AVAILABLE FOR LICENSE Over 6,000 square kilometers of airborne acquired, multi-physics data providing basement-to-surface insights of Lebanon s underexplored
Assessing our untapped energy resources. Derek Reay Geological Survey of Northern Ireland
 Assessing our untapped energy resources Derek Reay Geological Survey of Northern Ireland Talk Outline Northern Ireland energy market Oil and Gas Exploration Description Exploration risks Application of
Groundwater Assessment in Apapa Coast-Line Area of Lagos Using Electrical Resistivity Method
 Journal of Emerging Trends in Engineering and Applied Sciences (JETEAS) 2 (4): 673-679 Scholarlink Research Institute Journals, 2011 (ISSN: 2141-7016) jeteas.scholarlinkresearch.org Groundwater Assessment
Geological Mapping using Geophysics
 Geological Mapping using Geophysics Pugin, A.J.M. and T.H. Larson Illinois State Geological Survey, 615 E Peabody Dr., Champaign, IL 61820; E-mail: A.J.M. Pugin at pugin@isgs.uiuc.edu Mapping Techniques.
Global geophysics and wave propagation
 Global geophysics and wave propagation Reading: Fowler p76 83 Remote sensing Geophysical methods Seismology Gravity and bathymetry Magnetics Heat flow Seismology: Directly samples the physical properties
Aeromagnetic Data Interpretation for Geostructural Analysis of Ibadan, Southwestern Nigeria
 Aeromagnetic Data Interpretation for Geostructural Analysis of Ibadan, Southwestern Nigeria 1 Sunmonu, L.A., 2* Olasunkanmi, N. K. and 3 Alagbe, O. A. 1 Pure and Applied Physics Department, Ladoke Akintola
Euler Deconvolution JAGST Vol. 15(1) 2013
 2013") Euler Deconvolution JAGST Vol. 15(1) 2013 2D-EULER DECONVOLUTION AND FORWARD MODELING OF GRAVITY DATA OF HOMA-HILLS GEOTHERMAL PROSPECT, KENYA A. Odek 1, A. B. Otieno 1, W. J. Ambusso 1 and J. G. Githiri
Euler Deconvolution JAGST Vol. 15(1) 2013 2D-EULER DECONVOLUTION AND FORWARD MODELING OF GRAVITY DATA OF HOMA-HILLS GEOTHERMAL PROSPECT, KENYA A. Odek 1, A. B. Otieno 1, W. J. Ambusso 1 and J. G. Githiri
The 2nd South Asain Geoscience Conference and Exhibition,GEOIndia2011, 12-14th Jan,2011,Gearter Noida,New Delhi,India
 Summary Jaisalmer basin of western Rajasthan: a gravity perspective K. Arora, K. Suman, M.M. Dixit and D. Sarkar The sedimentary basins of western Rajasthan constitute a part of the shelf zone of the Indus
Improved Interpretability via Dual-sensor Towed Streamer 3D Seismic - A Case Study from East China Sea
 Improved Interpretability via Dual-sensor Towed Streamer 3D Seismic - A Case Study from East China Sea S. Rongfu (CNOOC Shanghai), C. Hua (CNOOC Shanghai), W. Yun (CNOOC Shanghai), Z. Yabin (CNOOC Shanghai),
Gravity Data Analysis and Modelling for Basin Sedimen of Eastern Java Blocks
 Journal of Physics: Conference Series PAPER OPEN ACCESS Gravity Data Analysis and Modelling for Basin Sedimen of Eastern Java Blocks To cite this article: Luthfia Khoirunnia 2016 J. Phys.: Conf. Ser. 776
Distortion Effects of Faults on Gravity Worm Strings Robin O Leary
 Distortion Effects of Faults on Gravity Worm Strings Robin O Leary Problem Can upward continued gravity anomaly worm strings be used as a tool to determine the dip direction of an offsetting structure
Structural Style in the Peel Region, NWT and Yukon
 Structural Style in the Peel Region, NWT and Yukon Adriana Taborda* Husky Energy and University of Calgary, Calgary, AB Adriana.Taborda@huskyenergy.ca and Deborah Spratt University of Calgary, Calgary,
OZ SEEBASE TM. Datasets. Digital Elevation Model
 Digital Elevation Model 10 Digital Elevation Models (DEM s) often show the youngest structures, and any active geological structures. They are widely used for neotectonic analysis. The composition of eroding
Euler Deconvolution Technique for Gravity Survey
 Journal of Applied Sciences Research, 6(11): 1891-1897, 2010 2010, INSInet Publication Euler Deconvolution Technique for Gravity Survey 12,3 Piyaphong Chenrai, 2 Jayson Meyers, 1,4 Punya Charusiri 1 Earthquake
Integrated Geophysical Interpretation On The Groundwater Aquifer (At The North Western Part of Sinai, Egypt)
") Integrated Geophysical Interpretation On The Groundwater Aquifer (At The North Western Part of Sinai, Egypt) Sultan Awad Sultan Araffa 1, Hassan S. Sabet 2, Ahmed M, Al Dabour 3 1 National Research Institute
Integrated Geophysical Interpretation On The Groundwater Aquifer (At The North Western Part of Sinai, Egypt) Sultan Awad Sultan Araffa 1, Hassan S. Sabet 2, Ahmed M, Al Dabour 3 1 National Research Institute
Geohazards have a direct impact on the drilling and
 SPECIAL Geohazards SECTION: G e o h a z a r d s A new, fully integrated method for seismic geohazard prediction ahead of the bit while drilling CENGIZ ESMERSOY, ARTURO RAMIREZ, SHARON TEEBENNY, YANGJUN
3D Converted Wave Data Processing A case history
 P-290 3D Converted Wave Data Processing A case history N. B. R. Prasad, ONGC Summary In recent years, there has been a growing interest in shear- wave exploration for hydrocarbons as it facilitates to
Overview of geophysical methods used in geophysical exploration
 Overview of geophysical methods used in geophysical exploration Lúdvík S. Georgsson United Nations University Geothermal Training Programme Orkustofnun Reykjavík ICELAND The role of the geophysicist Measuring
Colombia s Offshore*
 PS A Seismic-Structural Interpretation, on the Identification of Possible Causes in the Formation of Gas Chimneys in Colombia s Offshore* Tatiana Mayorga 1, Andrés E. Calle 2, Freddy M. Niño 2, Jorge Rubiano
Repeatability in geophysical data processing: A case study of seismic refraction tomography.
 Available online at www.scholarsresearchlibrary.com Archives of Applied Science Research, 2012, 4 (5):1915-1922 (http://scholarsresearchlibrary.com/archive.html) ISSN 0975-508X CODEN (USA) AASRC9 Repeatability
Topic 5: The Dynamic Crust (workbook p ) Evidence that Earth s crust has shifted and changed in both the past and the present is shown by:
 Evidence that Earth s crust has shifted and changed in both the past and the present is shown by:") Topic 5: The Dynamic Crust (workbook p. 65-85) Evidence that Earth s crust has shifted and changed in both the past and the present is shown by: --sedimentary horizontal rock layers (strata) are found
Topic 5: The Dynamic Crust (workbook p. 65-85) Evidence that Earth s crust has shifted and changed in both the past and the present is shown by: --sedimentary horizontal rock layers (strata) are found
We Improved Salt Body Delineation Using a new Structure Extraction Workflow
 We-08-08 Improved Salt Body Delineation Using a new Structure Extraction Workflow A. Laake* (WesternGeco) SUMMARY Current salt imaging workflows require thorough geological understanding in the selection
Petroleum Potential of the Application Area L12-4
 Petroleum Potential of the Application Area L12-4 The Application Area (L12-4) is underlain by the western Officer Basin, beneath the Gunbarrel Basin. The general basin architecture is outlined in Figure
Using structural validation and balancing tools to aid interpretation
 Using structural validation and balancing tools to aid interpretation Creating a balanced interpretation is the first step in reducing the uncertainty in your geological model. Balancing is based on the
stress direction are less stable during both drilling and production stages (Zhang et al., 2006). Summary
. Summary") Inversion and attribute-assisted hydraulically-induced microseismic fracture prediction: A North Texas Barnett Shale case study Xavier E. Refunjol *, Katie M. Keranen, and Kurt J. Marfurt, The University
Inversion and attribute-assisted hydraulically-induced microseismic fracture prediction: A North Texas Barnett Shale case study Xavier E. Refunjol *, Katie M. Keranen, and Kurt J. Marfurt, The University
(Brown & Loucks, 2009)
") SECARB Phase 3, Task 15 Geological CO 2 Sequestration Capacity Estimate Offshore Northern Gulf of Mexico March 9, 2011 Prepared by David L. Carr Project Team: Cari Breton, GIS Analyst David L. Carr, Reservoir
SECARB Phase 3, Task 15 Geological CO 2 Sequestration Capacity Estimate Offshore Northern Gulf of Mexico March 9, 2011 Prepared by David L. Carr Project Team: Cari Breton, GIS Analyst David L. Carr, Reservoir
Contribution Of Potential Field Data In Delineating The Structural-Tectonic Set-Up Of The Eastern Qattara Depression Area, Western Desert, Egypt.
 Australian Journal of Basic and Applied Sciences, 6(3): 204-223, 2012 ISSN 1991-8178 Contribution Of Potential Field Data In Delineating The Structural-Tectonic Set-Up Of The Eastern Qattara Depression
Iterative 3D gravity inversion with integration of seismologic data
 BOLLETTINO DI GEOFISICA TEORICA ED APPLICATA VOL. 40, N. 3-4, pp. 469-475; SEP.-DEC. 1999 Iterative 3D gravity inversion with integration of seismologic data C. BRAITENBERG and M. ZADRO Department of Earth
Integration of Seismic and Seismological Data Interpretation for Subsurface Structure Identification
 Integration of Seismic and Seismological Data Interpretation for Subsurface Structure Identification Iftikhar Ahmed Satti, and Wan Ismail Wan Yusoff Abstract The structural interpretation of a part of
Static Corrections for Seismic Reflection Surveys
 Static Corrections for Seismic Reflection Surveys MIKE COX Volume Editors: Series Editor: Eugene F. Scherrer Roland Chen Eugene F. Scherrer Society of Exploration Geophysicists Tulsa, Oklahoma Contents
Answers: Internal Processes and Structures (Isostasy)
") Answers: Internal Processes and Structures (Isostasy) 1. Analyse the adjustment of the crust to changes in loads associated with volcanism, mountain building, erosion, and glaciation by using the concept
Answers: Internal Processes and Structures (Isostasy) 1. Analyse the adjustment of the crust to changes in loads associated with volcanism, mountain building, erosion, and glaciation by using the concept
A.K. Khanna*, A.K. Verma, R.Dasgupta, & B.R.Bharali, Oil India Limited, Duliajan.
 P-92 Application of Spectral Decomposition for identification of Channel Sand Body in OIL s operational area in Upper Assam Shelf Basin, India - A Case study A.K. Khanna*, A.K. Verma, R.Dasgupta, & B.R.Bharali,
Summary. (a) (b) Introduction
 (b) Introduction") er well in AC 818, Gulf of Mexico Cam Kanhalangsy, Nick Golubev, Jurgen Johann Zach, Daniel Baltar*, EMGS Americas Summary We present anisotropic 2.5D inversion examples illustrating the possibility to
er well in AC 818, Gulf of Mexico Cam Kanhalangsy, Nick Golubev, Jurgen Johann Zach, Daniel Baltar*, EMGS Americas Summary We present anisotropic 2.5D inversion examples illustrating the possibility to
A Perspective on a Three Dimensional Framework for Canadian Geology
 A Perspective on a Three Dimensional Framework for Canadian Geology H.A.J. Russell, B. Brodaric, G. Keller, K.E. McCormack, D.B. Snyder, and M.R. St-Onge GSA Vancouver, 2014 Author Affiliations H.A.J.
Near-Surface Correction on Seismic and Gravity Data
 Journal of Earth Science, Vol. 26, No. 6, p. 851 857, December 2015 ISSN 1674-487X Printed in China DOI: 10.1007/s12583-015-0546-7 Near-Surface Correction on Seismic and Gravity Data S. Bychkov*, I. Y.
Full-waveform inversion application in different geological settings Denes Vigh*, Jerry Kapoor and Hongyan Li, WesternGeco
 Full-waveform inversion application in different geological settings Denes Vigh*, Jerry Kapoor and Hongyan Li, WesternGeco Summary After the synthetic data inversion examples, real 3D data sets have been
Downloaded 05/01/17 to Redistribution subject to SEG license or copyright; see Terms of Use at
 Mapping Imbricate Structures in the Thrust Belt of Southeast Turkey by Large-Offset Seismic Survey Oz Yilmaz*, Anatolian Geophysical, Istanbul, Turkey; and Serdar Uygun, Ali Ölmez, and Emel Çalı, Turkish
Summary. Study Area. Data Acquisition
 Evidence for hyper-extended continental crust in the East Orphan Basin from seismic reflection data and potential field forward modelling and inversion J. Kim Welford 1, Deric Cameron 2, James Carter 2
Determination of Subsurface Bulk Density Distribution for Geotechnical Investigation using Gravity Technique
 Journal of Earth Sciences and Geotechnical Engineering, vol. 7, no.2, 2017, 63-69 ISSN: 1792-9040 (print), 1792-9660 (online) Scienpress Ltd, 2017 Determination of Subsurface Bulk Density Distribution
Potential field migration for rapid interpretation of gravity gradiometry data
 Potential field migration for rapid interpretation of gravity gradiometry data M. S. Zhdanov 1,2, X. Liu 1 and G. Wilson 2 1 The University of Utah, 2 TechnoImaging Summary We introduce potential field
Velocity Update Using High Resolution Tomography in Santos Basin, Brazil Lingli Hu and Jianhang Zhou, CGGVeritas
 Lingli Hu and Jianhang Zhou, CGGVeritas Summary The exploration interest in the Santos Basin offshore Brazil has increased with the large deep water pre-salt discoveries, such as Tupi and Jupiter. As the
Determination of Geothermal Gradient in the Eastern Niger Delta Sedimentary Basin from Bottom Hole Temperatures
 Journal of Earth Sciences and Geotechnical Engineering, vol. 4, no. 3, 2014, 109-114 ISSN: 1792-9040 (print), 1792-9660 (online) Scienpress Ltd, 2014 Determination of Geothermal Gradient in the Eastern
Summary. 2D potential field migration of gravity fields and their gradients. For a 2D gravity field, we can define the complex intensity:
 Michael S. Zhdanov*, The University of Utah and TechnoImaging, Xiaojun Liu, The University of Utah, and Glenn A. Wilson, TechnoImaging Summary We introduce 2D potential field migration for the interpretation
RELINQUISHMENT REPORT. License P1546 Block April 2009
 RELINQUISHMENT REPORT License P1546 Block 110-01 14 April 2009 Sherritt International Oil and Gas Limited 2000, 425-1 st street S.W., Calgary, Alberta Canada T2P 3L8 Telephone (403) 260-2900 Fax (403)
Pre Stack Imaging To Delineate A New Hydrocarbon Play A Case History
 5th Conference & Exposition on Petroleum Geophysics, Hyderabad-2004, India PP 375-379 Pre Stack Imaging To Delineate A New Hydrocarbon Play A Case History D. Srinivas, T.R. Murali Mohan, Ashwani Lamba,
Keywords. CSEM, Inversion, Resistivity, Kutei Basin, Makassar Strait
 Noor Jehan Ashaari Muhamad* (EMGS Asia Pacific), Ritesh Mohan Joshi (EMGS Asia Pacific), Muhamad Afifie Chan Mahadie Chan (EMGS Asia Pacific) mmuhamad@emgs.com Keywords CSEM, Inversion, Resistivity, Kutei
Eighty five degree east ridge & its hydrocarbon potential D. Sar, M.K. Maheshwari, S. Rangarajan and C. S. Bahuguna Geophysics Division, KDMIPE
 Eighty five degree east ridge & its hydrocarbon potential D. Sar, M.K. Maheshwari, S. Rangarajan and C. S. Bahuguna Geophysics Division, KDMIPE Bay of Bengal is characterized by two major ridges, one approximately
The 2D/3D i-stats Workflow for Image-Based Near-Surface Modeling for Statics Corrections
 The 2D/3D i-stats Workflow for Image-Based Near-Surface Modeling for Statics Corrections Öz Yilmaz CTO, GeoTomo LLC With the i-stats workflow, you no longer need first-break picking as for traveltime tomography,
Introducti on. Land Survey. Geomagnetic Survey. Geomagnetic Results and Interpretati ons - Conclusions and Recommendations C
 m M 42A86SW8281 63.42 PRICE 010 C O H T E H l 42A86SW828I 63.42 PRICE 010C Introducti on Land Survey Geomagnetic Survey Geomagnetic Results and Interpretati ons - Conclusions and Recommendations - - -
2) First Order Resistivity Effects. The first order effects discussed above in the main reflect vertical resistivity features. (1) Surficial Zone (R3)
 First Order Resistivity Effects. The first order effects discussed above in the main reflect vertical resistivity features. (1) Surficial Zone (R3)") The first and second order effects represent clear and obvious features in the data, while the third order effects are subtle, appearing real and consistent, but on the limit of interpretability. A number
The first and second order effects represent clear and obvious features in the data, while the third order effects are subtle, appearing real and consistent, but on the limit of interpretability. A number
Petroleum Prospectivity in the Namibe and Southern Benguela Basins, Offshore Angola
 Petroleum Prospectivity in the Namibe and Southern Benguela Basins, Offshore Angola C. Koch* (PGS), F. Pepe (PGS), R. Vasconcelos (PGS), F. Mathew (PGS), R. Borsato (PGS) & M.P.C. de Sá (Sonangol) SUMMARY
Seismic Reflection Imaging across the Johnson Ranch, Valley County, Idaho
 Seismic Reflection Imaging across the Johnson Ranch, Valley County, Idaho Report Prepared for the Skyline Corporation Lee M. Liberty Center for Geophysical Investigation of the Shallow Subsurface (CGISS)
CHAPTER FOUR GEOPHYSICAL INTERPRETATION AND DISCUSSION
 CHAPTER FOUR GEOPHYSICAL INTERPRETATION AND DISCUSSION 4.1. DATA PROCESSING AND INTERPRETATION 4.1.1. Introduction Processing of potential field data entails the application of various filters to the data
29. IMPLICATIONS OF DEEP SEA DRILLING, SITES 186 AND 187 ON ISLAND ARC STRUCTURE
 29. IMPLICATIONS OF DEEP SEA DRILLING, SITES 186 AND 187 ON ISLAND ARC STRUCTURE John A. Grow 1, Marine Physical Laboratory, Scripps Institution of Oceanography, La Jolla, California INTRODUCTION Pacific
THREE-DIMENSIONAL FINITE DIFFERENCE SIMULATION OF LONG-PERIOD GROUND MOTION IN THE KANTO PLAIN, JAPAN
 THREE-DIMENSIONAL FINITE DIFFERENCE SIMULATION OF LONG-PERIOD GROUND MOTION IN THE KANTO PLAIN, JAPAN Nobuyuki YAMADA 1 And Hiroaki YAMANAKA 2 SUMMARY This study tried to simulate the long-period earthquake
Determination of Incompressibility, Elasticity and the Rigidity of Surface Soils and Shallow Sediments from Seismic Wave Velocities
 Journal of Earth Sciences and Geotechnical Engineering, vol. 6, no.1, 2016, 99-111 ISSN: 1792-9040 (print), 1792-9660 (online) Scienpress Ltd, 2016 Determination of Incompressibility, Elasticity and the
DETERMINATION OF BEDROCK STRUCTURE OF TOTTORI PLAIN USING SEISMIC EXPLOSION, MICROTREMOR AND GRAVITY SURVEY
 13 th World Conference on Earthquake Engineering Vancouver, B.C., Canada August 1-6, 2004 Paper No. 1760 DETERMINATION OF BEDROCK STRUCTURE OF TOTTORI PLAIN USING SEISMIC EXPLOSION, MICROTREMOR AND GRAVITY
Relinquishment Report
 Relinquishment Report Licence P1403 Block 13/22d Chevron North Sea Limited Korean National Oil Company Chevron North Sea Limited December 2009 1 SYNOPSIS... 3 2 INTRODUCTION. 3 2.1 Licence Terms.. 3 2.2