DETERMINATION OF FAULT PLANE ORIENTATIONS FROM RUPTURE DIRECTIVITY OF INTERMEDIATE AND DEEP EARTHQUAKES IN THE NORTHEASTERN JAPAN SUBDUCTION ZONE
|
|
|
- Derick Lawrence
- 6 years ago
- Views:
Transcription
1 DETERMINATION OF FAULT PLANE ORIENTATIONS FROM RUPTURE DIRECTIVITY OF INTERMEDIATE AND DEEP EARTHQUAKES IN THE NORTHEASTERN JAPAN SUBDUCTION ZONE TIM OSBURG, B.S. An Abstract Presented to the Graduate Faculty of Saint Louis University in Partial Fulfillment of the Requirements for the Degree of Master of Science (Research) 2012
2 Abstract Earthquakes occur at intermediate (> 70 km) and deep (> 300 km) depths within the Earth. Since their discovery, the cause of intermediate and deep-focus earthquakes has remained a fundamental problem in seismology. While several physical mechanisms have been theorized to explain the occurrence of deep earthquakes, the mechanism may be constrained by determining the fault plane orientation. I used rupture directivity of 52 events in the northeastern Japan subduction zone to determine each event's fault plane orientation. With adequate station coverage, in both azimuth and distance, rupture can be identified along a single nodal plane signifying the fault plane. P-wave duration is shortest in the direction of rupture propagation and greatest in the opposite direction. Measuring the differential rupture duration between seismic stations allows for the determination of rupture direction, rupture velocity relative to the background seismic velocity, and the fault plane for each event. Rupture directivity is determined for a total of 20 events. Results indicate that rupture at intermediate and deep focus depths occur along the subhorizontal nodal plane. While fault plane orientation is apparently uniform in the subducting slab, rupture direction appears scattered. These results suggest multiple mechanisms are responsible for the orientation and azimuthal direction of rupture. 1
3 DETERMINATION OF FAULT PLANE ORIENTATIONS FROM RUPTURE DIRECTIVITY OF INTERMEDIATE AND DEEP EARTHQUAKES IN THE NORTHEASTERN JAPAN SUBDUCTION ZONE Tim Osburg, B.S. A Thesis Presented to the Graduate Faculty of Saint Louis University in Partial Fulfillment of the Requirements for the Degree of Master of Science (Research) 2012
4 COMMITTEE IN CHARGE OF CANDIDACY: Assistant Professor Linda M. Warren Chairperson and Advisor Associate Professor Lupei Zhu Associate Professor John Encarnaciόn i
5 Acknowledgments I would like to thank Dr. Linda M. Warren for her patience, advice, and dedication to teaching and research. Without her extensive knowledge of geophysics I would not have been able to complete this thesis or gained as much as I have from the graduate program. I wish to thank Dr. Lupei Zhu and Dr. John Encarnaciόn for their time and helpful comments in order to improve this writing. I wish to thank each Professor within the Earth and Atmospheric Sciences Department at St. Louis University for their tireless dedication to teaching. I wish to thank Laurie Hausmann and Karen Nydegger for their help and their diligence. I wish to thank my fellow graduate students who aided me in classes and research. Finally, I wish to thank my family for their continued support, encouragement, and understanding as I pursued this degree. ii
6 Table of Contents List of Tables... v List of Figures... vi Chapter 1: Introduction... 1 Background... 1 Problem... 5 Motivation... 5 Chapter 2: Literature Review... 6 The Oceanic Plate... 7 Temperature Dependent Earthquake Properties... 7 Seismic Tomography... 9 Earthquake Locations... 9 Rupture Characteristics Chapter 3: Methodology Overview Description of Methodology Chapter 4: Data Data Acquisition Useable / Rejected Data Chapter 5: Results Rupture Directivity Analysis Identification of Subhorizontal Fault Planes Vertical Fault Planes Rupture Toward the Nodal Plane Intersection Inconclusive Results Chapter 6: Discussion Summary Conclusions Appendix A References Vita Auctoris iii
7 List of Tables Table 5.1: Events with observed directivity Table 5.2: Events excluded from study with specific reasoning iv
8 List of Figures Figure 1.1: Map view of the Japan Islands... 4 Figure 3.1: Cartoon representation of rupture directivity Figure 3.2: P-wave recordings of Figure 3.1 reoriented to display observable increases in duration away from the rupture vector Figure 3.3: Example figure of observable directivity Figure 3.4: Example figure without observable directivity Figure 6.1: Azimuthal and dip distribution of events with observed directivity Figure 6.2: Fault plane orientations and rupture vectors of events with observed directivity located on the slab Figure 6.3: Figure 6.2 in map view Figure A1: Results for the 21 July 1994, MW 7.3 earthquake Figure A2: Synthetic results for the horizontal nodal plane of the 21 July 1994, M W 7.3 earthquake Figure A3: Synthetic results for the vertical nodal plane of the 21 July 1994, M W 7.3 earthquake Figure A4: Results for the 31 August 1994, MW 6.2 earthquake Figure A5: Synthetic results for the horizontal nodal plane of the 31 August 1994, M W 6.2 earthquake Figure A6: Synthetic results for the vertical nodal plane of the 31 August 1994, M W 6.2 earthquake Figure A7: Results for the 13 March 1995, MW 6.2 earthquake Figure A8: Synthetic results for the horizontal nodal plane of the 31 March 1995, M W 6.2 earthquake Figure A9: Synthetic results for the vertical nodal plane of the 31 March 1995, M W 6.2 earthquake v
9 Figure A10: Results for the 30 November 1995, MW 6.0 earthquake Figure A11: Synthetic results for the horizontal nodal plane of the 30 November 1995, MW 6.0 earthquake Figure A12: Synthetic results for the vertical nodal plane of the 30 November 1995, MW 6.0 earthquake Figure A13: Results for the 18 October 1996, MW 5.6 earthquake Figure A14: Synthetic results for the horizontal nodal plane of the 18 October, M W 5.6 earthquake Figure A15: Synthetic results for the vertical nodal plane of the 18 October, M W 5.6 earthquake Figure A16: Results for the 15 November 1997, MW 6.1 earthquake Figure A17: Synthetic results for the horizontal nodal plane of the 15 November 1997, MW 6.1 earthquake Figure A18: Synthetic results for the vertical nodal plane of the 15 November 1997, MW 6.1 earthquake Figure A19: Results for the 9 January 1999, MW 5.6 earthquake Figure A20: Synthetic results for the horizontal nodal plane of the 9 January 1999, M W 5.6 earthquake Figure A21: Synthetic results for the vertical nodal plane of the 9 January 1999, M W 5.6 earthquake Figure A22: Results for the 8 April 1999, MW 7.1 earthquake Figure A23: Synthetic results for the horizontal nodal plane of the 8 April 1999, M W 7.1 earthquake Figure A24: Synthetic results for the vertical nodal plane of the 8 April 1999, M W 7.1 earthquake Figure A25: Results for the 22 December 2000, MW 6.2 earthquake Figure A26: Synthetic results for the horizontal nodal plane of the 22 December 2000, MW 6.2 earthquake vi
10 Figure A27: Synthetic results for the vertical nodal plane of the 22 December 2000, MW 6.2 earthquake Figure A28: Results for the 26 April 2001, MW 6.0 earthquake Figure A29: Synthetic results for the horizontal nodal plane of the 26 April 2001, M W 6.0 earthquake Figure A30: Synthetic results for the vertical nodal plane of the 26 April 2001, M W 6.0 earthquake Figure A31: Results for the 2 December 2001, MW 6.5 earthquake Figure A32: Synthetic results for the horizontal nodal plane of the 2 December 2001, MW 6.5 earthquake Figure A33: Synthetic results for the vertical nodal plane of the 2 December 2001, M W 6.5 earthquake Figure A34: Results for the 28 June 2002, MW 7.3 earthquake Figure A35: Synthetic results for the horizontal nodal plane of the 28 June 2002, M W 7.3 earthquake Figure A36: Synthetic results for the vertical nodal plane of the 28 June 2002, M W 7.3 earthquake Figure A37: Results for the 12 November 2003, MW 6.4 earthquake Figure A38: Synthetic results for the horizontal nodal plane of the 12 November 2003, MW 6.4 earthquake Figure A39: Synthetics results for the vertical nodal plane of the 12 November 2003, MW 6.4 earthquake Figure A40: Results for the 21 September 2005, MW 6.1 earthquake Figure A41: Synthetic results for the horizontal nodal plane of the 21 September 2005, MW 6.1 earthquake Figure A42: Synthetic results for the vertical nodal plane of the 21 September 2005, MW 6.1 earthquake vii
11 Figure A43: Results for the 15 January 2007, MW 5.9 earthquake Figure A44: Synthetic results for the horizontal nodal plane of the 15 January 2007, MW 5.9 earthquake Figure A45: Synthetic results for the vertical nodal plane of the 15 January 2007, M W 5.9 earthquake Figure A46: Results for the 16 July 2007, MW 6.8 earthquake Figure A47: Synthetic results for the horizontal nodal plane of the 16 July 2007, M W 6.8 earthquake Figure A48: Synthetic results for the vertical nodal plane of the 16 July 2007, M W 6.8 earthquake Figure A49: Results for the 4 June 2008, MW 5.7 earthquake Figure A50: Synthetic results for the horizontal nodal plane of the 4 June 2008, M W 5.7 earthquake Figure A51: Synthetic results for the vertical nodal plane of the 4 June 2008, M W 5.7 earthquake Figure A52: Results for the 23 July 2008, MW 6.8 earthquake Figure A53: Synthetic results for the horizontal nodal plane of the 23 July 2008, M W 6.8 earthquake Figure A54: Synthetic results for the vertical nodal plane of the 23 July 2008, M W 6.8 earthquake Figure A55: Results for the 9 August 2009, MW 7.1 earthquake Figure A56: Synthetic results for the horizontal nodal plane of the 9 August 2009, M W 7.1 earthquake Figure A57: Synthetic results for the vertical nodal plane of the 9 August 2009, M W 7.1 earthquake Figure A58: Results for the 18 February 2010, MW 6.9 earthquake Figure A59: Synthetic results for the horizontal nodal plane of the 18 February 2010, MW 6.9 earthquake viii
12 Figure A60: Synthetic results for the vertical nodal plane of the 18 February 2010, M W 6.9 earthquake ix
13 CHAPTER 1: Introduction 1.1 Background When stress is applied to an object, it will accumulate until a critical point is reached and then the material ruptures. Under pressure and temperature conditions at the Earth's surface, an object may respond in a brittle manner once a critical stress load is reached. At greater depth within the Earth, pressures and temperatures increase to the point where an object will flow in response to an applied stress. At subduction zones, oceanic lithosphere enters the Earth's asthenosphere and is subjected to increasing pressures and temperatures as it subducts. Oceanic lithosphere is comprised of the upper crustal material approximately 5 km thick and the upper most mantle for a total thickness of approximately km. As the oceanic lithosphere, or slab, moves further into the mantle, stress may be released, resulting in earthquakes at great depths. Earthquakes at subduction zones have been recorded as deep as 700 km. Earthquakes have been categorized as shallow (0 70 km), intermediate ( km), and deep-focus ( km). At such depths Earthquakes are unique to convergent margins. At intermediate and deep-focus depths rupture or brittle deformation of the slab is expected to be prevented by pressure and temperature, while the existence of intermediate and deep-focus earthquakes indicates persistent faulting [Peacock, 2001]. Since the discovery of deep earthquakes by Wadati [1927], this unexpected result of brittle deformation in a ductile region presents a fundamental problem in geophysics. In view of the discovery of intermediate and deep-focus earthquakes, several physical mechanisms have been hypothesized to explain their occurrence. Proposed mechanisms include dehydration embrittlement, phase transformations, and shear instabilities. These proposed mechanisms are theorized to induce earthquakes at depth by altering properties such as pore pressure, mineral structure, and stresses on the slab. It is also possible that mechanisms act in primary and secondary 1
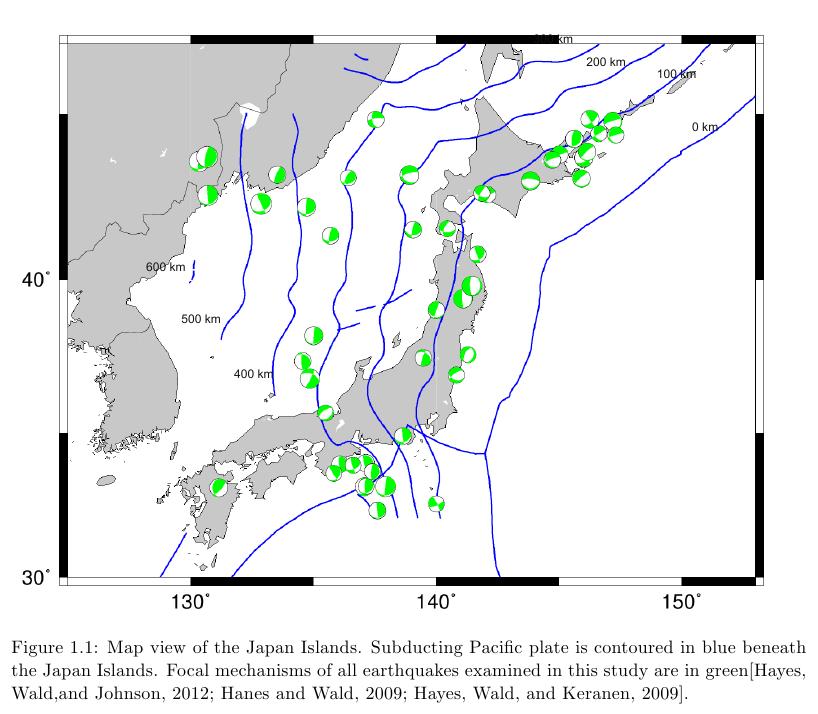
14 roles with increased depth, further complicating deciphering earthquake generation. However, each theory can be evaluated and used to provide explanations for the occurrence of intermediate and deepfocus earthquakes. The unique characteristics of each subducting plate, including age, angle of subduction, mineral content, and slab temperature, all contribute to differences in seismicity and the evolution of subduction. Along an individual slab, heterogeneity in structure can also contribute to complex subduction and interaction with the surrounding mantle material. Anomalies in the stress regime, temperature, structure of slab, and a myriad of other aspects can result in anomalies throughout the subduction process. To this end, subduction zones around the world have been investigated to determine the cause of intermediate and deep-focus earthquakes. Warren and Silver [2006] and Warren, Hughes, and Silver [2007], Warren, Langstaff, and Silver [2008] have investigated intermediate and deep-focus earthquakes in various subduction zones around the world. Here, I intend to apply the methodology developed in Warren and Silver [2006] to the northeastern Japan subduction zone. The Japan Islands are between N and E, where four tectonic plates converge. Situated on the overriding plate(s), the Japan Islands form an island arc above the active subduction zone incorporating two subducting oceanic planes. Because of this, the Japan subduction zone is commonly divided into two distinct sections. In the southwestern portion of the Japan subduction zone the Philippine Sea Plate is subducting. At the northeastern section, the Pacific plate is subducting. The northeastern Japan subduction zone begins as the Pacific Plate enters the Japan and Kurile trenches (NE Japan) and subducts underneath the Japan Islands. Figure 1 outlines the study area. Subduction in NE Japan occurs at a velocity of approximately 9 cm yr-1 [DeMets, Gordon, Argus, and Stein, 1990; Zhao, Wang, Umino, Hasegawa, 2009]. The 130 Ma [DeMets et al., 1990; Tonegawa, Hirahara, Shibutani, and Fujii, 2006] Pacific plate is subducting beneath the Japan Islands at a dip of 2
15 10 near the trench. At approximately 100 km west of the trench, the slab dip steepens to 30 [Zhao, Matsuzawa, and Hasegawa 1997; Uchida, Hasegawa, Matsuzawa, and Igarashi 2004]. In NE Japan earthquakes have been recorded from the shallow surface to depths reaching approximately 670 km [Peacock and Wang, 1999]. 3
16 4
17 1.2 Problem At near-surface depths it is not always possible to conduct a visual observation of earthquake rupture. The increased depth of deep earthquakes makes visual examination of rupture impossible. Therefore, far-field methods are employed for shallow as well as intermediate and deep earthquakes to determine rupture directivity, fault-plane orientation, and the physical mechanism responsible for the earthquakes. Here, I investigate rupture directivity and primary fault-plane orientations of intermediate and deep-focus earthquakes to better identify the deformation processes of the subducting slab. 1.3 Motivation Earthquakes at intermediate and deep-focus depths (deep earthquakes) provide an excellent opportunity to study aspects of the interior of the Earth. Subducting slabs are subject to a variety of changes as they progress further into the Earth. Alterations a slab undergoes may include, but are not limited to, increasing pressures, temperatures, and other physical and chemical alterations. It is important to understand the different environments the slab moves through for a greater understanding of earthquake generation. This issue of why deep earthquakes occur remains a fundamental problem within geophysics. To address this fundamental issue I will follow the method developed by Warren and Silver [2006] to determine the orientation of rupture and fault-planes within the NE Japan subduction zone. I intend to provide insight into processes responsible for earthquakes at intermediate- and deepfocus. By confining rupture to a single nodal plane and determining the orientation it is possible to identify the fault plane. If successful, certain fault plane orientations may provide a better explanation to the physical mechanisms of deep earthquakes. 5
18 CHAPTER 2: Literature Review Studies of intermediate and deep-focus earthquakes work to explain physical mechanisms behind brittle deformation (rupture) at depth. Answering why rupture occurs in place of ductile deformation remains a fundamental problem in geophysics. Important to this issue are several aspects concerning the prevalence of weaknesses in the slab, whether carried to depth during subduction or generated at depth. All earthquakes investigated for rupture directivity in this study occur at the depth range of km below the surface of the Earth. Shallow earthquakes are located along tectonic boundaries and within tectonic plates. At subduction zones plate bending into a trench provides one explanation for shallow earthquakes at convergent margins. Shallow earthquakes at convergent margins have also been observed in response to cohesive strength between the slab and mantle-wedge. However, whether changes made at shallow depths contribute to earthquake generation at greater depths remains a topic of debate. Peacock [2001] stated that deeper than ~50 km in the Earth, physical mechanisms that enable brittle failure are unfavorable due to increases in pressure and temperature. Therefore, the physical mechanisms used in explaining shallow earthquakes are insufficient or incomplete when applied to intermediate and deep earthquakes. Theories for deep earthquakes include changes in mineral phases, temperature, and ambient stress regimes each leading to unique effects on the slab and the orientation of rupture of deepfocus earthquakes. Earthquakes have been located in NE Japan to a depth of ~670 km [Peacock, 1999]. Understanding the reasons why such a range in depth exists at subduction zones is the basis for answering the fundamental question. Identified by depth range, it is possible for intermediate and deep-focus earthquakes to display different physical characteristics, suggesting a change in physical mechanism. This change of physical mechanisms with depth suggests the presence of multiple physical mechanisms. Mechanisms that have been proposed to explain deep earthquakes include shear instabilities, 6
19 dehydration of hydrous minerals, the reactivation of faults, and mineral transformations [Tibi, Guenter, Wiens, 2003, and ref therein]. The various physical mechanisms initiate rupture through different means, allowing for distinction between the responsible mechanisms. At the trench, prior to entering the subduction zone, the oceanic plate will rupture in a brittle manner due to bending resulting in a series of horst and grobens producing faults that dip toward and away from the trench. Once the slab enters the subduction zone and has a substantial dip, these faults will be oriented subhorizontally and subvertically. Bending of the oceanic plate may be one mechanism resulting in planes of seismicity within the slab termed the double seismic zone. 2.1 The Oceanic Plate As an oceanic plate ages, latent heat associated with the initial formation is lost. This, general relation of age and thermal gradient, allows for the observation of codependency between temperature of an oceanic plate and age. As a tectonic plate cools various changes in the composite structure occur. With decreasing temperature, the total thickness of the tectonic plate increases. Consequently, older oceanic plates and their associated slabs are colder and thicker than younger oceanic plates. Since the portion of the Pacific plate in this study is old, 130 Ma, it is assumed a larger thermal gradient exists between the slab and surrounding mantle. Faulting generated in the Pacific Plate is interpreted as normal faulting in response to forces of slab pull [Kobayashi et al., 1998]. Studying the plate in the outer-rise prior to subducting in NE Japan, Kobayashi et al. [1998] found no significant difference between faults dipping toward or away from the trench. Additional studies have shown that there is no evidence of recent seamount subduction at NE Japan [Zhao et al., 1997]. Seismicity in the plate can initially be attributed to extensional stresses along the top of the plate and compressional stresses along the lower portion. 2.2 Temperature-Dependent Earthquake Properties Wiens [2001] suggested that temperature has a greater effect on the occurrence of deep 7
20 earthquakes than shallow earthquakes. Observations in slab dynamics are closely associated with the thermal structure of the slab. This dynamic is evident in observations that identify values of stress drops in colder slabs that are lower than warmer slabs following earthquakes [Wiens, 2001]. Such results suggest that temperature of the slab is an important factor affecting deep earthquakes. Such results suggest that alterations in the characteristics of slab behavior at deep depths are highly temperature dependent. Temperature of the slab has been linked to many aspects of deep earthquakes. Aftershocks are one example of an apparent temperature dependent phenomenon of deep earthquakes. Studies have shown that aftershocks are more numerous in cold slabs than warm slabs [Wiens., 2001; Antolik, Dreger, and Romanowicz, 1999, Tibi et al., 2003]. Antolik et al. [1999] determined that without a temperature controlling mechanism the occurrence of aftershocks within a slab and the presence of a double seismic zone are difficult to explain. Peacock and Wang [1999] and Peacock and Hyndman [1999] demonstrated through thermal modeling that H2O is transported to greater depths in NE Japan and other cooler subduction zones than in warmer subduction zones. This observation is in agreement with temperature values required in dehydration reactions. The temperature difference between the Philippine Sea plate and the Pacific plate explains lower heat flow and geothermal gradient differences between the two portions of the same subduction zone [Zhao, Mishra, and Sanda 2002]. When the slab loses water to the surrounding environment, the solidus temperature is lowered. Results of this process are observable through decreased seismic velocity of S-waves in the mantle overlying the slab. Zhao et al. [2009] identified low-velocity areas in NE Japan, alluding to the presence of fluid transported to depth within the slab. In Tonga, the coldest part of the slab is the region between the two seismic zones. Rupture propagates toward lower temperatures in the upper seismic zone and higher temperatures in the lower seismic zone [Warren et al., 2007]. Variations in rupture velocity are consistent with observations that ruptures in warm subduction zones last relatively longer and that there is a longer duration between 8
21 foreshock and the initiation of the main episode of moment release [Tibi et al., 2003]. 2.3 Seismic Tomography Tomographic studies of NE Japan have been conducted to depths of 150 km [Zhao et al., 1997; Nakajima, Ysuji, Hasegawa, Kita, Okada, and Matsuzawa, 2009], 200 km [Zhao, Hasegawa, and Horiuchi, 1992], 500 km [Zhao, Hasegawa, and Kanamori 1994], and 700 km [Abdelwahed and Zhao., 2007]. The subducting slab is distinguished from the overlying mantle-wedge by a higher average (6%) difference in seismic velocity [Zhao et al., 1992, 1994; Takanami, Sacks, and Hasegawa, 2000]. Nakajima et al. [2009] concluded that the lower P-wave velocity values of the lower seismic zone result from hydrous mineralogy including serpentine-bearing or chlorite-bearing harzburgite. High seismic velocities in the center of the double seismic zone probably reflect the absence of hydrous minerals between the earthquake planes [Nakajima et al., 2009]. Supporting these results, Zhao et al. [1992] observed that earthquakes within the central portion of the slab were associated with areas of high velocity. Abdelwahed and Zhao [2007] identified low velocity anomalies below the slab that may be the result of upwelling from continued subduction. In the mantle-wedge, low velocity zones dip toward the west from the volcanic front and are generally parallel to the subducting slab [Zhao et al., 1992]. Abdelwahed and Zhao [2007] located low velocity anomalies in the deep mantle-wedge above the slab. Zhao et al. [1994] observed distinct low velocity anomalies in the upper mantle and crust below active volcanoes in Japan. All indicating increased pore pressure in the area. This unique development in the mantle-wedge may incorporate a chemical portion of the subducting slab as it descends into the Earth. 2.4 Earthquake Location Most earthquakes at crustal or shallow depths occur within and along boundaries between tectonic plates. While deep earthquakes are similar to shallow earthquakes, they are unique to convergent margins. At shallow depths earthquakes can be widely dispersed in location when 9
22 compared to intermediate and deep-focus earthquake locations. The restriction in location points to the importance of subduction zones in earthquake generation. Earthquakes are one physical response to applied stresses on a material over time. The existence of brittle failure is an indication of stresses accruing and their eventual releasing. When an ocean plate subducts, numerous changes in stress state occur. At shallow depths in subduction zones, earthquakes focus along the interface of the slab and mantle wedge as well as within the slab. Deeper in subduction zones, earthquake locations are contained within the slab. Double seismic zones are a feature of earthquake locations in subduction zones. Temperature, age, and thickness of the subducting slab have all been connected to the distance between double seismic zones in all subduction zones. With greater age of the tectonic plate, the temperature is lower and the thickness increases. As the slab increases in thickness, the distance between the two seismic zones increases. Earthquake locations aid in understanding structural differences of subduction zones. The distance between the planes shows that earthquakes are not confined to the crustal material of the slab. The entire thickness of the subducting Pacific plate when accounting for the crust and upper-mantle is estimated at km thick [Zhao et al., 1994]. At km depth, the lower plane of earthquakes are located in the central part of the slab, while the upper-plane earthquakes occur within km beneath the slab boundary [Zhao et al., 1997]. That deep earthquakes occur within the slab is evident from slip distributions compared with background seismicity and aftershock locations. Moment release for large, deep-focus earthquakes appears to be focused at the slab core, suggesting a critical temperature controlling the process of rupture propagation [Antolik et al., 1999]. Aftershocks of intermediate and deep-focus earthquakes are observed to be more numerous when the initial shock is in an area of increased seismic activity. If the initial shock is located in an aseismic region, the number of aftershocks is decreased [Wiens, 2001]. 2.5 Rupture Characteristics 10
23 Determining the fault-plane orientations of intermediate and deep-focus earthquakes has been attempted through various means since the discovery by Wadati in Numerous methods of examining intermediate and deep-focus ruptures to determine fault-plane orientations have been developed. These methods include examination of aftershocks locations, subevents contained within a seismic signal, the duration of peaks contained within the initial wave form, and rupture directivity. Each method used in determining fault-plane orientations of intermediate and deep-focus earthquakes makes certain assumptions regarding the rupture process along the fault. Beck, Sliver, Wallace, and James [1995] defined directivity as the systematic variation in relative arrival time of seismic pulses that result from finite faulting. Determining directivity of rupture propagation has been accomplished through various methods. Antolik et al. [1999] demonstrated through synthetic testing that station coverage is significant in determining relative amplitudes of subevents but distribution of slip can be recovered with 180 station distribution. The importance of station coverage in evaluating directivity has been echoed through various studies of deep earthquakes [Warren 2007, 2008]. By determining the orientation of the rupture propagation vector, it is possible to identify the fault-plane and its orientation. Beck et al. [1995] constrained the rupture plane using directivity analysis of P-wave displacement. Warren and Silver [2006] developed an analytical technique for identifying the primary rupture plane of an earthquake at intermediate- and deep-focus depths. By determining rupture directivity it is possible to identify the primary nodal plane that rupture occurred along on a focal mechanism. Determining the primary rupture plane of intermediate- and deep-focus earthquakes presents intriguing difficulties. Earthquake signals travel such great distances that only events of higher magnitude levels are predisposed for examination. Compounding the difficulty of usable earthquake records is the minimal number of seismic stations that have existed around the world until recently. Without visible evidence of the rupture, determining the primary rupture plane requires analytical methods not required at shallow depths. However, despite these difficulties, several studies 11
24 have been carried out on large magnitude earthquakes that occur throughout the world. According to Warren et al. [2007, 2008], subhorizontal and subvertical ruptures occur in subducting slabs to different extents at intermediate and deep-focus. For most events, the rupture lengths are estimated accurately from the average velocity of moment release and the source duration, or by locating the rupture termination point [Tibi et al., 2003]. Antolik et al. [1999] studied several earthquakes of various depths. Each earthquake ruptured along a subhorizontal fault plane or largely horizontally along a more steeply dipping fault plane. 12
25 CHAPTER 3: Methodology 3.1 Overview Focal mechanisms set two possible fault plane orientations of an earthquake. However, without additional knowledge, it is not possible to know which fault plane ruptured during an earthquake. Different methods developed to determine the primary fault plane orientation of deep earthquakes include certain assumptions that distinguish the various techniques. Since rupture must be confined along a fault plane, determining the rupture direction also determines the fault plane. Apparent rupture durations will be dependent on the rupture geometry [Warren and Silver, 2006]. Here the assumption made is that rupture will propagate in a unilateral or bilateral manner along the fault. Unilateral rupture propagation (Figure 3.1) is in a single direction while bilateral rupture propagation occurs in two opposite directions. Figure 3.1 illustrates the increased duration of P-waves observed at various stations as you increase azimuthal distance from the rupture direction. P-waves are reoriented in Figure 3.2 to better demonstrate increasing duration when rupture is confined to a single nodal plane. Unilateral rupture propagation has been predominantly observed in previous studies [Warren et al., 2007, 2008; Myhill and Warren, 2012] of subduction zones. This assumption of rupture propagation and determination of fault plane orientation follows the methodology developed by Warren and Silver [2006] described below. Apparent rupture duration τ will vary as the angle θ between rupture direction and the takeoff vector varies. Unilateral rupture is determined by the following equation: τ(θ)= L L cos (θ) vr α (1) where θ is the angle between rupture propagation and the takeoff vector to the station, vr is the rupture velocity along the length L of the fault, α is the background seismic velocity. A similar expression can be derived for bilateral rupture propagation. 13
26 14
27 15
28 The RMS (root mean squared) misfit M for P-wave measurements is defined by the equation: M (r )= n n, i 1 ( sij,measured s ij, predicted )2 m i=1 j=1 (2) m denotes the number of stations, n is the number of measurements made, sij is the stretching factor between seismic stations i and j. The stretching factor is used to calculate the relation between rupture duration at stations at angles θi and θj. In unilateral rupture the stretching factor is defined by the equation: υr cos (θi ) α sij = υ 1 r cos (θ j ) α 1 (3) Bootstrap resampling is then conducted to determine errors in the rupture analysis. The selection of random stations allows for the examination of statistical uncertainty values in the rupture directivity. If rupture were represented by an instantaneous point source little to no variation would be observed over the focal sphere inhibiting the directivity analysis. 3.2 Description of methodology The method developed by Warren and Silver [2006] performs a semi-automated measurement comparison between the duration of P-wave arrivals at numerous seismic stations. Here, I begin by collecting all available seismic data for a single earthquake beginning at At a later step, distance is reduced to 95. Seismic records are then read into SAC from the original seed format. Before the initial analysis, each seismogram is integrated for displacement and inspected for P-wave arrival. P-wave arrivals are picked by hand for each station. If the P arrival is unclear, or the signal contains noise relative to the P-wave amplitude, the record is removed from the 16
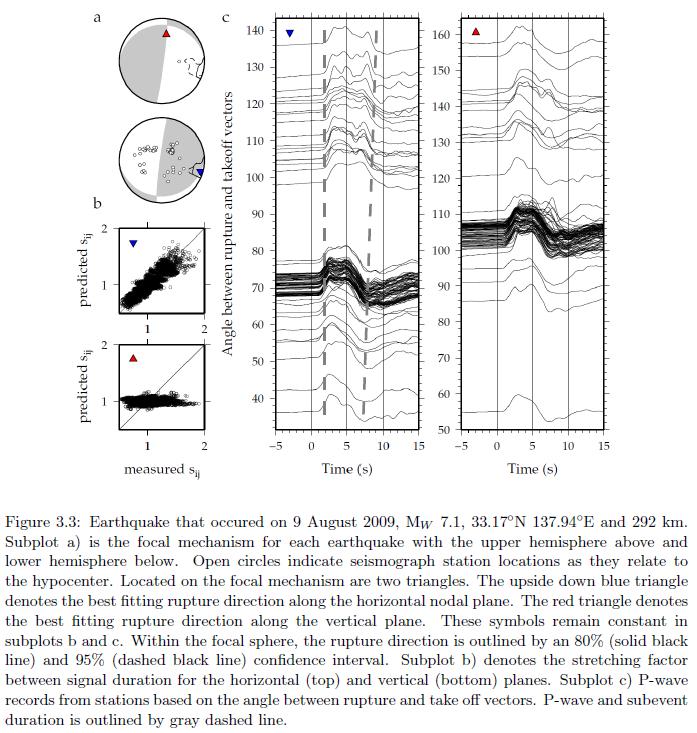
29 processing queue. Once P-wave arrival selection is complete, the first iteration is conducted and the differential rupture duration between all pairs of seismograms is measured. Data is then subjected to a grid search to determine the best possible rupture direction and velocity on the focal sphere. RMS values are computed for the misfit of vr/α from 0.0 to 0.8 for the rupture model. After the completion of each iteration, seismogram records are inspected individually for possible biases including poor instrument response, nodal plane take off vectors, and focal mechanism changes. Upon completion of measuring differential rupture duration of all seismograms, 80% and 95% confidence intervals are computed from bootstrap resampling. Both confidence intervals are overlain on the focal mechanism and are compared with the best fitting rupture vector. Synthetic seismograms are generated for the best fitting rupture vector on each nodal plane. Station distributed is modeled from actual station distribution. Rupture directivity analysis and confidence interval computations for each synthetic result are then conducted in the same manner as for the observed data. Noise is added to each synthetic seismogram at the signal-to-noise ratio measured on the observed seismograms. Upon completion of analysis, results are inspected to determine the nodal plane that contained the rupture. For the nodal plane to be identified as the fault plane, it must meet certain requirements. (1) Is the rupture direction within the 95% confidence interval? (2) Does rupture duration display a coherent increase with increased angle between rupture and takeoff vector? (3) Is the rupture velocity a physically reasonable value? (4) Is there a distinction in misfit between the two planes and is the lower misfit value below 0.85? (5) Do seismic stations used in determining rupture directivity comprise good azimuthal coverage? (6) Do synthetic seismograms generated for each rupture plane agree with the observed rupture directivity? In Figure 3.3, directivity is observed through the evaluation of the previously stated criteria. 17
30 For this earthquake rupture is located along the subhorizontal plane in agreement with the 95% confidence interval. A clear increase in duration of the P-wave is observed. The rupture velocity (0.37α) along the subhorizontal nodal plane is a reasonable value. The misfit 0.42 for of the subhorizontal plane is below the required 0.85 and lower than the subvertical misfit value (0.98). Station distribution is good in both distance from the event and azimuthal coverage. Finally, synthetics generated for this event (Appendix A) are in good agreement with rupture along the subhorizontal nodal plane. Figure 3.4 displays an event from this study that did not fulfill the selection criteria because increased duration was not observed. Initially rupture within the 95% confidence interval is located along one nodal plane. However, there is no observable increase in the P-wave duration. Additionally misfit for both nodal planes is high (0.87 horizontal and 0.99 vertical), indicating that rupture directivity cannot be determined for this event. 18
31 19
32 20
33 CHAPTER 4: Data 4.1 Data Acquisition Earthquakes for this study were identified from the National Earthquake Information Center (NEIC). Earthquake locations were taken from the EHB catalog [Engdahl, van der Hilst, and Buland, 1998]. Locations for events not found within the EHB bulletin were taken from the CMT catalog [Dziewonski and Woodhouse, 1983; Dziewonski et al., 1981]. Individual earthquakes were selected according to location, date, depth, and magnitude. Location of earthquakes used in this study are between N and E. Events requested are between the dates of 1 January 1994 and 31 December More specifically, events are selected based on the expected best signal quality and distribution. This time frame was selected from the quality and distribution of seismic stations. Prior to 1994, the availability of fewer stations limits the ability to determine directivity. The depth range ( km) selected for this study includes both intermediate- and deep-focus earthquakes. Generally, higher magnitudes represent a stronger distinction between background noise resulting in an overall clarity in identifying incoming seismic waves. Due to this apparent distinction between lower and higher magnitudes, earthquakes with MW > 5.5 are selected in this study. These criteria resulted in the identification of 52 earthquakes for analysis. After compiling a list of potential earthquakes, seismic records were acquired from the Incorporated Research Institutions for Seismology (IRIS). Of the various options provided by IRIS for data request, the WILBER II data request tool was used. FARM records are initially selected for use in this study. If FARM data is unavailable for an event, SPYDER data are selected. In the following step, a list of all seismic stations that recorded the earthquake are compiled. Here two additional restrictions are applied to the data selection. The first is a distance restriction of 0 to 100 from the epicenter. The second restriction applied is the vertical broadband channel is the sole channel selected. The signal-tonoise ratio is addressed later in the data processing. Initially data was not rejected based on the 21
34 contamination of the signal with other sources. Each seismic record is requested for a period of 2 minutes before and 10 minutes following the P-wave arrival. 4.2 Useable / Rejected Data Originally earthquake data for this study was collected based on the location and timing of each individual event. Earthquakes that occurred within a short time period following a selected event were deemed aftershocks and were not included. Following the initial collection process seismic records were addressed on a case by case basis to determine directivity. In order to avoid bias results in directivity station records were removed from examination based on numerous parameters. All station recordings along nodal planes were removed along with any station that contained a poor signal-tonoise ratio. Additionally, if numerous stations were close in proximity to each other (possibly the same network) the best record was selected and the remaining stations were removed, in a step by step process. This selection process of dense station locations was conducted to avoid bias in a single direction due to excessive coverage. Final selections of events were based on criteria listed in the Methodology. When an individual event did not fulfill each requirement for determining directivity, it was removed from further consideration. 22
35 CHAPTER 5: Results 5.1 Rupture Directivity Analysis In this study, rupture directivity is observed for twenty of the original fifty-two earthquakes. Determination of rupture directivity, which must occur along a single nodal plane, distinguishes the fault-plane from the secondary nodal plane for deep earthquakes. Previous studies have shown that rupture propagates in unilateral or bilateral motion along the primary nodal plane. Bilateral rupture is reported in previous studies of various different subduction zones. Here, rupture is reported in a unilateral manner. Ten earthquakes display rupture directivity along the subhorizontal nodal plane. Eight earthquakes have observed rupture directivity toward the nodal plane intersection. Because rupture directivity is toward the nodal plane intersection the primary rupture plane cannot be clearly determined. The remaining two earthquakes with observable rupture directivity display bias in data or methodology prohibiting identification of the primary rupture plane. Calculated values for the twenty earthquakes with observed rupture directivity are included in Table 5.1. Reasoning for the exclusion of the remaining thirty-two events is outlined in Table 5.2. Each event with observable directivity is comprised of a set of three figures (Appendix A). Each figure set includes rupture directivity from observed data and calculated synthetics for rupture along the subhorizontal and subvertical nodal planes. For each event, the first synthetic figure is for rupture on the subhorizontal nodal plane and the second synthetic figure is for rupture on the subvertical nodal plane. 23
36 Table 5.1 Events with observed directivity Nodal Plane 1 24 YRMODY Time (UTC) Lat ( N) Lon ( E) :36: :07: :01: :09: :44: :05: :05: :10: :13: :48: :01: :19: :26: :25: :17: :17: :03: :26: :55: :13: M Misfit p/t Plunge/Trend of rupture vector γ angle between rupture vector and slip vector νr/α rupture velocity/p-wave velocity str/dip/rake strike/dip/rake bold indicates identified / preferred fault plane Depth (km) MW str/dip/rake 1 64/34/178 58/55/ /9/175 39/27/119 11/14/94 07/11/71 160/20/-3 81/25/160 11/12/ /16/ /7/-93 27/13/105 50/34/156 97/10/-40 80/34/ /46/-10 92/38/166 14/18/-75 86/17/168 71/15/166 M p/t 34/162-23/041 9/170-14/247 10/56 5/305-4/352 19/213-8/236-3/080-3/331 0/207-6/041-7/057 15/103 41/054 12/256 17/088 7/107 11/206 Nodal Plane 2 γ 4±2 78 ± ± ± ± ± 13 3 ± ± 6 19 ± ± ± ± 5 54 ± 9 11 ± ± ± ± ± 13 9±4 34 ± 21 νr/α 0.40 ± ± ± ± ± ± ± ± ± ± ± ± ± ± ± ± ± ± ± ± 0.0 str/dip/rake 2 155/89/56 314/71/ /89/81 187/66/76 187/76/89 70/89/97 253/89/ /82/67 252/84/ /78/ /83/ /77/86 160/77/59 226/84/ /89/56 27/83/ /81/53 178/73/ /86/73 175/87/76 M p/t 29/156-61/172 29/185 67/274 14/004-38/251-80/079 53/200 34/256 28/042 40/350-21/187 42/328 42/040 39/173 15/029 74/229-72/071-37/010 5/175 γ 7 ± ± ± ± 22 6 ± ± ± ± 6 40 ± ± ± ± ± ± ± ± ± ± ± 48 3 ± 21 νr/α 0.39 ± ± ± ± ± ± ± ± ± ± ± ± ± ± ± ± ± ± ± ± 0.05
37 25 Table 5.2 Events excluded from Lat YRMODY Time (UTC) ( N) :15: :15: :18: :49: :53: :45: :18: :32: :59: :45: :57: :06: :04: :39; :01: :08: :43: :20: :08: :01: :20: :22: :22: :51: :07: study with specific reasoning Lon Depth MW ( E) (km) str/dip/rake /53/ //15/ /59/ /38/ /27/ /39/ /59/ /73/ /21/ /37/ /69/ /30/ /45/ /19/ /39/ /45/ /30/ /25/ /23/ /30/ /24/ /36/ /11/ /11/ /53/-13 str/dip/rake 2 264/79/ /75/94 148/86/31 198/82/ /74/ /65/ /86/31 334/81/ /69/ /84/54 330/74/ /60/-88 58/90/ /85/72 281/78/ /89/ /70/67 181/75/70 178/77/109 45/67/ /83/67 189/80/55 204/80/95 172/88/80 210/80/-142 Reason for Rejection Poor station distribution Poor station distribution Poor station distribution Poor station distribution No clear directivity Poor station distribution Poor station distribution Poor station distribution No clear directivity Poor station distribution Poor station distribution Poor station distribution Poor station distribution No clear directivity Poor station distribution No clear directivity Poor station distribution Poor station distribution No clear directivity Poor station distribution Poor station distribution Poor station distribution No clear directivity No clear directivity Poor station distribution
38 5.2 Identified Subhorizontal Fault Planes The following ten earthquakes have observed rupture directivity along the subhorizontal nodal plane. These earthquakes are of MW , and depth km below the surface of the earth. The first earthquake presented occurred on August 9, 2009, with MW 7.1 at a depth of 292 km (See Appendix A: Figure A55). Following steps described in the methodology, the fault plane was identified. The subhorizontal rupture vector is within the 95% confidence region outlined in Figure A55. The subvertical rupture vector is not within either the 95% or 80% confidence regions. Increased duration for subhorizontal rupture is apparent throughout the entire azimuthal distance of records. These subevents also display increasing duration as azimuthal distance increases from the rupture direction. Rupture velocity for the event is estimated at 0.37α within the maximum value of 0.8α. The misfit of 0.42 is well below the maximum value of Stretching factors for rupture along the subhorizontal rupture are well distributed along a 1 to 1 ratio. Stations used for this event are well distributed around the focus. Stations are slightly clustered in distribution but to an insignificant extent. Synthetics generated for rupture along the subhorizontal nodal plane are in good agreement with observed results (Figure A56). Subvertical synthetics do not replicate observed data (Figure A57). From these criteria, I am able to conclude that rupture for the August 9, 2009, event propagated along the subhorizontal nodal plane. Therefore the subhorizontal plane is the fault plane for the earthquake. On March 31, 1995, MW 6.2 earthquake occurred at 354 km (Figure A7). Station distribution for this event is tightly spaced around the center and west of the focal mechanism. Rupture directivity is identified along the horizontal nodal plane within the 95% confidence interval. This result is in agreement with synthetic seismograms (Figures A8 A9) for rupture along the horizontal nodal plane. On November 30, 1995, a MW 6.0 earthquake occurred at 136 km (Figure A10). Station distribution for this earthquake is good despite a smaller number of records. Overall the good station 26
39 distribution allows for the identification of rupture along the southeast dipping nodal plane. Rupture along the southeast dipping nodal plane is within the 80% confidence interval while rupture directivity along the near-vertical nodal plane is along the edge of the 80% interval. Rupture is determined along the southeast dipping nodal plane because the misfit along the near-vertical is much higher than the southeast dipping and synthetics (Figures A11 A12) for the southeast dipping match the event better than those along the vertical plane. On October 18, 1996, MW 5.6 earthquake occurred at 337 km (Figure A13). Station distribution for this earthquake is concentrated to the west of the epicenter, with few stations to the east. Despite the lack of a good uniform station distribution, the spread was sufficient to identify rupture directivity along the horizontal nodal plane within a wide 95% confidence region. Synthetic seismograms (Figures A14 A15) generated for this event along the horizontal nodal plane are in good agreement with the observed results. On November 15, 1997, MW 6.1 earthquake occurred at 161 km (Figure A16). Here station distribution is good with dense coverage to the northeast. Rupture is identified along the horizontal plane within the 95% confidence interval. Synthetic seismograms (Figures A17 A18) generated for rupture along the horizontal nodal plane are in good agreement with the results of this earthquake. On January 9, 1999, MW 5.6 earthquake occurred at 119 km (Figure A19). Few stations were used in examining the directivity of this event. Total station distribution is sparse. However, we were still able to determine that rupture occurred along the horizontal nodal plane within the 95% confidence interval. Synthetic seismograms (Figures A20 A21) for rupture along the horizontal nodal plane are in good agreement with this event. This event represents the smallest magnitude earthquake for which the fault plane is identified with the method of Warren and Silver [2006]. On November 12, 2003, MW 6.4 earthquake occurred at 384 km (Figure A37). Station distribution for this earthquake is good: a small number of stations are clustered but do not appear to 27
40 bias results. Rupture for this event is identified along the northeast striking nodal plane within the 95% confidence interval. Synthetic (Figures A38 A39) results of rupture along the horizontal or southeast dipping nodal plane are in good agreement with the earthquake. On January 15, 2007, MW 5.9 earthquake occurred at 170 km (Figure A43). Station distribution for this earthquake was sufficient to determine directivity. However, there was significant clustering of stations. In addition the station distribution the misfit of the subhorizontal nodal plane (0.89) is above Rupture directivity was identified in the near-horizontal or east-west striking plane within the 80% confidence interval but outside of the 95% interval. Rupture for this event was well replicated in synthetic seismograms (Figures A44 A45) for the east-west striking nodal plane. On July 23, 2008, MW 6.8 earthquake occurred at 108 km (Figure A52). Station distribution for this earthquake is slightly clustered and sparse. Still, we are able to determine that rupture occurred along the horizontal nodal plane within the 95% confidence interval. The rupture pattern of this event is well replicated by synthetic seismograms (Figures A53 A54) for rupture along the horizontal plane. On February 18, 2010, MW 6.9 earthquake occurred at 577 km (Figure A58). Station distribution for this earthquake is good. For this event, rupture along the horizontal and vertical nodal planes is within the 95% confidence region. Despite this narrow difference in rupture directivity this event is identified to have rupture along the horizontal nodal plane. Rupture is concluded to be along the horizontal nodal plane for two reasons. First the misfit along the vertical nodal plane is higher than the horizontal. In addition, synthetics (Figures A59 A60) along the horizontal nodal plane replicate the rupture better than those along the vertical nodal plane. 5.3 Vertical Fault Planes No earthquakes analyzed in this study have observable rupture directivity along the vertical nodal plane. However, eight earthquakes in this study propagate toward the nodal plane intersection. For these earthquakes, rupture directivity is observed towards the intersection of the nodal planes 28
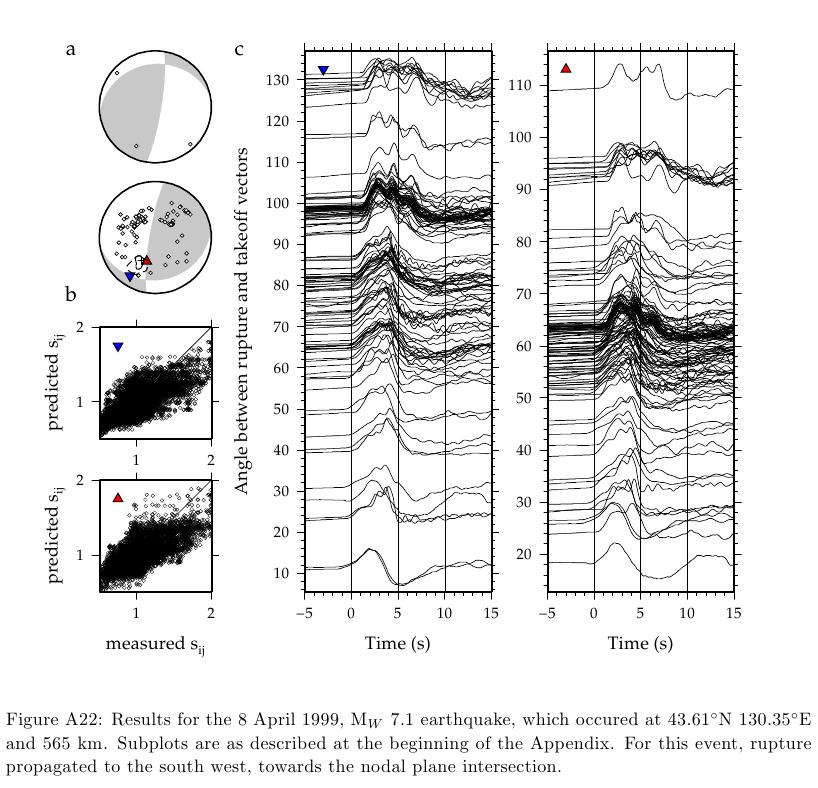
41 where vertical rupture directivity may enter the 80% and 95% confidence intervals. This result represents two possible motions for rupture directivity. Along the vertical nodal plane rupture directivity can be represented by a full 360 distribution. It is also possible for rupture to propagate horizontally along the vertical nodal plane at the intersection. Because of the inclusion of the nodal plane intersection, identification of the rupture directivity is not possible. Therefore, verifying the vertical nodal plane as the primary rupture plane is not possible. 5.4 Rupture Toward the Nodal Plane Intersection The following eight earthquakes listed display rupture directivity toward the intersection of the nodal planes. Because rupture is toward the nodal plane intersection, neither plane may be identified as the primary rupture plane. If rupture directivity for either plane demonstrates a more rigorous identification, it will be termed the preferred rupture plane. On July 21, 1994, MW 7.3 earthquake occurred at 471 km (Figure A1). Station distribution for this event is well dispersed throughout the focal sphere and should not bias rupture directivity determination. Both the horizontal and vertical nodal planes are within the 95% confidence interval for this event. Synthetics (Figures A2 A3) along the horizontal and vertical nodal planes do not distinguish which plane rupture occurred on. This earthquake has included in previous investigations of deep earthquakes [Warren and Silver, 2006; Tibi et al., 2003; Chen et al., 1996; Antolik et al., 1999] where rupture was determined to be along the shallow dipping nodal plane. On April 8, 1999, MW 7.1 earthquake occurred at 565 km (Figure A22). Rupture directivity on both nodal planes is along the edge of the 80% confidence interval. Station distribution for this event is well dispersed throughout the focal sphere and does not bias directivity results. Synthetic seismograms (Figures A23 A24) for both the horizontal and vertical nodal planes replicate the rupture of the earthquake. This event has been previously investigated by Tibi et al. [2003], who found rupture along the subhorizontal plane. 29
42 On December 22, 2000, MW 6.2 earthquake occurred at 140 km (Figure A25). Rupture on the horizontal nodal plane is within the 95% confidence interval while rupture on the vertical nodal plane is within the 80% confidence interval at the edge of the 95% interval. Seismic stations are distributed to the north and south of the epicenter. However, spatial distribution around the entire focal sphere is not good. Synthetic seismograms for this event were generated for rupture along both the horizontal and vertical nodal planes. Synthetics (Figures A26 A27) of the vertical nodal plane provide a slightly better replication of observed rupture for this event. From directivity results of this event it is possible to label the horizontal nodal plane as the primary plane of rupture. On April 26, 2001, MW 6.0 earthquake occurred at 86 km (Figure A28). Rupture along the horizontal and vertical nodal planes are within the 95% confidence interval. Station distribution for the event is concentrated to the northwest of the epicenter and may represent a slight bias on the directivity results. Synthetics (Figures A29 A30) generated for this event replicate the actual rupture when along the vertical nodal plane. From this it is possible to label the vertical plane as the preferred rupture plane. On December 2, 2001, MW 6.5 earthquake occurred at 123 km (Figure A31). Rupture along the horizontal nodal plane is within the 95% confidence interval while rupture along the vertical nodal plane is within the 80% confidence interval. Station distribution for the event is good. Synthetics (Figures A32 A33) for rupture along the horizontal nodal plane are a better match to the data than synthetics for the vertical nodal plane. These results of directivity indicate the horizontal nodal plane as the primary rupture plane. On June 28, 2002, MW 7.3 earthquake occurred at 566 km (Figure A34). Rupture directivity on both nodal planes is well outside of the 80% confidence interval. Station distribution for this event is well dispersed throughout the focal sphere and not considered to bias directivity results. Synthetic seismograms (Figures A35 A36) for the horizontal nodal plane replicate the rupture of the earthquake. 30
43 From the synthetic data it is possible to label the horizontal nodal plane as the primary rupture plane. This result of rupture along the subhorizontal plane is in agreement with previous studies [Tibi et al., 2003]. On September 21, 2005, MW 6.1 earthquake occurred at 103 km (Figure A40). Rupture on the vertical plane is within the 95% confidence interval while rupture on the horizontal plane is within the 80% confidence interval. The confidence intervals identify the vertical plane as the preferred rupture plane. Synthetic seismograms (Figures A41 A42) of rupture along the vertical nodal plane provide a better representation than rupture along the horizontal nodal plane. From the available data and calculation of synthetic seismograms, the vertical nodal plane is considered the primary rupture plane. Station distribution for this event is confined in a narrow region to the north and west of the epicenter which, may bias results. On July 16, 2007, MW 6.8 earthquake occurred at 350 km (Figure A46). Rupture on both the northeast and northwest dipping nodal planes are within the 95% confidence interval. Synthetics (Figures A47 A48) for rupture along the northwest dipping nodal plane match the actual rupture pattern better than rupture along the northeast dipping nodal plane. Because rupture was replicated more clearly from the northwest dipping nodal plane, it is labeled the primary rupture plane. 5.6 Inconclusive Results Rupture directivity of an earthquake must propagate along a nodal plane. A bias is observed when recovered directivity is not along a nodal plane. Despite the robust methodology developed by Warren and Silver [2006], possible limitations in determining rupture directivity remain. Of the twenty earthquakes with identified rupture directivity, the determined rupture vectors for two earthquakes are not along nodal planes. Since rupture directivity must be along a nodal plane, these events represent some bias. Biases may include poor station distribution, relatively no change in P-wave duration, signal contamination, or improper methodology. 31
44 On August 31, 1994, MW 6.2 earthquake occurred at a depth of 76 km (Figure A4). Directivity was identified not on a nodal plane. Subhorizontal rupture along the southeast-dipping plane is within the 95% confidence interval. Station distribution for this earthquake is concentrated to the western portion of the focal mechanism, presenting a possible bias. Neither set of synthetics (Figures A5 A6) calculated for this event provide a good representation of the observed rupture. On June 4, 2008, MW 5.7 earthquake occurred at a depth of 205 km (Figure A52). Directivity was identified not along a nodal plane. Rupture along the horizontal plane is located inside the 95% confidence interval. Vertical rupture is identified along the edge of the 95% confidence interval. Station distribution is poor and significantly clustered to the northeast and northwest. Synthetics generated for this earthquake show poor recovery for the vertical direction. The station distribution may have affected the recovery of synthetics for this event (Figures A53 A54). The subhorizontal rupture is located within the 95% confidence region. However, as rupture is not identified along the nodal plane, the primary rupture plane cannot be identified. Therefore, the preferred rupture plane for this event is the subhorizontal nodal plane. However, identification along the subhorizontal nodal plane is a possible result of bias. 32
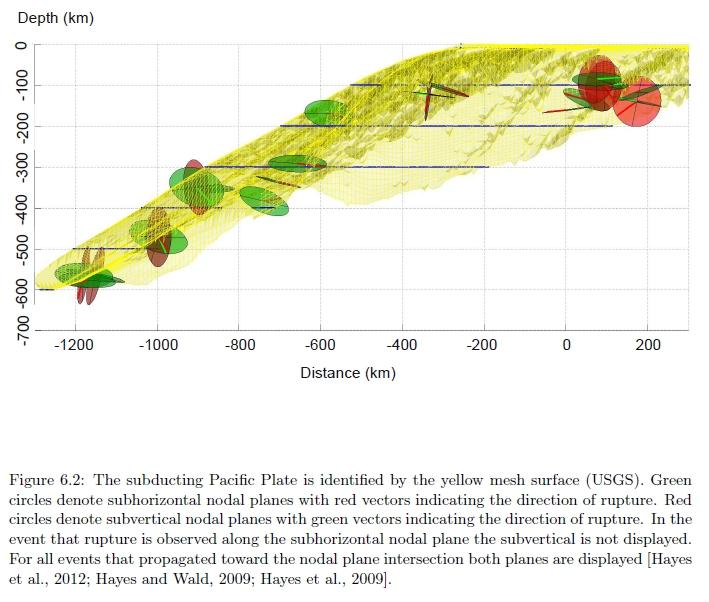
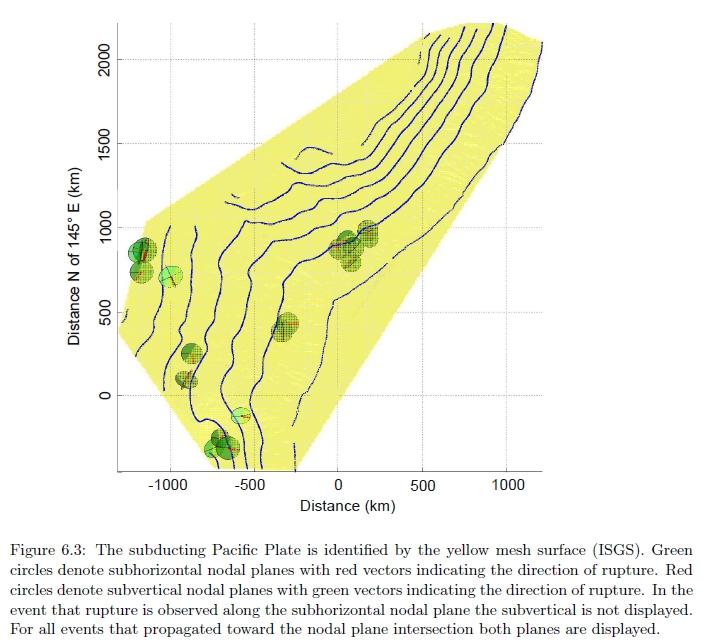
45 CHAPTER 6: Discussion 6.1 Summary In this study, fifty-two moderate to large (MW ) earthquakes are examined for rupture directivity to determine the nodal plane that slipped. Duration of P wave signals aligned relative to the take-off vector and station location were used to calculate the rupture directivity for each earthquake. Nodal planes for intermediate- and deep-focus earthquakes are generally observed to be in nearhorizontal and near-vertical orientations. Observing rupture directivity along one of these nodal planes identifies it as the fault-plane. When rupture propagates towards the intersection of the nodal planes determining which plane slipped cannot be ascertained with this method. The misfit value is one criterion in determining rupture directivity. Confidence intervals, rupture velocities, and synthetic seismograms generated for the subhorizontal and subvertical nodal planes are employed to determine the preferred rupture plane. Confidence intervals are calculated for each event in order to determine the most likely rupture vector. A nodal plane with the lowest misfit, < 0.85, is considered to be the primary rupture plane. If rupture directivity is in good agreement with the confidence region plotted on the focal sphere, has a reasonable velocity, and/or synthetic seismograms provide a reasonable replication of the actual rupture, the nodal plane is termed the preferred rupture plane. Figure 6.1 shows the recovered dip and azimuthal rupture direction for the eighteen events with identified rupture directivity. In Figure 6.2, each event is plotted positioned on the subducting slab. Figure 6.2 shows that events selected for this study are well distributed along the subducting slab. Throughout the subduction process subhorizontal planes are located at both intermediate and deepfocus depths. A map view of the subducting slab with earthquake locations is provided in Figure 6.3. Because directivity is calculated based on azimuthal as well as distance by a change in signal pulse duration, a lack of measurable change in signal duration would result in indeterminate rupture 33
46 34
47 35
48 36
49 directivity. Lack of directivity is apparent in thirty-two earthquakes examined in this study. Reasons of unresolved directivity can be due the quality of seismic records or effects due to signal-to-noise ratio. Higher earthquake magnitude, high signal-to-noise ratios, and ample station distribution provides the best results when determining directivity. 6.2 Conclusion Regardless of earthquake depth, analyzed earthquakes tend to rupture subhorizontally. A predominance of subhorizontal rupture has previously been observed for intermediate-depth earthquakes in Tonga-Kermadec, Izu-Bonin-Marianas, Middle America, and South America [Myhill and Warren, 2012; Warren et al., 2007, 2008]. For earthquakes at depths greater than 300 km a predominance of subhorizontal fault has also been observed in Izu-Bonin-Marianas [Myhill and Warren, 2001] whereas more varied fault orientations have been identified in Tonga-Kermadec [Warren et al., 2007]. Every subduction zone is comprised of a unique structure and history. Continued analysis of intermediate- and deep-focus earthquakes within subduction zones is beneficial for understanding the responses of different physical mechanisms at depth. Understanding earthquake mechanisms below shallow depths remains a fundamental subject of interest in geophysics. In this thesis, the NE Japan subduction zone was investigated for rupture directivity of intermediate- and deep-focus earthquakes. Examining rupture along fault planes provides clues to the physical mechanisms responsible for brittle failure. Focal mechanisms are used to represent the two nodal planes of an earthquake. As an earthquake ruptures, the nodal plane that slips is the fault plane. However, unlike at shallow depths, intermediate- and deep-focus earthquakes offer a significant complication in determining the faultplane orientations. Regardless of depth, rupture is observed primarily along the horizontal nodal plane. Three events are observed to rupture along the vertical nodal plane. However, subvertical events originally 37
50 are directed towards the intersection of the nodal plane resulting in preferred rupture planes in place of primary rupture planes. There is no apparent clustering of earthquake locations or fault plane orientations along the slab. Figure 6.2 shows that fault planes are oriented in a subhorizontal manner throughout the subducting slab. If rupture directivity or fault plane orientations are similar throughout subduction, uniform and consistent ambient stresses acting on the slab may be the cause. Variation of rupture directivity helps in determining the mechanisms behind brittle failures among subduction zones [Warren et al., 2008]. Continued rupture along the horizontal nodal plane may be the result of persistent stresses beginning at intermediate depths and continuing to deep depths. Azimuthal spread of rupture direction suggest the slab is capable of slipping in multiple directions. Rupture variations may also indicate differences in the composition of the slab affecting earthquake generation. Azimuthal station distribution and distance from the epicenter is key to resolving directivity of rupture [Myhill and Warren. 2010]. Eight earthquakes are identified to rupture in the direction of the nodal plane intersection. Three of the earthquakes with observed rupture towards the nodal plane intersection have preferred rupture directivity along the horizontal nodal plane. Examination of synthetic seismograms for these results shows that they replicate rupture along the horizontal nodal plane. In total, thirteen earthquakes are observed to rupture along the horizontal nodal plane. From the twenty earthquakes with observed directivity, there is no directly observable rupture along a vertical nodal plane. Three earthquakes with directivity toward the nodal plane intersection have preferred rupture along the vertical nodal plane. As these events are directed toward the intersection of the nodal planes, it is not possible to determine if rupture occurred along the subhorizontal nodal plane or horizontally along the subvertical nodal plane. The preferred subvertical earthquakes are located at intermediate-focus depths of 86 and 103 km. The third vertical rupture occurred at a deep-focus depth of 350 km. 38
51 From earthquake results with directivity towards the nodal plane intersection, two do not align with either nodal plane. Identification of the primary or preferred nodal plane is not possible for these earthquakes. Two earthquakes from the twenty identify the best fitting rupture direction. However, they are not located along a nodal plane. Because rupture propagation is not possible off of the nodal planes, these four earthquakes could be the result of an evaluation bias. These events are still beneficial as they provide an opportunity to examine possible limitations that can be used to improve upon the methodology or specific requirements in determining rupture directivity. While continued existence of outer-rise faults at the depth of deep earthquakes remains unknown, subhorizontal ruptures align with the corrected orientation of seaward-dipping fault planes. Through examining fault plane orientation several physical mechanisms are studied including reactivation of faults, dehydration reactions, phases changes, and responses to ambient stresses. At intermediate depths, subhorizontal rupture may be caused by increases in pore pressure generated by dehydration at depth. The preferential occurrence of subhorizontal rupture at intermediate depths indicates a somewhat uniform change with depth such as a dehydration reaction. While these theories provide possible explanations, deep fault plane orientations are aligned to release stresses efficiently from slab deformation. Therefore, deep earthquakes would be the result of reorientation of the slab from a resisting force, similar to shallow earthquakes at the beginning of subduction. Because directivity was toward the intersection of the nodal planes for numerous earthquakes in this study, rupture along the subhorizontal fault plane may not be the exclusive orientation of deep earthquakes. 39
52 Appendix A 40
53 41
54 42
55 43
56 44
57 45
58 46
59 47
60 48
61 49
62 50
63 51
64 52
65 53
66 54
67 55
68 56
69 57
70 58
71 59
72 60
73 61
74 62
Measurement of differential rupture durations as constraints on the source finiteness of deep-focus earthquakes
 JOURNAL OF GEOPHYSICAL RESEARCH, VOL. 111,, doi:10.1029/2005jb004001, 2006 Measurement of differential rupture durations as constraints on the source finiteness of deep-focus earthquakes Linda M. Warren
Fault plane orientations of deep earthquakes in the Izu-Bonin-Marianas subduction zone
 JOURNAL OF GEOPHYSICAL RESEARCH, VOL. 117,, doi:10.1029/2011jb009047, 2012 Fault plane orientations of deep earthquakes in the Izu-Bonin-Marianas subduction zone R. Myhill 1 and L. M. Warren 2 Received
The influence of short wavelength variations in viscosity on subduction dynamics
 1 Introduction Deformation within the earth, driven by mantle convection due primarily to cooling and subduction of oceanic lithosphere, is expressed at every length scale in various geophysical observations.
Source characteristics of large deep earthquakes: Constraint on the faulting mechanism at great depths
 JOURNAL OF GEOPHYSICAL RESEARCH, VOL. 108, NO. B2, 2091, doi:10.1029/2002jb001948, 2003 Source characteristics of large deep earthquakes: Constraint on the faulting mechanism at great depths Rigobert Tibi
Seismic Activity near the Sunda and Andaman Trenches in the Sumatra Subduction Zone
 IJMS 2017 vol. 4 (2): 49-54 International Journal of Multidisciplinary Studies (IJMS) Volume 4, Issue 2, 2017 DOI: http://doi.org/10.4038/ijms.v4i2.22 Seismic Activity near the Sunda and Andaman Trenches
Magnitude 8.3 SEA OF OKHOTSK
 A powerful earthquake in Russia's Far East was felt as far away as Moscow, about 7,000 kilometers (4,400 miles) west of the epicenter, but no casualties or damage were reported. The epicenter was in the
Plate Tectonics. Structure of the Earth
 Plate Tectonics Structure of the Earth The Earth can be considered as being made up of a series of concentric spheres, each made up of materials that differ in terms of composition and mechanical properties.
MECHANISM OF THE 2011 TOHOKU-OKI EARTHQUAKE: INSIGHT FROM SEISMIC TOMOGRAPHY
 Proceedings of the International Symposium on Engineering Lessons Learned from the 2011 Great East Japan Earthquake, March 1-4, 2012, Tokyo, Japan MECHANISM OF THE 2011 TOHOKU-OKI EARTHQUAKE: INSIGHT FROM
FULL MOMENT TENSOR ANALYSIS USING FIRST MOTION DATA AT THE GEYSERS GEOTHERMAL FIELD
 PROCEEDINGS, Thirty-Eighth Workshop on Geothermal Reservoir Engineering Stanford University, Stanford, California, February 11-13, 2013 SGP-TR-198 FULL MOMENT TENSOR ANALYSIS USING FIRST MOTION DATA AT
Sendai Earthquake NE Japan March 11, Some explanatory slides Bob Stern, Dave Scholl, others updated March
 Sendai Earthquake NE Japan March 11, 2011 Some explanatory slides Bob Stern, Dave Scholl, others updated March 14 2011 Earth has 11 large plates and many more smaller ones. Plates are 100-200 km thick
DOUBLE-PLANED STRUCTURE OF INTERMEDIATE- DEPTH SEISMIC ZONE AND THERMAL STRESS IN THE DESCENDING PLATE. (Received December 20, 1983)
") J. Phys. Earth, 31, 329-347, 1983 DOUBLE-PLANED STRUCTURE OF INTERMEDIATE- DEPTH SEISMIC ZONE AND THERMAL STRESS IN THE DESCENDING PLATE Hiroyuki HAMAGUCHI, Kazuhiko GOTO, and Ziro SUZUKI Geophysical Institute,
J. Phys. Earth, 31, 329-347, 1983 DOUBLE-PLANED STRUCTURE OF INTERMEDIATE- DEPTH SEISMIC ZONE AND THERMAL STRESS IN THE DESCENDING PLATE Hiroyuki HAMAGUCHI, Kazuhiko GOTO, and Ziro SUZUKI Geophysical Institute,
Magnitude 7.6 & 7.6 PERU
 Two deep 7.6 magnitude earthquakes have shaken a sparsely populated jungle region near the Peru-Brazil border in southeast Peru. There were no immediate reports of injuries or damage. The second M 7.6
Subduction zone dynamics: role of H 2 O in generation of earthquakes and magmas
 Subduction zone dynamics: role of H 2 O in generation of earthquakes and magmas Akira Hasegawa Research Center for Prediction of Earthquakes and Volcanic Eruptions Graduate School of Science, Tohoku University
Lecture 24: Convergent boundaries November 22, 2006
 Lecture 24: Convergent boundaries November 22, 2006 Convergent boundaries are characterized by consumption of oceaninc crust in subduction zones, with attendant arc volcanism, metamorphism and uplift.
GEOPHYSICAL RESEARCH LETTERS, VOL. 31, L19604, doi: /2004gl020366, 2004
 GEOPHYSICAL RESEARCH LETTERS, VOL. 31, L19604, doi:10.1029/2004gl020366, 2004 Characteristic seismic activity in the subducting plate boundary zone off Kamaishi, northeastern Japan, revealed by precise
GEOPHYSICAL RESEARCH LETTERS, VOL. 35, L14308, doi: /2008gl034461, 2008
 Click Here for Full Article GEOPHYSICAL RESEARCH LETTERS, VOL. 35,, doi:10.1029/2008gl034461, 2008 Tomographic evidence for hydrated oceanic crust of the Pacific slab beneath northeastern Japan: Implications
Magnitude 7.9 SE of KODIAK, ALASKA
 A magnitude 7.9 earthquake occurred at 12:31 am local time 181 miles southeast of Kodiak at a depth of 25 km (15.5 miles). There are no immediate reports of damage or fatalities. Light shaking from this
Seismotectonics of intraplate oceanic regions. Thermal model Strength envelopes Plate forces Seismicity distributions
 Seismotectonics of intraplate oceanic regions Thermal model Strength envelopes Plate forces Seismicity distributions Cooling of oceanic lithosphere also increases rock strength and seismic velocity. Thus
7.1 FIJI 1, :57:22 UTC
 A magnitude 7.1 earthquake struck 141 km (88 miles) northeast of Ndoi Island, Fiji, and 313 km (194 mi) west-northwest of Nuku alofa, Tonga according to the US Geological Survey, but there were no reports
RELOCATION OF THE MACHAZE AND LACERDA EARTHQUAKES IN MOZAMBIQUE AND THE RUPTURE PROCESS OF THE 2006 Mw7.0 MACHAZE EARTHQUAKE
 RELOCATION OF THE MACHAZE AND LACERDA EARTHQUAKES IN MOZAMBIQUE AND THE RUPTURE PROCESS OF THE 2006 Mw7.0 MACHAZE EARTHQUAKE Paulino C. FEITIO* Supervisors: Nobuo HURUKAWA** MEE07165 Toshiaki YOKOI** ABSTRACT
Material is perfectly elastic until it undergoes brittle fracture when applied stress reaches σ f
 Material is perfectly elastic until it undergoes brittle fracture when applied stress reaches σ f Material undergoes plastic deformation when stress exceeds yield stress σ 0 Permanent strain results from
Magnitude 8.2 FIJI. A magnitude 8.2 earthquake occurred km (226.7 mi) E of Suva, Fiji at a depth of km (350 miles).
 E of Suva, Fiji at a depth of km (350 miles).") A magnitude 8.2 earthquake occurred 364.8 km (226.7 mi) E of Suva, Fiji at a depth of 563.4 km (350 miles). There is no risk of a tsunami from an earthquake at this depth. Images courtesy of Google The
A magnitude 8.2 earthquake occurred 364.8 km (226.7 mi) E of Suva, Fiji at a depth of 563.4 km (350 miles). There is no risk of a tsunami from an earthquake at this depth. Images courtesy of Google The
Structural heterogeneity in the megathrust zone and mechanism of the 2011 Tohoku oki earthquake (Mw 9.0)
") GEOPHYSICAL RESEARCH LETTERS, VOL. 38,, doi:10.1029/2011gl048408, 2011 Structural heterogeneity in the megathrust zone and mechanism of the 2011 Tohoku oki earthquake (Mw 9.0) Dapeng Zhao, 1 Zhouchuan
GEOPHYSICAL RESEARCH LETTERS, VOL. 38,, doi:10.1029/2011gl048408, 2011 Structural heterogeneity in the megathrust zone and mechanism of the 2011 Tohoku oki earthquake (Mw 9.0) Dapeng Zhao, 1 Zhouchuan
Centroid moment-tensor analysis of the 2011 Tohoku earthquake. and its larger foreshocks and aftershocks
 Earth Planets Space, 99, 1 8, 2011 Centroid moment-tensor analysis of the 2011 Tohoku earthquake and its larger foreshocks and aftershocks Meredith Nettles, Göran Ekström, and Howard C. Koss Lamont-Doherty
Magnitude 7.1 SOUTH SANDWICH ISLANDS
 A magnitude 7.1 earthquake occurred at a depth of 164.7 km (102 miles) in the South Sandwich Islands, an uninhabited British territory off the coast of Argentina in the southern Atlantic Ocean. Antarctica
Teleseismic waveform modelling of the 2008 Leonidio event
 The 6 January 2008 (Mw6.2) Leonidio (southern Greece) intermediate depth earthquake: teleseismic body wave modelling Anastasia Kiratzi and Christoforos Benetatos Department of Geophysics, Aristotle University
Earthquakes. Forces Within Eartth. Faults form when the forces acting on rock exceed the rock s strength.
 Earthquakes Vocabulary: Stress Strain Elastic Deformation Plastic Deformation Fault Seismic Wave Primary Wave Secondary Wave Focus Epicenter Define stress and strain as they apply to rocks. Distinguish
Spatio-temporal variation in slip rate on the plate boundary off Sanriku, northeastern Japan, estimated from small repeating earthquakes
 Spatio-temporal variation in slip rate on the plate boundary off Sanriku, northeastern Japan, estimated from small repeating earthquakes T. Matsuzawa, N. Uchida, T. Igarashi *, N. Umino, and A. Hasegawa
of other regional earthquakes (e.g. Zoback and Zoback, 1980). I also want to find out
. I also want to find out") 4. Focal Mechanism Solutions A way to investigate source properties of the 2001 sequence is to attempt finding well-constrained focal mechanism solutions to determine if they are consistent with those
4. Focal Mechanism Solutions A way to investigate source properties of the 2001 sequence is to attempt finding well-constrained focal mechanism solutions to determine if they are consistent with those
CONTENT. A. Changes in the Crust Facts Changes Construction and Destruction. B. Continental Drift What is it? Evidence
 Name Earth Science Date Period TOPIC THE DYNAMIC EARTH CONTENT A. Changes in the Crust Facts Changes Construction and Destruction B. Continental Drift What is it? Evidence C. Theory of Plate Tectonics
Kinematic Waveform Inversion Study of Regional Earthquakes in Southwest Iberia
 Kinematic Waveform Inversion Study of Regional Earthquakes in Southwest Iberia Ana Domingues Under supervision of Prof. João Fonseca and Dr. Susana Custódio Dep. Physics, IST, Lisbon, Portugal November
Topic 5: The Dynamic Crust (workbook p ) Evidence that Earth s crust has shifted and changed in both the past and the present is shown by:
 Evidence that Earth s crust has shifted and changed in both the past and the present is shown by:") Topic 5: The Dynamic Crust (workbook p. 65-85) Evidence that Earth s crust has shifted and changed in both the past and the present is shown by: --sedimentary horizontal rock layers (strata) are found
Topic 5: The Dynamic Crust (workbook p. 65-85) Evidence that Earth s crust has shifted and changed in both the past and the present is shown by: --sedimentary horizontal rock layers (strata) are found
A magnitude 7.8 earthquake has occurred km (63.3 mi) ESE of Suva, Fiji at a depth of km (378 miles).
 ESE of Suva, Fiji at a depth of km (378 miles).") A magnitude 7.8 earthquake has occurred 101.8 km (63.3 mi) ESE of Suva, Fiji at a depth of 608.6 km (378 miles). There is no risk of a tsunami from an earthquake at this depth. Images courtesy of Google
A magnitude 7.8 earthquake has occurred 101.8 km (63.3 mi) ESE of Suva, Fiji at a depth of 608.6 km (378 miles). There is no risk of a tsunami from an earthquake at this depth. Images courtesy of Google
Magnitude 7.0 NEW CALEDONIA
 A magnitude 7.0 earthquake has occurred 82km ENE of Maré Island, the secondlargest of the Loyalty Islands in the archipelago of New Caledonia. The initial report of the magnitude and shallow 10km depth
Plate Tectonics. entirely rock both and rock
 Plate Tectonics I. Tectonics A. Tectonic Forces are forces generated from within Earth causing rock to become. B. 1. The study of the origin and arrangement of Earth surface including mountain belts, continents,
Slab pull, slab weakening, and their relation to deep intra-slab seismicity
 GEOPHYSICAL RESEARCH LETTERS, VOL. 32, L14305, doi:10.1029/2005gl022922, 2005 Slab pull, slab weakening, and their relation to deep intra-slab seismicity Susan L. Bilek Earth and Environmental Science
Magnitude 7.0 PERU. This region of the Andes is a sparsely populated area, there were no immediate reports of injuries or damage.
 A magnitude 7.0 earthquake occurred in southeastern Peru on Friday about 27 kilometers northeast of the town of Azángaro, Peru, near the border with Bolivia. The earthquake occurred at a depth of 257.4
Internal Layers of the Earth
 Lecture #4 notes Geology 3950, Spring 2006; CR Stern Seismic waves, earthquake magnitudes and location, and internal earth structure (pages 28-95 in the 4 th edition and 28-32 and 50-106 in the 5 th edition)
GEOLOGY MEDIA SUITE Chapter 13
 UNDERSTANDING EARTH, SIXTH EDITION GROTZINGER JORDAN GEOLOGY MEDIA SUITE Chapter 13 Earthquakes 2010 W.H. Freeman and Company Three different types of seismic waves are recorded by seismographs Key Figure
Plate Tectonics. Earth has distinctive layers - Like an onion
 Plate Tectonics Earth has distinctive layers - Like an onion Earth s Interior Core: Metallic (Iron, Nickel) Inner (hot, solid, dense, Iron, Nickel) Outer (cooler, liquid, less dense) Crust (outermost layer):
An intermediate deep earthquake rupturing on a dip-bending fault: Waveform analysis of the 2003 Miyagi-ken Oki earthquake
 GEOPHYSICAL RESEARCH LETTERS, VOL. 31, L24619, doi:10.1029/2004gl021228, 2004 An intermediate deep earthquake rupturing on a dip-bending fault: Waveform analysis of the 2003 Miyagi-ken Oki earthquake Changjiang
Multi-station Seismograph Network
 Multi-station Seismograph Network Background page to accompany the animations on the website: IRIS Animations Introduction One seismic station can give information about how far away the earthquake occurred,
Section Forces Within Earth. 8 th Grade Earth & Space Science - Class Notes
 Section 19.1 - Forces Within Earth 8 th Grade Earth & Space Science - Class Notes Stress and Strain Stress - is the total force acting on crustal rocks per unit of area (cause) Strain deformation of materials
Moho (Mohorovicic discontinuity) - boundary between crust and mantle
 - boundary between crust and mantle") Earth Layers Dynamic Crust Unit Notes Continental crust is thicker than oceanic crust Continental Crust Thicker Less Dense Made of Granite Oceanic Crust Thinner More Dense Made of Basalt Moho (Mohorovicic
Earth Layers Dynamic Crust Unit Notes Continental crust is thicker than oceanic crust Continental Crust Thicker Less Dense Made of Granite Oceanic Crust Thinner More Dense Made of Basalt Moho (Mohorovicic
Earthquakes and Earthquake Hazards Earth - Chapter 11 Stan Hatfield Southwestern Illinois College
 Earthquakes and Earthquake Hazards Earth - Chapter 11 Stan Hatfield Southwestern Illinois College What Is an Earthquake? An earthquake is the vibration of Earth, produced by the rapid release of energy.
The Mechanics of Earthquakes and Faulting
 The Mechanics of Earthquakes and Faulting Christopher H. Scholz Lamont-Doherty Geological Observatory and Department of Earth and Environmental Sciences, Columbia University 2nd edition CAMBRIDGE UNIVERSITY
4 Deforming the Earth s Crust
 CHAPTER 7 4 Deforming the Earth s Crust SECTION Plate Tectonics BEFORE YOU READ After you read this section, you should be able to answer these questions: What happens when rock is placed under stress?
Continental Drift and Plate Tectonics
 Continental Drift and Plate Tectonics Continental Drift Wegener s continental drift hypothesis stated that the continents had once been joined to form a single supercontinent. Wegener proposed that the
Centroid-moment-tensor analysis of the 2011 off the Pacific coast of Tohoku Earthquake and its larger foreshocks and aftershocks
 LETTER Earth Planets Space, 63, 519 523, 2011 Centroid-moment-tensor analysis of the 2011 off the Pacific coast of Tohoku Earthquake and its larger foreshocks and aftershocks Meredith Nettles, Göran Ekström,
Seismic Source Mechanism
 Seismic Source Mechanism Yuji Yagi (University of Tsukuba) Earthquake Earthquake is a term used to describe both failure process along a fault zone, and the resulting ground shaking and radiated seismic
TSUNAMI CHARACTERISTICS OF OUTER-RISE EARTHQUAKES ALONG THE PACIFIC COAST OF NICARAGUA - A CASE STUDY FOR THE 2016 NICARAGUA EVENT-
 TSUNAMI CHARACTERISTICS OF OUTER-RISE EARTHQUAKES ALONG THE PACIFIC COAST OF NICARAGUA - A CASE STUDY FOR THE 2016 NICARAGUA EVENT- Amilcar Cabrera Supervisor: Yuichiro TANIOKA MEE16718 ABSTRACT Nicaragua
MAR110 Lecture #5 Plate Tectonics-Earthquakes
 1 MAR110 Lecture #5 Plate Tectonics-Earthquakes Figure 5.0 Plate Formation & Subduction Destruction The formation of the ocean crust from magma that is upwelled into a pair of spreading centers. Pairs
Dynamic Triggering Semi-Volcanic Tremor in Japanese Volcanic Region by The 2016 Mw 7.0 Kumamoto Earthquake
 Dynamic Triggering Semi-Volcanic Tremor in Japanese Volcanic Region by The 016 Mw 7.0 Kumamoto Earthquake Heng-Yi Su 1 *, Aitaro Kato 1 Department of Earth Sciences, National Central University, Taoyuan
Magnitude 7.5 PALU, INDONESIA
 A magnitude 7.5 earthquake occurred 80.8 km (50.2 mi) north of Palu, Indonesia at a depth of 10 km (6.2 miles). This earthquake triggered a tsunami with wave heights up to 2 m (6.6 ft) that an official
Apparent Slow Oceanic Transform Earthquakes Due to Source Mechanism Bias
 Apparent Slow Oceanic Transform Earthquakes Due to Source echanism Bias Kimberly Schramm and Seth Stein Kimberly Schramm 1 and Seth Stein Northwestern University INTRODUCTION Slow earthquakes, characterized
Topic 12: Dynamic Earth Pracatice
 Name: Topic 12: Dynamic Earth Pracatice 1. Earth s outer core is best inferred to be A) liquid, with an average density of approximately 4 g/cm 3 B) liquid, with an average density of approximately 11
Earthquakes. Earthquakes and Earth s Interior Earth Science, 13e Chapter 8. Elastic rebound. Earthquakes. Earthquakes 11/19/2014.
 and Earth s Interior Earth Science, 13e Chapter 8 Stanley C. Hatfield Southwestern Illinois College General features Vibration of Earth produced by the rapid release of energy Associated with movements
Development of a Predictive Simulation System for Crustal Activities in and around Japan - II
 Development of a Predictive Simulation System for Crustal Activities in and around Japan - II Project Representative Mitsuhiro Matsu'ura Graduate School of Science, The University of Tokyo Authors Mitsuhiro
SUPPLEMENTAL INFORMATION
 GSA DATA REPOSITORY 2013310 A.M. Thomas et al. MOMENT TENSOR SOLUTIONS SUPPLEMENTAL INFORMATION Earthquake records were acquired from the Northern California Earthquake Data Center. Waveforms are corrected
Velocity-Interface Structure of the Southwestern Ryukyu Subduction Zone from EW OBS/MCS Data
 Marine Geophysical Researches 22: 265-287, 2001. 2002 Kluwer Academic Publishers. Printed in the Netherlands. Velocity-Interface Structure of the Southwestern Ryukyu Subduction Zone from EW9509-1 OBS/MCS
Widespread Ground Motion Distribution Caused by Rupture Directivity during the 2015 Gorkha, Nepal Earthquake
 Widespread Ground Motion Distribution Caused by Rupture Directivity during the 2015 Gorkha, Nepal Earthquake Kazuki Koketsu 1, Hiroe Miyake 2, Srinagesh Davuluri 3 and Soma Nath Sapkota 4 1. Corresponding
Performance of the GSN station KONO-IU,
 Performance of the GSN station KONO-IU, 1991-2009 A report in a series documenting the status of the Global Seismographic Network WQC Report 2010:9 February 28, 2010 Göran Ekström and Meredith Nettles
27th Seismic Research Review: Ground-Based Nuclear Explosion Monitoring Technologies
 SEISMIC SOURCE AND PATH CALIBRATION IN THE KOREAN PENINSULA, YELLOW SEA, AND NORTHEAST CHINA Robert B. Herrmann 1, Young-Soo Jeon 1, William R. Walter 2, and Michael E. Pasyanos 2 Saint Louis University
UNIT - 7 EARTHQUAKES
 UNIT - 7 EARTHQUAKES WHAT IS AN EARTHQUAKE An earthquake is a sudden motion or trembling of the Earth caused by the abrupt release of energy that is stored in rocks. Modern geologists know that most earthquakes
INTRODUCTION TO EARTHQUAKES
 INTRODUCTION TO EARTHQUAKES Seismology = Study of earthquakes Seismologists = Scientists who study earthquakes Earthquake = Trembling or shaking of the earth s surface, usually as a result of the movement
GEOPHYSICAL RESEARCH LETTERS, VOL. 37, L02304, doi: /2009gl041835, 2010
 Click Here for Full Article GEOPHYSICAL RESEARCH LETTERS, VOL. 37,, doi:10.1029/2009gl041835, 2010 Seismic structure of the Longmen Shan region from S wave tomography and its relationship with the Wenchuan
Section 19.1: Forces Within Earth Section 19.2: Seismic Waves and Earth s Interior Section 19.3: Measuring and Locating.
 CH Earthquakes Section 19.1: Forces Within Earth Section 19.2: Seismic Waves and Earth s Interior Section 19.3: Measuring and Locating Earthquakes Section 19.4: Earthquakes and Society Section 19.1 Forces
Structure of the Earth and the Origin of Magmas
 Page 1 of 12 EENS 2120 Petrology Tulane University Prof. Stephen A. Nelson Structure of the Earth and the Origin of Magmas This document last updated on 23-Jan-2015 Magmas do not form everywhere beneath
Magnitude 7.0 VANUATU
 A major earthquake struck in the southwest Pacific Ocean at a depth of 27 km beneath the island of Melampa in the Vanuatu island chain. There are no reports of damage. The Modified Mercalli Intensity (MMI)
Seismic ray path variations in a 3D global velocity model
 Physics of the Earth and Planetary Interiors 141 (2004) 153 166 Seismic ray path variations in a 3D global velocity model Dapeng Zhao, Jianshe Lei Geodynamics Research Center, Ehime University, Matsuyama
Coseismic slip distribution of the 2005 off Miyagi earthquake (M7.2) estimated by inversion of teleseismic and regional seismograms
 estimated by inversion of teleseismic and regional seismograms") Coseismic slip distribution of the 2005 off Miyagi earthquake (M7.2) estimated by inversion of teleseismic and regional seismograms Tadashi Yaginuma 1, Tomomi Okada 1, Yuji Yagi 2, Toru Matsuzawa 1, Norihito
Coseismic slip distribution of the 2005 off Miyagi earthquake (M7.2) estimated by inversion of teleseismic and regional seismograms Tadashi Yaginuma 1, Tomomi Okada 1, Yuji Yagi 2, Toru Matsuzawa 1, Norihito
AVERAGE AND VARIATION OF FOCAL MECHANISM AROUND TOHOKU SUBDUCTION ZONE
 13 th World Conference on Earthquake Engineering Vancouver, B.C., Canada August 1-6, 24 Paper No. 414 AVERAGE AND VARIATION OF FOCAL MECHANISM AROUND TOHOKU SUBDUCTION ZONE Shunroku YAMAMOTO 1 Naohito
The M7.1 May 26, 2003 off-shore Miyagi Prefecture Earthquake in northeast Japan: Source process and aftershock distribution of an intra-slab event
 Earth Planets Space, 55, 731 739, 2003 The M7.1 May 26, 2003 off-shore Miyagi Prefecture Earthquake in northeast Japan: Source process and aftershock distribution of an intra-slab event Tomomi Okada and
The Structure of the Earth and Plate Tectonics
 The Structure of the Earth and Plate Tectonics Agree or Disagree? 1. The Earth if made up of 4 different layers. 2. The crust (where we live) can be made of either less dense continental crust or the more
Geo736: Seismicity along mid-ocean ridges
 Geo736: Seismicity along mid-ocean ridges Course Notes: S. G. Wesnousky Spring 2018 Bathymetric maps show the ocean basins of the world are characteristically divided by a bathymetric ridge. The bathymetric
Cambridge University Press Deep Earthquakes Cliff Frohlich Excerpt More information. Part I. Background and introductory material
 Part I Background and introductory material 1 The big, the bad, and the curious If you asked most seismologists for a brief summary of what they know about intermediate- and deep-focus earthquakes, they
Lab 2: Plate tectonics
 Geology 101 Name(s): Lab 2: Plate tectonics Plate tectonics is the theory that is used to explain geological phenomena worldwide. For this reason, most of the useful maps that illustrate plate tectonics
Application of Phase Matched Filtering on Surface Waves for Regional Moment Tensor Analysis Andrea Chiang a and G. Eli Baker b
 1 2 3 4 5 6 7 8 9 10 11 12 13 14 15 16 17 18 19 20 21 22 23 24 25 26 27 28 29 30 31 Application of Phase Matched Filtering on Surface Waves for Regional Moment Tensor Analysis Andrea Chiang a and G. Eli
Magnitude 7.1 NEAR THE EAST COAST OF HONSHU, JAPAN
 Japan was rattled by a strong aftershock and tsunami warning Thursday night nearly a month after a devastating earthquake and tsunami flattened the northeastern coast. This earthquake can be considered
FOCAL MECHANISM DETERMINATION USING WAVEFORM DATA FROM A BROADBAND STATION IN THE PHILIPPINES
 FOCAL MECHANISM DETERMINATION USING WAVEFORM DATA FROM A BROADBAND STATION IN THE PHILIPPINES Vilma Castillejos Hernandez Supervisor: Tatsuhiko Hara MEE10508 ABSTRACT We performed time domain moment tensor
Dynamic Crust Practice
 1. Base your answer to the following question on the cross section below and on your knowledge of Earth science. The cross section represents the distance and age of ocean-floor bedrock found on both sides
Physics and Chemistry of the Earth and Terrestrial Planets
 MIT OpenCourseWare http://ocw.mit.edu 12.002 Physics and Chemistry of the Earth and Terrestrial Planets Fall 2008 For information about citing these materials or our Terms of Use, visit: http://ocw.mit.edu/terms.
Plate Tectonics: The New Paradigm
 Earth s major plates Plate Tectonics: The New Paradigm Associated with Earth's strong, rigid outer layer: Known as the lithosphere Consists of uppermost mantle and overlying crust Overlies a weaker region
SUPPLEMENTARY INFORMATION
 doi:10.1038/nature11492 Figure S1 Short-period Seismic Energy Release Pattern Imaged by F-net. (a) Locations of broadband seismograph stations in Japanese F-net used for the 0.5-2.0 Hz P wave back-projection
Source Characteristics of Large Outer Rise Earthquakes in the Pacific Plate
 Source Characteristics of Large Outer Rise Earthquakes in the Pacific Plate T. Sasatani, N. Takai, M. Shigefuji, and Y. Miyahara Hokkaido University, Sapporo, Japan W. Kawabata Electric Power Development
UNIT 6 PLATE TECTONICS
 UNIT 6 PLATE TECTONICS CONTINENTAL DRIFT Alfred Wegner proposed the theory that the crustal plates are moving over the mantle. He argued that today s continents once formed a single landmass, called Pangaea
Answers: Internal Processes and Structures (Isostasy)
") Answers: Internal Processes and Structures (Isostasy) 1. Analyse the adjustment of the crust to changes in loads associated with volcanism, mountain building, erosion, and glaciation by using the concept
Answers: Internal Processes and Structures (Isostasy) 1. Analyse the adjustment of the crust to changes in loads associated with volcanism, mountain building, erosion, and glaciation by using the concept
LETTER Earth Planets Space, 56, , 2004
 LETTER Earth Planets Space, 56, 353 357, 2004 Deep seismic activities preceding the three large shallow earthquakes off south-east Hokkaido, Japan the 2003 Tokachi-oki earthquake, the 1993 Kushiro-oki
Global Tectonics. Kearey, Philip. Table of Contents ISBN-13: Historical perspective. 2. The interior of the Earth.
 Global Tectonics Kearey, Philip ISBN-13: 9781405107778 Table of Contents Preface. Acknowledgments. 1. Historical perspective. 1.1 Continental drift. 1.2 Sea floor spreading and the birth of plate tectonics.
Magnitude 7.1 PERU. There are early reports of homes and roads collapsed leaving one dead and several dozen injured.
 A magnitude 7.1 earthquake has occurred offshore Peru. The earthquake struck just after 4 a.m. local time and was centered near the coast of Peru, 40 km (25 miles) south-southwest of Acari, Peru at a depth
overlie the seismogenic zone offshore Costa Rica, making the margin particularly well suited for combined land and ocean geophysical studies (Figure
 Chapter 1 Introduction Historically, highly destructive large magnitude (M w >7.0) underthrusting earthquakes nucleate along the shallow segment of subduction zone megathrust fault, and this region of
Magnitude 7.2 OAXACA, MEXICO
 A magnitude 7.2 earthquake has occurred in Oaxaca, Mexico at a depth of 24.6 km (15 miles). It was felt as far away as Guatemala. There have been no reported deaths directly linked to the earthquake. Emergency
UGRC 144 Science and Technology in Our Lives/Geohazards
 UGRC 144 Science and Technology in Our Lives/Geohazards Session 3 Understanding Earthquakes and Earthquake Hazards Lecturer: Dr. Patrick Asamoah Sakyi Department of Earth Science, UG Contact Information:
Insights into the mechanism of intermediate depth earthquakes from source properties as imaged by back projection of multiple seismic phases
 JOURNAL OF GEOPHYSICAL RESEARCH, VOL. 116,, doi:10.1029/2010jb007831, 2011 Insights into the mechanism of intermediate depth earthquakes from source properties as imaged by back projection of multiple
Module 7: Plate Tectonics and Earth's Structure Topic 4 Content : Earthquakes Presentation Notes. Earthquakes
 Earthquakes 1 Topic 4 Content: Earthquakes Presentation Notes Earthquakes are vibrations within the Earth produced by the rapid release of energy from rocks that break under extreme stress. Earthquakes
Earthquake patterns in the Flinders Ranges - Temporary network , preliminary results
 Earthquake patterns in the Flinders Ranges - Temporary network 2003-2006, preliminary results Objectives David Love 1, Phil Cummins 2, Natalie Balfour 3 1 Primary Industries and Resources South Australia
Long-term Crustal Deformation in and around Japan, Simulated by a 3-D Plate Subduction Model
 Long-term Crustal Deformation in and around Japan, Simulated by a 3-D Plate Subduction Model Chihiro Hashimoto (1) and Mitsuhiro Matsu ura (2) (1) Institute of Frontier Research for Earth Evolution, Japan
Earth and Space Science Semester 2 Exam Review. Part 1. - Convection currents circulate in the Asthenosphere located in the Upper Mantle.
 Earth and Space Science 2015 Semester 2 Exam Review Part 1 Convection -A form of heat transfer. - Convection currents circulate in the Asthenosphere located in the Upper Mantle. - Source of heat is from
Fault Length and Direction of Rupture Propagation for the 1993 Kushiro-Oki Earthquake as Derived from Strong Motion Duration
 Letter J. Phys. Earth, 41, 319-325, 1993 Fault Length and Direction of Rupture Propagation for the 1993 Kushiro-Oki Earthquake as Derived from Strong Motion Duration Yasuo Izutani Faculty of Engineering,
Earthquakes Chapter 19
 Earthquakes Chapter 19 Does not contain complete lecture notes. What is an earthquake An earthquake is the vibration of Earth produced by the rapid release of energy Energy released radiates in all directions