Insights into the mechanism of intermediate depth earthquakes from source properties as imaged by back projection of multiple seismic phases
|
|
|
- Chloe Jordan
- 6 years ago
- Views:
Transcription
1 JOURNAL OF GEOPHYSICAL RESEARCH, VOL. 116,, doi: /2010jb007831, 2011 Insights into the mechanism of intermediate depth earthquakes from source properties as imaged by back projection of multiple seismic phases E. Kiser, 1 M. Ishii, 1 C. H. Langmuir, 1 P. M. Shearer, 2 and H. Hirose 3 Received 7 July 2010; revised 14 March 2011; accepted 6 April 2011; published 28 June [1] This study investigates the spatial and temporal distribution of energy release of large, intermediate depth earthquakes using a modified back projection technique first used to study the 2004 Sumatra Andaman megathrust event. Multiple seismic phases are included in the back projection analysis, which provides the capability to determine the energy distribution with respect to depth and time. A total of 22 intermediate depth earthquakes with moment magnitudes greater than or equal to 6.5 are investigated with hypocentral depths between 100 and 300 km. For most of these events, the vertical extent of energy release is either below the resolution of this study ( 5 km) or slightly above ( 15 km). This observation agrees with previous studies that find large, intermediate depth earthquakes have subhorizontal rupture planes. The results also show a significant portion of the events have multiple rupture planes that are well separated in depth. The closeness in time of the ruptures on separate planes and the distance between the planes suggest dynamic triggering where the P waves from the first rupture initiate rupture on the second plane. We propose that a dehydration embrittlement mechanism combined with preferentially hydrated subhorizontal faults can explain the observations of dominant subhorizontal rupture planes and the frequent occurrence of rupture complexity involving multiple subevents. Citation: Kiser, E., M. Ishii, C. H. Langmuir, P. M. Shearer, and H. Hirose (2011), Insights into the mechanism of intermediatedepth earthquakes from source properties as imaged by back projection of multiple seismic phases, J. Geophys. Res., 116,, doi: /2010jb Department of Earth and Planetary Sciences, Harvard University, Cambridge, Massachusetts, USA. 2 Institute of Geophysics and Planetary Physics, Scripps Institution of Oceanography, University of California, San Diego, La Jolla, California, USA. 3 National Research Institute for Earth Science and Disaster Prevention, Tsukuba, Japan. Copyright 2011 by the American Geophysical Union /11/2010JB Introduction [2] Deep earthquakes occur at pressure and temperature conditions which should prohibit brittle failure, and yet many of the rupture characteristics of deep earthquakes are similar to those of shallow events, such as double couple focal mechanisms [Frohlich, 2006]. Traditionally, these earthquakes have been divided into two categories: intermediatedepth ( km) and deep focus ( km) events [e.g., Wadati, 1929]. This classification is motivated by the bimodal distribution in the number of earthquakes with depth, where an exponential decrease in the number of earthquakes occurs from 60 km to about 300 km followed by an increase between 400 and 600 km which quickly drops off between 650 and 700 km [e.g., Flinn and Engdahl, 1965; Frohlich, 1989]. Studies of source characteristics (e.g., rupture complexity and aftershock productivity) and conditions within the subducting slab (e.g., stability of hydrous minerals) also broadly support this division of deep earthquakes [e.g., Ringwood, 1975; Houston and Vidale, 1994; Persh and Houston, 2004]. In this paper, we focus on the intermediatedepth earthquakes occurring at depths between 100 and 300 km. [3] Many hypotheses have been proposed to explain the occurrence of intermediate depth earthquakes, such as dehydration embrittlement and shear localization [e.g., Raleigh and Paterson, 1965; Ogawa, 1987; Hobbs and Ord, 1988; Kirby et al., 1996; Hacker et al., 2003; Keleman and Hirth, 2007]. In addition to work from the mineral physics community, these hypotheses are developed and tested based upon earthquake source studies. Over the past 25 to 30 years, the source processes of both deep and shallow events have most commonly been determined using waveform modeling [e.g., Hartzell and Helmberger, 1982; Olsen and Apsel, 1982; Cohee and Beroza, 1994; Cotton and Campillo, 1995; Zeng and Anderson, 1996; Sekiguchi et al., 1996; Antolik et al., 1999; Ji et al., 2002; Frankel, 2004; Rhie et al., 2007]. Though this method has been widely used, many studies have revealed limitations associated with a priori constraints required to stabilize the inversion [Olsen and Apsel, 1982; Hartzell and Heaton, 1983; Beresnev, 2003; Lay et al., 2010; Mai et al., 2007]. For example, one of the conditions used 1of26
2 the depth time behavior of large (Mw 6.5) intermediatedepth earthquakes. 2. Method [5] The back projection technique is similar to other methods that also utilize the time reversal property of seismic waves [e.g., McMechan et al., 1985; Reitbrock and Scherbaum, 1994; Ekström et al., 2003; Kao and Shan, 2004, 2007; Baker et al., 2005; MacAyeal et al., 2006; Allmann and Shearer, 2007; Kao et al., 2008]. It was first used to study the 26 December 2004 Sumatra Andaman earthquake [Ishii et al., 2005], and has since been used to study many shallow earthquakes [e.g., Ishii et al., 2005, 2007; Walker et al., 2005; Walker and Shearer, 2009; Nelson et al., 2008; Honda and Aoi, 2009]. [6] The back projection method time reverses seismograms from an array to a grid of potential source locations around the hypocenter using predicted travel times based upon a onedimensional Earth model such as IASP91 [Kennett, 1991]. The seismograms are stacked at each grid point: s i ðþ¼ t XK u k ðt t ik Þ; k¼1 Figure 1. Distribution of the seismic stations (black triangles) in the High Sensitivity Seismograph Network (Hi net) array throughout Japan. As of 27 February 2010 there were 776 stations. in finite fault modeling is the fault plane geometry. Such constraints for shallow earthquakes are obtained based upon geologic studies or aftershock distributions [e.g., Olsen and Apsel, 1982]. For intermediate depth earthquakes, however, there is no surface expression of the rupture and often very few aftershocks [e.g., Frohlich, 1987], making detailed estimates on the rupture plane dimensions and orientation difficult. Instead, waveforms are typically inverted onto one of the nodal planes from the focal mechanism [e.g., Antolik et al., 1999]. This practice inherently limits the information that can be gained from source studies. [4] The back projection technique used in this study is a more deterministic approach to studying earthquake rupture because it requires very little a priori knowledge. This approach has become feasible in recent years through the availability of high quality data from large aperture dense arrays such as the High Sensitivity Seismograph Network (Hi net; Figure 1) in Japan [Okada et al., 2004; Obara et al., 2005]. The application of the back projection method to a number of large earthquakes has shown that it is a quick and efficient way to determine some important properties of earthquake sources, such as total slip area, rupture direction, and rupture velocity [e.g., Ishii et al., 2005, 2007; Walker et al., 2005; Walker and Shearer, 2009; Nelson et al., 2008; Honda and Aoi, 2009]. Previous studies of teleseismic events, however, analyzed data for the largest shallow earthquakes. In this manuscript, the back projection technique is modified to achieve good depth resolution to study where s i (t) is the stacked seismogram at the ith grid point, u k (t) is the seismogram recorded at the kth station, t ik is the predicted travel time between grid i and station k, and K is the total number of recorded seismograms. The grid points in this study are set up in three dimensions around the hypocenter, which makes it possible to study earthquake sources with respect to depth and lateral space. [7] The one dimensional Earth model does not include lateral variations which can produce deviations from the theoretical travel times. To correct for these lateral variations, we cross correlate the initial few seconds of the P waveforms between stations within the array and align the waveforms [Ishii et al., 2007]. This process empirically corrects for the lateral variations, and ensures a coherent stack at the hypocenter. The cross correlation also provides amplitude and polarity information for each seismogram with respect to a reference waveform. Including this information modifies the expression for the stacks to s i ðþ¼ t XK k u k ðt t ik þ Dt k Þ: k¼1 Here, Dt k is the empirical time correction for each station obtained from the cross correlation procedure, and a k is a weighting factor to ensure proper polarity and contribution from each trace. a k can be defined to consider various effects such as array geometry [e.g., Ishii et al., 2007], but the simplest form is k ¼ p k A k ; where p k is the polarity and A k is an amplitude factor for seismogram k. The factor p k has a value of either 1 or 1. The amplitude factor A k obtained during the cross correlation step normalizes all of the seismograms so that a small group of 2of26
3 high amplitude seismograms do not dominate the stacking process. [8] We have expanded the above basic back projection technique to include additional seismic wave arrivals. The use of multiple seismic phases can improve resolution, espe- Figure 2. The absolute amplitudes of the first 5 s of stacks from three seismic phases, (a) P, (b)pp, and(c)sp, atthe hypocenter after the time shifts (Dt j ) have been applied. These stacks are from the 8 September 2008, Mw 6.9 earthquake. Times are with respect to the hypocentral time. Figure 3. Effect of the taper function. (a) Seismic record from the 8 September 2008, Mw 6.9 event in Vanuatu. This record comes from station ASHH in the Hi net array. The P, pp, andsp seismic phases are all labeled. Time is with respect to the theoretical P wave arrival. (b) The same seismic record after the taper function (light grey line) is applied at the theoretical pp arrival time. (c) Same as Figure 3b except applied to sp. 3of26
4 the two phases are also similar enough that back projection using the depth phase arrival times will result in the depth phase stack that includes large amplitude signals due to the P wave arrival. In order to suppress such signals, a taper function f jk (t) is used to eliminate arrivals before the target phase. The taper function f jk (t) is defined as 8 0 ( " for t t j 0k T=2 1 f jk ðþ¼ t 2 cos 2 t t j # ) >< 0k þ 1 for t j 0k T T=2 < t < t j 0k ; >: 1 for t t j 0k j where t 0k is the predicted travel time of the jth phase to the kth station from the hypocenter, and T is the period of the cosine taper function that is prescribed. [10] Another step taken when combining seismic phases is to apply an additional weighting factor (w j ) to the stacks of each seismic phase, so that one phase does not dominate the final result. The weighting factor (w j ) can be expressed in many different ways, with the most basic form being w j ¼ Amax ref A max j : Figure 4. Synthetic seismogram. (a) A Ricker wavelet. (b) Example synthetic seismogram at station TBTH from a source at S, E, and 110 km depth. Time is with respect to the P wave arrival and noise is included with amplitude that is 10% of the input P wave. cially with respect to depth if depth phases are included, as demonstrated in subsequent sections. The seismograms are stacked for each phase based upon the predicted travel time and the time correction Dt k obtained for the reference phase. The stacks from multiple phases are combined such that s i ðþ¼ t XJ j¼1 X K k¼1 k u k t t j ik þ Dt k ; j where J is the total number of seismic phases used, and t ik is the predicted travel time for the jth seismic phase between the ith grid point and the kth station. [9] A few additional steps are taken to reduce unwanted signal and to enhance coherency between phase stacks. For example, the P wave for a relatively shallow earthquake arrives close to the depth phase pp, and its amplitude is typically much larger than the depth phase. The slownesses of Here, A max ref is the maximum amplitude of the reference phase stacks and A max j is the maximum amplitude of the stacks of the jth phase being considered. If a majority of the phases have upward or downward takeoff directions, there will be a bias in the contribution to back projected stacks if the above weighting factor is used. For example, when P, pp, and sp are used in the back projection analysis, there will be a bias in the upward takeoff direction. We therefore modify the weighting factor for the depth phases to w j ¼ c j P J l¼2 c l A max ref A max j where c j is the maximum correlation coefficient between the reference stack and the jth depth phase stack at the hypocenter. The summation in the denominator begins at 2 because this weighting factor is not being applied to the P phase. The above formulations are based upon maximum stack amplitudes. Alternatively, one can use the ratio of summed stacks or the amplitude information from a hypocentral stack cross correlation. We have investigated both of these approaches without any significant changes to the final results. [11] Finally, we apply the constraint that the stacks from different seismic phases sum coherently at the hypocenter. To accomplish this, a second empirical time shift (Dt j ) is obtained by cross correlating the different phase stacks against a reference phase stack at the hypocenter (Figure 2). Including these additional steps modifies the expression for the stacks at each grid point to s i ðþ¼ t XJ j¼1 w j X K k¼1 ; f jk ðþ t k u k t t j ik þ Dt k þ Dt j : 4of26

5 Figure 5. Lateral resolution. (a) Map view of the synthetic back projection result using only P waves from a point source at S, W, and 212 km depth. The white star is the location of the point source, the thin black and white lines are 10% contours of the integrated squared stack amplitudes, and the thick white line is the 75% contour curve used in subsequent figures to estimate the regions of slip. The background colors indicate high (black) and low (white) stack amplitudes. (b) Map view of the same back projection result as in Figure 5a, but using the P, pp, and sp phases. The stacks s i (t) give time and relative amplitude information of energy released by an earthquake, providing constraints on the rupture process. 3. Data and Data Processing [12] Implementation of the High Sensitivity Seismograph Network (Hi net) in Japan began after the Kobe earthquake in 1995, and data from the array have been available since October 2000 [Okada et al., 2004; Obara et al., 2005]. There are currently around 800 stations in this array with a targeted station spacing of 20 km (Figure 1). Borehole short period instruments (100 samples/s) are placed around 100 m depth. These sites are recording 3 components of ground motion, though only the vertical component is used in this study. Three phases are used in the back projection analysis: P, pp, and sp. As the subsequent section will show, the difference in takeoff direction between P and the depth phases, pp and sp, produces very good depth resolution when all three phases are combined. [13] In order to obtain the empirical correction for lateral variations in the velocity structure of the Earth, Dt k, a cross correlation analysis is applied to P waves. The waveforms are cross correlated in a 4 s time window, which is allowed to shift by ±2 s, around the predicted arrival times based upon the one dimensional velocity model IASP91 [Kennett and Engdahl, 1991]. A cluster analysis is applied [e.g., Romesburg, 1984] to identify the largest group of seismograms with high waveform similarity to generate the first reference stack. This reference stack is then cross correlated with each seismogram, as in the first step, and those with a correlation coefficient above 0.6 are stacked to produce the second reference stack. This step is repeated five times to generate a final reference stack. Each seismogram is then correlated with this final reference stack to obtain the polarity (p k ), the amplitude factor (A k ), and the relative time shift (D t k ). Only the first arriving P waves are cross correlated and the same time shifts are used to correct every seismic phase considered. The cross correlation technique can be applied to any individual seismic phase, but the depth phases (pp and sp) considered in this study typically have low signalto noise ratios, making the cross correlation procedure less effective. [14] The low signal to noise ratios of the depth phases compared to the P phase also demonstrate the necessity for using the taper function f jk (t). The taper function prevents the high amplitude P waves from contaminating the depth phase stacks (Figure 3). The period T over which the taper function goes from 1 to 0 is fixed at 10 s. Varying this value has little effect on the final results as long as it is a short enough time window to down weight the P waves and long enough to avoid generating artifacts due to an abrupt cutoff. The taper function can also suppress signals from the depth phases if these phases arrive significantly before the theoretical times. This possibility is evaluated by shifting the taper function gradually up to 5 s before the theoretical arrival time and monitoring the correlation coefficients between the P stack and depth phase stacks at the hypocenter. If the depth phase signal arrives earlier than predicted, then the shifted taper function should allow more of the depth phase signal to be present in the depth phase stacks. This would increase the correlation coefficient between the stacks at the hypocenter. In contrast, if the depth phase arrives at, or later than, the predicted time, then only noise and the P waveform is down weighted by the original taper function, leading to a lower correlation coefficient using the shifted taper function. Seven 5of26


6 Figure 6 6of26
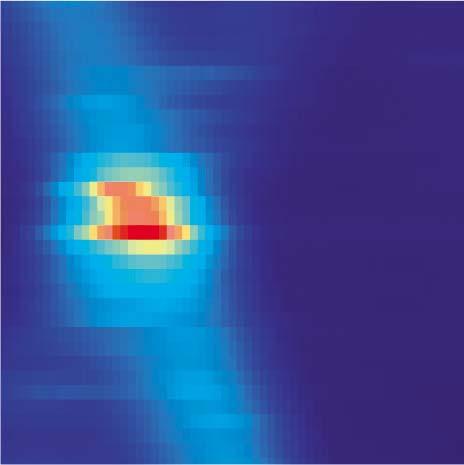
7 Table 1. Summary of the Tonga Kermadec Events Analyzed With the Back Projection Technique and the Hi net Data in Japan a Date and Time Latitude Longitude Depth Mw Number of Ruptures Rupture Depth Vertical Extent Event Duration Cumulative Duration Phases Used Figure 06/03/ pp,sp f 02:41: /04/ pp,sp e 07:06:31 07/27/ pp,sp a 02:04: /25/ sp d 11:43:11 05/16/ ; ; pp,sp c 10:39:23 12/09/ ; 187 0; pp,sp b 07:28:20 a The first five columns give hypocentral date and time (UTC), latitude, longitude, depth, and moment magnitude, obtained from the National Earthquake Information Center ( The column Number of Ruptures gives the number of subevents with a minimum of 15 km depth separation as described in the main text. For each subevent, the depth at its initiation is given in the Rupture Depth column. The depth extent for each subevent is resolved with the technique presented in this paper, and they are summarized in the Vertical Extent column, with the value given in increments of 5 km, and the sign indicating the direction, i.e., positive for downward propagation and negative for upward propagation. Subevents with both positive and negative entries indicate bivertical rupture. The following two columns give duration information inferred from the back projection results. The Event Duration is the duration of the entire event. In contrast, the Cumulative Duration gives the sum of the durations of subevents. Large differences between these two values indicate that there is significant overlap of the subevent ruptures in time. The Phases Used column shows the depth phases that have been combined with the P wave stacks. In most cases, both pp and sp phases are used, except when the source mechanism is such that pp is not excited well. The next to last column gives the value that represents the non double couple component of the event (see main text for definition). The final column gives the corresponding back projection plot for each earthquake. Note that on average, the uncertainties in depth and time are ±5 km and ±5.0 s, respectively. of the events have correlation coefficients for one of the depth phases that become larger when the shifted taper function is used, and therefore we choose to apply the shifted taper function in the back projection analysis for these cases. However, in general, shifting the taper function has little effect on the back projection results. [15] As discussed in the previous section, the form of the weighting factor for each phase w j can change depending on the seismic phases being used. There are five earthquakes for which one of the depth phases is predicted to have an amplitude much smaller than the P phase (10% or less) based upon Global CMT solutions [e.g., Dziewonski et al., 1981; Dziewonski and Woodhouse, 1983; Woodhouse and Dziewonski, 1984; Ekstöm et al., 2005]. For these events, only the higher amplitude depth phase is used with weighting specified by the basic weighting factor. Finally, the phasedependent time shift (Dt j ) is obtained by cross correlating the depth phase stacks at the hypocenter with the hypocentral P stack. 4. Synthetic Tests [16] In order to interpret results of this method, it is essential to understand how different steps described in the previous sections influence the final results. In general, we investigate artifacts of the technique by applying the back projection method to synthetic seismograms to determine how well the input source parameters are recovered. Synthetic seismographs are generated using a simple Ricker wavelet [Ricker, 1953, Figure 4a] with central frequency of Figure 6. Depth time resolution. The white stars are the depths and times of the point sources, and the white lines are 5% contours between 75% and 100% of the maximum value of the squared stack. Time is with respect to the hypocentral time and the background colors indicate high (black) and low (white) stack amplitudes. These plots are made by first creating comprehensive stacks at each depth by selecting the maximum stack amplitude at each time from all of the grid points at a particular depth. Following this, the squared amplitudes of the depth stacks are integrated in 10 s windows. The time interval is 1 s. (a) Synthetic back projection result of a point source located at S, W, and 212 km depth using only the P phase. Time is with respect to the hypocentral time and the background colors indicate high (black) and low (white) stack amplitudes. (b) Same as in Figure 6a except for results using only the pp phase. (c) Same as in Figure 6a except for results using only the sp phase. (d) Synthetic back projection result using all three seismic phases. (e) Synthetic result from three point sources (white stars) separated laterally and in time. This arrangement is meant to simulate a horizontal rupture plane. The three point sources are each separated by 5 km to the east and 1.4 s in time. This leads to a rupture velocity of 3.6 km/s in the horizontal direction. The result is obtained by using all three seismic phases considered in this study. (f) Synthetic result from three point sources (white stars) separated in depth and time using all three phases. This arrangement is meant to simulate a vertical plane with rupture propagation upward. The three point sources are each separated by 5 km in depth and 1.4 s in time, but have the same latitude and longitude. This leads to a rupture velocity of 3.6 km/s in the vertical direction. (g) Same as in Figure 6f except with propagation downward. (h) Synthetic result from three point sources (white stars) separated in longitude, depth, and time using all three seismic phases. This arrangement is meant to simulate a rupture dipping at 30 degrees. The three point sources are each separated by 8.7 km to the east, 5 km in depth, and 2.8 s in time. This setup is used so that the vertical extent (10 km) and rupture velocity (3.6 km/s) are the same as in Figure 6g. 7of26
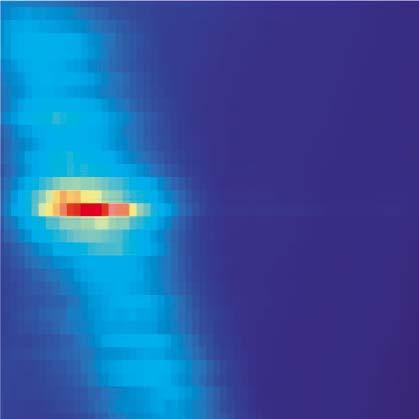
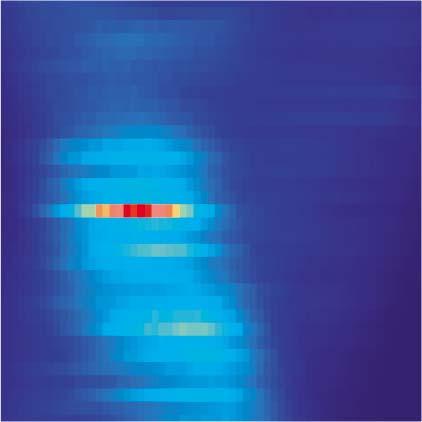
8 Table 2. Summary of the Vanuatu Events Analyzed With the Back Projection Technique and the Hi net Data in Japan. Date and Time Latitude Longitude Depth Mw Number of Ruptures Rupture Depth Vertical Extent Event Duration Cumulative Duration Phases Used Figure 01/09/ pp,sp c 16:49:28 11/06/ ; 138 5; pp,sp h 10:38:04 04/09/ pp,sp e 15:23: /08/ pp,sp b 14:48:21 08/07/ ; 179; ; 10; pp,sp d 22:18:55 08/01/ pp,sp g 17:08:51 09/08/ pp,sp a 18:52:06 03/04/ pp,sp f 14:02:27 Table 3. Summary of the Hindu Kush Events Analyzed With the Back Projection Technique and the Hi net Data in Japan Date and Time Latitude Longitude Depth Mw Number of Ruptures Rupture Depth Vertical Extent Event Duration Cumulative Duration Phases Used Figure 03/03/ ; ; sp a 12:08:19 04/05/ pp,sp c 21:24: /12/ pp,sp d 21:47: /03/ sp b 20:23: Table 4. Summary of the Java Events Analyzed With the Back Projection Technique and the Hi net Data in Japan Date and Time Latitude Longitude Depth Mw Number of Ruptures Rupture Depth Vertical Extent Event Duration Cumulative Duration Phases Used Figure 03/02/ ; ; pp,sp b 10:42:12 08/08/ pp,sp a 17:05: /24/ ; ; pp,sp c 14:40:43 Table 5. Summary of the Alaska Events Analyzed With the Back Projection Technique and the Hi net Data in Japan Date and Time Latitude Longitude Depth Mw Number of Ruptures Rupture Depth Vertical Extent Event Duration Cumulative Duration Phases Used Figure 07/28/ ; ; sp :32:43 8of26
 The raypaths of the P (black line), pp (dark grey), and sp (light grey) phases from the source (star) to the receiver (triangle).")
9 Figure 7. Seismic phases and distribution of intermediate depth earthquakes studied in this paper. (a) The raypaths of the P (black line), pp (dark grey), and sp (light grey) phases from the source (star) to the receiver (triangle). The difference in the takeoff directions between the P phase and depth phases (pp and sp) results in excellent vertical resolution when stacks from each phase are combined. (b) Locations of the 22 earthquakes studied (grey stars) relative to the Hi net array (white triangles). The black boxes are the areas displayed in Figures of26


10 Figure 8 10 of 26
11 1.0 Hz from a point source. The arrival times of the wavelets are determined for all stations in the Hi net array using a onedimensional velocity model of the Earth for a given source location (Figure 4b). This is done for all three seismic phases (P, pp, and sp) Lateral Resolution [17] A similar approach has been used to determine the lateral resolution in previous studies [e.g., Ishii et al., 2007]. These studies show that poor lateral resolution is caused by the imperfect azimuthal and distance coverage of the data being used. Figure 5a shows the back projection result for a single point source using only the P phase. The limited azimuthal coverage of the Hi net array leads to substantial lateral smearing. The amount of smearing varies greatly depending on the direction, the energy contour being used, and the array geometry with respect to the source location. For this study, the 75% contour is used to estimate the slip region. Using the same contour, a point source is broadened to an area of 3700 km 2. Improvements to the lateral resolution using multiple seismic phases are minimal with an area of 3300 km 2 inside the 75% contour (Figure 5b). As this synthetic test shows, lateral resolution is poor, and only the details of very large earthquakes can be obtained in these dimensions. For example, estimates of the minimum magnitude required for reliable constraints on horizontal properties, such as lateral rupture propagation, is Mw 7.4 in the Sumatra region using the Hi net data [Ishii et al., 2007],and most of the events considered in this study are smaller than this threshold Depth and Time Resolution [18] To illustrate the depth and time resolution, Figure 6 compares the depth time distribution of imaged energy from synthetic tests using individual phases, as well as combinations of phases. These results show that back projection of a single phase provides no depth resolution. The smearing in these cases is along the raypaths of the different phases (Figures 6a, 6b, and 6c). However, if the P phase is combined with one or both of the depth phases, the depth resolution improves dramatically to approximately ±5 km (Figure 6d). This uncertainty is valid for all earthquake locations considered in this study. The time resolution (±5 s) is also very consistent between different source locations. These tests show that results are most reliable in depth and time, hence we focus our discussion and interpretation of the earthquakes in these two dimensions Synthetic Ruptures in Depth and Time [19] In addition to determining the resolution of a point source, it is critical to understand how well back projection can image an earthquake rupture and the appearance of this rupture in the depth time projection we have chosen. To address this, multiple point sources separated in space and time are used to simulate a propagating rupture. Figures 6e 6h show results of four synthetic tests. For all four of these synthetic tests, the locations and times of the three point sources are assigned to simulate a rupture velocity of 3.6 km/s (80% of the shear wave speed [Kennett and Engdahl, 1991]). The horizontal rupture result in Figure 6e shows that this rupture looks similar to a point source result, however, the duration reflects the input source duration. The two vertical ruptures in Figures 6f and 6g show that back projection can recover a rupture that propagates upward or downward. Finally, Figure 6h shows the back projection result for a synthetic rupture that has the same rupture depth extent as Figure 6g, but the dip has been changed to 30 degrees. This result shows that if the rupture velocity is constant, we should be able to at least qualitatively recognize differences in the rupture plane dips. Though these synthetic results all have eastward propagating ruptures and common depth extents, the resolution of imaged energy is the same when these parameters are changed (Figure S1 of the auxiliary material). 1 [20] An important feature to note is the locations of low amplitude energy for the horizontal and subhorizontal synthetic ruptures (Figures 6e and 6h). In both cases the energy, which falls below the 75 % contour, occurs symmetrically above and below the high amplitude stacks. This is an artifact of the P phase from one point source combining with the depth phase from a different point source. Though these artifacts are low amplitude, they show that symmetric rupture patterns should be met with some degree of skepticism. 5. Results [21] The multiphase back projection analysis is applied to 22 intermediate depth earthquakes (Tables 1 5 and Figure 7). These events occurred between October 2000 and April 2010, and were at teleseismic distances from the Hi net array. The moment magnitudes and depths of these events, as reported by the USGS ( range from 6.5 to 7.8 and 103 to 280 km, respectively. For all of these 1 Auxiliary materials are available in the HTML. doi: / 2010JB Figure 8. Tonga Kermadec earthquakes. This plot shows locations, focal mechanisms from the Global CMT catalogue [e.g., Dziewonski et al., 1981; Dziewonski and Woodhouse, 1983; Woodhouse and Dziewonski, 1984; Ekström et al., 2005], and the back projection results of the earthquakes studied in the Tonga Kermadec region. The map in the center shows the region with background color showing the bathymetry (ETOPO5; The solid white line is the trench location. The dotted lines are the slab contours from 50 to 700 km (white to dark red) in 50 km increments. Figures 8a 8f show the back projection results in the depth and time dimensions. The magnitudes and hypocentral depths are from the National Earthquake Information Center (NEIC) catalog ( The background colors indicate high (dark red) and low (dark blue) stack amplitudes. See Table 1 for a summary of the results. (a) The 27 July 2003 event with magnitude Mw 6.6 at a depth of 212 km. (b) The 9 December 2007 event with magnitude Mw 7.8 at a depth of 152 km. (c) The 16 May 2006 event with magnitude Mw 7.4 at a depth of 152 km. (d) The 25 January 2004 event with magnitude Mw 6.7 at a depth of 129 km. (e) The 4 July 2001 event with magnitude Mw 6.5 at a depth of 184 km. (f) The 3 June 2001 event with magnitude Mw 7.2 at a depth of 178 km. 11 of 26


12 Figure 9 12 of 26
13 earthquakes, a box of grid points centered at the hypocenter is defined with dimensions of 2.4 degrees in latitude, 2.4 degrees in longitude, and 160 km in depth. The grid spacing, which is based upon the average resolution in latitude, longitude, and depth, is set to 0.4 degrees, 0.4 degrees, and 5 km, respectively. We choose the 75% contour of the maximum stack amplitude to estimate the depth extent and duration of each event (Tables 1 5). This choice is somewhat arbitrary, however, it seems to capture the major features for most of the earthquakes. Using this contour level, many of the events (14 out of 22) show similar depth time behavior to the synthetic ruptures in the previous section in that they have one episode of energy release that is continuous in depth and time. The remaining 8 earthquakes have multiple regions of high amplitude energy that are well separated in time and/or depth. In order to systematically categorize events consisting of a single or multiple subevents, we use the selection criterion that the initiation depths of the subevents need to be separated by at least 15 km. When this criterion is met, we refer to the event as composite. When the depth separation is less than 15 km, the events are labeled simple. In addition, the observed depth extent of individual subevents can be classified into two groups, one with limited depth range and another showing energy release over a much larger depth interval. Most of the subevents are of the first group, with 23 out of 30 subevents having depth extents of 15 km or less (Tables 1 5). We refer to these subevents as subhorizontal ruptures. In the following sections, we discuss results for events in each region shown in Figure Tonga Kermadec [22] The Tonga Kermadec trench subducts the Myr old Pacific plate beneath the Indo Australian Plate at a rate which increases to the north from rates of 16 to 24 cm/yr [Bevis et al., 1995]. The hypocentral depths of six events in this region range from 129 to 212 km, and their moment magnitudes vary between 6.5 and 7.8 ( gov/regional/neic/) (Figure 8). Four of the events are interpreted as simple ruptures (Figures 8a, 8d, 8e, and 8f). The depth extent of these events varies from 0 km to 25 km, and their durations range from 12 to 14 s (Table 1). The remaining 2 earthquakes are composite events, with two subevents separated in depth by 25 and 30 km (Figures 8b and 8c, respectively). The event duration of these composite events is slightly longer than the simple events, 15 to 16 s (Table 1) Vanuatu [23] Along the Vanuatu subduction zone, the Indo Australian plate is subducting beneath the Pacific plate. There are large variations in the subduction rates along the trench, ranging from 3 cm/yr to 17 cm/yr [e.g., Bergeot et al., 2009]. Figure 9 shows the regional distribution of earthquakes and the back projection results. These events have magnitudes and depths that range from 6.5 to 7.2 and 103 to 228 km, respectively ( Five of the earthquakes from Vanuatu have simple ruptures with depth extents of 5 km or less (Figures 9a, 9b, 9c, 9f, and 9g). The duration of these events ranges from 14 to 15 s. The 1 August 2007, Mw 7.2 event (Figure 9g) from this group seems to have complexity beyond the single rupture, however, all of this complexity is weak, at energy levels below the 75% contour. The northernmost and deepest event from this region also has a single rupture which propagates upward and downward with time (Figure 9e), though the upward propagation dominates. South of these simple events are two composite events. The 7 August 2006, Mw 6.8 earthquake is composed of 3 subevents (Figure 9d). The largest depth separation between any two of these subevents is 75 km. The second composite event (Mw 6.6) occurred on 6 November 2003 (Figure 9h). Two features of this earthquake warrant clarification. First, even though there are three separate depth ranges bounded by the 75% contour, the initiation depths of the deeper two are separated by less than 15 km. Therefore, based upon the definitions given above, this earthquake is classified as having only two rupture planes (Table 2). Second, there is low amplitude energy that is visible at about 25 s after the hypocentral time at a depth of 50 km. This is an artifact that arises for shallow events due to the pp phase arrival within the P wave window used in the back projection analysis. If the back projection method is applied to events shallower than 100 km, the amplitude of this artifact can become quite large at times close to the hypocentral time, complicating source imaging and degrading the depth resolution Hindu Kush [24] The intermediate depth seismicity in Hindu Kush and Pamir is thought to be taking place within a remnant slab that was subducting beneath Eurasia during its collision with India around 55 Ma [e.g., Pavlis and Das, 2000]. A total of 4 earthquakes with magnitudes between 6.5 and 7.4 are studied from this region with depths between 187 and 230 km (Figure 10 and Table 3). Three of these events have simple ruptures (Figures 10b, 10c, and 10d). For all three events, bivertical (upward and downward) energy propagation is observed. The durations range from 13 to 15 s, and the vertical extents range from 15 to 30 km. Some of the subevents in this region have symmetric depth behavior (Figures 10b and 10d) that is similar to that observed for synthetic results (section 4). As was discussed in the previous section, these symmetric low amplitude stacks may be artifacts, and therefore, part of the complexity seen may not reflect the actual rupture properties of the subevents. The fourth and largest event of this group of earthquakes (Mw 7.4) is composite and characterized by three subevents. The two strongest subevents which dominate the earthquake are separated by 75 km (Figure 10a). The total duration of this event is 21 s. Figure 9. Same as Figure 8 but for events in Vanuatu. The slab contours are from 50 to 400 km. See Table 2 for a summary of the results. (a) The 8 September 2008 event with magnitude Mw 6.9 at a depth of 110 km. (b) The 8 February 2005 event with magnitude Mw 6.7 at a depth of 206 km. (c) The 9 January 2001 event with magnitude Mw 7.1 at a depth of 103 km. (d) The 7 August 2006 event with magnitude Mw 6.8 at a depth of 149 km. (e) The 9 April 2004 event with magnitude Mw 6.5 at a depth of 228 km. (f) The 4 March 2010 event with magnitude Mw 6.5 at a depth of 176 km. (g) The 1 August 2007 event with magnitude Mw 7.2 at a depth of 120 km. (h) The 6 November 2003 event with magnitude Mw 6.6 at a depth of 113 km. 13 of 26


 The 3 March 2002 event with magnitude")
 The 3 January 2009 event with magnitude")
 The 5 April 2004 event with magnitude")
14 Figure 10. Same as Figure 8 but for events in Hindu Kush. The slab contours are from 50 to 300 km. See Table 3 for a summary of the results. (a) The 3 March 2002 event with magnitude Mw 7.4 at a depth of 225 km. (b) The 3 January 2009 event with magnitude Mw 6.6 at a depth of 204 km. (c) The 5 April 2004 event with magnitude Mw 6.6 at a depth of 187 km. (d) The 12 December 2005 event with magnitude Mw 6.5 at a depth of 230 km. 14 of 26


 The 2 March 2005 event with 1")
15 Figure 11. Same as Figure 8 but for events in Java. The slab contours are from 50 to 700 km. See Table 4 for a summary of the results. (a) The 8 August 2007 event with magnitude Mw 7.5 at a depth of 280 km. (b) The 2 March 2005 event with magnitude Mw 7.1 at a depth of 191 km. (c) The 24 October 2009 event with magnitude Mw 6.9 at a depth of 138 km. 15 of 26

![The age of the Indo Australian plate at the subduction zone varies from 50 Myr in the east to 140 Myr in the west [Holcombe, 1977].](/docs-images/80/81142624/images/16-1.jpg "All three of the earthquakes from this region have relatively large magnitudes (Mw 6.9).")
16 Figure 12. Same as Figure 8 but for the event in Alaska. This earthquake occurred on 28 July 2001, had a magnitude Mw 6.8, and a hypocentral depth of 131 km. The slab contours are from 50 to 250 km. See Table 5 for a summary of the results Java [25] Along the Java trench, the Indo Australian plate subducts beneath the Eurasian plate. The age of the Indo Australian plate at the subduction zone varies from 50 Myr in the east to 140 Myr in the west [Holcombe, 1977]. All three of the earthquakes from this region have relatively large magnitudes (Mw 6.9). The main ruptures of all of these events also have large vertical extents (20 35 km) with mainly downward propagation (Table 4 and Figure 11). For two of these earthquakes, there are subevents separated by 15 km or more and therefore they are composite earthquakes (Figures 11b and 11c). The event durations of the Java earthquakes range from 9 to 13 s Alaska [26] In this region, the Pacific plate subducts beneath the North American plate along the Aleutian trench at a rate of 7 to 8 cm/yr, and unlike most sections of the Aleutian trench, convergence is perpendicular to the trench [Creager and Boyd, 1991]. The one earthquake studied in this region has a large strike slip component based upon the Global CMT solution, and is observed to be a composite rupture (Figure 12). The first rupture propagates 10 km upward, although the energy falls below the 75% level during this upward propagation. The second rupture starts 30 km below the initial rupture and propagates both upward and downward, and has a total vertical extent of 15 km. The event duration of this earthquake is 9 s. 6. Discussion [27] The depth time behavior of these intermediate depth events can be interpreted in many different ways. However, we first address the issue of whether the complexities of the composite ruptures are artifacts of the back projection method or effects due to seismic phases that are not included in the analysis. In order to investigate the robustness of the complexities imaged by the back projection technique, additional synthetic tests are presented in this section with a focus on the large Hindu Kush event which had the largest depth separation between two rupture planes. These tests support the conclusion that multiple planes of high amplitude energy are real features of the earthquakes. 16 of 26
17 6.1. Robustness of Composite Ruptures [28] The composite earthquakes are potentially the most interesting observations of this study (e.g., Figure 10a). These results are partially supported by reports of similar complexity in other catalogues for some of the events we have analyzed [e.g., Starovoit et al., 2002]. We investigate whether complexities seen in the back projection results are real features of the events or artifacts of the stacking procedure. As the synthetic results show, high amplitude artifacts do not arise when the input source is simple (Figures 6 and S2). However, this may not necessarily apply to very complex ruptures. To investigate this possibility, a more complex case is simulated by using the P wave train recorded at a single station from the 3 March 2002 Hindu Kush event (Figure 10a) as the input source time function for a synthetic test (Figure 13a). The hypocentral location of this complex synthetic source is fixed to that of the Hindu Kush event, i.e., N latitude, E longitude, and 225 km depth. If the second rupture observed in the 3 March 2002 Hindu Kush event is an artifact of the complex source time function, then a similar artifact should be seen in the synthetic result. On the other hand, if the method can reliably constrain depth for the complex source time function, then the synthetic result should have high amplitude stacks only at the assigned depth. Figure 13b shows the high amplitude energy is imaged at the hypocentral depth, although there is low amplitude energy above and below the assigned depth of 225 km. This result demonstrates that even for a very complex horizontal rupture, artifacts of high amplitude energy at different depths are suppressed by virtue of using multiple seismic phases. [29] There is also the possibility that seismic phases not included in the back projection analysis may cause the observed complexity. As demonstrated in an earlier section (Figure 6) and discussed briefly for an event in the Vanuatu region (Figure 9h), moderately coherent stacks can result at depths and times close to the hypocenter when unwanted phases are present. To investigate this possibility, we focus on crustal and water phases, which have very similar raypaths as the depth phases used in this study. In particular, we consider arrivals due to underside reflections from the Moho and the sea surface. To determine the effect of these phases on back projection results, the synthetic tests used in Figure 6 are modified. For the original synthetic tests, seismograms include one Ricker wavelet for each assigned point source and each seismic phase chosen for that source, i.e., one Ricker wavelet for each of the P, pp, and sp arrivals. This approach is changed so that more Ricker wavelets arrive around the depth phase time to mimic the crustal and water reflection phases while the P arrival consists of a single Ricker wavelet. [30] We determine the time shifts for the phases that interact with the crust and ocean using a 7 km thick crust, a 3 km thick ocean, and velocities from the one dimensional model IASP91 [Kennett and Engdahl, 1991]. For the underside reflection at the Moho, a Ricker wavelet is assigned to arrive before both depth phases (pp and sp). For the pp phase, the time shift of 2.4 s is calculated using the two way travel time of a P wave through the crust. For the sp phase, the time shift of 3.3 s is calculated by summing the one way travel times of P and S waves in the crust. For both calculations, we make the approximation that the raypaths within the crust are vertical. To estimate the arrival times of the water phases, we use the two way travel time of a P wave in the ocean. Once again, a vertical path is assumed, and the time shift is 4.1 s with respect to the pp and sp arrival time. Figures 14b and 14c show that there is little change in the imaged energy of the depth phases for these synthetic tests compared to a single point source (Figures 6b and 6c) although there is a slight extension in time. This is because the additional phases associated with the crust and ocean have origin times that are within or very close to the temporal uncertainty of the single point source (±5 s). The combined result shows that the additional arrivals do not cause high amplitude artifacts at different depths, and produce results almost identical to a point source. This approach assumes that phases associated with the crust and ocean can be represented by time shifted depth phases and ignores deviations in the slowness from the depth phases. These deviations in slowness are small, but if they were included when generating the synthetic seismograms, it would only decrease the stack amplitudes due to the fact that a different slowness would reduce coherent stacking of the additional phases using pp or sp arrival times. Therefore, the synthetic test shown in Figure 14 gives the maximum effect that can be produced by these phases. [31] We have only considered underside reflections in these synthetic tests and ignored multiple reflections within the crust and water column. Each reflection will change the slowness of these phases further away from that of the slowness of the depth phases used in the back projection analysis. Therefore the stack amplitudes should be smaller than the underside reflections and contribute less to any possible artifacts. An additional source of complexity may be the seismic wave interactions with the subducting slab. We assume that any phases produced by these interactions would have lower amplitudes compared to the P and depth phases, however, only by fully modeling the wavefield with threedimensional structure can we confirm this assumption, and, therefore, slab interactions are a potential source of error. On the other hand, arrivals such as slab reflected phases would produce stacks with the same time dependence for various subevents which is not observed for most of the composite earthquakes. Therefore we believe that the artifacts due to the presence of a slab are not significant in most of our results Properties of Composite Ruptures [32] Based upon various resolution tests, the imaged energy of the composite earthquakes is a real feature of rupture complexity. We explore this complexity further in this section. First, the timing of the individual subevents for some of the composite events are such that dynamic triggering by seismic waves is likely to be involved in the activation of the second subevent. For example, the 3 March 2002 Hindu Kush event shows a depth separation of 75 ± 5 km between individual subevents. The time separation between the initiation of the two subevents is about 8.5 ± 2.0 s, which implies that the minimum speed required to relate the two subevents is around 9 ± 2 km/s (Figure 15). This velocity is in the range of compressional wave velocities, including those within the slab imaged from tomographic studies in the Hindu Kush region [e.g., Koulakov and Sobolev, 2006], but is too high for shear waves, which at 200 km depth have velocities around 4.5 km/s [Kennett and Engdahl, 1991]. The potential mechanism by which a compressional wave from one rupture 17 of 26
 Instead of using a simple Ricker wavelet (Figure 4a), this synthetic test uses the P waveform from the 3 March 2002 Hindu Kush recorded at station MIGH as the source time function.")
18 Figure 13. Synthetic test with a complex source time function. (a) Instead of using a simple Ricker wavelet (Figure 4a), this synthetic test uses the P waveform from the 3 March 2002 Hindu Kush recorded at station MIGH as the source time function. (b) Back projection result where the input source is located at N, E, and 225 km depth, i.e., a point source. For this synthetic test, only the P and sp seismic phases are used in the back projection analysis since these are the phases used for the actual earthquake. 18 of 26

19 Figure 14. Effects of the crust and water layers. The back projection result from a point source using only the P phase, as well as the back projection result from the depth phases with additional sources included to simulate phases produced by bottom side reflections of the crust and the water surface. (a) The back projection result from a single point source (black star) using only the P phase. (b) The back projection result from three point sources (black stars) with the same hypocentral locations, but different origin times using pp travel times. The first star mimics the underside reflection at the Moho that arrives 2.4 s before the pp phase. This time is calculated using a 7 km thick crust with a P wave velocity of 5.8 km/s from IASP91 [Kennett and Engdahl, 1991]. The second star is the hypocenter generating the P wave arrival. The third star mimics the underside reflection at the ocean surface that arrives 4.1 s after the pp phase. This time is calculated using a 3 km thick ocean with a P wave velocity of 1.45 km/s from IASP91 [Kennett and Engdahl, 1991]. (c) The back projection result from three point sources (black stars) with the same hypocentral locations, but different origin times using sp travel times. The first star mimics the underside reflection at the Moho that arrives 3.4 s before the sp phase. This time is calculated using a 7 km thick crust with P and S wave velocities of 5.8 km/s and 3.36 km/s from IASP91, respectively [Kennett and Engdahl, 1991]. The second star is the hypocenter generating the P wave arrival. The third star mimics the underside reflection at the ocean surface that arrives 4.1 s after the sp phase. This time is calculated using a 3 km thick ocean with a P wave velocity of 1.45 km/s from IASP91 [Kennett and Engdahl, 1991]. (d) The back projection result using all three seismic phases with the simulated bottom side reflections included. 19 of 26

20 Figure 15. Dynamic triggering. The back projection results from the 3 March 2002 Mw 7.4 Hindu Kush event. The two ruptures of this event are separated by 75 km in depth and 8.5 s in time. This leads to a propagation velocity of 8.8 km/s, which is close to the P wave velocity in this region. would trigger a second rupture is discussed in a subsequent section. Another characteristic of the composite events is that often the individual subevents have very different depth time behavior. For example, the 9 December 2007, Mw 7.8 event has two ruptures which have considerable time overlap (Figure 8b). While the bottom rupture propagates upward with time, the top rupture maintains the same depth throughout its duration. This behavior suggests that the two ruptures are independent of one another. [33] The existence of multiple subevents involving two independent faults can have effects on the non double couple components of the moment tensors [e.g., Houston, 1993]. These components are quantified using the parameter defined as = l 2 /max(l 1, l 3 ) where l values are the eigenvalues of the moment tensor with l 1 l 2 l 3 [e.g., Ekström, 1994]. This parameter varies from 0.0 for a doublecouple source to ±0.5 for a purely non double couple source (i.e., compensated linear vector dipole). Using the Global CMT catalogue, the average absolute epsilon value of the events classified as composite in this study is 0.16, over twice that of the simple events (0.07). Furthermore, all five events with absolute epsilon values above 0.15 are imaged by the back projection method as composite events. These results support the interpretation that subevents are occurring as separate rupture planes. [34] Another property which may be related to the existence of composite events is the earthquake magnitude. Composite ruptures characterize most of the largest events studied, although there are a few smaller events (Mw < 7.0) which exhibit this behavior (e.g., Figure 9h). This observation suggests that the largest intermediate depth earthquakes involve multiple faults. This interpretation also suggests that there could be predetermined rupture dimensions for any given region, which may be defined by preexisting faults in the slab. One test for this hypothesis is to determine the magnitude at which composite ruptures occur for different subduction zones or even different sections of the same subduction zone, though more than 22 events are needed to obtain statistically significant conclusions. [35] In addition, earthquake magnitude has been shown to be related to the duration of the event for shallow earthquakes in a relationship expected from a circular rupture model, i.e., t / M o 1/3, where t is the event duration and M o is seismic moment [e.g., Vidale and Houston, 1993]. Multiple studies have investigated this relationship for intermediate depth earthquakes [e.g., Vidale and Houston, 1993; Bos et al., 1998; Houston et al., 1998; Campus and Das, 2000; Houston, 2001; Persh and Houston, 2004], and these studies have found that the durations of the largest intermediate depth events tend to be shorter than expected from the magnitude duration relationship observed for shallow earthquakes. The results presented in this manuscript offer a possible explanation for this behavior. If two faults are rupturing at the same time, the duration recorded on seismograms should be much shorter than the duration of an event on a single fault with the same magnitude. As Tables 1 5 show, summing the durations of individual subevents leads to longer cumulative durations than the event durations discussed earlier. These observations 20 of 26
Measurement of differential rupture durations as constraints on the source finiteness of deep-focus earthquakes
 JOURNAL OF GEOPHYSICAL RESEARCH, VOL. 111,, doi:10.1029/2005jb004001, 2006 Measurement of differential rupture durations as constraints on the source finiteness of deep-focus earthquakes Linda M. Warren
SUPPLEMENTARY INFORMATION
 doi:10.1038/nature11492 Figure S1 Short-period Seismic Energy Release Pattern Imaged by F-net. (a) Locations of broadband seismograph stations in Japanese F-net used for the 0.5-2.0 Hz P wave back-projection
Seismic Activity near the Sunda and Andaman Trenches in the Sumatra Subduction Zone
 IJMS 2017 vol. 4 (2): 49-54 International Journal of Multidisciplinary Studies (IJMS) Volume 4, Issue 2, 2017 DOI: http://doi.org/10.4038/ijms.v4i2.22 Seismic Activity near the Sunda and Andaman Trenches
An intermediate deep earthquake rupturing on a dip-bending fault: Waveform analysis of the 2003 Miyagi-ken Oki earthquake
 GEOPHYSICAL RESEARCH LETTERS, VOL. 31, L24619, doi:10.1029/2004gl021228, 2004 An intermediate deep earthquake rupturing on a dip-bending fault: Waveform analysis of the 2003 Miyagi-ken Oki earthquake Changjiang
Source characteristics of large deep earthquakes: Constraint on the faulting mechanism at great depths
 JOURNAL OF GEOPHYSICAL RESEARCH, VOL. 108, NO. B2, 2091, doi:10.1029/2002jb001948, 2003 Source characteristics of large deep earthquakes: Constraint on the faulting mechanism at great depths Rigobert Tibi
Imaging sharp lateral velocity gradients using scattered waves on dense arrays: faults and basin edges
 2017 SCEC Proposal Report #17133 Imaging sharp lateral velocity gradients using scattered waves on dense arrays: faults and basin edges Principal Investigator Zhongwen Zhan Seismological Laboratory, California
Triggering of earthquakes during the 2000 Papua New Guinea earthquake sequence
 JOURNAL OF GEOPHYSICAL RESEARCH, VOL. 112,, doi:10.1029/2006jb004480, 2007 Triggering of earthquakes during the 2000 Papua New Guinea earthquake sequence Sun-Cheon Park 1 and Jim Mori 1 Received 3 May
Supplementary Materials for
 advances.sciencemag.org/cgi/content/full/4/3/eaao4915/dc1 Supplementary Materials for Global variations of large megathrust earthquake rupture characteristics This PDF file includes: Lingling Ye, Hiroo
RELOCATION OF THE MACHAZE AND LACERDA EARTHQUAKES IN MOZAMBIQUE AND THE RUPTURE PROCESS OF THE 2006 Mw7.0 MACHAZE EARTHQUAKE
 RELOCATION OF THE MACHAZE AND LACERDA EARTHQUAKES IN MOZAMBIQUE AND THE RUPTURE PROCESS OF THE 2006 Mw7.0 MACHAZE EARTHQUAKE Paulino C. FEITIO* Supervisors: Nobuo HURUKAWA** MEE07165 Toshiaki YOKOI** ABSTRACT
Earthquake Stress Drops in Southern California
 Earthquake Stress Drops in Southern California Peter Shearer IGPP/SIO/U.C. San Diego September 11, 2009 Earthquake Research Institute Lots of data for big earthquakes (rupture dimensions, slip history,
An autocorrelation method to detect low frequency earthquakes within tremor
 GEOPHYSICAL RESEARCH LETTERS, VOL. 35, L16305, doi:10.1029/2008gl034560, 2008 An autocorrelation method to detect low frequency earthquakes within tremor Justin R. Brown, 1 Gregory C. Beroza, 1 and David
Magnitude 8.2 FIJI. A magnitude 8.2 earthquake occurred km (226.7 mi) E of Suva, Fiji at a depth of km (350 miles).
 E of Suva, Fiji at a depth of km (350 miles).") A magnitude 8.2 earthquake occurred 364.8 km (226.7 mi) E of Suva, Fiji at a depth of 563.4 km (350 miles). There is no risk of a tsunami from an earthquake at this depth. Images courtesy of Google The
A magnitude 8.2 earthquake occurred 364.8 km (226.7 mi) E of Suva, Fiji at a depth of 563.4 km (350 miles). There is no risk of a tsunami from an earthquake at this depth. Images courtesy of Google The
Rupture Dynamics of Large Earthquakes inferred from Hydroacoustic Data
 Rupture Dynamics of Large Earthquakes inferred from Hydroacoustic Data Catherine de Groot-Hedlin Scripps Institution of Oceanography University of California, San Diego Great Sumatra Earthquake (Boxing
Fault plane orientations of deep earthquakes in the Izu-Bonin-Marianas subduction zone
 JOURNAL OF GEOPHYSICAL RESEARCH, VOL. 117,, doi:10.1029/2011jb009047, 2012 Fault plane orientations of deep earthquakes in the Izu-Bonin-Marianas subduction zone R. Myhill 1 and L. M. Warren 2 Received
Seismological Aspects of the December 2004 Great Sumatra-Andaman Earthquake
 Seismological Aspects of the December 2004 Great Sumatra-Andaman Earthquake Hiroo Kanamori, a M.EERI The 2004 Great Sumatra-Andaman earthquake had an average source duration of about 500 sec. and a rupture
Array-analysis of Tremors in Shikoku Triggered by the 2012 Sumatra Earthquake
 Array-analysis of Tremors in Shikoku Triggered by the 2012 Sumatra Earthquake Tianyi Li 1 Instructor: Prof. Kazushige Obara 2 1. Department of Geophysics, Peking University 2. Earthquake Research Institute,
Source of the July 2006 West Java tsunami estimated from tide gauge records
 GEOPHYSICAL RESEARCH LETTERS, VOL. 33, L24317, doi:10.1029/2006gl028049, 2006 Source of the July 2006 West Java tsunami estimated from tide gauge records Yushiro Fujii 1 and Kenji Satake 2 Received 13
Rupture Process of the Great 2004 Sumatra-Andaman Earthquake
 Rupture Process of the Great 2004 Sumatra-Andaman Earthquake Supporting Online Materials Submitted to Science, March 12, 2005 Charles J. Ammon 1, Ji Chen 2, Hong-Kie Thio 3, David Robinson 5, Sidao Ni
Empirical Green s Function Analysis of the Wells, Nevada, Earthquake Source
 Nevada Bureau of Mines and Geology Special Publication 36 Empirical Green s Function Analysis of the Wells, Nevada, Earthquake Source by Mendoza, C. 1 and Hartzell S. 2 1 Centro de Geociencias, Universidad
Widespread Ground Motion Distribution Caused by Rupture Directivity during the 2015 Gorkha, Nepal Earthquake
 Widespread Ground Motion Distribution Caused by Rupture Directivity during the 2015 Gorkha, Nepal Earthquake Kazuki Koketsu 1, Hiroe Miyake 2, Srinagesh Davuluri 3 and Soma Nath Sapkota 4 1. Corresponding
A search for seismic radiation from late slip for the December 26, 2004 Sumatra-Andaman (M w = 9.15) earthquake
 earthquake") Click Here for Full Article GEOPHYSICAL RESEARCH LETTERS, VOL. 33, L18305, doi:10.1029/2006gl027286, 2006 A search for seismic radiation from late slip for the December 26, 2004 Sumatra-Andaman (M w =
Click Here for Full Article GEOPHYSICAL RESEARCH LETTERS, VOL. 33, L18305, doi:10.1029/2006gl027286, 2006 A search for seismic radiation from late slip for the December 26, 2004 Sumatra-Andaman (M w =
Data Repository Item For: Kinematics and geometry of active detachment faulting beneath the TAG hydrothermal field on the Mid-Atlantic Ridge
 GSA Data Repository Item: 2007183 Data Repository Item For: Kinematics and geometry of active detachment faulting beneath the TAG hydrothermal field on the Mid-Atlantic Ridge Brian J. demartin 1*, Robert
7.1 FIJI 1, :57:22 UTC
 A magnitude 7.1 earthquake struck 141 km (88 miles) northeast of Ndoi Island, Fiji, and 313 km (194 mi) west-northwest of Nuku alofa, Tonga according to the US Geological Survey, but there were no reports
High-frequency rupture properties of the M w 9.0 off the Pacific coast of Tohoku Earthquake
 LETTER Earth Planets Space, 63, 609 614, 2011 High-frequency rupture properties of the M w 9.0 off the Pacific coast of Tohoku Earthquake Miaki Ishii Department of Earth & Planetary Sciences, Harvard University,
Centroid moment-tensor analysis of the 2011 Tohoku earthquake. and its larger foreshocks and aftershocks
 Earth Planets Space, 99, 1 8, 2011 Centroid moment-tensor analysis of the 2011 Tohoku earthquake and its larger foreshocks and aftershocks Meredith Nettles, Göran Ekström, and Howard C. Koss Lamont-Doherty
A magnitude 7.8 earthquake has occurred km (63.3 mi) ESE of Suva, Fiji at a depth of km (378 miles).
 ESE of Suva, Fiji at a depth of km (378 miles).") A magnitude 7.8 earthquake has occurred 101.8 km (63.3 mi) ESE of Suva, Fiji at a depth of 608.6 km (378 miles). There is no risk of a tsunami from an earthquake at this depth. Images courtesy of Google
A magnitude 7.8 earthquake has occurred 101.8 km (63.3 mi) ESE of Suva, Fiji at a depth of 608.6 km (378 miles). There is no risk of a tsunami from an earthquake at this depth. Images courtesy of Google
Moment tensor inversion of near source seismograms
 Moment tensor inversion of near source seismograms Yuji Yagi and Naoki Nishimura ABSTRACT We construct a program set for estimating moment tensor solution using near source seismograms. We take the effect
Rupture Characteristics of Major and Great (M w 7.0) Megathrust Earthquakes from : 1. Source Parameter Scaling Relationships
 Megathrust Earthquakes from : 1. Source Parameter Scaling Relationships") Journal of Geophysical Research Solid Earth Supporting Information for Rupture Characteristics of Major and Great (M w 7.0) Megathrust Earthquakes from 1990-2015: 1. Source Parameter Scaling Relationships
Journal of Geophysical Research Solid Earth Supporting Information for Rupture Characteristics of Major and Great (M w 7.0) Megathrust Earthquakes from 1990-2015: 1. Source Parameter Scaling Relationships
DETERMINATION OF FAULT PLANE ORIENTATIONS FROM RUPTURE DIRECTIVITY OF INTERMEDIATE AND DEEP EARTHQUAKES IN THE NORTHEASTERN JAPAN SUBDUCTION ZONE
 DETERMINATION OF FAULT PLANE ORIENTATIONS FROM RUPTURE DIRECTIVITY OF INTERMEDIATE AND DEEP EARTHQUAKES IN THE NORTHEASTERN JAPAN SUBDUCTION ZONE TIM OSBURG, B.S. An Abstract Presented to the Graduate
SUPPLEMENTAL INFORMATION
 GSA DATA REPOSITORY 2013310 A.M. Thomas et al. MOMENT TENSOR SOLUTIONS SUPPLEMENTAL INFORMATION Earthquake records were acquired from the Northern California Earthquake Data Center. Waveforms are corrected
Seismic Source Mechanism
 Seismic Source Mechanism Yuji Yagi (University of Tsukuba) Earthquake Earthquake is a term used to describe both failure process along a fault zone, and the resulting ground shaking and radiated seismic
JCR (2 ), JGR- (1 ) (4 ) 11, EPSL GRL BSSA
, JGR- (1 ) (4 ) 11, EPSL GRL BSSA") Dun Wang ( ) In collaboration with: Hitoshi Kawakatsu, Jim Mori, Kazuki Koketsu, Takuto Maeda, Hiroshi Tsuroka, Jiancang Zhunag, Lihua Fang, and Qiang Yao School of Geosciences, China University of Geosciences
Dun Wang ( ) In collaboration with: Hitoshi Kawakatsu, Jim Mori, Kazuki Koketsu, Takuto Maeda, Hiroshi Tsuroka, Jiancang Zhunag, Lihua Fang, and Qiang Yao School of Geosciences, China University of Geosciences
IGPP. Departmental Examination
 IGPP Departmental Examination 1994 Departmental Examination, 1994 This is a 4 hour exam with 12 questions. Write on the pages provided, and continue if necessary onto further sheets. Please identify yourself
29th Monitoring Research Review: Ground-Based Nuclear Explosion Monitoring Technologies MODELING P WAVE MULTIPATHING IN SOUTHEAST ASIA
 MODELING P WAVE MULTIPATHING IN SOUTHEAST ASIA Ali Fatehi and Keith D. Koper Saint Louis University Sponsored by the Air Force Research Laboratory ABSTRACT Contract No. FA8718-06-C-0003 We have used data
Magnitude 8.3 SEA OF OKHOTSK
 A powerful earthquake in Russia's Far East was felt as far away as Moscow, about 7,000 kilometers (4,400 miles) west of the epicenter, but no casualties or damage were reported. The epicenter was in the
Estimation of S-wave scattering coefficient in the mantle from envelope characteristics before and after the ScS arrival
 GEOPHYSICAL RESEARCH LETTERS, VOL. 30, NO. 24, 2248, doi:10.1029/2003gl018413, 2003 Estimation of S-wave scattering coefficient in the mantle from envelope characteristics before and after the ScS arrival
GEOPHYSICAL RESEARCH LETTERS, VOL. 35, L14308, doi: /2008gl034461, 2008
 Click Here for Full Article GEOPHYSICAL RESEARCH LETTERS, VOL. 35,, doi:10.1029/2008gl034461, 2008 Tomographic evidence for hydrated oceanic crust of the Pacific slab beneath northeastern Japan: Implications
Apparent Slow Oceanic Transform Earthquakes Due to Source Mechanism Bias
 Apparent Slow Oceanic Transform Earthquakes Due to Source echanism Bias Kimberly Schramm and Seth Stein Kimberly Schramm 1 and Seth Stein Northwestern University INTRODUCTION Slow earthquakes, characterized
High-precision location of North Korea s 2009 nuclear test
 Copyright, Seismological Research Letters, Seismological Society of America 1 High-precision location of North Korea s 2009 nuclear test Lianxing Wen & Hui Long Department of Geosciences State University
EARTHQUAKE LOCATIONS INDICATE PLATE BOUNDARIES EARTHQUAKE MECHANISMS SHOW MOTION
 6-1 6: EARTHQUAKE FOCAL MECHANISMS AND PLATE MOTIONS Hebgen Lake, Montana 1959 Ms 7.5 1 Stein & Wysession, 2003 Owens Valley, California 1872 Mw ~7.5 EARTHQUAKE LOCATIONS INDICATE PLATE BOUNDARIES EARTHQUAKE
Earthquake stress drop estimates: What are they telling us?
 Earthquake stress drop estimates: What are they telling us? Peter Shearer IGPP/SIO/U.C. San Diego October 27, 2014 SCEC Community Stress Model Workshop Lots of data for big earthquakes (rupture dimensions,
Imaging short-period seismic radiation from the 27 February 2010 Chile (M W 8.8) earthquake by back-projection of P, PP, and PKIKP waves
 earthquake by back-projection of P, PP, and PKIKP waves") JOURNAL OF GEOPHYSICAL RESEARCH, VOL. 117,, doi:10.1029/2011jb008576, 2012 Imaging short-period seismic radiation from the 27 February 2010 Chile (M W 8.8) earthquake by back-projection of P, PP, and PKIKP
JOURNAL OF GEOPHYSICAL RESEARCH, VOL. 117,, doi:10.1029/2011jb008576, 2012 Imaging short-period seismic radiation from the 27 February 2010 Chile (M W 8.8) earthquake by back-projection of P, PP, and PKIKP
A systematic study of source time functions and moment tensors of intermediate and deep earthquakes
 JOURNAL OF GEOPHYSICAL RESEARCH, VOL. 112,, doi:10.1029/2006jb004534, 2007 A systematic study of source time functions and moment tensors of intermediate and deep earthquakes A. Tocheport, 1,2 L. Rivera,
Rapid Earthquake Rupture Duration Estimates from Teleseismic Energy Rates, with
 1 2 Rapid Earthquake Rupture Duration Estimates from Teleseismic Energy Rates, with Application to Real-Time Warning 3 Jaime Andres Convers 1 and Andrew V. Newman 1 4 5 1. School of Earth and Atmospheric
High-Frequency Ground Motion Simulation Using a Source- and Site-Specific Empirical Green s Function Approach
 High-Frequency Ground Motion Simulation Using a Source- and Site-Specific Empirical Green s Function Approach R. Mourhatch & S. Krishnan California Institute of Technology, Pasadena, CA, USA SUMMARY: A
Routine Estimation of Earthquake Source Complexity: the 18 October 1992 Colombian Earthquake
 Bulletin of the Seismological Society of America, Vol. 84, No. 4, pp. 1266-1271, August 1994 Routine Estimation of Earthquake Source Complexity: the 18 October 1992 Colombian Earthquake by Charles J. Ammon,*
Detection and location of non-volcanic tremor beneath the Central Range in Taiwan
 Detection and location of non-volcanic tremor beneath the Central Range in Taiwan Aileen Zhang Advisor: Prof. Kazushige Obara Introduction Volcanic tremor is a long-duration episode of weak seismic motions
Accuracy of modern global earthquake catalogs
 Physics of the Earth and Planetary Interiors 135 (2003) 173 209 Accuracy of modern global earthquake catalogs Yan Y. Kagan Department of Earth and Space Sciences, University of California, Los Angeles,
Data Repository: Seismic and Geodetic Evidence For Extensive, Long-Lived Fault Damage Zones
 DR2009082 Data Repository: Seismic and Geodetic Evidence For Extensive, Long-Lived Fault Damage Zones Fault Zone Trapped Wave Data and Methods Fault zone trapped waves observed for 2 shots and 5 local
Centroid-moment-tensor analysis of the 2011 off the Pacific coast of Tohoku Earthquake and its larger foreshocks and aftershocks
 LETTER Earth Planets Space, 63, 519 523, 2011 Centroid-moment-tensor analysis of the 2011 off the Pacific coast of Tohoku Earthquake and its larger foreshocks and aftershocks Meredith Nettles, Göran Ekström,
SOURCE PROCESS OF THE 2003 PUERTO PLATA EARTHQUAKE USING TELESEISMIC DATA AND STRONG GROUND MOTION SIMULATION
 Synopses of Master Papers Bulletin of IISEE, 47, 19-24, 2013 SOURCE PROCESS OF THE 2003 PUERTO PLATA EARTHQUAKE USING TELESEISMIC DATA AND STRONG GROUND MOTION SIMULATION Fabricio Moquete Everth* Supervisor:
Probing Mid-Mantle Heterogeneity Using PKP Coda Waves
 Probing Mid-Mantle Heterogeneity Using PKP Coda Waves Michael A.H. Hedlin and Peter M. Shearer Cecil H. and Ida M. Green Institute of Geophysics and Planetary Physics Scripps Institution of Oceanography,
Characterization of Induced Seismicity in a Petroleum Reservoir: A Case Study
 Characterization of Induced Seismicity in a Petroleum Reservoir: A Case Study Edmond Sze, M. Nafi Toksöz, and Daniel R. Burns Earth Resources Laboratory Dept. of Earth, Atmospheric and Planetary Sciences
Fracture induced shear wave splitting in a source area of triggered seismicity by the Tohoku-oki earthquake in northeastern Japan.
 Fracture induced shear wave splitting in a source area of triggered seismicity by the Tohoku-oki earthquake in northeastern Japan Masahiro Kosuga 1 1. Corresponding Author. Professor, Graduate School of
Preliminary slip model of M9 Tohoku earthquake from strongmotion stations in Japan - an extreme application of ISOLA code.
 Preliminary slip model of M9 Tohoku earthquake from strongmotion stations in Japan - an extreme application of ISOLA code. J. Zahradnik 1), F. Gallovic 1), E. Sokos 2) G-A. Tselentis 2) 1) Charles University
Supporting Online Material for
 www.sciencemag.org/cgi/content/full/1131692/dc1 Supporting Online Material for Localized Temporal Change of the Earth s Inner Core Boundary This PDF file includes: Materials and Methods Figs. S1 to S3
Spatio-temporal variation in slip rate on the plate boundary off Sanriku, northeastern Japan, estimated from small repeating earthquakes
 Spatio-temporal variation in slip rate on the plate boundary off Sanriku, northeastern Japan, estimated from small repeating earthquakes T. Matsuzawa, N. Uchida, T. Igarashi *, N. Umino, and A. Hasegawa
Magnitude 7.6 & 7.6 PERU
 Two deep 7.6 magnitude earthquakes have shaken a sparsely populated jungle region near the Peru-Brazil border in southeast Peru. There were no immediate reports of injuries or damage. The second M 7.6
Tsunami Simulation of 2009 Dusky Sound Earthquake in New Zealand
 Tsunami Simulation of 2009 Dusky Sound Earthquake in New Zealand Polina Berezina 1 Institute of Geology, Taras Shevchenko National University of Kyiv, Kyiv, Ukraine Supervisor: Prof. Kenji Satake Earthquake
Seismic body wave constraint on mechanisms of intermediate-depth earthquakes
 JOURNAL OF GEOPHYSICAL RESEARCH, VOL. 107, NO. B3, 2047, 10.1029/2001JB000361, 2002 Seismic body wave constraint on mechanisms of intermediate-depth earthquakes Rigobert Tibi, 1 Guenter Bock, and Charles
DETERMINATION OF EARTHQUAKE PARAMETERS USING SINGLE STATION BROADBAND DATA IN SRI LANKA
 DETERMINATION OF EARTHQUAKE PARAMETERS USING SINGLE STATION BROADBAND DATA IN SRI LANKA S.W.M. SENEVIRATNE* MEE71 Supervisors: Yasuhiro YOSHIDA** Tatsuhiko HARA*** ABSTRACT We determined epicenters and
Effect of the Emperor seamounts on trans-oceanic propagation of the 2006 Kuril Island earthquake tsunami
 GEOPHYSICAL RESEARCH LETTERS, VOL. 35, L02611, doi:10.1029/2007gl032129, 2008 Effect of the Emperor seamounts on trans-oceanic propagation of the 2006 Kuril Island earthquake tsunami S. Koshimura, 1 Y.
Earthquake patterns in the Flinders Ranges - Temporary network , preliminary results
 Earthquake patterns in the Flinders Ranges - Temporary network 2003-2006, preliminary results Objectives David Love 1, Phil Cummins 2, Natalie Balfour 3 1 Primary Industries and Resources South Australia
2008 Monitoring Research Review: Ground-Based Nuclear Explosion Monitoring Technologies
 STRUCTURE OF THE KOREAN PENINSULA FROM WAVEFORM TRAVEL-TIME ANALYSIS Roland Gritto 1, Jacob E. Siegel 1, and Winston W. Chan 2 Array Information Technology 1 and Harris Corporation 2 Sponsored by Air Force
Sendai Earthquake NE Japan March 11, Some explanatory slides Bob Stern, Dave Scholl, others updated March
 Sendai Earthquake NE Japan March 11, 2011 Some explanatory slides Bob Stern, Dave Scholl, others updated March 14 2011 Earth has 11 large plates and many more smaller ones. Plates are 100-200 km thick
Magnitude 7.1 NEAR THE EAST COAST OF HONSHU, JAPAN
 Japan was rattled by a strong aftershock and tsunami warning Thursday night nearly a month after a devastating earthquake and tsunami flattened the northeastern coast. This earthquake can be considered
The M7.1 May 26, 2003 off-shore Miyagi Prefecture Earthquake in northeast Japan: Source process and aftershock distribution of an intra-slab event
 Earth Planets Space, 55, 731 739, 2003 The M7.1 May 26, 2003 off-shore Miyagi Prefecture Earthquake in northeast Japan: Source process and aftershock distribution of an intra-slab event Tomomi Okada and
Numerical Modeling for Earthquake Source Imaging: Implications for Array Design in Determining the Rupture Process
 TAO, Vol. 15, No. 2, 133-150, June 2004 Numerical Modeling for Earthquake Source Imaging: Implications for Array Design in Determining the Rupture Process Yi-Ling Huang 1, *, Bor-Shouh
revised October 30, 2001 Carlos Mendoza
 Earthquake Sources in the circum-caribbean Region Puerto Rico Tsunami Mitigation and Warning Program Federal Emergency Management Agency Preliminary Report: Task 3 revised October 30, 2001 Carlos Mendoza
LETTER Earth Planets Space, 56, , 2004
 LETTER Earth Planets Space, 56, 353 357, 2004 Deep seismic activities preceding the three large shallow earthquakes off south-east Hokkaido, Japan the 2003 Tokachi-oki earthquake, the 1993 Kushiro-oki
SOURCE MODELING OF RECENT LARGE INLAND CRUSTAL EARTHQUAKES IN JAPAN AND SOURCE CHARACTERIZATION FOR STRONG MOTION PREDICTION
 SOURCE MODELING OF RECENT LARGE INLAND CRUSTAL EARTHQUAKES IN JAPAN AND SOURCE CHARACTERIZATION FOR STRONG MOTION PREDICTION Kimiyuki Asano 1 and Tomotaka Iwata 2 1 Assistant Professor, Disaster Prevention
1.3 Short Review: Preliminary results and observations of the December 2004 Great Sumatra Earthquake Kenji Hirata
 1.3 Short Review: Preliminary results and observations of the December 2004 Great Sumatra Earthquake Kenji Hirata We give a brief review about observations and preliminary results regarding the 2004 great
Time dependence of PKP(BC) PKP(DF) times: could this be an artifact of systematic earthquake mislocations?
 PKP(DF) times: could this be an artifact of systematic earthquake mislocations?") Physics of the Earth and Planetary Interiors 122 (2000) 221 228 Time dependence of PKP(BC) PKP(DF) times: could this be an artifact of systematic earthquake mislocations? Xiaodong Song Department of Geology,
Physics of the Earth and Planetary Interiors 122 (2000) 221 228 Time dependence of PKP(BC) PKP(DF) times: could this be an artifact of systematic earthquake mislocations? Xiaodong Song Department of Geology,
9th Workshop on Three-Dimensional Modelling of Seismic Waves Generation, Propagation and their Inversion
 1965-36 9th Workshop on Three-Dimensional Modelling of Seismic Waves Generation, Propagation and their Inversion 22 September - 4 October, 2008 Tomography and Active Tectonics in Kanto, Japan Francis T.
The 2010 Mw 8.8 Chile earthquake: Triggering on multiple segments and frequency dependent rupture behavior
 GEOPHYSICAL RESEARCH LETTERS, VOL. 38,, doi:10.1029/2011gl047140, 2011 The 2010 Mw 8.8 Chile earthquake: Triggering on multiple segments and frequency dependent rupture behavior Eric Kiser 1 and Miaki
Seismic scatterers within subducting slab revealed from ambient noise autocorrelation
 GEOPHYSICAL RESEARCH LETTERS, VOL. 39,, doi:10.1029/2012gl053321, 2012 Seismic scatterers within subducting slab revealed from ambient noise autocorrelation Yoshihiro Ito 1 and Katsuhiko Shiomi 2 Received
Teleseismic waveform modelling of the 2008 Leonidio event
 The 6 January 2008 (Mw6.2) Leonidio (southern Greece) intermediate depth earthquake: teleseismic body wave modelling Anastasia Kiratzi and Christoforos Benetatos Department of Geophysics, Aristotle University
OCEAN/ESS 410. Lab 12. Earthquake Focal Mechanisms. You can write your answers to all be (e) on this paper.
 on this paper.") Lab 1. Earthquake Focal Mechanisms You can write your answers to all be (e) on this paper. In this class we are going to use P-wave first motions to obtain a double-couple focal mechanism for a subduction
Lab 1. Earthquake Focal Mechanisms You can write your answers to all be (e) on this paper. In this class we are going to use P-wave first motions to obtain a double-couple focal mechanism for a subduction
The Kuril Islands Great Earthquake Sequence
 The 2006-2007 Kuril Islands Great Earthquake Sequence Thorne Lay 1, Charles J. Ammon 2, Kevin Furlong 2, Alexander R. Hutko 1, Hiroo Kanamori 3, Luis Rivera 4, and Aaron A. Velasco 5 The southwestern half
3D VISCO-ELASTIC WAVE PROPAGATION IN THE BORREGO VALLEY, CALIFORNIA
 3D VISCO-ELASTIC WAVE PROPAGATION IN THE BORREGO VALLEY, CALIFORNIA Kim B OLSEN 1, Robert L NIGBOR 2 And Takaaki KONNO 3 SUMMARY We have simulated 2-Hz wave propagation in a three-dimensional model of
The Size and Duration of the Sumatra-Andaman Earthquake from Far-Field Static Offsets
 The Size and Duration of the Sumatra-Andaman Earthquake from Far-Field Static Offsets P. Banerjee, 1 F. F. Pollitz, 2 R. Bürgmann 3 * 1 Wadia Institute of Himalayan Geology, Dehra Dun, 248001, India. 2
Seismic slip on an upper-plate normal fault during a large subduction megathrust rupture
 SUPPLEMENTARY INFORMATION DOI: 10.1038/NGEO2585 Seismic slip on an upper-plate normal fault during a large subduction megathrust rupture Stephen P. Hicks* and Andreas Rietbrock NATURE GEOSCIENCE www.nature.com/naturegeoscience
Global evaluation of large earthquake energy from 1997 through mid 2010
 JOURNAL OF GEOPHYSICAL RESEARCH, VOL. 116,, doi:10.1029/2010jb007928, 2011 Global evaluation of large earthquake energy from 1997 through mid 2010 J. A. Convers 1 and A. V. Newman 1 Received 12 August
of other regional earthquakes (e.g. Zoback and Zoback, 1980). I also want to find out
. I also want to find out") 4. Focal Mechanism Solutions A way to investigate source properties of the 2001 sequence is to attempt finding well-constrained focal mechanism solutions to determine if they are consistent with those
4. Focal Mechanism Solutions A way to investigate source properties of the 2001 sequence is to attempt finding well-constrained focal mechanism solutions to determine if they are consistent with those
MIGRATING SWARMS OF BRITTLE-FAILURE EARTHQUAKES IN THE LOWER CRUST BENEATH MAMMOTH MOUNTAIN, CALIFORNIA
 MIGRATING SWARMS OF BRITTLE-FAILURE EARTHQUAKES IN THE LOWER CRUST BENEATH MAMMOTH MOUNTAIN, CALIFORNIA David Shelly and David Hill GRL, October 2011 Contents Tectonic Setting Long Valley Caldera Mammoth
Data Repository of Paper: The role of subducted sediments in plate interface dynamics as constrained by Andean forearc (paleo)topography
topography") Data Repository of Paper: The role of subducted sediments in plate interface dynamics as constrained by Andean forearc (paleo)topography Nicolás J. Cosentino 1*, Felipe Aron 2,3, Jorge G. F. Crempien 2,3,
Data Repository of Paper: The role of subducted sediments in plate interface dynamics as constrained by Andean forearc (paleo)topography Nicolás J. Cosentino 1*, Felipe Aron 2,3, Jorge G. F. Crempien 2,3,
Scaling relations of seismic moment, rupture area, average slip, and asperity size for M~9 subduction-zone earthquakes
 GEOPHYSICAL RESEARCH LETTERS, VOL. 4, 7 74, doi:1.12/grl.976, 213 Scaling relations of seismic moment, rupture area, average slip, and asperity size for M~9 subduction-zone earthquakes Satoko Murotani,
A magnitude 7.4 earthquake struck 255 km (158 miles) southwest of Tonga, according to the US Geological Survey, but there were no reports of damage.
 southwest of Tonga, according to the US Geological Survey, but there were no reports of damage.") A magnitude 7.4 earthquake struck 255 km (158 miles) southwest of Tonga, according to the US Geological Survey, but there were no reports of damage. The earthquake hit at 5:19 am local time and was centered
A magnitude 7.4 earthquake struck 255 km (158 miles) southwest of Tonga, according to the US Geological Survey, but there were no reports of damage. The earthquake hit at 5:19 am local time and was centered
overlie the seismogenic zone offshore Costa Rica, making the margin particularly well suited for combined land and ocean geophysical studies (Figure
 Chapter 1 Introduction Historically, highly destructive large magnitude (M w >7.0) underthrusting earthquakes nucleate along the shallow segment of subduction zone megathrust fault, and this region of
Improvements to Seismic Monitoring of the European Arctic Using Three-Component Array Processing at SPITS
 Improvements to Seismic Monitoring of the European Arctic Using Three-Component Array Processing at SPITS Steven J. Gibbons Johannes Schweitzer Frode Ringdal Tormod Kværna Svein Mykkeltveit Seismicity
JOURNAL OF GEOPHYSICAL RESEARCH, VOL. 109, B08306, doi: /2004jb002980, 2004
 JOURNAL OF GEOPHYSICAL RESEARCH, VOL. 109,, doi:10.1029/2004jb002980, 2004 Analysis of the 2001 Geiyo, Japan, earthquake using high-density strong ground motion data: Detailed rupture process of a slab
FOCAL MECHANISM DETERMINATION OF LOCAL EARTHQUAKES IN MALAY PENINSULA
 FOCAL MECHANISM DETERMINATION OF LOCAL EARTHQUAKES IN MALAY PENINSULA Siti Norbaizura MAT SAID Supervisor: Tatsuhiko HARA MEE10505 ABSTRACT Since November 30, 2007, small local earthquakes have been observed
Online material: Updated 3-D tomography model and plotting script with examples
 Model Update January 2010: Upper Mantle Heterogeneity beneath North merica from Traveltime Tomography with Global and usarray Transportable rray Data Scott urdick, Robert D. van der Hilst, Frank L. Vernon,
GEOPHYSICAL RESEARCH LETTERS, VOL. 31, L19604, doi: /2004gl020366, 2004
 GEOPHYSICAL RESEARCH LETTERS, VOL. 31, L19604, doi:10.1029/2004gl020366, 2004 Characteristic seismic activity in the subducting plate boundary zone off Kamaishi, northeastern Japan, revealed by precise
Source Process and Constitutive Relations of the 2011 Tohoku Earthquake Inferred from Near-Field Strong-Motion Data
 Source Process and Constitutive Relations of the 2011 Tohoku Earthquake Inferred from Near-Field Strong-Motion Data Kunikazu Yoshida, Anatoly Petukhin & Ken Miyakoshi Geo-Research Institute, Japan Koji
Earth Tides Can Trigger Shallow Thrust Fault Earthquakes
 Earth Tides Can Trigger Shallow Thrust Fault Earthquakes Elizabeth S. Cochran, 1 * John E. Vidale, 1 Sachiko Tanaka 2 1 Department of Earth and Space Sciences and Institute of Geophysics and Planetary
Tomography of the 2011 Iwaki earthquake (M 7.0) and Fukushima
 and Fukushima") 1 2 3 Auxiliary materials for Tomography of the 2011 Iwaki earthquake (M 7.0) and Fukushima nuclear power plant area 4 5 6 7 8 9 Ping Tong 1,2, Dapeng Zhao 1 and Dinghui Yang 2 [1] {Department of Geophysics,
1 2 3 Auxiliary materials for Tomography of the 2011 Iwaki earthquake (M 7.0) and Fukushima nuclear power plant area 4 5 6 7 8 9 Ping Tong 1,2, Dapeng Zhao 1 and Dinghui Yang 2 [1] {Department of Geophysics,
Case Study 2: 2014 Iquique Sequence
 Case Study 2: 2014 Iquique Sequence Overview Mw 8.2 earthquake on 1 April 2014 at 11:08:43 UTC Pictures of damage Seismicity maps Foreshock seismicity -> Main shock -> Aftershock 1 April 2014 11:08:43
27th Seismic Research Review: Ground-Based Nuclear Explosion Monitoring Technologies
 GROUND TRUTH LOCATIONS USING SYNERGY BETWEEN REMOTE SENSING AND SEISMIC METHODS-APPLICATION TO CHINESE AND NORTH AFRICAN EARTHQUAKES C. K. Saikia 1, H. K. Thio 2, D. V. Helmberger 2, G. Ichinose 1, and
Supporting Online Material for
 www.sciencemag.org/cgi/content/full/326/5949/112/dc1 Supporting Online Material for Global Surface Wave Tomography Using Seismic Hum Kiwamu Nishida,* Jean-Paul Montagner, Hitoshi Kawakatsu *To whom correspondence