2013 Sediment Profile Imaging Surveys
|
|
|
- Madeline Daniel
- 6 years ago
- Views:
Transcription

1 2013 Sediment Profile Imaging Surveys Commencement Bay and Elliott Bay DMMP Sites Final October 21, 2013 NewFields nd Ave N, Suite 100 Edmonds, WA 98020
2 Cover photo compliments of Charlie Eaton Photo taken during transit to Commencement Bay September 2013 ii
3 Table of Contents 1.0 Introduction Background DMMP Disposal Site Monitoring Program Commencement Bay and Elliott Bay DMMP Sites Methods Field Survey and Deviations from the ICAP Sediment Profile Imaging Overview SPI Image Analysis Results Commencement Bay CB Ambient Sediment Characteristics Dredged Material Distribution Physical and Sedimentary Features Chemical and Biological Features Elliott Bay EB Ambient Sediment Characteristics Dredged Material Distribution Physical and Sedimentary Features Chemical and Biological Features Evaluation of the Physical Monitoring Data Question 1: Does the Dredged Material Stay On Site? Commencement Bay SPI Results Elliott Bay SPI Results References Appendix A Appendix B Appendix C SPI Image Collection and Analysis Plan (ICAP) Geographic Coordinates SPI Image Analysis Results iii
4 List of Figures Figure 2-1. Commencement Bay SPI sampling locations... 4 Figure 2-2. Elliott Bay SPI sampling locations... 5 Figure 3-1. SPI camera operations in Commencement and Elliott Bays Figure 3-2. Schematic diagram of the sediment profile camera and sequence of operation on deployment Figure 4-1. SPI images from stations CBB03-A and CBF77-A Figure 4-2. SPI images from stations CBF13-A and CBF28-B Figure 4-3. SPI results for recent dredged material thickness Figure 4-4. SPI images from stations CBZ01-B and CBC10-C Figure 4-5. SPI images from stations CBC12-A and CBF10-B Figure 4-6. SPI results for historical dredged material thickness Figure 4-7. SPI images from stations CBS07-B and CBS21-C Figure 4-8. SPI results for grain size major mode Figure 4-9. SPI results for mean camera penetration Figure SPI results for mean boundary roughness Figure SPI results for mean apparent RPD depths Figure Idealized development of infaunal succession stages over time following a physical disturbance Figure SPI results for highest successional stage Figure SPI results for median OSI Figure SPI images from stations EBS18-E and EBT03-B Figure SPI images from stations EBP08-B and EBP10-B Figure Elliott Bay SPI results for recent dredged material Figure SPI images from stations EBZ01-B and EBR01-B Figure SPI images from stations EBC08-B and EBS06-B Figure Elliott Bay SPI results for historic dredged material Figure Elliott Bay SPI results for grain size major mode Figure SPI images from stations EBC06-A and EBP03-B Figure Elliott Bay SPI results for camera penetration Figure Elliott Bay SPI results for boundary roughness Figure Elliott Bay SPI results for apparent RPD depths Figure Elliott Bay SPI results for highest successional stage Figure Elliott Bay SPI results for median OSI List of Tables Table 2-1. The DMMP monitoring framework... 3 Table 2-2. CB and EB dredged material disposal site characteristics and monitoring trigger volumes... 6 Table 2-3. Disposal volumes (cubic yards) at the CB and EB dredged material disposal site since the last full SPI surveys... 7 Table 4-1. Commencement Bay SPI summary table Table 4-2. Elliott Bay SPI summary table iv
5 1.0 Introduction The Dredged Material Management Program (DMMP) agencies (U.S. Army Corps of Engineers, Seattle District, U.S. Environmental Protection Agency, Washington Departments of Ecology and Natural Resources) jointly manage eight open-water dredged material disposal sites in Puget Sound, including five non-dispersive and three dispersive sites. The Washington Department of Natural Resources (DNR) is the lead agency for conducting chemical and biological monitoring at the non-dispersive sites and the U.S. Army Corps of Engineers, Seattle District (USACE) is the lead agency for conducting physical monitoring at both dispersive and non-dispersive sites. Physical monitoring includes bathymetric surveys at all eight sites and sediment profile imaging (SPI) surveys at the non-dispersive sites. This report presents the results of the 2013 Sediment Profile Imaging (SPI) surveys conducted in support of physical monitoring at the Commencement Bay and Elliott Bay DMMP disposal sites. The SPI Image Collection and Analysis Plan (ICAP) (Appendix A) outlines the sampling methods and analysis protocols used for conducting the SPI surveys to determine the spatial extent of recent dredged material deposits and to examine near-surface, benthic habitat conditions at selected locations at the sites. NewFields, Edmonds, WA was contracted by ANAMAR Environmental Consulting, Inc., Gainesville, FL, to perform the SPI surveys. 2.0 Background 2.1 DMMP Disposal Site Monitoring Program The original environmental monitoring plans for unconfined, open-water, dredged material disposal sites in central Puget Sound were published by the Puget Sound Dredged Disposal Analysis program agencies in 1988 (PSDDA 1988a). The monitoring plans were designed to verify that dredged material disposed at the sites remains within the disposal site boundaries and that unacceptable adverse effects do not occur either onsite or offsite due to dredged material disposal. Numerous revisions to the physical, chemical, and biological monitoring plans were made by the Dredged Material Management Program agencies between 1988 and The Updated Environmental Monitoring Plan (SAIC 2007) incorporated those changes, bringing the monitoring plans up to date. While changes have been adopted in the chemical and biological monitoring plans and procedures since 2007 (see USACE 2013), no changes have occurred to the physical monitoring plans. DMMP disposal site monitoring is designed to answer three monitoring questions through the evaluation of six testable hypotheses (Table 2-1). An SPI survey is used to evaluate the first testable hypothesis under Question 1. Dredged material is determined to have remained on site if deposits of dredged material are no greater than 3 cm at the perimeter stations. 2.2 Commencement Bay and Elliott Bay DMMP Sites The Updated Environmental Monitoring Plan (UEMP) includes the current physical monitoring requirements and procedures for the Commencement Bay (CB) and Elliott Bay (EB) sites. A description of these two sites is included in Table 2-2 and site maps are provided in Figures 2-1 and 2-2. The monitoring triggers listed in Table 2-2 are considered soft triggers, meaning that best professional judgment is applied by the DMMP agencies to determine the actual time at which monitoring will occur. At the EB site, approximately 590,000 cubic yards of material have been placed since the last SPI monitoring survey was conducted in 2002 (SEA 2002) (Table 2-3). 1
6 At the CB site, approximately 429,000 cubic yards have been placed since the last SPI survey in 2007 (SAIC 2008), which is short of the soft trigger (Table 2-3). However, the target disposal coordinates for the CB site were changed after the 2007 survey in order to reduce the height of the disposal mound (DMMP 2007). The revised coordinates are at the edge of the target area. After six years of disposal at the new coordinates, the DMMP agencies agreed that an SPI survey was appropriate to ensure that the new disposal coordinates are working as intended and the dredged material footprint is contained within the disposal site boundary. 2
7 Table 2-1. The DMMP monitoring framework No. 1 Question Hypothesis Monitored Variable Interpretive Guideline Does the deposited dredged material stay on site? No. 2 Are the biological effects conditions for site management [PSDDAdefined Site Condition II] exceeded at the site due to dredged material disposal? (PSDDA 1988b) No. 3 Are unacceptable adverse effects due to dredged material disposal occurring to biological resources off site? 1. Dredged material remains within the site boundary. 2. Chemical concentrations do not measurably increase over time due to dredged material disposal at offsite stations. 3. Sediment chemical concentrations at the onsite monitoring stations do not exceed the chemical concentrations associated with PSDDA Site Condition II guidelines due to dredged material disposal. 4. Sediment toxicity at the onsite stations does not exceed the PSDDA Site Condition II biological response guidelines due to dredged material disposal. 5. No significant increase due to dredged material disposal has occurred in the chemical body burden of benthic infauna species collected downcurrent of the disposal site. 6. No significant decrease due to dredged material disposal has occurred in the abundance of dominant benthic infaunal species collected downcurrent of the disposal site. Sediment Profile Imaging (SPI) System Onsite and Offsite Sediment Chemistry Offsite Sediment Chemistry Onsite Sediment Bioassays Onsite Tissue Chemistry Transect Infaunal Community Structure Transect Dredged material layer is greater than 3 cm at the perimeter stations. Washington State Sediment Quality Standards and Temporal analysis Onsite chemical concentrations are compared to DMMP maximum levels. DMMP Bioassay Guidelines (Section 401 Water Quality Certification) Guideline values Metals: 3x the baseline concentrations Organics: 5x the baseline concentrations Guideline values Abundance of major taxa < ½ baseline macrobenthic infauna abundances Action Item (When exceedances noted) 1 Further assessment is required to determine full extent of dredged material deposit. Post-disposal benchmark station chemistry is analyzed and compared with appropriate baseline benchmark station data. DMMP agencies may seek adjustments of disposal guidelines and compare post-disposal benchmark chemistry with appropriate baseline benchmark station data. Benchmark station bioassays are performed (if archived after monitoring) and compared with baseline benchmark bioassay data. Compare post-disposal benchmark tissue chemistry with baseline benchmark tissue chemistry data. Compare post-disposal benchmark benthic data with baseline benchmark data. 1. To determine if observed changes in chemical conditions or infaunal benthos are due to dredged material disposal, data from the benchmark stations are considered. All decisions are subject to DMMP agency review and best professional judgment. 3

8 Figure 2-1. Commencement Bay SPI sampling locations 4
9 Figure 2-2. Elliott Bay SPI sampling locations 5
10 Table 2-2. CB and EB dredged material disposal site characteristics and monitoring trigger volumes Disposal Site Area Depth Disposal Zone Target Area Site Dimensions (acres) (feet) Diameter (feet) Diameter (feet) (feet) Commencement ,800 (circle) 1,200 (circle) 4,600 x 3,800 Bay 1 (ellipsoid) Elliott Bay ,800 (circle) 1,200 (circle) 6,200 x 4,000 Site Coordinates (Lat/Long: NAD83) Monitoring Trigger Volume (cy) 500, ,000 (tear drop shape) Notes: 1 The disposal coordinates were shifted to the location listed in this table on June 16, From 1988 to June 15, 2007 the disposal coordinates were as follows: , (NAD 83). All disposal since the last full monitoring event in 2007 has occurred at the coordinates listed in the table. 2 Following site monitoring in 1990, the original EB disposal coordinates were shifted 300 feet to the south by the DMMP agencies (Striplin 1991). The disposal zone was not changed, so the disposal coordinates plotted within the disposal zone will show the disposal coordinates are off center to the south relative to the center of the disposal zone. 6
11 Table 2-3. Disposal volumes (cubic yards) at the CB and EB dredged material disposal site since the last full SPI surveys Dredge Year Commencement Bay Elliott Bay Last full SPI survey , , , Last full SPI survey 24, , , ,803 20, ,812 96, ,160 11, , ,673 a 15,266 b Total: 429, ,770 a. Last dredged material disposal at Commencement Bay occurred on 9/28/12 b. Last dredged material disposal at Elliott Bay occurred on 10/8/12 7
12 3.0 Methods 3.1 Field Survey and Deviations from the ICAP Sediment profile images were collected using a sediment-profile camera system (Figure 3-1), deployed from the research vessel (R/V) Kittiwake, as outlined in the ICAP (Appendix A). The SPI survey at the Commencement Bay (CB) DMMP site was conducted on September 13 and 14, The SPI survey at the Elliott Bay (EB) DMMP site was conducted on September 16 and 17, A total of 68 stations were sampled at the CB site and 79 stations at the EB site (see Figures 2-1 and 2-2, respectively). The ICAP specified a target of 68 stations at the CB site and 75 stations at the EB site. Triplicate images were collected at each location. The SPI surveys require 2 field days to complete at each disposal site. The traditional acrosssite approach of sampling SPI stations was followed at both the CB and EB disposal sites (see SAIC 2007). At the conclusion of the first day of SPI collection at each site, the DMMP agencies were consulted regarding target stations for Day 2 in order to delineate the dredged material footprint. Due to the shift in the CB target disposal coordinates in 2007, eight additional floating stations (CBF65, CBF66, CBF67, CBF68, CBF69, CBF70, CBF76, and CBF77) were designated to confirm the absence of dredged material in the southeast portion of the CB site. At the EB site, SPI images were also collected at the seven randomly placed dioxin sampling locations (EBR01 through EBR07) identified and sampled as part of the chemical and biological monitoring program conducted by DNR in the summer of 2013 (Integral 2013). Positioning and navigation were accomplished using the Kittiwake s differential Global Positioning System (DGPS) integrated to a computerized navigation and survey system. Geographic coordinates for each SPI replicate image are provide in Appendix B. All CB sampling stations were identified with a CB prefix and all EB stations were identified with an EB prefix. Due to the short duration of the SPI surveys, establishing a reference location at each site (e.g., marina slip) to conduct navigation checks was not feasible. Instead, the geographic coordinates obtained from the primary DGPS system were periodically compared to the Kittiwake s secondary Nobeltec DGPS system to ensure that the navigation and survey system was operating correctly. 3.2 Sediment Profile Imaging Overview SPI images were collected using a Benthos model 3731 sediment-profile camera (Benthos, Inc., North Falmouth, MA) equipped with an Ocean Imaging Systems digital camera (Figure 3-2). The sediment-profile camera consists of a wedge-shaped prism with a Plexiglas face plate and a back mirror mounted at a 45 degree angle. Light was provided by an internal strobe. The camera obtains images of up to 20 cm of the upper sediment column in profile. The camera prism was mounted on an assembly that can be moved up and down within a stainless steel frame by allowing tension or slack on the winch wire. As the camera was lowered, tension on the winch wire kept the prism in the up position. When the camera frame touched the seafloor, slack on the winch wire allowed the prism to vertically intersect the seafloor. The rate of fall of the prism (6 cm/second) was controlled by an adjustable passive hydraulic piston, which minimized the disturbance of the sediment-water interface. A trigger was tripped on impact with the bottom, activating a 13 second time-delay on the shutter release, allowing the prism to obtain maximum penetration before an image was taken. The camera was then raised from the bottom, a wiper blade automatically cleaned off any sediment 8
13 adhering to the prism faceplate, and the strobes were recharged. The camera was then lowered to collect another replicate image. 3.3 SPI Image Analysis Computer image analysis of SPI images followed a formal and standardized technique developed by Rhoads and Germano (1982, 1986). Physical and biological parameters were measured directly from the digital images by an SPI image analyst using computer image analysis software. The image analysis parameters included: Camera prism penetration depth; Sediment grain size (major mode and range); Surface boundary roughness; Presence of mud clasts; Presence of methane; Depth of the apparent redox potential discontinuity (RPD); Infaunal successional stage; Calculation of the Organism-Sediment Index (OSI); and Dredged material thickness, including determination of recent or historical if possible. All data were edited and verified by a senior-level scientist before final data synthesis, statistical analysis, and interpretation. Additional details regarding the specific measurement techniques and interpretive criteria for each parameter can be found in the ICAP (Appendix A). 9


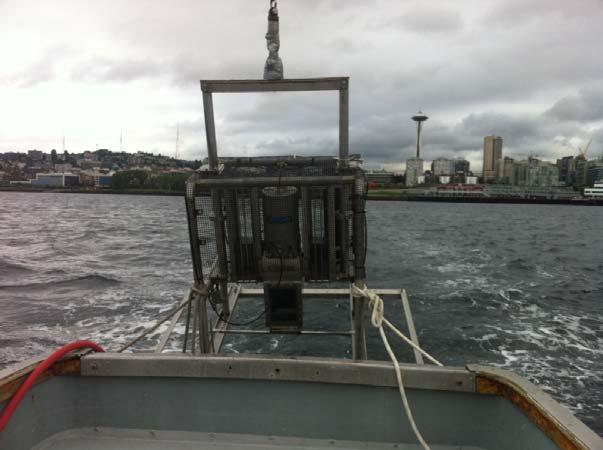

14 Figure 3-1. SPI camera operations in Commencement and Elliott Bays. 10
15 LIFTING BAR END CAP (HOUSING FOR ELECTRONICS) INNER FRAME MUD DOOR HINGE PRISM FACE PLATE OUTER FRAME WEIGHT WEIGHT PACK MUD DOOR ELASTIC STRAP MUD DOOR BASE (SLED) CAMERA WINDOW DEPLOYED ON THE "DOWN" POSITION SEAFLOOR ACOUSTIC SIGNAL TO THE SURFACE PINGER Transecting the Sediment-Water Interface SIGNAL RATE DOUBLES MIRROR SEAFLOOR 3. CAMERA PHOTOGRAPHS IMAGE OF SEDIMENT PROFILE 1. FACEPLATE or "WINDOW" OF PRISM AGAINST SURFACE TO BE PHOTOGRAPHED 2. IMAGE REFLECTS OFF 45 o MIRROR DISTILLED WATER INSIDE PRISM Figure 3-2. deployment. Schematic diagram of the sediment profile camera and sequence of operation on 11
16 4.0 Results This section presents the results of the 2013 SPI surveys conducted at the Commencement Bay (CB) and Elliott Bay (EB) DMMP dredged material disposal sites. The CB results are presented in Section 4.1, and the EB results are presented in Section 4.2. An evaluation of the SPI data in accordance with the DMMP monitoring framework is provided in Section Commencement Bay Triplicate SPI images were analyzed at 68 CB stations to map the dredged material footprint (see Figure 2-1). In addition, other physical (grain size major mode, prism penetration depth, boundary roughness), chemical (apparent RPD), and biological (successional stage and OSI) characteristics of site sediments were determined from the SPI images. A summary of mean and median values of the SPI results is provided in Table 4-1. A full summary of the image analysis results is provided in Appendix C. The primary objectives of the 2013 survey were to map the distribution of dredged material at the CB disposal site and examine near-surface, benthic habitat conditions. In addition, the survey was used to assess whether the shift in the CB target disposal coordinates in 2007 had affected the dredged material deposition patterns at the site CB Ambient Sediment Characteristics Ambient sediment characteristics near the CB site were similar to previous disposal site observations (e.g., SEA 2001, SAIC 2005, SAIC 2008), consisting of tan brown to olive gray, unconsolidated (water-rich) silts and clays with minor amounts of fine sand. The apparent RPD depths were relatively deep in these ambient sediments. Feeding voids were visible, indicating extensive bioturbation of surface sediments by head-down deposit-feeding infaunal organisms. Representative SPI images showing ambient sediment conditions at the CB site are provided in Figure 4-1. Based on previous monitoring surveys, it is known that ambient sediments to the north and northwest of the disposal site (approximately 0.5 mile or more from the northern site perimeter) consist primarily of medium to fine sands with silt. This distribution of coarse-grained sediments was observed at Commencement Bay during the original disposal site evaluation studies in central Puget Sound (PSDDA 1988a). The SPI survey grid utilized in 2013 did not extend as far to the northwest compared to previous surveys. However, five stations occupied in this northwest region in 2013 (CBF13, CBF16, CBF27, CBF28, and CBF59) showed evidence of sandy ambient sediment conditions (Figure 4-2) Dredged Material Distribution Dredged material is normally identified in SPI images by its contrasting optical appearance relative to the ambient seafloor. Multiple disposal events at a site can result in sedimentary layering with varying colors and textures, or a mixed and chaotic sedimentary fabric. Diagnostic characteristics can include differences in grain size, color and reflectivity, high boundary roughness, and a mixed or chaotic sedimentary fabric. The optical and physical characteristics of the dredged material may change over time due to the addition of newly deposited dredged material and subsequent biological mixing. However, many of the stratigraphic and textural features associated with dredged material deposits can remain the same over time. Where possible, the dredged material observed in the SPI images collected at the CB site was classified as historical or recently placed. The dredged material was identified as historic when 12
17 enough time had passed for a deep apparent RPD to be developed, feeding voids were present, and sedimentary layering due to dredged material disposal (if present) was not completely obscured through bioturbation. The CB disposal site had not received significant amounts of dredged material since 2011 (see Table 2-3). Therefore, enough time had also passed for the most recently placed dredged material to also show characteristics that could be considered historical (e.g., presence of Stage III infauna and well developed apparent RPD depths). For this survey, dredged material was classified as recent if either of the following conditions was observed: 1. The majority of sedimentary layering related to dredged material disposal was still intact 2. Significant deposits of reduced dredged material was present at depth, with minimal biological mixing The distribution of recent dredged material observed at the CB site is presented in Figure 4-3. Recent dredged material was detected in SPI images collected from 23 CB stations and the dredged material was confined within the perimeter of the disposal site, with the exception of trace or very thin accumulations detected just north of the site. A north to northwest trending pattern of dredged material is consistent with general depositional trends observed during previous monitoring surveys at the CB site (SEA 2001, SAIC 2007). Dredged material at the site center was composed of tan and gray medium and fine sands with silt (Figure 4-4). Prism penetration at stations within the disposal zone was low due to the presence of coarse-grained, consolidated dredged material. Recent dredged material along the outer flanks of the deposit consisted of trace amounts of fine sand or thin layers (0.68 to 1.44 cm) of tan and gray silt enriched with fine sand, overlying ambient sediments or historical dredged material deposits (Figure 4-5). The accumulation of recent dredged material beyond the site perimeter did not exceed the 3 cm DMMP criterion. Dredged material identified as historic was detected in images from 22 stations, primarily within the disposal site perimeter (Figure 4-6). Historic dredged material consisted of discontinuous layers of dredged material at depth, where enough time has passed for significant biological mixing of the dredged material but some evidence of the layering remains visible in the SPI images (Figure 4-7). Historic dredged material was detected at 19 stations within or along the disposal site perimeter, and three floating stations located to the north outside of the disposal site perimeter (CBF07, CBF01, and CBF63) Physical and Sedimentary Features Physical and sedimentary features determined from SPI images include grain size major mode, camera prism penetration, and boundary roughness. Grain size major mode within the CB disposal zone generally consisted of fine sand (3-2 φ) and very fine sand (4-3 φ) due to the presence of coarse grained dredged material (Figure 4-8). Outside of the disposal zone, the sediment grain size consisted of very fine sand (4-3 φ) to silt-clays (> 4 φ). As discussed in Section 4.1.1, fine and very fine sand were present in ambient areas to the north and northwest of the disposal site. However, the major mode for those locations was still silt-clay. Where multiple sediment layers were present, the grain size major mode represented the sediment layer most prevalent within the SPI image. The distribution of SPI camera prism penetration (in centimeters) in CB sediments is presented in Figure 4-9. Prism penetration provides a relative measure of sediment bearing capacity. Unconsolidated, fine-grained sediments that experience bioturbation generally have higher water 13
18 content and deeper prism penetration than coarse grained, compact sediments. The shallowest prism penetration was measured in the disposal zone (2.3 to 6.6 cm) due to the presence of compact, coarse-grained dredged material (see Figure 4-4). Prism penetration was deeper outside of the disposal zone, with an average of 15.5 cm (± 2.7 cm). Mean bottom boundary roughness measurements during the 2013 SPI survey are shown in Figure Mean small-scale boundary roughness (surface relief) can be physical or biological in nature, and is the difference between the highest and lowest penetration depth measured in an SPI image. Physical boundary relief can include surface ripples, mud clasts, and irregular surface features due to dredged material disposal or bottom currents. Biogenic activity that creates boundary roughness includes fecal mounds, burrow excavations, and foraging and feeding pits. The average surface relief during the 2013 survey was 2.03 cm (± 1.38 cm). The majority of surface relief was identified as biogenic (94% of stations). Mean boundary roughness at stations within the disposal site boundary were generally less than surrounding areas. Higher concentrations of dredged material were present onsite, particularly the disposal zone, which contained a higher proportion of sand and tended to maintain a lower surface relief (see Figure 4-6) Chemical and Biological Features Chemical and biological parameters include the apparent RPD depth, benthic infaunal successional stage, and calculation of the OSI. These parameters provide an assessment of the overall health of the benthic habitat at the Commencement Bay disposal site. Apparent Redox Potential Discontinuity The apparent RPD depth estimates the depth of oxygenation in the upper sediment column and provides an estimate of the biological mixing depth by infaunal organisms. Mean apparent RPD depths at the CB site range from 1.74 to 5.68 cm, with an average depth of 3.83 cm (Figure 4-11). The shallowest apparent RPD depths (<2.0 cm) were measured at the center of the disposal site, where the most dredged material disposal has occurred. The major mode of mean apparent RPD depths during the 2013 SPI survey was 3.5 to 4.0 cm, which is deeper than the most recent survey in 2007 (major mode of 2.5 to 3.0 cm) and the survey in 2005 (major mode of 3.0 to 3.5 cm). The deeper apparent RPD depths in 2013 are consistent with the hiatus of significant dredged material disposal at the CB site since 2011, allowing time for the benthic organisms to recolonize and biologically mix the dredged material sediments. Benthic Infaunal Successional Stage Benthic infaunal communities generally follow a three-stage succession following a disturbance of the seafloor (Figure 4-12) (Pearson and Rosenberg 1978, Rhoads and Germano 1986). Stage I infauna typically colonize the sediment surface soon after disturbance (e.g., following dredged material disposal). These opportunistic organisms may consist of small, tubicolous, surfacedwelling polychaetes. Stage II organisms are typically shallow-dwelling bivalves or tubedwelling amphipods. Stage II communities are considered a transitional community before reaching Stage III, the high-order successional stage consisting of long-lived, infaunal depositfeeding organisms. Stage III invertebrates may feed at depth in a head-down orientation and create distinctive feeding voids visible in SPI images. Stage I on III benthic communities were observed at 55 stations at the CB site. Five stations within the site boundary (CBC04, CBC05, CBC08, CBS06, and CBZ01) showed the presence of 14
19 only Stage I succession. (Figure 4-13). Seven stations, including one within the disposal site (CBC06), one perimeter station (CBP02), three floating stations (CBF63, CBF70, CBF77), and two transect stations (CBT01, and CBT02), showed the presence of only Stage III succession. Stage II on III succession was observed at two stations; one within the disposal site (CBS21) and one floating station to the north (CBF07). The indicator species for Stage II classification at Commencement Bay was the stick building amphipod (Podoceridae) (see Figure 4-7). The benthic community appears to be in the last stages of transition to the highest order of succession (full Stage III community) following the most recent dredged material disposal. Organism Sediment Index (OSI) The Organism Sediment Index (OSI) provides a measure of general benthic habitat quality in shallow water environments based on dissolved oxygen conditions, depth of apparent RPD, infaunal successional stage, and presence or absence of sedimentary methane measured from SPI images (Rhoads and Germano 1986). The OSI is a numerical index ranging from -10 to +11. The lowest value is given to bottom sediments with low or no dissolved oxygen in the overlying bottom water, no apparent macrofaunal life, and methane gas present in the sediment. The OSI for such a condition is -10 (highly disturbed or degraded benthic habitat quality). High OSI values are given to aerobic bottom sediments with deep apparent RPD depths, mature macrofaunal community, and no methane gas (unstressed or undisturbed benthic habitat quality). Previous SPI surveys conducted in various marine and coastal regions have shown that OSI values between +7 and +11 are typical of natural, undisturbed, fine grained sediments. OSI values less than +6 can indicate a stressed or disturbed benthic environment, and values less than 0 indicate degraded benthic habitat. The distribution of median OSI values calculated at the CB site is presented in Figure Median OSI values ranged from +5 to +11 within the disposal site boundary as well as offsite. The lowest median OSI values in Commencement Bay (+5) were observed at two stations (CBZ01 and CBC08) within or close to the disposal zone boundary. The vast majority of stations (97%) had OSI values equal to or greater than +6, which indicated natural or undisturbed benthic habitat in nearly all areas of the CB site. The two year hiatus of significant dredged material disposal at the CB site has confirmed that a healthy and resilient benthic infaunal community continues to thrive in Commencement Bay sediments. 15
20 Table 4-1. Commencement Bay SPI summary table Station Avg Prism Pen. (cm) Dredged Material Thickness Recent (cm) Dredged Material Thickness Historical (cm) Grain Size Major Mode (phi) Avg. Surface Boundary Roughness (cm) Mud Clasts Mean RPD Highest Successional Stage CBB >4 phi 2.13 present 4.85 Stage I on III 7 CBB to 3 phi Stage I on III 11 CBB to 3 phi 1.61 present 3.8 Stage I on III 11 CBC >4 phi 1.3 present 3.53 Stage I on III 10 CBC >4 phi Stage I on III 11 CBC to 2 phi 2.21 present 4.12 Stage I on III 11 CBC > to 2 phi Stage I 6 CBC > 2.98 >4 phi 1.11 >2.28 Stage I 7 CBC > to 3 phi Stage III 7 CBC >4 phi Stage I on III 10 CBC >4 phi Stage I 5 CBC > 3.95 > 1.81 >4 phi 1.41 >3.24 Stage I on III 7 CBC > 6.28 >4 phi 1.77 >2.19 Stage I on III 8 CBC > 7.80 >4 phi Stage I on III 8 CBC > 9.86 >4 phi 1.59 present 2.17 Stage I on III 8 CBF >4 phi 1.61 present 3.85 Stage I on III 11 CBF >4 phi Stage I on III 11 CBF to 3 phi 3 present 4.53 Stage II on III 11 CBF >4 phi Stage I on III 11 CBF >4 phi Stage I on III 11 CBF >4 phi Stage I on III 10 CBF to 2 phi Stage I on III 10 CBF to 3 phi Stage I on III 11 CBF >4 phi Stage I on III 11 CBF >4 phi Stage I on III 11 CBF >4 phi Stage I on III 10 CBF >4 phi Stage I on III 11 CBF >4 phi Stage I on III 10 CBF >4 phi 2.65 present 4.57 Stage I on III 11 CBF > 3.80 >4 phi 1.21 present 4.68 Stage III 11 CBF >4 phi Stage I on III 11 CBF >4 phi Stage I on III 10 CBF >4 phi Stage I on III 10 CBF >4 phi 1.64 present 5.68 Stage I on III 11 CBF >4 phi Stage I on III 11 CBF >4 phi Stage III 11 CBF >4 phi Stage I on III 11 CBF >4 phi 0.82 present 5.03 Stage III 11 CBP >4 phi Stage I on III 11 CBP >4 phi 2.2 present 3.45 Stage III 10 CBP >4 phi Stage I on III 9 CBP > >4 phi Stage I on III 10 CBP >4 phi Stage I on III 9 CBP to 3 phi 4.82 present 4.09 Stage I on III 11 CBP >4 phi Stage I on III 11 CBP >4 phi Stage I on III 11 CBP >4 phi Stage I on III 10 CBP >4 phi Stage I on III 10 CBP >4 phi 1.51 present 3.52 Stage I on III 10 Median OSI 16
21 Station Avg Prism Pen. (cm) Dredged Material Thickness Recent (cm) Dredged Material Thickness Historical (cm) Grain Size Major Mode (phi) Avg. Surface Boundary Roughness (cm) Note: Grain size major mode ranges can be found in Appendix C. Mud Clasts Mean RPD Highest Successional Stage CBP > 1.02 >4 phi 2.16 present 4.56 Stage I on III 11 CBS >4 phi 1.38 present 3.74 Stage I on III 11 CBS > >4 phi 1.11 present 3.88 Stage I on III 11 CBS >4 phi 0.93 present 2.8 Stage I on III 9 CBS > >4 phi 1.77 present 4.33 Stage I on III 11 CBS > 8.29 >4 phi Stage I on III 10 CBS > >4 phi Stage I 6 CBS > >4 phi Stage I on III 10 CBS > >4 phi Stage I on III 7 CBS > >4 phi Stage I on III 11 CBS > 9.65 >4 phi 3.11 present 3.37 Stage II on III 10 CBT >4 phi Stage III 11 CBT >4 phi Stage III 9 CBT >4 phi Stage I on III 7 CBT >4 phi Stage I on III 10 CBT >4 phi 1.5 present 4.64 Stage I on III 11 CBT >4 phi Stage I on III 10 CBT >4 phi 2 present 3.45 Stage I on III 10 CBZ present >4 phi 1.19 >1.74 Stage I 5 Median OSI 17
 and Station CBF77 replicate B (CBF77-B) showed fine-grained ambient")

22 CBB03-A CBF77-B Figure 4-1. SPI images from stations CBB03-A and CBF77-A Station CBB03 replicate A (CBB03-A) and Station CBF77 replicate B (CBF77-B) showed fine-grained ambient sediments observed near the Commencement Bay DMMP disposal site. Both locations showed relatively deep apparent RPD depths and evidence of wellestablished benthic infaunal communities. A sea cucumber (Molpadia intermedia) was observed at depth at CBB03-A (arrow), and well developed feeding voids were observed at CBF77-B (arrows) created by head-down deposit-feeding organisms (Stage III successional stage). Image width is 14.6 cm. 18

23 CBF13-A CBF28-B Figure 4-2. SPI images from stations CBF13-A and CBF28-B Stations CBF13-A and CBF28-A are located to the northwest of the disposal site and showed the presence of ambient sediments containing higher proportions of sand. The sediments consisted of brown to gray silty fine sands grading to gray silt with depth. Both images showed polychaetes at depth with well developed feeding voids created by head-down deposit feeding organisms. Image width is 14.6 cm. 19

24 Figure 4-3. SPI results for recent dredged material thickness 20


25 CBZ01-B CBC10-C Figure 4-4. SPI images from stations CBZ01-B and CBC10-C Stations CBZ01-B and CBC10-C are located within the disposal zone and showed the presence of recent dredged material deposits consisting of compact sands intermixed with silt. Camera prism penetration was relatively low due to the coarse-grained consolidated nature of the dredged material. A small feeding void (arrow) was visible within the sediment column at CBC-10A, indicating the recolonization of head-down deposit feeding organisms near the site center. Image width is 14.6 cm. 21

26 CBC12-A CBF10-B Recent Dredged Material Trace of Recent Dredged Material Figure 4-5. SPI images from stations CBC12-A and CBF10-B Thin layers of dredged material were observed at stations CBC12-A and CBF10-B along the flanks of the dredged material deposit. CBC12-A showed surface concentrations of gray fine sand interpreted to be recent dredged material. Historical dredged material was visible at depth evidenced by discontinuous reduced sedimentary layers and extensive biological mixing (arrow pointing to feeding void at depth). Traces of fine sand mixed in the surface at CBF10-B along the northern flanks of the deposit were interpreted to be recent dredged material. Subsurface sediments are well mixed indicative of ambient sediment conditions. Image width is 14.6 cm. 22
27 Figure 4-6. SPI results for historical dredged material thickness 23


28 CBS07-B CBS21-C Figure 4-7. SPI images from stations CBS07-B and CBS21-C Stations CBS07-B and CBS21-C are located onsite within the disposal site boundary and showed the presence of historical dredged material deposits. The historical dredged material consisted of reduced sediments at depth that have experienced extensive mixing by infaunal organisms. CBS07-B showed well developed feeding voids within the reduced sediment layer. The optical signature of the reduced layer was further obscured in CBS21-C with a possible burrowing shrimp (black arrow) at depth. Stick building amphipods (Podoceridae) are present on the sediment surface (white arrow), a Stage II infaunal organism. Image width is 14.6 cm. 24
29 Figure 4-8. SPI results for grain size major mode 25

30 Figure 4-9. SPI results for mean camera penetration 26
31 Figure SPI results for mean boundary roughness 27
32 Figure SPI results for mean apparent RPD depths 28

33 Figure Idealized development of infaunal succession stages over time following a physical disturbance Source: Rhodes and Germano (1986), modified from Pearson and Rosenberg (1978) 29
34 Figure SPI results for highest successional stage 30
35 Figure SPI results for median OSI 31
36 4.2 Elliott Bay Triplicate SPI images were analyzed at 79 EB stations to map the dredged material footprint and physical (grain size major mode, prism penetration depth, boundary roughness), chemical (apparent RPD depth), and biological (successional stage and OSI) characteristics of site sediments. A summary of mean and median values of the SPI results is provided in Table 4-2. The full summary of the image analysis results is provided in Appendix C EB Ambient Sediment Characteristics Ambient sediment characteristics in Elliott Bay have historically consisted of silty fine sand to fine sandy silt in shallower areas to the south and near-shore, and water-rich unconsolidated silt and clay in the central trough region. The 2013 SPI results at the EB site were consistent with these characteristics and example SPI images showing fine-grained ambient sediments are provided in Figure Apparent RPD depths were relatively deep in these ambient sediments. Feeding voids were visible indicating extensive bioturbation of surface sediments by head-down deposit-feeding infaunal organisms. The ambient sediment grain size in the southern portion of EB is influenced by the sediment loadings from the Duwamish River. Consequently, coarser tan to gray fine sand was present along the southern and eastern shores of Elliott Bay, appearing in SPI images as homogeneous silty fine sand to fine sandy silt, or sand inter-mixed into the underlying fine-grained sediments (Figure 4-16) Dredged Material Distribution Recent dredged material was detected in SPI images collected from 18 stations at the EB site, and the dredged material was confined within the perimeter of the disposal site (Figure 4-17). Dredged material within the disposal zone was composed of light gray silt and clay with some very fine sand, or layers of reduced organic silt and fine sand (Figure 4-18). At the site center (CBZ01), light gray and dark gray silt and clay layers were overlain by tan brown oxidized sandy silt. Along the flanks of the dredged material deposit, recent dredged material consisted of elevated concentrations of fine sand in surface sediments typically overlying historical dredged material deposits (Figure 4-19). The accumulation of recent dredged material was contained within the site perimeter and the 3 cm DMMP criterion for dredged material accumulation was not exceeded. Historic dredged material was detected in images from 14 stations (three central cross stations and 11 site stations), all located within the disposal site boundary (Figure 4-20). The dredged material was identified as historic primarily if sedimentary layering of the dredged material had been obscured by bioturbation, but the optical signature of the dredged material layers could still be recognized. Examples of historical dredged material observed at the EB site are provided in Figure In these examples, a thin layer of recent dredged material was also present above the historical deposit. The overall footprint of historical dredged material was similar to the recent dredged material, which suggests that the dredged material deposition pattern following disposal at the EB site has remained relatively consistent. When disposed, the dredged material appears to settle in and around the disposal zone region and is contained within the disposal site perimeter Physical and Sedimentary Features Physical and sedimentary features determined from SPI images included grain size major mode in phi (Φ) sizes and camera prism penetration. The grain size major mode was >4 Φ at 81% of 32
37 the EB stations (64 stations) and 4 3 Φ at 16 stations to the southwest and extending to the northwest along the western rise originating near the mouth of the West Waterway of the Duwamish River (Figure 4-21). The coarser grained sediment observed along this rise is likely attributed to sediment loading by the Duwamish River, which enters Elliott Bay in the southeast and flows across the EB disposal site to the northwest. The Denny Hill re-grade area also appeared to contribute to the coarser grain material observed in the northeast region of the disposal site near the disposal perimeter (Figure 4-22). Camera penetration depths varied significantly throughout the disposal site (range of 1.34 to cm) with a mean of cm (± 4.02 cm) (Figure 4-23). The deepest penetration depths were observed in the northern portion of the disposal site and northwest of the disposal perimeter along the transect stations. Generally shallower penetration was observed near the disposal zone. The lowest camera penetration within the disposal zone occurred at a single station within the disposal zone (EBC06) due the presence of compact dredged material (see Figure 4-22). Lower camera penetration was observed at several stations located along the western rise, including two stations within the disposal site boundary (EBS29 and EBS32) as well as perimeter station EBP13. Low penetration was also observed at northeastern perimeter station CBP03 where sands and rocks were present. Mean bottom boundary roughness measurements (surface relief) during the 2013 SPI survey are shown in Figure Similar to Commencement Bay, the boundary roughness was classified as biological at nearly all SPI stations (96 percent of stations) at the EB site. The average surface relief during the 2013 survey was 1.80 cm (±1.21 cm) with a range of 0.2 cm to 7.39 cm. Much of the high surface relief observed could be attributed to biogenic activity that has created large surface burrow excavations (e.g., Figure 4-15). Mean boundary roughness at stations within the disposal site boundary, particularly near the disposal zone, were generally less than surrounding areas due to the presence of dredged material where the presence of large burrows was less frequent Chemical and Biological Features Chemical and biological parameters include the apparent RPD depth, benthic infaunal successional stage, and calculation of the OSI. These parameters provide an assessment of the overall health of the benthic habitat at the Elliott Bay disposal site. Apparent Redox Potential Discontinuity The apparent RPD depth estimates the depth of oxygenation in the upper sediment column and provides an estimate of the biological mixing depth by infaunal organisms. Mean apparent RPD depths at the Elliott Bay site range from 1.34 to 4.67 cm, with an average depth of 3.16 cm (± 0.87 cm) (Figure 4-25). The shallowest apparent RPD depths (<2.25 cm) were measured just outside the disposal zone (Stations EBS11, EBS16, EBS20, EBS21 and EBC08). Interestingly, the apparent RPD depths within the disposal zone were slightly deeper, ranging from 1.39 to 4.38 cm with an average of 2.83 cm (± 0.82 cm) (see Figure 4-18). Benthic Infaunal Successional Stage Stage I on III benthic communities were observed at 67% of the EB stations (53 stations) and Stage III succession was observed at 27% of the EB stations (21 stations). Two stations within the site boundary (EBC06 and EBS29) and two perimeter stations (EBP03 and EBP08) showed the presence of only Stage I succession. (Figure 4-26). Overall, the EB site benthic community 33
38 appears to be in a climax situation with the highest order of succession (Stage III communities) present at 95% of the stations following the most recent dredged material disposal. Organism Sediment Index (OSI) The distribution of median OSI values calculated at the EB site is presented in Figure Median OSI values ranged from +3 to +11 within the disposal site boundary as well as offsite. The lowest OSI value in Elliott Bay (+3) was observed just outside the disposal zone at station EBS21. Five additional stations within the disposal site boundary (EBS16, EBS29, EBS32 EBC12 and EBC06) had OSI values of +5 or less indicating a potentially distressed or disturbed benthic habitat. The disposal of dredged material within the disposal site boundary is expected to have a short term impact on the benthic community, and lower OSI values are expected following recent dredged material disposal. OSI values of +5 or less were also observed at three perimeter stations (EBP03, EBP08 and EBP13). The sediments at these locations consisted of consolidated coarse grained sediments where Stage III infauna was not present and camera penetration was very low. The majority of stations (87%) had OSI values equal to or greater than +6, which indicates natural or undisturbed benthic habitat throughout much of Elliott Bay. 34
39 Table 4-2. Elliott Bay SPI summary table Station Avg Prism Pen. (cm) Dredged Material Thickness Recent (cm) Dredged Material Thickness Historical (cm) Grain Size Major Mode (phi) Avg. Surface Boundary Roughness (cm) Mud Clasts Mean RPD Highest Successional Stage EBB to 3 phi Stage I on III 8 EBB > 4 phi Stage I on III 7 EBB > 4 phi Stage I on III 9 EBB > 4 phi Stage III 9 EBC > to 3 phi 0.51 present >2.43 Stage I 5 EBC > > 4 phi Stage I on III 8 EBC > 5.83 > 8.37 > 4 phi Stage I on III 8 EBC > 4 phi Stage I on III 11 EBC > 7.87 > 4 phi Stage I on III 10 EBC > > 4 phi Stage III 11 EBC > > 4 phi Stage I on III 5 EBC > > 4 phi Stage I on III 10 EBP > 4 phi Stage III 9 EBP to 3 phi Stage I 5 EBP > 4 phi Stage I on III 10 EBP > 4 phi 1.81 present 4.43 Stage I on III 7 EBP > 4 phi Stage I on III 10 EBP to 3 phi Stage I on III 9 EBP to 3 phi Stage I 5 EBP to 3 phi Stage I on III 9 EBP to 3 phi Stage I on III 9 EBP > 4 phi 1.16 present 2.79 Stage I on III 9 EBP > 4 phi Stage I on III 10 EBP to 3 phi Stage I on III 5 EBP > 4 phi Stage I on III 9 EBP > 4 phi 2.26 present 3.65 Stage III 11 EBR > > 4 phi Stage III 11 EBR > 4 phi Stage III 10 EBR > 4 phi 1.06 >3.04 Stage I on III 7 EBR > 4 phi Stage I on III 11 EBR > 4 phi Stage I on III 11 EBR > > 4 phi Stage III 9 EBR > 4 phi 1.77 present 3.62 Stage I on III 10 EBS > 6.71 > 4 phi Stage I on III 7 EBS > 4 phi Stage III 11 EBS > 4 phi Stage I on III 10 EBS > 4 phi Stage III 9 EBS > 4 phi Stage III 11 EBS > 4 phi 0.99 present 3.34 Stage III 10 EBS > 4 phi 1.65 present 3.25 Stage I on III 9 EBS > 4 phi Stage I on III 11 EBS > 4 phi Stage I on III 10 EBS > 8.5 > 4 phi Stage I on III 8 EBS > 4 phi Stage III 10 EBS to 3 phi Stage I on III 11 EBS > 4 phi Stage III 11 EBS > to 3 phi Stage I on III 9 EBS > 3.63 > 4.58 > 4 phi 1.15 present 1.99 Stage I on III 4 EBS > 4 phi Stage III 9 Median OSI 35
40 Station Avg Prism Pen. (cm) Dredged Material Thickness Recent (cm) Dredged Material Thickness Historical (cm) Grain Size Major Mode (phi) Avg. Surface Boundary Roughness (cm) Note: Grain size major mode ranges can be found in Appendix C. Mud Clasts Mean RPD Highest Successional Stage EBS > 4 phi Stage III 11 EBS > 4 phi Stage III 10 EBS > 7.77 > 3.47 > 4 phi 1.78 present 2.16 Stage I on III 8 EBS > 9.61 > 4 phi 1.56 present 1.34 Stage I on III 3 EBS > 4 phi 3.64 present 4.32 Stage III 11 EBS > 4 phi Stage III 10 EBS > 4 phi Stage I on III 10 EBS > 4 phi 2.46 present 4.67 Stage I on III 11 EBS > 4 phi Stage III 11 EBS > > 4.60 > 4 phi Stage I on III 6 EBS > 4 phi 1.86 present 2.5 Stage I 5 EBS to 3 phi Stage III 11 EBS > 4 phi 0.84 present 3.38 Stage I on III 10 EBS > 4 phi 1.61 present 2.08 Stage I on III 5 EBS > 4 phi Stage I on III 9 EBS > 4 phi Stage I on III 9 EBS > 4 phi 2.13 present 4.64 Stage III 11 EBS > 4 phi Stage I on III 10 EBS > 4 phi Stage I on III 11 EBT > 4 phi Stage I on III 9 EBT to 3 phi Stage I on III 5 EBT > 4 phi Stage I on III 8 EBT to 3 phi Stage I on III 10 EBT to 3 phi Stage I on III 6 EBT to 3 phi Stage I on III 10 EBT > 4 phi Stage I on III 9 EBT > 4 phi 1.62 present 3 Stage I on III 10 EBT > 4 phi Stage I on III 9 EBT > 4 phi Stage III 7 EBZ > to 3 phi Stage I on III 9 Median OSI 36

41 EBS18-E EBT03-B Figure SPI images from stations EBS18-E and EBT03-B Station EBS18-E and EBT03-B showed fine-grained ambient sediments observed in the vicinity of the Elliott Bay DMMP disposal site. Both locations showed homogeneous silt clay with deep apparent RPD depths and evidence of well-established benthic infaunal communities with Stage III infauna. A large surface burrow and void were present at EBS18-E, and a large, well formed feeding void was observed at EBT03-B. Image width is 14.6 cm. 37

42 EBP08-B EBP10-B Figure SPI images from stations EBP08-B and EBP10-B Station EBP08-B and EBP10-B, along the south and southwest perimeter showed ambient sediments consisting of tan to gray fine sandy silt. The elevated concentration of sand present in the southern portion of EB was likely due to sediment loadings from the Duwamish River. Stage I surface tubes were visible in both images, and a very large, well developed feeding void was present at depth at EBP10-B. Image width is 14.6 cm. 38

43 Figure Elliott Bay SPI results for recent dredged material 39


44 EBZ01-B EBR01-B Figure SPI images from stations EBZ01-B and EBR01-B Stations EBZ01-B and EBR01-B showed recent dredged material greater than camera penetration observed at the disposal zone. The recent dredged material consisted of light and dark gray silt clay layers with sand. Both images showed brownish gray fine sand and silt surface layers, which signified relatively deep apparent RPD depths. Woody debris was present at the surface of EBZ01-B and feeding voids (Stage III infauna) were present at the dredged material layer interface (arrows). The subsurface dredged material layers have remained mostly intact. Image width is 14.6 cm. 40


45 EBC08-B EBS06-B Recent Dredged Material Recent Dredged Material Figure SPI images from stations EBC08-B and EBS06-B Stations EBC08-B and EBS06-B showed thin surface layers of recent dredged material overlying historic dredged material. The recent dredged material consisted of elevated concentrations of fine sand in the upper few centimeters of the sediment surface. The historic dredged material at depth consisted of discontinuous reduced sedimentary layers. Enough time had passed for extensive bioturbation of the dredged material, which masked much of the sedimentary layering. Image width is 14.6 cm. 41
46 Figure Elliott Bay SPI results for historic dredged material 42
47 Figure Elliott Bay SPI results for grain size major mode 43


48 EBC06-A EBP03-B Figure SPI images from stations EBC06-A and EBP03-B Onsite station EBC06-A showed very low camera penetration due to the presence of compact sands, presumed to be dredged material. A rounded wood piece and shell were present on the sediment surface. Perimeter station EBP03-B is located along the northeast perimeter of the site and showed the presence of compact sands and rocks with shell debris. This coarse grained sediment may be related to materials deposited from the Denny Hill re-grade. Image width is 14.6 cm. 44
49 Figure Elliott Bay SPI results for camera penetration 45

50 Figure Elliott Bay SPI results for boundary roughness 46

51 Figure Elliott Bay SPI results for apparent RPD depths 47
Redwood City Harbor, California, Navigation Improvement Feasibility Study. Appendix D. Geotechnical Engineering. DRAFT April 2015
 1 Redwood City Harbor, California, Navigation Improvement Feasibility Study Appendix D Geotechnical Engineering DRAFT April 2015 2 Contents 1 Purposes of Report... 3 2 Background... 3 3 References and
Monitoring Survey at the Mark Island Disposal Site July Disposal Area Monitoring System DAMOS
 Monitoring Survey at the Mark Island Disposal Site July 2002 Disposal Area Monitoring System DAMOS Contribution 143 February 2003 REPORT DOCUMENTATION PAGE form approved OMB No. 0704-0188 Public reporting
Highland Lake Bathymetric Survey
 Highland Lake Bathymetric Survey Final Report, Prepared For: The Town of Highland Lake 612 Lakeshore Drive Oneonta, AL 35121 Prepared By: Tetra Tech 2110 Powers Ferry Road SE Suite 202 Atlanta, GA 30339
Coring and sediment sampling
 Coring and sampling Principle: In order to ground-truth geophysical data, it is necessary to obtain a sample of the seabed. There are two main techniques available for sampling unconsolidated s : (1) seabed
Final Report Sediment Profile Imaging Survey Of Sediment And Benthic Habitat Characteristics Of The Lower Passaic River
 August, 2005 Final Report Sediment Profile Imaging Survey Of Sediment And Benthic Habitat Characteristics Of The Lower Passaic River Lower Passaic River Restoration Project Prepared for: Aqua Survey, Inc
6 PREPARING THE SAMPLING AND ANALYSIS PLAN (SAP)
") 6 PREPARING THE SAMPLING AND ANALYSIS PLAN (SAP) Once the required numbers of DMMUs and field samples have been calculated and a dredging plan conceived, a sampling plan must be developed. The DMMUs and
6 PREPARING THE SAMPLING AND ANALYSIS PLAN (SAP) Once the required numbers of DMMUs and field samples have been calculated and a dredging plan conceived, a sampling plan must be developed. The DMMUs and
PCB Aroclor Concentrations in Puget Sound Sediments
 PCB Aroclor Concentrations in Puget Sound Sediments Margaret Dutch, Sandra Aasen and Edward R. Long Washington State Department of Ecology Environmental Assessment Program [Editor s note: Tables and Figures
Appendix I. Dredged Volume Estimates. Draft Contractor Document: Subject to Continuing Agency Review
 Appendix I Dredged Volume Estimates Draft Contractor Document: Subject to Continuing Agency Review Interoffice Correspondence Date: April 6, 2007 To: L. Bossi (WHI) Copy: S. Thompson (WHI), B. Fidler (NNJ)
IN SITU SPECIFIC GRAVITY VS GRAIN SIZE: A BETTER METHOD TO ESTIMATE NEW WORK DREDGING PRODUCTION
 IN SITU SPECIFIC GRAVITY VS GRAIN SIZE: A BETTER METHOD TO ESTIMATE NEW WORK DREDGING PRODUCTION Nancy Case O Bourke, PE 1, Gregory L. Hartman, PE 2 and Paul Fuglevand, PE 3 ABSTRACT In-situ specific gravity
Appendix D Sediment Profile and Plan View Imaging Report
 Appendix D Sediment Profile and Plan View Imaging Report April 2010 Sediment Profile & Plan View Imaging Report Evaluation of Sediment and Benthos Characteristics Along Potential Cable Routes and Turbine
Disposal Area Monitoring System DAMOS
 Monitoring Survey at the Cape Cod Bay Disposal Site August 2003 Disposal Area Monitoring System DAMOS Cape Cod Bay, Massachusetts 5 Duxbury Massachusetts Bay Provincetown Long Point Contribution 157 August
US ARMY CORPS OF ENGINEERS New England District BUILDING STRONG
 US ARMY CORPS OF ENGINEERS New England District STUDIES Sediment Sampling Biological Sampling (benthic community analysis) Hydroacoustic Surveys (side scan sonar, bathymetry) Remotely Operated Vehicle
Final Survey/Data Report
 US ARMY CORPS OF ENGINEERS New England District Contract No. DACW33-03-D-004 Delivery Order No. 05 November 2004 Final Survey/Data Report Boston Harbor Deep Draft Navigation Improvement Project Biological
Mound Study Project Cape Fear, North Carolina Report Summary VIMS Reports: CHSD to CHSD EHI Project No
 Mound Study Project Cape Fear, North Carolina Report Summary VIMS Reports: CHSD-2003-02 to CHSD-2003-06 EHI Project No. 6000.21 February 2003 Final VIMS Report CHSD-2003-01 Prepared for Evans-Hamilton,
Disposal Area Monitoring System DAMOS
 Data Summary Report: New London Disposal Site and Vicinity Sediment-Profile and Plan-View Imaging Survey September 2014 Disposal Area Monitoring System DAMOS Data Summary Report 2014-01 March 2015 This
THE QUATERNARY GEOLOGY OF NEWARK BAY AND KILL VAN KULL CHANNEL, NEW YORK AND NEW JERSEY. and
 THE QUATERNARY GEOLOGY OF NEWARK BAY AND KILL VAN KULL CHANNEL, NEW YORK AND NEW JERSEY Stephanie Beda, W. Bruce Ward, William Murphy, Robert Fleming, Gary Fleming, Beckett Boyd Earthworks LLC 27 Glen
Correlation of gravel deposits from trenching project on Alder Creek fluvial terrace near Point Arena, California
 Correlation of gravel deposits from trenching project on Alder Creek fluvial terrace near Point Arena, California Aletha Lee Department of Geology and Geography, West Virginia University, White Hall, Morgantown,
ANALYSIS OF SEISMIC PROFILES AND SIDE-SCAN SONAR RECORDS FROM LOWER NEW YORK HARBOR, A PROGRESS REPORT. Roger D. Flood Vicki Lynn Ferrini
 45 ANALYSIS OF SISMIC PROFILS AND SID-SCAN SONAR RCORDS FROM LOWR NW YORK HARBOR, A PROGRSS RPORT Roger D. Flood Vicki Lynn Ferrini Marine Sciences Research Center State University of New York, Stony Brook,
MAINTENANCE DREDGE BENTHIC ASSESSMENT SUNSET POINT FARM LLC LONG POINT KEY MONROE COUNTY, FLORIDA. Prepared by:
 MAINTENANCE DREDGE BENTHIC ASSESSMENT SUNSET POINT FARM LLC LONG POINT KEY MONROE COUNTY, FLORIDA Prepared by: December 11, 2016 INTRODUCTION The owners of the Sunset Point Farms LLC, located on the northern
Anderson-Ketron PSDDA Disposal Site Fate and Transport Modeling
 Pierce County Washington Anderson-Ketron PSDDA Disposal Site Fate and Transport Modeling Design Memorandum September 2014 Table of Contents 1 Introduction... 3 1.1 Purpose and Scope... 3 1.2 Project Description:
APPENDIX F SEDIMENT PROFILE REPORT
 APPENDIX F SEDIMENT PROFILE REPORT F-1 F-2 Appendix F SEDIMENT PROFILE CAMERA RECONNAISSANCE OF BENTHIC HABITATS IN DELAWARE BAY, SEPTEMBER 2000. Robert J. Diaz R. J. Diaz and Daughters 6198 Driftwood
MEMORANDUM FOR SWG
 MEMORANDUM FOR SWG-2007-1623 Subject: Jurisdictional Determination (JD) for SWG-2007-1623 on Interdunal Wetlands Adjacent to Traditional Navigable Waters (TNWs) Summary The U.S. Environmental Protection
2000 harbor benthic monitoring report
 2 harbor benthic monitoring report Massachusetts Water Resources Authority Environmental Quality Department Report ENQUAD 22-2 Citation: Kropp RK, Diaz RJ, Dahlen DT, Boyle JD, Hunt, CD. 22. 2 Harbor Benthic
Bishopville Prong Study
 Bathymetric and Sediment Assessment in the Bishopville Prong of St. Martin River Darlene V. Wells, Richard A. Ortt, Jr., and Stephen Van Ryswick Funded by MCBP 2011-2012 Implementation Grant Objectives
STABILITY AND RECOVERY OF CAPPED IN-CHANNEL CAD CELLS: BOSTON HARBOR, MASSACHUSETTS
 STABILITY AND RECOVERY OF CAPPED IN-CHANNEL CAD CELLS: BOSTON HARBOR, MASSACHUSETTS Steven Wolf 1, Marcia Greenblatt 2, Thomas J. Fredette 3, Drew A. Carey 4, Stephanie Kelly 5, Robert J. Diaz 6, Pamela
Award # N LONG TERM GOALS
 Non-Invasive Characterization Of Small-Scale Patterns Of Benthic Biogenic Structure By Ultrasound: Infaunal Dynamics And Sediment Structure, And Effect Of Sediment Disturbance Donald G. Webb Graduate School
Monitoring Survey Over Boston Harbor CAD Cell M19. Disposal Area Monitoring System DAMOS
 Monitoring Survey Over Boston Harbor CAD Cell M19 Disposal Area Monitoring System DAMOS Contribution 148 October 2003 REPORT DOCUMENTATION PAGE form approved OMB No. 0704-0188 Public reporting concern
Sedimentary Features in Expedition 341 Cores: A Guide to Visual Core Description
 Sedimentary Features in Expedition 341 Cores: A Guide to Visual Core Description 1. Typical Deep water Sediments in the Gulf of Alaska 1A & B: Mud and 1C: Laminated mud Description: Mud is representative
Lecture Outline Wednesday - Friday February 14-16, 2018
 Lecture Outline Wednesday - Friday February 14-16, 2018 Quiz 2 scheduled for Friday Feb 23 (Interlude B, Chapters 6,7) Questions? Chapter 6 Pages of the Past: Sedimentary Rocks Key Points for today Be
The Role of Seafloor Characterization and Benthic Habitat Mapping in Dredged Material Management: A Review
 J. of Marine Env. Eng., Vol. 7, pp. 185-215 2004 Old City Publishing, Inc. Reprints available directly from the publisher Published by license under the OCP Science imprint, Photocopying permitted by license
Joint Federal Agency Submerged Aquatic Vegetation Survey Guidance for the New England Region Updated August 11, 2016
 Joint Federal Agency Submerged Aquatic Vegetation Survey Guidance for the New England Region Updated August 11, 2016 FOREWORD This guidance is the result of on-going interagency collaboration between the
J.H. Campbell Generating Facility Pond A - Location Restriction Certification Report
 J.H. Campbell Generating Facility Pond A - Location Restriction Certification Report Pursuant to: 40 CFR 257.60 40 CFR 257.61 40 CFR 257.62 40 CFR 257.63 40 CFR 257.64 Submitted to: Consumers Energy Company
Marine Sediments. Introductory Oceanography. Ray Rector: Instructor
 Marine Sediments Introductory Oceanography Ray Rector: Instructor Ocean Basins are Vast Sinks for Huge Amounts of Sediment from Numerous Different Sources Four Major Types of Seafloor Sediments 1. Lithogenous
3. MARINE HABITAT RESTORATION
 Feasibility Study for Restoration of Titlow Lagoon Fish Passage South Puget Sound Salmon Enhancement Group 3. MARINE HABITAT RESTORATION Marine habitat restoration at Titlow Park could include restoration
Sediment and sedimentary rocks Sediment
 Sediment and sedimentary rocks Sediment From sediments to sedimentary rocks (transportation, deposition, preservation and lithification) Types of sedimentary rocks (clastic, chemical and organic) Sedimentary
Third Annual Monitoring Report Tidal Wetland Restoration 159 Long Neck Point Road, Darien, CT NAE
 1) Project Overview Third Annual Monitoring Report Tidal Wetland Restoration 159 Long Neck Point Road, Darien, CT NAE-2007-1130 December 15, 2014 This is the third year of a five year monitoring program
Feet. SAND; clayey, fine grained; shells are common; rounded quartz grains. SHELLS; muddy; almost no sand, shells and fragments common
 SAND; clayey, fine grained; shells are common; rounded quartz grains SHELLS; muddy; almost no sand, shells and fragments common SAND; back to medium to fine; has a mottled appearance and looks burrowed;
Lecture Outlines PowerPoint. Chapter 13 Earth Science 11e Tarbuck/Lutgens
 Lecture Outlines PowerPoint Chapter 13 Earth Science 11e Tarbuck/Lutgens 2006 Pearson Prentice Hall This work is protected by United States copyright laws and is provided solely for the use of instructors
EPS 50 Lab 4: Sedimentary Rocks
 Name: EPS 50 Lab 4: Sedimentary Rocks Grotzinger and Jordan, Chapter 5 Introduction In this lab we will classify sedimentary rocks and investigate the relationship between environmental conditions and
THIN-LAYER PLACEMENT OF DREDGE MATERIAL FOR MARSH NOURISHMENT, RESOTRATION, AND RESPONSE TO SEA LEVEL RISE
 THIN-LAYER PLACEMENT OF DREDGE MATERIAL FOR MARSH NOURISHMENT, RESOTRATION, AND RESPONSE TO SEA LEVEL RISE Case studies and lesson learned regarding thin-layer deposition projects in Delaware, New Jersey,
Bowen s Chemical Stability Series
 Lab 5 - Identification of Sedimentary Rocks Page - Introduction Sedimentary rocks are the second great rock group. Although they make up only a small percentage of the rocks in the earth s crust (~5%)
Disposal Area Monitoring System DAMOS
 Field Verification Program (FVP) Disposal Mound Monitoring Survey 2005 Disposal Area Monitoring System DAMOS Connecticut CLDS 72 51'30"W 72 51'30"W 41 9'30"N 41 9'30"N 41 9'30"N 41 9'30"N Contribution
B-1. Attachment B-1. Evaluation of AdH Model Simplifications in Conowingo Reservoir Sediment Transport Modeling
 Attachment B-1 Evaluation of AdH Model Simplifications in Conowingo Reservoir Sediment Transport Modeling 1 October 2012 Lower Susquehanna River Watershed Assessment Evaluation of AdH Model Simplifications
Field test of a novel, low-cost, scanner-based sediment profile imaging camera
 LIMNOLOGY and OCEANOGRAPHY: METHODS Limnol. Oceanogr.: Methods 4, 2006, 30 37 2006, by the American Society of Limnology and Oceanography, Inc. Field test of a novel, low-cost, scanner-based sediment profile
Environmental impact assessment study of the new offshore dumping sites for Šventoji port in Lithuania
 Environmental impact assessment study of the new offshore dumping sites for Šventoji port in Lithuania Introduction Summary In 2003 Lithuanian Ministry of Transport initiated the preparation of feasibility
Fish and Fish Habitat Follow-up Program. Scotian Basin Exploration Project
 Fish and Fish Habitat Follow-up Program Scotian Basin Exploration Project April 2018 Contents 1 Introduction... 1 2 Scope... 1 3 EIS Commitments and Predictions... 2 4 Methodology and Reporting... 2 4.1
SAN FRANCISCO DISTRICT INFORMATION REQUESTED FOR VERIFICATION OF CORPS JURISDICTION
 DEPARTMENT OF THE ARMY SAN FRANCISCO DISTRICT, U.S. ARMY CORPS OF ENGINEERS 1455 MARKET STREET SAN FRANCISCO, CALIFORNIA 94103-1398 SAN FRANCISCO DISTRICT INFORMATION REQUESTED FOR VERIFICATION OF CORPS
Estimated Sediment Volume: Bridge Street Dam Impoundment, Royal River, Yarmouth, Maine
 University of Southern Maine USM Digital Commons Publications Casco Bay Estuary Partnership (CBEP) 2015 Estimated Sediment Volume: Bridge Street Dam Impoundment, Royal River, Yarmouth, Maine Stantec Follow
Shallow Karst Aquifer System of the Lake Belt Study Area, Miami-Dade County, Florida, USA EXTENDED ABSTRACT
 Second International Conference on Saltwater Intrusion and Coastal Aquifers Monitoring, Modeling, and Management. Merida, Mexico, March 30 April 2, 2003 Shallow Karst Aquifer System of the Lake Belt Study
ENGINEER S CERTIFICATION OF FAULT AREA DEMONSTRATION (40 CFR )
") PLATTE RIVER POWER AUTHORITY RAWHIDE ENERGY STATION BOTTOM ASH TRANSFER (BAT) IMPOUNDMENTS LARIMER COUNTY, CO ENGINEER S CERTIFICATION OF FAULT AREA DEMONSTRATION (40 CFR 257.62) FOR COAL COMBUSTION RESIDUALS
PLATTE RIVER POWER AUTHORITY RAWHIDE ENERGY STATION BOTTOM ASH TRANSFER (BAT) IMPOUNDMENTS LARIMER COUNTY, CO ENGINEER S CERTIFICATION OF FAULT AREA DEMONSTRATION (40 CFR 257.62) FOR COAL COMBUSTION RESIDUALS
UNIT 4 SEDIMENTARY ROCKS
 UNIT 4 SEDIMENTARY ROCKS WHAT ARE SEDIMENTS Sediments are loose Earth materials (unconsolidated materials) such as sand which are transported by the action of water, wind, glacial ice and gravity. These
1999 harbor benthic monitoring report
 1999 harbor benthic monitoring report Massachusetts Water Resources Authority Environmental Quality Department Report ENQUAD 2001-03 Citation: Kropp RK, Diaz RJ, Dahlen DT, Boyle JD, Hunt, CD. 2000. 1999
USE OF GEOPHYSICAL SURVEYS FOR FILL CHARACTERIZATION AND QUANTITY ESTIMATION AT BROWNFIELD SITES A CASE HISTORY. Abstract
 USE OF GEOPHYSICAL SURVEYS FOR FILL CHARACTERIZATION AND QUANTITY ESTIMATION AT BROWNFIELD SITES A CASE HISTORY John A. Mundell, Mundell & Associates, Inc., Indianapolis, IN Gregory B. Byer, Mundell &
A lithological map created from multibeam backscatter data in challenging circumstances: the Lower Sea Scheldt estuary
 A lithological map created from multibeam backscatter data in challenging circumstances: the Lower Sea Scheldt estuary Mieke Mathys*, Marc Sas*, Frederik Roose** HYDRO12, Rotterdam, 15/11/2012 *International
Changes in Geomorphology and Backscatter Patterns in Mount Misery Shoal, Long Island Sound as Revealed through Multiple Multibeam Surveys
 Changes in Geomorphology and Backscatter Patterns in Mount Misery Shoal, Long Island Sound as Revealed through Multiple Multibeam Surveys Laurie A. Zaleski Laurie.Zaleski@msrc.sunysb.edu, Roger D. Flood
Disposal Area Monitoring System DAMOS
 Monitoring Survey at the New London Disposal Site July/ August 2007 Disposal Area Monitoring System DAMOS Contribution 180 May 2009 2 cm This report should be cited as: AECOM. 2009. Monitoring Survey at
Monitoring Cruise at the New London Disposal Site Volume II Seawolf Mound. Disposal Area Monitoring System DAMOS
 Monitoring Cruise at the New London Disposal Site 1992-1998 Volume II Seawolf Mound Disposal Area Monitoring System DAMOS Contribution 132 December 2001 REPORT DOCUMENTATION PAGE Form approved OMB No.
GY 111 Lecture Note Series Sedimentary Environments 2: Rivers and Deltas
 GY 111 Lecture Notes D. Haywick (2008-09) 1 GY 111 Lecture Note Series Sedimentary Environments 2: Rivers and Deltas Lecture Goals A) Rivers and Deltas (types) B) Water Flow and sedimentation in river/deltas
POST CABLE INSTALLATION THERMAL MONITORING PROGRAM LONG ISLAND REPLACEMENT CABLE PROJECT NORWALK, CT OSI JOB# 08ES069
 28 July 2009 Mark D. Driscoll, M.S. Senior Water Resources Scientist. 888 Worcester Street, Suite 2 Wellesley, MA 02482 SUBJECT: FINAL REPORT POST CABLE INSTALLATION THERMAL MONITORING PROGRAM LONG ISLAND
ESC102. Sedimentary Rocks. Our keys to the past. Monday, February 11, 13
 ESC102 Sedimentary Rocks Our keys to the past Sedimentary Rocks Sedimentary rocks are rocks that form through the accumulation of sediment and the process of lithification. Lithification occurs after deposition
SEABED MORPHOLOGY OFF SOUTHERN LONG ISLAND: STUDIES OF ARTIFICIAL REEFS AND IMPLICATIONS FOR WIND FARMS. Juliet Kinney & Roger D.
 SEABED MORPHOLOGY OFF SOUTHERN LONG ISLAND: STUDIES OF ARTIFICIAL REEFS AND IMPLICATIONS FOR WIND FARMS Juliet Kinney & Roger D. Flood Marine Sciences Research Center, Stony Brook University Stony Brook,
MaxDepth Aquatics, Inc.
 MaxDepth Aquatics, Inc. Bathymetry of Mirror Pond From Newport Bridge to Galveston Bridge Prepared for the City of Bend By Joseph Eilers & Benn Eilers MaxDepth Aquatics, Inc. Bend, OR June 2005 INTRODUCTION
CHAPTER 28. PHYSIOGRAPHY Cook Inlet Drainages
 PEBBLE PROJECT ENVIRONMENTAL BASELINE DOCUMENT 2004 through 2008 CHAPTER 28. PHYSIOGRAPHY Cook Inlet Drainages PREPARED BY: Knight Piésold Ltd. PHYSIOGRAPHY COOK INLET DRAINAGES TABLE OF CONTENTS TABLE
Applying Electrical Resistivity Methods for Measuring Dredged Material Density in Hopper Bins
 DRP-3-07 November 1992 Dredging Technical Research Notes Applying Electrical Resistivity Methods for Measuring Dredged Material Density in Hopper Bins Purpose This technical note provides information on
Foundations of Earth Science, 6e Lutgens, Tarbuck, & Tasa
 Foundations of Earth Science, 6e Lutgens, Tarbuck, & Tasa Oceans: The Last Frontier Foundations, 6e - Chapter 9 Stan Hatfield Southwestern Illinois College The vast world ocean Earth is often referred
Mangrove Erosion in the Mekong delta
 Mangrove Erosion in the Mekong delta 1. Introduction a. Mangrove coast - a balance between different forcing factors Mangroves are coastal environments frequently observed in the tropical muddy coasts.
Relatively little hard substrate occurs naturally in the
 CHAPTER FIVE Rock Habitats Relatively little hard substrate occurs naturally in the estuary, owing mainly to the vast quantities of fine sediment that have been deposited by the rivers. Rock habitat is
Seismic Reflection Imaging across the Johnson Ranch, Valley County, Idaho
 Seismic Reflection Imaging across the Johnson Ranch, Valley County, Idaho Report Prepared for the Skyline Corporation Lee M. Liberty Center for Geophysical Investigation of the Shallow Subsurface (CGISS)
Soil Sampling Results Former Truck Maintenance Garage
 Soil Sampling Results Former Truck Maintenance Garage Maine Yankee Decommissioning Project Corrective Measures Study May 2004 Prepared for: Maine Yankee 321 Old Ferry Road, Bailey Point Wiscasset, ME 04578
Nova Scotia Department of Fisheries and Aquaculture. Environmental Monitoring Program Summary
 Nova Scotia Department of Fisheries and Aquaculture Environmental Monitoring Program Summary 2015 Table of Contents 1 Environmental Monitoring Program Overview... 1 2 2015 EMP... 5 2.1 Level I... 5 2.1.1
Island Design. UMRS EMP Regional Workshop. Presentation for the
 Island Design Presentation for the UMRS EMP Regional Workshop by Jon Hendrickson Hydraulic Engineer Regional Technical Specialist, Water Quality and Habitat Restoration August 17 19, 2005 Project Delivery
Paleo Lab #4 - Sedimentary Environments
 Paleo Lab #4 - Sedimentary Environments page - 1. CHARACTERISTICS OF SEDIMENT Grain size and grain shape: The sizes and shapes of sedimentary particles (grains) are modified considerably during their transportation
Case Study: Sediment Contamination by Mercury and DDT and Ecological Risk Assessment for Aquatic Biota, Lake Maggiore, Italy
 Intersol March 19th, 2014 Case Study: Sediment Contamination by Mercury and DDT and Ecological Risk Assessment for Aquatic Biota, Lake Maggiore, Italy CO-AUTHORED BY E Bizzotto and F Colombo PRESENTED
3.0 ROBERTS BANK TIDAL FLAT MORPHOLOGY
 Vancouver Port Authority Northwest Hydraulic Consultants Ltd. /Triton Consultants Ltd. Roberts Bank Container Expansion File: 33863 Coastal Geomorphology Study - 19 - November 2004 3.0 ROBERTS BANK TIDAL
Sediment Traps. CAG Meeting May 21, 2012
 Sediment Traps CAG Meeting May 21, 2012 Agenda Background Fundamentals of Sediment Transport Sediment Trap Existing Information Next Steps 2 The Site Saginaw River 22 mile river beginning at confluence
NAME: GEL 109 Final Winter 2010
 GEL 109 Final Winter 2010 1. The following stratigraphic sections represents a single event followed by the slow accumulation of background sedimentation of shale. Describe the flows that produced the
THE DEPOSITS OF TSUNAMIS WESLEY PESANTEZ, CATHERINE NIELD, COLIN WINTER
 THE DEPOSITS OF TSUNAMIS WESLEY PESANTEZ, CATHERINE NIELD, COLIN WINTER AN OVERVIEW OF OUR SEMINAR WHAT IS A TSUNAMI WHY STUDY TSUNAMIS PROPERTIES OF TSUNAMIS TSUNAMI HYDRODYNAMICS IDEALIZED DEPOSITS SEDIMENT
Wilson Bay Sediment Profile Imaging: 1. Instrument Test
 Environment Waikato Technical Report 2006/09 Wilson Bay Sediment Profile Imaging: 1. Instrument Test Prepared by: Kay C. Vopel, Greig Funnell (National Institute of Water & Atmospheric Research Ltd) For:
Precision of Environmental Dredging Factors and Processes
 Precision of Environmental Dredging Factors and Processes Michael Palermo - Mike Palermo Consulting, Inc. John Kern Kern Statistical Services, Inc. Presented at DREDGING 2012 October 22-25, 2012, San Diego,
Background Information
 Oceanography LAB #1: Marine Charts and Navigation Background Information Latitude and Longitude A coordinate is an address a means of designating location. Most coordinate systems involve a network of
Lake Worth Lagoon Waterways Town of Palm Beach, Florida North Waterway
 North Waterway STATE OF FLORIDA PROJECT AREA N R-100 R-101 R-102 R-103 R-104 R-105 R-106 R-107 R-108 R-109 R-0 R-1 T-2 R-3 R-4 R-5 R-6 R-7 R-8 North Waterway Central Waterway South Waterway Dredge Hole
Waterbury Dam Disturbance Mike Fitzgerald Devin Rowland
 Waterbury Dam Disturbance Mike Fitzgerald Devin Rowland Abstract The Waterbury Dam was completed in October 1938 as a method of flood control in the Winooski Valley. The construction began in April1935
The Lee River Landslide
 The Lee River Landslide Meghan O'Donnell Jon Bevan Geomorphology December 5, 2003 Abstract: Steep hillslopes that lie adjacent to active stream channels are prone to landsliding. Glaciolacustrine material
Environmental Science
 Environmental Science A Study of Interrelationships Cui Jiansheng Hebei University of Science and Technology CH06 Kinds of Ecosystems and Communities Chapter Objectives After reading this chapter, you
Development and Testing of Bed Sediment Samplers Nazirah Apandi 1,a, Zulkiflee Ibrahim 1,b
 Development and Testing of Bed Sediment Samplers Nazirah Apandi 1,a, Zulkiflee Ibrahim 1,b 1 Faculty of Civil Engineering, Universiti Teknologi Malaysia, Malaysia a nazeera_jb@yahoo.com, b zulkfe@utm.my
ES120 Sedimentology/Stratigraphy
 Midterm Exam 5/05/08 NAME: 1. List or describe 3 physical processes that contribute to the weathering of rocks (3pts). exfoliation frost wedging many others. roots, thermal expansion/contraction also credit
Procedure for Determining Near-Surface Pollution Sensitivity
 Procedure for Determining Near-Surface Pollution Sensitivity Minnesota Department of Natural Resources Division of Ecological and Water Resources County Geologic Atlas Program March 2014 Version 2.1 I.
coastalmanagement Wriggle Porirua Harbour Intertidal Sediment Monitoring 2010/11
 coastalmanagement Porirua Harbour Intertidal Sediment Monitoring 2010/11 Prepared for Greater Wellington Regional Council June 2011 Porirua Harbour Onepoto Arm - lower estuary. Porirua Harbour Intertidal
DRAFT ONONDAGA LAKE CAPPING AND DREDGE AREA AND DEPTH INITIAL DESIGN SUBMITTAL H.4 SEISMIC SLOPE STABILITY ANALYSES
 DRAFT ONONDAGA LAKE CAPPING AND DREDGE AREA AND DEPTH INITIAL DESIGN SUBMITTAL H.4 SEISMIC SLOPE STABILITY ANALYSES Parsons P:\Honeywell -SYR\444576 2008 Capping\09 Reports\9.3 December 2009_Capping and
Ground Water Protection Council 2017 Annual Forum Boston, Massachusetts. Ben Binder (303)
") Ground Water Protection Council 2017 Annual Forum Boston, Massachusetts Protecting Groundwater Sources from Flood Borne Contamination Ben Binder (303) 860-0600 Digital Design Group, Inc. The Problem Houston
Ground Water Protection Council 2017 Annual Forum Boston, Massachusetts Protecting Groundwater Sources from Flood Borne Contamination Ben Binder (303) 860-0600 Digital Design Group, Inc. The Problem Houston
Objectives: Define Relative Age, Absolute Age
 S6E5. Students will investigate the scientific view of how the earth s surface is formed. c. Classify rocks by their process of formation. g. Describe how fossils show evidence of the changing surface
Donald K. Stauble and Bill Birkemeier Coastal and Hydraulics Laboratory US Army Corps of Engineers
 Donald K. Stauble and Bill Birkemeier Coastal and Hydraulics Laboratory US Army Corps of Engineers Define the Problem Navigation Shore Protection Environmental Political So what is the problem? Management
Disposal Area. Monitoring System DAMOS. o At: 0 S. Monitoring Cruise at the Central Long Island Sound Disposal Site July 1996.
 Monitoring Cruise at the Central Long Island Sound Disposal Site July 1996 Disposal Area ; Monitoring System DAMOS o At: 0 S "iiiij;nspc>bo;w:.. 6--,DAIHQ---s-,s,-..., Contribution 120 May 1998 US Army
Draft exercise for share fair at Bozeman workshop only. This exercise is not ready for distribution. Please send helpful suggestions to
 Draft exercise for share fair at Bozeman workshop only. This exercise is not ready for distribution. Please send helpful suggestions to foleyd@plu.edu Figure list 1. Trailer photograph 2. Location map
Sedimentary Rocks. Origin, Properties and Identification. Physical Geology GEOL 100. Ray Rector - Instructor
 Sedimentary Rocks Origin, Properties and Identification Physical Geology GEOL 100 Ray Rector - Instructor Sedimentary Rock Origin and Identification Lab Pre-Lab Internet Link Resources 1) http://www.rockhounds.com/rockshop/rockkey/index.html
Re: Steep Slope Assessment for 2465 Waverly Drive, Blind Bay, BC; Legal Address: Lot 39, Section 18, Township 22, Range 10, Plan 25579, W6M, KDYD.
 OEL File 1563-1 May 30, 2017 Doug Wall PO Box 774 Salmon Arm, BC V1E 4N7 Re: Steep Slope Assessment for 2465 Waverly Drive, Blind Bay, BC; Legal Address: Lot 39, Section 18, Township 22, Range 10, Plan
Lowest and Youngest Terrace : Soil Pit #4
 Lowest and Youngest Terrace : Soil Pit #4 Observations : Where : Huntington Terraces Climate : Cloudy, mid 60 s Our soil pit was the lowest of the 4 sites The pit site was located on the right side of
Seagrass Transplantation & Environmental & Marine Consulting Services, Inc. Drew Campbell, Vice President & Lead Scientst.
 Indian River Lagoon Symposium Seagrass Transplantation & Project Considerations Environmental & Marine Consulting Services, Inc. Drew Campbell, Vice President & Lead Scientst March 26 th, 2013 Regulatory
Foundation Engineering Prof. Mahendra Singh Department of Civil Engineering Indian Institute of Technology, Roorkee
 Foundation Engineering Prof. Mahendra Singh Department of Civil Engineering Indian Institute of Technology, Roorkee Module - 03 Lecture - 05 Field Tests Hello viewers, welcome back to the course on Foundation
LINGUAU DEPOSITION IN THE WOODBINE SANDS ALONG COPPERAS BRANCH, DENTON COUNTY. TEXAS: A STUDY IN MARINE SEDIMENTATION
 LINGUAU DEPOSITION IN THE WOODBINE SANDS ALONG COPPERAS BRANCH, DENTON COUNTY. TEXAS: A STUDY IN MARINE SEDIMENTATION Ellis W. Shuler and Olin M. Millican The lack of outcrops in three dimensions often