User Guide to TopoToolbox - Plotting ksn-values
|
|
|
- Darleen Megan Thornton
- 5 years ago
- Views:
Transcription

1 User Guide to TopoToolbox - Plotting ksn-values Background... 1 Load and generate required data... 2 Calculating the concavity index... 4 Calculate and plot ksn values... 4 Aggregate ksn values in stream segments... 5 Plot stream segments... 5 Export as shapefile... 6 Background Stream profiles carry information on tectonic and/or climatic perturbations in the form of knickpoints migrating in upstream direction. Plotting ksn-values provides a means to quantify deviations from the logarithmic channel length profile and thus enables to detect and visualize these locations in the stream network. The basic assumption behind ksn-values is that the stream power model of sediment transport/incision applies, e.g., sediment transport or incision are functions of the energy expenditure of water when moving downstream. In a landscape evolution context, the stream power model is written in following (simplified) form where refers to the uplift rate, is the upslope area, is the slope and, and are coefficients. In steady state the processes uplift and incision are in equilibrium such that each point along the profile. Hence, the equation is rearranged at
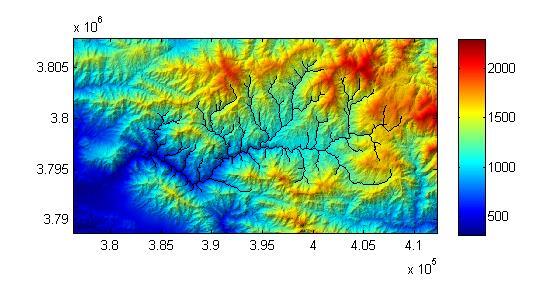
2 The terms are rewritten so that and where refers to the normalized channel steepness and to the channel concavity. ranges between 0.3 and 0.8 and often takes on the value It can be determined either based on slopearea plots (see function slopearea) or -plots (see function chiplot). Load and generate required data DEM = GRIDobj('srtm_bigtujunga30m_utm11.tif'); FD = FLOWobj(DEM,'preprocess','carve'); A = flowacc(fd); The quality of the DEM is relatively bad, so we correct it by imposing a downward minimum gradient. DEM = imposemin(fd,dem,0.0001); Subsequently, we extract a stream network by thresholding flow accumulation. In this example, we simply assume that channels occupy cells that have a minimum upslope area of 1000 pixels. S = STREAMobj(FD,'minarea',1000); S = klargestconncomps(s,1); We modify the stream network somewhat so that we avoid to include the alluvial areas in the most downstream portion of the profile. S = modify(s,'distance',10000); In order to remove small stream sections we again extract the largest connected component of the network. S = klargestconncomps(s,1); imageschs(dem); hold on plot(s,'k') hold off
3 plotdz(s,dem)
4 Calculating the concavity index After extracting the channel network of interest, we calculate the concavity index using the slopearea function. Note that slopearea returns the concavity index including its negative sign! STATS = slopearea(s,dem,a) Exiting: Maximum number of function evaluations has been exceeded - increase MaxFunEvals option. Current function value: STATS = a: [84x1 double] g: [84x1 double] hpoints: ks: theta: hline: Calculate and plot ksn values Subsequently, we calculate the ksn-values for the entire grid. While this won't make sense for hillslope sections, our aim is to generate a grid that we can later reference with the stream network (STREAMobj).
; scatter(x,y,5,ksn,'filled') caxis([0 2000]) title('ksn values') box on colorbar axis image Aggregate ksn values in stream segments Note that in the above")
5 G = gradient8(dem); KSN = G./(A.*(A.cellsize^2)).^STATS.theta; [x,y,ksn] = STREAMobj2XY(S,KSN); scatter(x,y,5,ksn,'filled') caxis([0 2000]) title('ksn values') box on colorbar axis image Aggregate ksn values in stream segments Note that in the above figure each channel location in the grid is plotted. There are two problems arising from doing so. First, owing to the high point density in the xy plane some of the points and their color may not be visible due to overlapping. Second, owing to the poor quality of the DEM the ksn-values are strongly variable at short distances. Note the large variability in the main river trunk! To avoid both problems, ksn values should be generalized along stream segments. This is achieved with the function STREAMobj2mapstruct. Here we use a stream segment length of 1 km (1000 m). MS = STREAMobj2mapstruct(S,'seglength',1000,'attributes',... {'ksn' 'uparea' 'gradient' Plot stream segments MS is a mapstruct that you can plot using mapshow and makesymbolspec. Both functions are available with the mapping toolbox. We use a coloring based on percentiles of the data. symbolspec = makesymbolspec('line',... {'ksn' [min([ms.ksn]) max([ms.ksn])] 'color' jet(6)});

6 imageschs(dem,dem,'colormap',gray,'colorbar',false); mapshow(ms,'symbolspec',symbolspec); Export as shapefile Alternativly, you may want to choose another software to visualize the stream network together with ksn values. In order to do so, you will need the function shapewrite available with the mapping toolbox (in case you don't have access to the toolbox, check the Mathworks fileexchange for functions with same functionality). shapewrite(ms,'ksn_testshape.shp');
1. From raw topographic data to a river long-profile analysis. At the Matlab prompt, type. DEM = GRIDobj('srtm_bigtujunga30m_utm11.
 Earth and Planetary Surface Processes Winter 2017 - Lab 4. River channel long profiles. Wieboldt 310C, 10:30a-11:20a Grades are not assigned for lab, but attendance is required. If you are unable to make
Topographic metrics and bedrock channels Outline of this lecture
 Topographic metrics and bedrock channels Outline of this lecture Topographic metrics Fluvial scaling and slope-area relationships Channel steepness sensitivity to rock uplift Advancing understanding of
Down-stream process transition (f (q s ) = 1)
 = 1)") Down-stream process transition (f (q s ) = 1) Detachment Limited S d >> S t Transport Limited Channel Gradient (m/m) 10-1 Stochastic Variation { Detachment Limited Equilibrium Slope S d = k sd A -θ d S
Down-stream process transition (f (q s ) = 1) Detachment Limited S d >> S t Transport Limited Channel Gradient (m/m) 10-1 Stochastic Variation { Detachment Limited Equilibrium Slope S d = k sd A -θ d S
Drainage Basin Geomorphology. Nick Odoni s Slope Profile Model
 Drainage Basin Geomorphology Nick Odoni s Slope Profile Model Odoni s Slope Profile Model This model is based on solving the mass balance (sediment budget) equation for a hillslope profile This is achieved
Using ArcGIS for Hydrology and Watershed Analysis:
 Using ArcGIS 10.2.2 for Hydrology and Watershed Analysis: A guide for running hydrologic analysis using elevation and a suite of ArcGIS tools Anna Nakae Feb. 10, 2015 Introduction Hydrology and watershed
Using Earthscope and B4 LiDAR data to analyze Southern California s active faults
 Using Earthscope and B4 LiDAR data to analyze Southern California s active faults Exercise 8: Simple landscape morphometry and stream network delineation Introduction This exercise covers sample activities
Watershed Modeling With DEMs
 Watershed Modeling With DEMs Lesson 6 6-1 Objectives Use DEMs for watershed delineation. Explain the relationship between DEMs and feature objects. Use WMS to compute geometric basin data from a delineated
mountain rivers fixed channel boundaries (bedrock banks and bed) high transport capacity low storage input output
 high transport capacity low storage input output") mountain rivers fixed channel boundaries (bedrock banks and bed) high transport capacity low storage input output strong interaction between streams & hillslopes Sediment Budgets for Mountain Rivers Little
mountain rivers fixed channel boundaries (bedrock banks and bed) high transport capacity low storage input output strong interaction between streams & hillslopes Sediment Budgets for Mountain Rivers Little
Drainage rearrangement: a modelling approach
 Drainage rearrangement: a modelling approach Maricke van Leeuwen June, 2013 i ii Drainage rearrangement: a modelling approach MSc thesis (SGL-80436) Maricke van Leeuwen 901027509070 MSc Earth and Environment,
LAB-SCALE INVESTIGATION ONBAR FORMATION COORDINATES IN RIVER BASED ON FLOW AND SEDIMENT
 LAB-SCALE INVESTIGATION ONBAR FORMATION COORDINATES IN RIVER BASED ON FLOW AND SEDIMENT Mat Salleh M. Z., Ariffin J., Mohd-Noor M. F. and Yusof N. A. U. Faculty of Civil Engineering, University Technology
This Powerpoint presentation summarizes the use of NetMap for a Fire Decision Support System. Created on Sept 25, 2015 by Dr. Lee Benda and Kevin
 This Powerpoint presentation summarizes the use of NetMap for a Fire Decision Support System. Created on Sept 25, 2015 by Dr. Lee Benda and Kevin Andras (TerrainWorks). 1 The general approach strategy:
Landscape Development
 Landscape Development Slopes Dominate Natural Landscapes Created by the interplay of tectonic and igneous activity and gradation Deformation and uplift Volcanic activity Agents of gradation Mass wasting
MODULE 7 LECTURE NOTES 5 DRAINAGE PATTERN AND CATCHMENT AREA DELINEATION
 MODULE 7 LECTURE NOTES 5 DRAINAGE PATTERN AND CATCHMENT AREA DELINEATION 1. Introduction Topography of the river basin plays an important role in hydrologic modelling, by providing information on different
Welcome to NetMap Portal Tutorial
 Welcome to NetMap Portal Tutorial Potential Applications What Can you do with the Portal? At least 25 things! 1) Locate the best potential fish habitats. 2) Identify biological hotspots. 3) Map floodplain
Determination of uplift rates of fluvial terraces across the Siwaliks Hills, Himalayas of central Nepal
 Determination of uplift rates of fluvial terraces across the Siwaliks Hills, Himalayas of central Nepal Martina Böhme Institute of Geology, University of Mining and Technology, Freiberg, Germany Abstract.
Streams. Stream Water Flow
 CHAPTER 14 OUTLINE Streams: Transport to the Oceans Does not contain complete lecture notes. To be used to help organize lecture notes and home/test studies. Streams Streams are the major geological agents
Sediment Transport Analysis for Stream Restoration Design: The Good, the Bad, and the Ugly.
 Sediment Transport Analysis for Stream Restoration Design: The Good, the Bad, and the Ugly. Brett Jordan Phd, PE HydroGeo Designs LLC. Land and Water Services Inc. THE GOOD THE BAD THE UGLY THE GOOD THE
Predictions of steady state and transient landscape morphology using sediment-flux-dependent river incision models
 Click Here for Full Article JOURNAL OF GEOPHYSICAL RESEARCH, VOL. 112,, doi:10.1029/2006jf000567, 2007 Predictions of steady state and transient landscape morphology using sediment-flux-dependent river
Lab 1: Landuse and Hydrology, learning ArcGIS II. MANIPULATING DATA
 Lab 1: Landuse and Hydrology, learning ArcGIS II. MANIPULATING DATA As you experienced in the first lab session when you created a hillshade, high resolution data can be unwieldy if you are trying to perform
Model Integration - How WEPP inputs are calculated from GIS data. ( ArcGIS,TOPAZ, Topwepp)
") Model Integration - How WEPP inputs are calculated from GIS data. ( ArcGIS,TOPAZ, Topwepp) ArcGIS 9.1-9.3 Allows user to locate area of interest, assemble grids, visualize outputs. TOPAZ Performs DEM
Model Integration - How WEPP inputs are calculated from GIS data. ( ArcGIS,TOPAZ, Topwepp) ArcGIS 9.1-9.3 Allows user to locate area of interest, assemble grids, visualize outputs. TOPAZ Performs DEM
ES 105 Surface Processes I. Hydrologic cycle A. Distribution % in oceans 2. >3% surface water a. +99% surface water in glaciers b.
 ES 105 Surface Processes I. Hydrologic cycle A. Distribution 1. +97% in oceans 2. >3% surface water a. +99% surface water in glaciers b. >1/3% liquid, fresh water in streams and lakes~1/10,000 of water
Business. Meteorologic monitoring. Field trip? Reader. Other?
 Business Meteorologic monitoring Field trip? Reader Other? Classification Streams Characterization Discharge measurements Why classify stream channels? Why Classify Stream Channels? Provides a common language
Terrain and Satellite Imagery in Madre de Dios, Peru
 Rhett Butler/mongabay.com Terrain and Satellite Imagery in Madre de Dios, Peru Katherine Lininger CE 394 GIS for Water Resources Term Paper December 1, 2011 Introduction Informal and small-scale gold mining
Using the Stock Hydrology Tools in ArcGIS
 Using the Stock Hydrology Tools in ArcGIS This lab exercise contains a homework assignment, detailed at the bottom, which is due Wednesday, October 6th. Several hydrology tools are part of the basic ArcGIS
How to Model Stream Temperature Using ArcMap
 How to Model Stream Temperature Using ArcMap Take note: Assumption before proceeding: A temperature point file has been attributed with TauDEM variables. There are three processes described in this document.
Digital Elevation Models. Using elevation data in raster format in a GIS
 Digital Elevation Models Using elevation data in raster format in a GIS What is a Digital Elevation Model (DEM)? Digital representation of topography Model based on scale of original data Commonly a raster
Dam Removal Analysis Guidelines for Sediment
 A review of: Dam Removal Analysis Guidelines for Sediment Joe Rathbun (Retired) rathbunj@sbcglobal.net Some Potential Sediment Issues Reservoir restoration Downstream water quality Downstream deposition
GIS Topographic Wetness Index (TWI) Exercise Steps
 Exercise Steps") GIS Topographic Wetness Index (TWI) Exercise Steps October 2016 Jeffrey L. Zimmerman, Jr. GIS Analyst James P. Shallenberger Manager, Monitoring & Protection Susquehanna River Basin Commission Table of
GIS Topographic Wetness Index (TWI) Exercise Steps October 2016 Jeffrey L. Zimmerman, Jr. GIS Analyst James P. Shallenberger Manager, Monitoring & Protection Susquehanna River Basin Commission Table of
Governing Rules of Water Movement
 Governing Rules of Water Movement Like all physical processes, the flow of water always occurs across some form of energy gradient from high to low e.g., a topographic (slope) gradient from high to low
Implications of the Saltation Abrasion Bedrock Incision Model for Steady-State River Longitudinal Profile Relief and Concavity
 Earth Surface Processes and Landforms Steady-State Earth Surf. Process. Bedrock Landforms River Longitudinal 33, 1129 1151 Profile (2008) Relief and Concavity 1129 Published online in Wiley InterScience
Running Water Earth - Chapter 16 Stan Hatfield Southwestern Illinois College
 Running Water Earth - Chapter 16 Stan Hatfield Southwestern Illinois College Hydrologic Cycle The hydrologic cycle is a summary of the circulation of Earth s water supply. Processes involved in the hydrologic
PHYSICAL GEOGRAPHY. By Brett Lucas
 PHYSICAL GEOGRAPHY By Brett Lucas FLUVIAL PROCESSES Fluvial Processes The Impact of Fluvial Processes on the Landscape Streams and Stream Systems Stream Channels Structural Relationships The Shaping and
Fresh Water: Streams, Lakes Groundwater & Wetlands
 Fresh Water:, Lakes Groundwater & Wetlands Oct 27 Glaciers and Ice Ages Chp 13 Nov 3 Deserts and Wind and EXAM #3 Slope hydrologic cycle P = precip I = precip intercepted by veg ET = evapotranspiration
Solutions of the stream power equation and application to the evolution of river longitudinal profiles
 JOURNAL OF GEOPHYSICAL RESEARCH: EARTH SURFACE, VOL. 118, 497 518, doi:1.1/jgrf.31, 13 Solutions of the stream power equation and application to the evolution of river longitudinal profiles Leigh Royden
Edinburgh Research Explorer
 Edinburgh Research Explorer A statistical framework to quantify spatial variation in channel gradients using the integral method of channel profile analysis Citation for published version: Mudd, SM, Attal,
1 Introduction: 2 Data Processing:
 Darren Janzen University of Northern British Columbia Student Number 230001222 Major: Forestry Minor: GIS/Remote Sensing Produced for: Geography 413 (Advanced GIS) Fall Semester Creation Date: November
A GIS-based Approach to Watershed Analysis in Texas Author: Allison Guettner
 Texas A&M University Zachry Department of Civil Engineering CVEN 658 Civil Engineering Applications of GIS Instructor: Dr. Francisco Olivera A GIS-based Approach to Watershed Analysis in Texas Author:
The Sandbox Project 1 cm 10 m
 The Sandbox Project 1 cm 10 m SETUP: 5 lbs of fine sand Funnel 1 measuring grid (22 by 22) adjustable hinterland height outflow pipe trash barrel ½ foam + plastic liner 63-μm sieve (sediment trap) Modeling
What is a watershed or landscape perspective?
 What is a watershed or landscape perspective? -remove sediment -add sediment -add wood, riparian manipulation -alter (engineer) channel/floodplain morphology -restore/abandon roads You are here What is
GIS feature extraction tools in diverse landscapes
 CE 394K.3 GIS in Water Resources GIS feature extraction tools in diverse landscapes Final Project Anna G. Kladzyk M.S. Candidate, Expected 2015 Department of Environmental and Water Resources Engineering
Big Wood River. General Information
 General Information The flows out of the southern portion of the Sawtooth National Recreation Area in central Idaho. The study reach is about a,200 ft length of river about.5 miles upstream from the discontinued
Numerical study of degradation of fluvial hanging valleys due to climate change
 Click Here for Full Article JOURNAL OF GEOPHYSICAL RESEARCH, VOL. 114,, doi:10.1029/2007jf000965, 2009 Numerical study of degradation of fluvial hanging valleys due to climate change Joseph K. Goode 1
Sediments and bedrock erosion
 Eroding landscapes: fluvial processes Sediments and bedrock erosion Mikaël ATTAL Marsyandi valley, Himalayas, Nepal Acknowledgements: Jérôme Lavé, Peter van der Beek and other scientists from LGCA (Grenoble)
Notice that the Grand Canyon is a knickpoint on the long profile. Cartoon examples of knickpoint migration:
 Earth and Planetary Surface Processes Winter 2017 - Lab 5. River channel long profiles. Hinds 440, 10:30a-11:20a Grades are not assigned for lab, but attendance is required. If you are unable to make a
8 Part 2: Short introduction to elementary landscape analysis with RiverTools
 8 Part 2: Short introduction to elementary landscape analysis with RiverTools Acknowledgement: large thanks to Scott Peckham, programmer and owner of Rivertools (rivix.com) who has kindly agreed to freely
Creating Watersheds and Stream Networks. Steve Kopp
 Creating Watersheds and Stream Networks Steve Kopp Workshop Overview Demo Data Understanding the tools Elevation Data Types DEM : Digital Elevation Model bare Earth DSM : Digital Surface Model Data Structure
Introduction...2. Objectives...2. Background...3. Methods...4. Results Discussion...9. Conclusion References...12
 Using GIS to appraise lithologic and structural control of streams in the Grabens of southeast Utah Faye Geiger GIS in Water Resources Term Project 12/7/2012 Table of Contents Introduction.......2 Objectives......2
Dynamique des rivières. res
 Dynamique des rivières res 1 Rivers are enormously diverse size: varies by many orders of magnitude geometry: highly variable substrate: bedrock or sediment sediment type: sediment size ranges from mud
Laboratory Exercise #3 The Hydrologic Cycle and Running Water Processes
 Laboratory Exercise #3 The Hydrologic Cycle and Running Water Processes page - 1 Section A - The Hydrologic Cycle Figure 1 illustrates the hydrologic cycle which quantifies how water is cycled throughout
Geomorphology: Mechanics and Evolution of Landscapes (GES )
") Geomorphology: Mechanics and Evolution of Landscapes (GES 206.2.5401) Instructor: Itai Haviv, haviv@bgu.ac.il, room 331, building 58, office hours: Tuesday 11:15-13:15 Teaching assistant: May-Tal Sadeh,
Geomorphology: Mechanics and Evolution of Landscapes (GES 206.2.5401) Instructor: Itai Haviv, haviv@bgu.ac.il, room 331, building 58, office hours: Tuesday 11:15-13:15 Teaching assistant: May-Tal Sadeh,
Surface Processes Focus on Mass Wasting (Chapter 10)
") Surface Processes Focus on Mass Wasting (Chapter 10) 1. What is the distinction between weathering, mass wasting, and erosion? 2. What is the controlling force in mass wasting? What force provides resistance?
Surface Processes Focus on Mass Wasting (Chapter 10) 1. What is the distinction between weathering, mass wasting, and erosion? 2. What is the controlling force in mass wasting? What force provides resistance?
1 Project Summary. 2 Background
 Student: Lindsay Olinde Course: CE 394K..3 GIS in Water Resources UT Austin Professor: Dr. David Maidment Submitted: December 3, 2010 Investigation into whether differences in channel slope characteristicss
Rick Faber CE 513 Watershed and Streamwork Delineation Lab # 3 4/24/2006
 Rick Faber CE 513 Watershed and Streamwork Delineation Lab # 3 4/24/2006 1. Objective & Discussion: 2 To learn to use the ArcHydro tools to produce hydrologically descriptive data sets starting from a
Ch 10 Deposition Practice Questions
 1. Base your answer to the following question on the data table below. Six identical cylinders, A through F, were filled with equal volumes of sorted spherical particles. The data table shows the particle
Web-based Interactive Landform Simulation Model (WILSIM)
") Web-based Interactive Landform Simulation Model (WILSIM) Wei Luo Dept. of Geography Northern Illinois University, DeKalb, IL 60115 Project Funded by NSF CCLI (2002-2004) Collaborators: Kirk Duffin, Jay
Web-based Interactive Landform Simulation Model (WILSIM) Wei Luo Dept. of Geography Northern Illinois University, DeKalb, IL 60115 Project Funded by NSF CCLI (2002-2004) Collaborators: Kirk Duffin, Jay
Mountain Rivers. Gutta cavat lapidem. (Dripping water hollows out a stone) -Ovid, Epistulae Ex Ponto, Book 3, no. 10, 1. 5
 -Ovid, Epistulae Ex Ponto, Book 3, no. 10, 1. 5") Mountain Rivers Gutta cavat lapidem (Dripping water hollows out a stone) -Ovid, Epistulae Ex Ponto, Book 3, no. 10, 1. 5 Mountain Rivers Fixed channel boundaries (bedrock banks and bed) High transport
Mountain Rivers Gutta cavat lapidem (Dripping water hollows out a stone) -Ovid, Epistulae Ex Ponto, Book 3, no. 10, 1. 5 Mountain Rivers Fixed channel boundaries (bedrock banks and bed) High transport
Abstract. landscapes with uniform and non-uniform rainfall. In the third major chapter, I employ the CHILD
 Abstract The interactions and feedbacks among climate, tectonics and surface erosion are complex but fundamental in geomorphological studies, and the mechanisms that control these processes are still not
Summary. Streams and Drainage Systems
 Streams and Drainage Systems Summary Streams are part of the hydrologic cycle and the chief means by which water returns from the land to the sea. They help shape the Earth s surface and transport sediment
Trail Flow: Analysis of Drainage Patterns Affecting a Mountain Bike Trail
 Andy Belcher BAE 590 Professor Huffman 12.9.11 Location Trail Flow: Analysis of Drainage Patterns Affecting a Mountain Bike Trail The location of the project area rests in the Cary area of Wake County,
Stratigraphic modelling using CHILD
 5 Stratigraphic modelling using CHILD 5.1 Triangular irregular network Surface process models are widely used in geomorphology and geology, and the developments in the field follow each other rapidly.
ON THE CORRELATION OF SEDIMENTATION AND LANDSLIDES IN WU RIVER CATCHMENT INFLUENCED BY THE 1999 CHI-CHI EARTHQUAKE
 ON THE CORRELATION OF SEDIMENTATION AND LANDSLIDES IN WU RIVER CATCHMENT INFLUENCED BY THE 1999 CHI-CHI EARTHQUAKE Keh-Jian Shou 1*, Li-Yuan Fei 2, Jiin-Fa Lee 2, Cheng-Yueh Wei 2, Chiu-Ching Wu 1, Chia-Yue
Erosion Rate is a Function of Erodibility and Excess Shear Stress = k ( o - c ) From Relation between Shear Stress and Erosion We Calculate c and
 From Relation between Shear Stress and Erosion We Calculate c and") Equilibrium, Shear Stress, Stream Power and Trends of Vertical Adjustment Andrew Simon USDA-ARS, Oxford, MS asimon@msa-oxford.ars.usda.gov Non-Cohesive versus Cohesive Materials Non-cohesive: sands and
Equilibrium, Shear Stress, Stream Power and Trends of Vertical Adjustment Andrew Simon USDA-ARS, Oxford, MS asimon@msa-oxford.ars.usda.gov Non-Cohesive versus Cohesive Materials Non-cohesive: sands and
![)UDQFR54XHQWLQ(DQG'tD]'HOJDGR&](/thumbs/95/125846872.jpg ")UDQFR54XHQWLQ(DQG'tD]'HOJDGR&") &21&(37,21$1',03/(0(17$7,212)$1+
&21&(37,21$1',03/(0(17$7,212)$1+ Validation 3. Laminar Flow Around a Circular Cylinder
 Validation 3. Laminar Flow Around a Circular Cylinder 3.1 Introduction Steady and unsteady laminar flow behind a circular cylinder, representing flow around bluff bodies, has been subjected to numerous
UNRAVELING THE HISTORY OF A LANDSCAPE: Using geomorphology, tephrochronology, and stratigraphy. Photo by: Josh Roering
 UNRAVELING THE HISTORY OF A LANDSCAPE: Using geomorphology, tephrochronology, and stratigraphy Photo by: Josh Roering Photo: Eric Bilderback Photo by: Josh Roering Goal 1. Reconstruct the paleo-landscape
Results of the Sava River Model
 Results of the Sava River Model Jamie G. James, P.E. Nashville District September 2010 US Army Corps of Engineers BUILDING STRONG Discussion Outline Study Goals Model Limitations HEC-RAS Model Results
Four Mile Run Levee Corridor Stream Restoration
 Four Mile Run Levee Corridor Stream Restoration 30% Design Summary U.S. Army Corps of Engineers, Baltimore District Presentation Outline Four Mile Run 1.) Historic Perspective 2.) Existing Conditions 3.)
COMMON GIS TECHNIQUES FOR VECTOR AND RASTER DATA PROCESSING. Ophelia Wang, Department of Geography and the Environment, University of Texas
 COMMON GIS TECHNIQUES FOR VECTOR AND RASTER DATA PROCESSING Ophelia Wang, Department of Geography and the Environment, University of Texas PART I: BASIC VECTOR TOOLS CLIP A FEATURE BASED ON THE EXTENT
SCOPE OF PRESENTATION STREAM DYNAMICS, CHANNEL RESTORATION PLANS, & SEDIMENT TRANSPORT ANALYSES IN RELATION TO RESTORATION PLANS
 DESIGN METHODS B: SEDIMENT TRANSPORT PROCESSES FOR STREAM RESTORATION DESIGN PETER KLINGEMAN OREGON STATE UNIVERSITY CIVIL ENGINEERING DEPT., CORVALLIS 2 ND ANNUAL NORTHWEST STREAM RESTORATION DESIGN SYMPOSIUM
Geomorphology LAB FAULT-SCARP DEGRADATION
 Geomorphology LAB FAULT-SCARP DEGRADATION Nicholas Pinter (University of California, Davis) Supplies Needed calculator straight-edge ruler PURPOSE The evolution of the Earth s surface over time is governed
Watershed Analysis of the Blue Ridge Mountains in Northwestern Virginia
 Watershed Analysis of the Blue Ridge Mountains in Northwestern Virginia Mason Fredericks December 6, 2018 Purpose The Blue Ridge Mountain range is one of the most popular mountain ranges in the United
the Neogene, based on stream knickpoint analysis (Gallen et al., 2013; Miller et al.,
 Abstract Recent work has suggested that parts of the Appalachian Mountains were uplifted during the Neogene, based on stream knickpoint analysis (Gallen et al., 2013; Miller et al., 2013). Analysis of
Exercise: guided tour
 Exercise: guided tour Yves Bühler & Lukas Stoffel Seminar in snow, slush- and debris flows RAMMS Demonstration, September 3 rd 2013, Longyearbyen, Norway Swiss Federal Institute for Forest, Snow and Landscape
Terrain Analysis Using Digital Elevation Models in Hydrology
 Terrain Analysis Using Digital Elevation Models in Hydrology David Tarboton, Utah State University This paper describes methods that use digital elevation models (DEMs) in hydrology, implemented as an
Technical Memorandum. To: From: Copies: Date: 10/19/2017. Subject: Project No.: Greg Laird, Courtney Moore. Kevin Pilgrim and Travis Stroth
 Technical Memorandum To: From: Greg Laird, Courtney Moore Kevin Pilgrim and Travis Stroth 5777 Central Avenue Suite 228 Boulder, CO 80301 www.otak.com Copies: [Electronic submittal] Date: 10/19/2017 Subject:
Vermont Stream Geomorphic Assessment. Appendix E. River Corridor Delineation Process. VT Agency of Natural Resources. April, E0 - April, 2004
 Vermont Stream Geomorphic Assessment Appendix E River Corridor Delineation Process Vermont Agency of Natural Resources - E0 - River Corridor Delineation Process Purpose A stream and river corridor delineation
3/3/2013. The hydro cycle water returns from the sea. All "toilet to tap." Introduction to Environmental Geology, 5e
 Introduction to Environmental Geology, 5e Running Water: summary in haiku form Edward A. Keller Chapter 9 Rivers and Flooding Lecture Presentation prepared by X. Mara Chen, Salisbury University The hydro
Recommendations for installation and general overview of available tools
 User guide for FluvialCorridor toolbox Recommendations for installation and general overview of available tools How to cite : Roux., C., Alber, A., Bertrand, M., Vaudor, L., Piégay, H., 2013. General Overview
Texas A & M University and U.S. Bureau of Reclamation Hydrologic Modeling Inventory Model Description Form
 Texas A & M University and U.S. Bureau of Reclamation Hydrologic Modeling Inventory Model Description Form JUNE, 1999 Name of Model: Two-Dimensional Alluvial River and Floodplain Model (MIKE21 CHD & CST)
GLG362/GLG598 Geomorphology K. Whipple October, 2009 I. Characteristics of Alluvial Channels
 I. Characteristics of Alluvial Channels Self-formed morphology set by entrainment, transport, and deposition They move unconsolidated sedimentary materials present in the valley fill flood plain/bank flow
The Effects of Geomorphology and Watershed Land Use on Spawning Habitat
 The Effects of Geomorphology and Watershed Land Use on Spawning Habitat By Evan Buckland INTRODUCTION The distribution and frequency of large geomorphic features in a watershed govern where suitable spawning
Watershed Delineation
 Watershed Delineation Jessica L. Watkins, University of Georgia 2 April 2009 Updated by KC Love February 25, 2011 PURPOSE For this project, I delineated watersheds for the Coweeta synoptic sampling area
Formation of Fluvial Hanging Valleys: Theory and Simulation
 Formation of Fluvial Hanging Valleys: Theory and Simulation Benjamin T. Crosby 1,2 Kelin X Whipple 1 Nicole M. Gasparini 3 Cameron W. Wobus 1,4 1 Department of Earth, Atmospheric and Planetary Sciences,
Zeumann and Hampel, 2017, Impact of Cocos Ridge (Central America) subduction on the forearc drainage system: Geology, doi: /g
 subduction on the forearc drainage system: Geology, doi: /g") GSA Data Repository 2017296 Zeumann and Hampel, 2017, Impact of Cocos Ridge (Central America) subduction on the forearc drainage system: Geology, doi:10.1130/g39251.1. DESCRIPTION OF CASQUS To implement
GSA Data Repository 2017296 Zeumann and Hampel, 2017, Impact of Cocos Ridge (Central America) subduction on the forearc drainage system: Geology, doi:10.1130/g39251.1. DESCRIPTION OF CASQUS To implement
A GIS Tool to Analyze Forest Road Sediment Production and Stream Impacts
 A GIS Tool to Analyze Forest Road Sediment Production and Stream Impacts Ajay Prasad, David G Tarboton, Charles H Luce, Thomas A. Black Abstract A set of GIS tools to analyze the impacts of forest roads
Wetland & Floodplain Functional Assessments and Mapping To Protect and Restore Riverine Systems in Vermont. Mike Kline and Laura Lapierre Vermont DEC
 Wetland & Floodplain Functional Assessments and Mapping To Protect and Restore Riverine Systems in Vermont Mike Kline and Laura Lapierre Vermont DEC NWI+ Hydro-Geomorphic Characterization of Wetlands and
27. Running Water I (p ; )
") 27. Running Water I (p. 424-436; 440-444) Hydrosphere How much of the Earth s surface is covered by water? Earth's water is collectively called the and is stored in a number of so-called as follows: 1.
27. Running Water I (p. 424-436; 440-444) Hydrosphere How much of the Earth s surface is covered by water? Earth's water is collectively called the and is stored in a number of so-called as follows: 1.
Erosion Surface Water. moving, transporting, and depositing sediment.
 + Erosion Surface Water moving, transporting, and depositing sediment. + Surface Water 2 Water from rainfall can hit Earth s surface and do a number of things: Slowly soak into the ground: Infiltration
Why Geomorphology for Fish Passage
 Channel Morphology - Stream Crossing Interactions An Overview Michael Love Michael Love & Associates mlove@h2odesigns.com (707) 476-8938 Why Geomorphology for Fish Passage 1. Understand the Scale of the
The Geodatabase Working with Spatial Analyst. Calculating Elevation and Slope Values for Forested Roads, Streams, and Stands.
 GIS LAB 7 The Geodatabase Working with Spatial Analyst. Calculating Elevation and Slope Values for Forested Roads, Streams, and Stands. This lab will ask you to work with the Spatial Analyst extension.
Supercritical river terraces generated by hydraulic and geomorphic interactions Supplementary Information
 GSA Data Repository 2018164 Supercritical river terraces generated by hydraulic and geomorphic interactions Supplementary Information Edwin R.C. Baynes *, Dimitri Lague, Jean-Jacques Kermarrec Univ Rennes,
The effectiveness of check dams in controlling upstream channel stability in northeastern Taiwan
 Erosion, Debris Mows and Environment in Mountain Regions (Proceedings of the Chengdu Symposium, July 1992). IAHS Publ. no. 209, 1992. 423 The effectiveness of check dams in controlling upstream channel
Knickpoint Initiation and Distribution within Fluvial Networks: 236 waterfalls in the Waipaoa River, North Island, New Zealand
 Knickpoint Initiation and Distribution within Fluvial Networks: 236 waterfalls in the Waipaoa River, North Island, New Zealand Benjamin T. Crosby * Kelin X. Whipple Department of Earth, Atmospheric and
MATHEMATICAL MODELING OF FLUVIAL SEDIMENT DELIVERY, NEKA RIVER, IRAN. S.E. Kermani H. Golmaee M.Z. Ahmadi
 JOURNAL OF ENVIRONMENTAL HYDROLOGY The Electronic Journal of the International Association for Environmental Hydrology On the World Wide Web at http://www.hydroweb.com VOLUME 16 2008 MATHEMATICAL MODELING
Annotated Bibliography of River Avulsions Pat Dryer Geography 364 5/14/2007
 Annotated Bibliography of River Avulsions Pat Dryer Geography 364 5/14/2007 1 Table of Contents Introduction 2 Annotations I. River avulsions and their deposits 2 II. Channel avulsion on alluvial fans
4. GIS Implementation of the TxDOT Hydrology Extensions
 4. GIS Implementation of the TxDOT Hydrology Extensions A Geographic Information System (GIS) is a computer-assisted system for the capture, storage, retrieval, analysis and display of spatial data. It
Structural Analysis of Rocks and Regions 2017 Topographic analysis
 Structural Analysis of Rocks and Regions 2017 Topographic analysis This handout explains how to perform a basic topographic analysis of a landscape using a Digital Elevation Model (DEM). The software that
NERC Geophysical Equipment Pool Project 831 Scientific Report. Longitudinal river profile development and landscape response in NW Argentina
 NERC Geophysical Equipment Pool Project 831 Scientific Report Ruth A.J. Robinson School of Geography & Geosciences, University of St Andrews, St Andrews, KY16 9AL, UK Longitudinal river profile development
A SIMPLE GIS METHOD FOR OBTAINING FLOODED AREAS
 A SIMPLE GIS METHOD FOR OBTAINING FLOODED AREAS ROMAN P., I. 1, OROS C., R. 2 ABSTRACT. A simple GIS method for obtaining flooded areas. This paper presents a method for obtaining flooded areas near to
Delineation of Watersheds
 Delineation of Watersheds Adirondack Park, New York by Introduction Problem Watershed boundaries are increasingly being used in land and water management, separating the direction of water flow such that