1 Project Summary. 2 Background
|
|
|
- Spencer Perry
- 5 years ago
- Views:
Transcription


1 Student: Lindsay Olinde Course: CE 394K..3 GIS in Water Resources UT Austin Professor: Dr. David Maidment Submitted: December 3, 2010 Investigation into whether differences in channel slope characteristicss exist due to varying lithology in coarse mountain streams, Reynolds Creek watershed, ID
2 1 Project Summary I used this term project to better understand the larger context of the mountain watershed of Reynolds Creek in southwest Idaho because I am currently conducting a field experiment on a 100m section of Reynolds Creek. A common way to examine channels on watershed scales is to first characterize their longitudinal elevation profiles by examining slope characteristics. Due to parts of the Reynolds Creek watershed being underlain with basalt and granite, in this GIS project, I examined whether these two different lithologies force unique profile curvatures in several small mountain streams. Of the streams I analyzed, lithology does not seem to be an obvious control on slope characteristics because the granite and basalt streams have quite a bit of overlap in the results. In Spring 2011, I plan to extend my analyses of these ArcGIS result by performing power spectral analysis on the concavity and curvature signals at different length scales using Matlab and examining the slope area relationships here. In this report, I present background on using slope to gain insight into channels, a description of the mountainous portion of the Reynolds Creek watershed, ArcGIS techniques I applied, discussion of my ArcGIS results, and related conclusions. 2 Background Because the concept of slope as a characteristic in landscape evolution and erosional forcing may be a new perspective for some, in the next few sections, I discuss how slope may be considered from the fluvial geomorphology perspective. 2.1 Channel slope and channel equilibrium According to the concept of river equilibrium, channels adjust to new equilibrium, or grade conditions, following system perturbations such as changes in discharge, geometry, or sediment supply. Adjustments proceed through a series of feedbacks between discharge, width, slope, grain size, and sediment flux such that transport capacity is just balanced with sediment supply [Gilbert, 1914; Leopold, 1980; Mackin, 1948; Strahler, 1952]. Transport capacity refers to the amount of material a channel is able to move downstream [Gilbert, 1914]. A classic fluvial geomorphology image, Lane s Diagram, simplifies this concept of transport capacity and channel equilibrium, showing the adjusting feedbacks that can balance slope, transport capacity, and sediment supply, Figure 1. For example, if a stream has coarse sediment, which is common in mountain streams, the stream will remain steep to be able to transport this coarser sediment resulting in no degradation or aggradation, i.e. equilibrium. A general way evaluate slope is to take the average slope of stream elevations over a longitudinal distance, Equation 1. The convention for stream is to report longitudinal slopes as positive when longitudinal elevations are decreasing as channel flows downstream, so I will follow this convention in my results. Equation 1


![density, g is gravity, and h is water depth [Kondolf and Piégay, 2003].](/docs-images/81/82891294/images/3-7.jpg "Thee rate of work a stream can do is reflected in stream power, Ω, and can be")


3 Figure 1 Lane's Diagram illustrating the dynamic relationship between sediment flux characteristics, slope, and discharge such that transport capacity balances sediment supply [Henson, 2010]. 2.2 Slope and sediment transport Slope is an important stream characteristic because a channel s slope influences the basal shear stress,, particles on the channel bed experience. Simply, basal shear stress is the downstream drag force per area of channel bed that surface particles experience due to gravity driving water discharge, Q, downhill over the bed. For steady, uniform flows in wide streams, reach averaged slope, S, result in average basal shear stresses that can be estimated with Equation 2, where is water density, g is gravity, and h is water depth [Kondolf and Piégay, 2003]. Thee rate of work a stream can do is reflected in stream power, Ω, and can be calculated by stream velocityy times basal shear stress, Equation 3 [Leopold et al., 1964]. Particle entrainment can occur if the basal shear stress is greater than a threshold shear stress, which varies according to particle size and arrangement in the bed, and depending on the degree of transport, a particle will move as bedload, rolling or saltating along the bed, or suspendedd sediment. Particle entrainment conditions are important in understanding the degree and form that sediment is transported through a watershed and, therefore,, are crucial for watershed managers estimating watershed sediment budgets. Equation 2 Equation 3 Ω 2.3 Curvature in the direction of channel slope Having established why slope is an important characteristic inn sediment transport and stream capacity through Equations 2 and 3, one may also want to understandd characteristics of channel slopes. For example, how does a slope change over a longitudinal distance of a channel? Often hillslopes evolve with overall convex surfaces due to overland, sheet flow driven erosion being slope dependent while streams evolve to have concave up longitudinal profiles due to concentrated channel erosion being forced by slope and discharge [Quimpo, 1999]. One may consider that the more concave a stream is, the more erosion it has experienced. ArcGIS can also be used to evaluatee the second derivate of surface elevations, i.e. a surface s curvature. Surface curvature is calculated by ncorporating fourth order polynomials over the surface created from 3 by 3 cell squares [ArcGIS 2010]. Surface curvature is represented by Equation 4 and with parameters visually understood with Figure 2 [ArcGIS, 2010]. I applied the used the ArcGIS profile curvature output as opposed to the general curvature output raster because the profile curvature describes the


![2010].](/docs-images/81/82891294/images/4-8.jpg "Equation 4 Z =")


 / 4 (Z2 + Z4 +")
![Z6 + Z8) / 2 + Z5]](/docs-images/81/82891294/images/4-14.jpg "/ L4 B = [(Z1 + Z3")

] /2] / L33")

![Z8) /2 Z5] / L2 F =](/docs-images/81/82891294/images/4-18.jpg "( Z1 + Z3 + Z7 Z9)")
 / 2L H = (Z2")


4 curvature of the surface in the direction of slope, as shown inn Figure 3 [de Smith et al., 2009]. The degree of a stream s profile curvature influences erosion because it reflects the acceleration or deceleration of discharge [ArcGIS, 2010]. Equation 4 Z = Ax²y² + Bx²y + Cxy² + Dx² + Ey² + Fxy + Gx + Hy + I where coefficients are shown in Figure 2 and are below: A = [(Z1 + Z3 + Z7 + Z9) / 4 (Z2 + Z4 + Z6 + Z8) / 2 + Z5] / L4 B = [(Z1 + Z3 Z7 Z9) /4 (Z2 Z8) /2] / L3 C = [( Z1 + Z3 Z7 + Z9) /4 + (Z4 Z6)] /2] / L33 D = [(Z4 + Z6) /2 Z5] / L2 E = [(Z2 + Z8) /2 Z5] / L2 F = ( Z1 + Z3 + Z7 Z9) / 4L2 G = ( Z4 + Z6) / 2L H = (Z2 Z8) / 2L I = Z5 Figure 2 Curvature calculated from fitted profiles over nine surface elevation cells [ArcGIS, 2010]. Figure 3 Depiction of profile curvature over a hillslope [dee Smith et al., 2009].
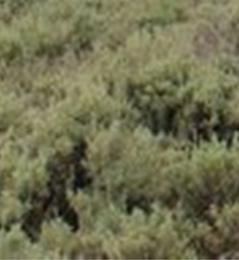
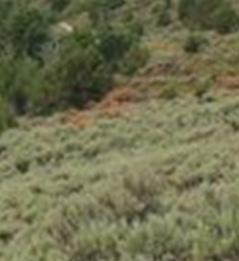
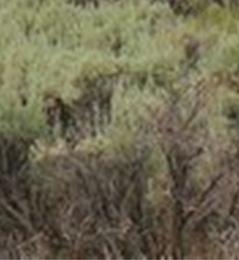
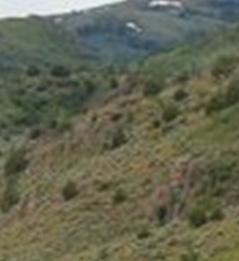
5 2.4 Lithology Lithology, the type of rock, on the surface of a watershed can influence how easily a surface can be eroded due to unique rock strengths. Basalt and granite are both igneous rocks with basalt forming from quickly cooling lava (think of what exits volcanoes) while granite forms from slowly cooling magma (consider what remains in volcanoes). Basalt is typically slightly denser than granite, with specific gravities of approximately 3.3 and Site description Reynolds Creek is a coarse alluvial channel located in the Owyhee Mountains and managed by USDA Agricultural Research Service within the Reynolds Creek Experimental Watershed. The contributing mountainous drainage area is approximately 55km 2 and is underlain with mainly basalt and granite. Minimal anthropogenic influences exist in the contributing watershed aside from grazing operations and the highest flows in RCEW occur during spring snowmelt. 3 Methods While granite and basalt are both igneous rocks, I hypothesized that small difference in densities may play a strong control in the slope characteristics of Reynolds Creek tributaries. By only looking in the smaller, mountainous portion of the watershed, the drainage areas are relatively small. The elevation surface I manipulated in ArcGIS was from 2m LiDAR that I obtained directly from the Boise office of the USDA Agricultural Research Service. This LiDAR was obtained outside the snowmelt season, during low flow in November ArcGIS methods The methods that I used in ArcGIS are outlined in the flow chart in Figure 4. I selected five streams in the upper watershed to analyze, Figure 5. I focused on the upper watershed because I am doing field work in the mountains. If a portion of the stream crossed lithological boundaries, I analyzed each lithology separately. I went through each stream manually examine areas where the LiDAR swaths overlapped in these areas, the profile curvature values were incorrect. I tried to use Model Builder for this work but found that Model Builder was a little inefficient because I was selecting only a few streams and could not bring in the 3D analyst profile grapher, which I used to export elevation and profile curvature results into Excel, into Model Builder. However, I found that utilizing batch processing to run many actions with the same tool was extremely efficient and highly recommend one use this if doing similar methods. 3.2 Excel I brought the elevation and profile curvature ArcGIS data along the longitudinal stream profiles into Excel to compare plot the results. The exported elevation data consisted of two columns, one for elevation and the other for distance from the most upstream point both were in exported in meters. I plotted the elevation verses distance from most upstream point for each stream section and found the average slope with this data. Similarly, I plotted the profile curvature verses distance from most upstream point and calculated the average profile curvature value. Additionally, I calculated the cumulative frequency of the profile curvature values for each stream section to evaluate whether unique distribution patterns were apparent.
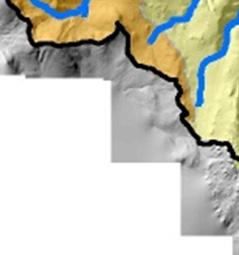
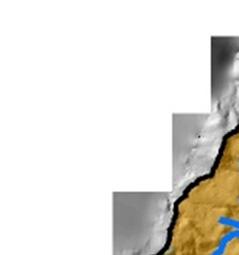
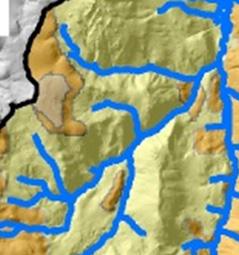
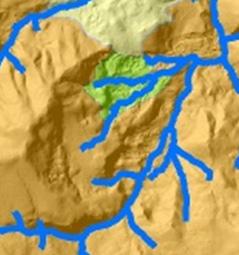
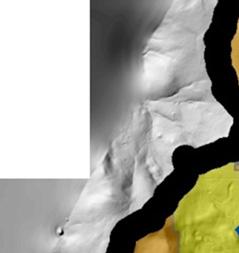
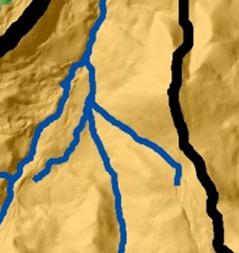
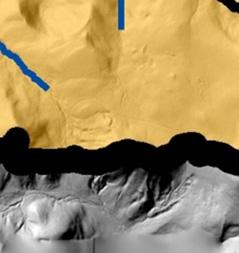
6 Figure 4 Methods applied in ArcGIS to extract elevation, slope, concavity, and profile curvature data from project streams to compare possible differences due to underlying basalt or granite lithology. Input data: Elevation Surface from 2m LiDAR (USDA ARS source) & Input data: Geologic map of area (USDA ARS source) Delineated stream network using Hydrology tools (Fig 5) Exported individual streams reaches based on lithology for comparison (Fig 6) Dissolved project stream features Created pour points for each reach Delineated upper watershed & subwatersheds of project reaches using Hydrology tools (Fig 6) Converted watershed rasters to polygons to calculate each drainage area Assigned elevation values to each dissolved stream feature by batch processing the Interpolate Shape in3d surface analysis tools Created profile curvature raster in Spatial Analyst Created longitudinal elevation profile graphs and exported the data into Excel for average slope analysis Assigned profile curvature values to each dissolved stream feature by batch processing the Interpolate Shape tool under 3D surface analysis Created longitudinal profile curvature profile graphs and exported the data into Excel for comparison (Fig 7 & 8) 4 Results and Discussion Figures for the results are presented at the end of section 5. Figure 5 shows the stream network delineation and the entire watershed delineation of Reynolds Creek. Figure 6 shows the streams I chose to analyze based on lithology and their respective subwatersheds. Table 1 summarizes the characteristics of the reaches subwatersheds as well as the ArcGIS results of the average stream slopes and profile curvatures. Only Stream 01 resulted in a strong connection to lithology where there was a visible shift in the average profile curvature where the lithology changed, Figure 7. When I presented the promising results of stream 01 to the class in my presentation, I had hoped that the trend may also appear in the other streams I analyzed but this was not the case. Because the mean profile curvatures did not seem to show a clear trend of being the same within each lithology and different between lithologies, I also examined the cumulative frequency of the profile curvature values over the stream to see if the value ranges were similar while their means may have been shifted, Figure 8. Still, no clear trends were observed across the streams to make a definitive statement regarding basalt or granite lithology controlling the profile curvatures for the streams in the upper Reynolds Creek watershed.
7 Table 1 Stream section summary of results. Number Location* Lithology Contributing Drainage Area at Reach Outlet, km 2 Best Fit Slope over Section Average Profile Curvature 1 US Basalt % DS Granite % ALL Granite % N Basalt landslide % S Basalt landslide % DS Basalt % N Basalt % S Basalt % DS Basalt % US Granite % DS Basalt % 3.73 * N North fork S South fork US Upstream sectin DS Downstream section 5 Conclusions Examining the elevation datasets of streams is often used in the first round of landscape analysis that fluvial geomorphologist conduct when examining streams. Based on the analysis of the work completed in this term project, my average cumulative profiles data does not support my hypothesis that underlying lithology controls the slopes and concavity properties of tributaries in the upper Reynolds Creek watershed. However, the spectral analysis of the oscillating signal of the positive concavities may still reveal that the distance wavelengths of the profile curvature fluctuate based on lithology. I will be doing these analysis in Spring Further, it could be possible that instead of lithology, even though all the streams are in a fairly small drainage area, it is the magnitude of the subdrainage areas that is controlling the concavities. I will also be examining this in Spring 2011 by choosing several points within each stream, delineating the drainage areas of each point, then evaluating whether these are linearly correlated on a log log plot of slope verses drainage area of all points. Finally, getting the average slopes of these streams is very valuable to me because I can now calculate theoretical basal shear stresses using Equation 2 and discharge data that the USDA has provided.


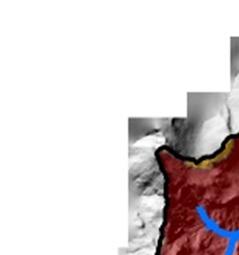


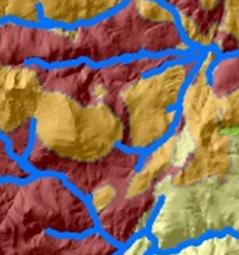


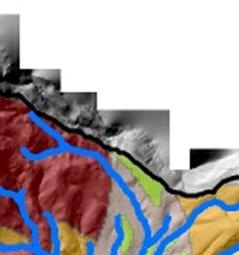


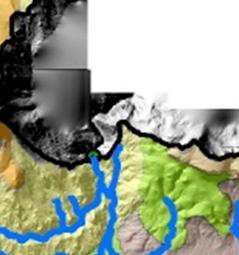


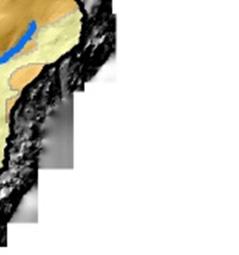
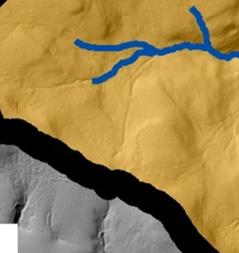
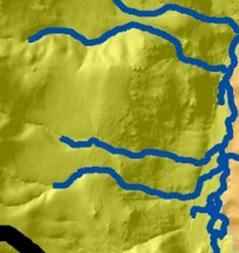
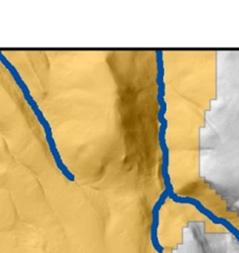
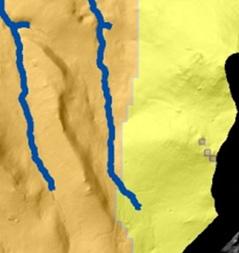
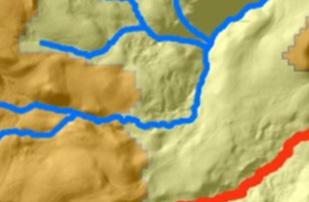
8 Figure 5 Delineated stream m network and watershed over Reynolds Creek overlaid with USDA geologic map.


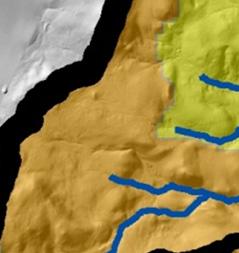

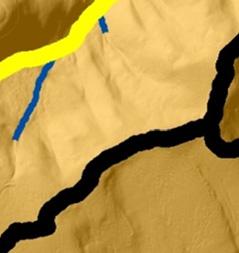


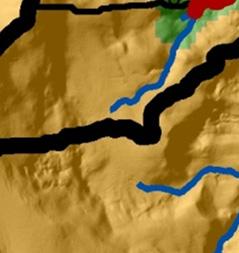


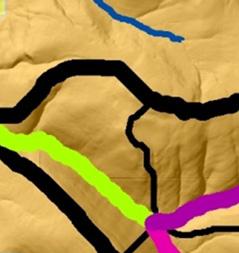

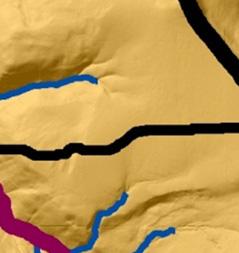


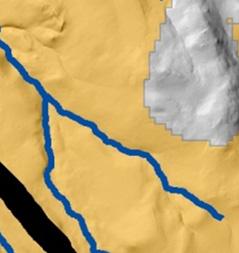


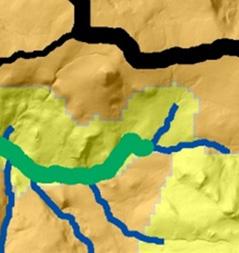


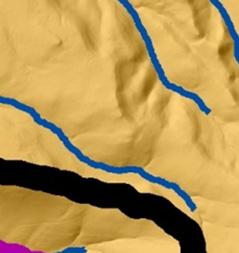

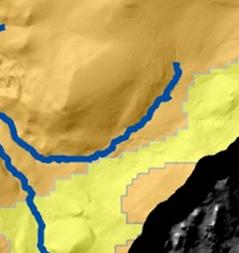


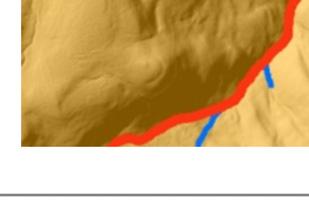
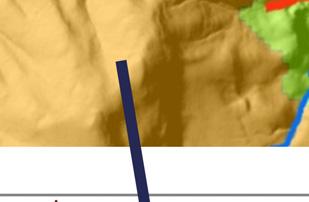
9 Figure 6 Stream sections se elected based on n lithology for profile curvaturee comparison.


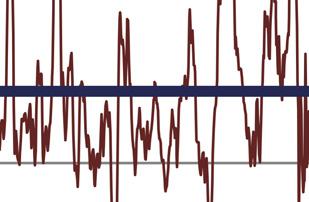


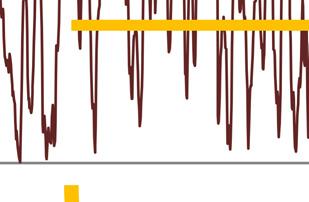


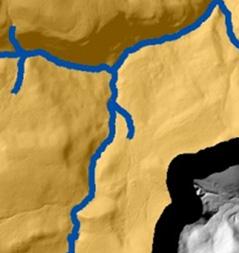
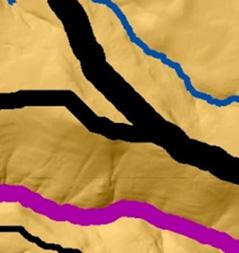
10 Figure 7 Shift in profile curvature at lithologic change only observed strongly for one stream, Stream 01.
11 Figure 8 Cumulative frequency of occurrence of profile curvatures over tested streams. All reaches 100% 90% 80% Cumulative Frequency 70% 60% 50% 40% 30% 20% 10% 0% 1 Basalt US 1 Granite DS 2 all granite 3 Landslide N 3 Landslide S 3 Basalt DS 4 Basalt DS 4 Basalt N 4 Basalt S 5 Basalt DS 5 Granite US Profile Curvature Cumulative Frequency 100% 90% 80% 70% 60% 50% 40% 30% All granite reaches Cumulative Frequency All basalt reaches 100% 90% 80% 70% 60% 50% 1 Basalt US 40% 3 Basalt DS 4 Basalt DS 30% 4 Basalt N 20% 4 Basalt S 10% 5 Basalt DS 5 Basalt US 0% Profile Curvature 20% 1 Granite DS 10% 2 all granite 5 Granite US 0% Profile Curvature
12 References ArcGIS, (2010), ArcGIS: How Curvature Works, ESRI Help. de Smith, M., M. Goodchild, and P. Longley (2009), Geospatial Analysis: A comprehensive guide to principles, techniques and software tools, Third., Matador, Leicester, UK. Gilbert, G. (1914), The Transportation of Debris by Running Water, Professional Paper, USGS, Sacramento, CA USA. Henson, P. (2010), Gravel Mining, [online] Available from: Kondolf, G. M., and H. Piégay (2003), Tools in fluvial geomorphology, John Wiley and Sons. Leopold, L. B. (1980), Techniques and interpretation: The sediment studies of G. K. Gilbert, Geological Society of America, (Special Paper 183), Leopold, L. B., M. G. Wolman, and J. P. Miller (1964), Fluvial processes in geomorphology, W.H. Freemand and Co. Mackin, H. (1948), Concept of the graded river, Geological Society of America Bulletin, 59(5), Quimpo, R. G. (1999), GIS modules and distributed models of the watershed: report, ASCE Publications. Roe, G. H., D. R. Montgomery, and B. Hallet (2002), Effects of orographic precipitation variations on the concavity of steady state river profiles, Geology, 30(2), Strahler, A. N. (1952), Dynamic basis of geomorphology, Geological Society of America Bulletin, 63(9),
CAUSES FOR CHANGE IN STREAM-CHANNEL MORPHOLOGY
 CAUSES FOR CHANGE IN STREAM-CHANNEL MORPHOLOGY Chad A. Whaley, Department of Earth Sciences, University of South Alabama, MobileAL, 36688. E-MAIL: caw408@jaguar1.usouthal.edu The ultimate goal of this
Diego Burgos. Geology 394. Advisors: Dr. Prestegaard. Phillip Goodling
 Sediment Transport into an Urban Tributary Junction Diego Burgos Geology 394 Advisors: Dr. Prestegaard Phillip Goodling 1 Abstract Tributary junctions are an important component of stream morphology and
Using ArcGIS for Hydrology and Watershed Analysis:
 Using ArcGIS 10.2.2 for Hydrology and Watershed Analysis: A guide for running hydrologic analysis using elevation and a suite of ArcGIS tools Anna Nakae Feb. 10, 2015 Introduction Hydrology and watershed
Table 6.1 Progress in the identification of equilibrium states in geomorphology
 6 The concept of equilibrium emerged in geomorphology once ideas of catastrophism had been succeeded by the understanding that gradual land-forming processes were responsible for the shape of the Earth
MEANDER MIGRATION MODEL ASSESSMENT FOR THE JANUARY 2005 STORM, WHITMAN PROPERTY, SAN ANTONIO CREEK, VENTURA COUNTY, CALIFORNIA
 MEANDER MIGRATION MODEL ASSESSMENT FOR THE JANUARY 2005 STORM, WHITMAN PROPERTY, SAN ANTONIO CREEK, VENTURA COUNTY, CALIFORNIA Prepared by Eric Larsen, Ph.D. Mark Rains, Ph.D. October 2006 INTRODUCTION
Dams, sediment, and channel changes and why you should care
 Dams, sediment, and channel changes and why you should care Gordon E. Grant USDA Forest Service PNW Research Station Corvallis, Oregon Dam effects on river regimes FLOW (Q) SEDIMENT (Qs) TEMP CHEMISTRY
OBJECTIVES. Fluvial Geomorphology? STREAM CLASSIFICATION & RIVER ASSESSMENT
 STREAM CLASSIFICATION & RIVER ASSESSMENT Greg Babbit Graduate Research Assistant Dept. Forestry, Wildlife & Fisheries Seneca Creek, Monongahela National Forest, West Virginia OBJECTIVES Introduce basic
Stream Entrainment, Erosion, Transportation & Deposition
 Lecture 12 Zone 2 of the Fluvial System, Continued Stream Entrainment, Erosion, Transportation & Deposition Erosion in a Fluvial Landscape Corrosion Chemical Erosion Corrasion Mechanical Weathering Cavitation
Squaw Creek. General Information
 General Information is a tributary to the Salmon River. It enters the north side of the river about 0 miles downstream of North Fork, Idaho. The study reach is about a 30 ft length of stream about 2 miles
GIS feature extraction tools in diverse landscapes
 CE 394K.3 GIS in Water Resources GIS feature extraction tools in diverse landscapes Final Project Anna G. Kladzyk M.S. Candidate, Expected 2015 Department of Environmental and Water Resources Engineering
Avoiding Geohazards in the Mid-Atlantic Highlands by Using Natural Stream Principles
 Avoiding Geohazards in the Mid-Atlantic Highlands by Using Natural Stream Principles J. Steven Kite, WVU Neal Carte, WVDOT Will Harman, Michael Baker Corp. Donald D. Gray, WVU Photo: W. Gillespie North
Terrain and Satellite Imagery in Madre de Dios, Peru
 Rhett Butler/mongabay.com Terrain and Satellite Imagery in Madre de Dios, Peru Katherine Lininger CE 394 GIS for Water Resources Term Paper December 1, 2011 Introduction Informal and small-scale gold mining
Each basin is surrounded & defined by a drainage divide (high point from which water flows away) Channel initiation
 Channel initiation") DRAINAGE BASINS A drainage basin or watershed is defined from a downstream point, working upstream, to include all of the hillslope & channel areas which drain to that point Each basin is surrounded &
DRAINAGE BASINS A drainage basin or watershed is defined from a downstream point, working upstream, to include all of the hillslope & channel areas which drain to that point Each basin is surrounded &
Geomorphology Geology 450/750 Spring Fluvial Processes Project Analysis of Redwood Creek Field Data Due Wednesday, May 26
 Geomorphology Geology 450/750 Spring 2004 Fluvial Processes Project Analysis of Redwood Creek Field Data Due Wednesday, May 26 This exercise is intended to give you experience using field data you collected
Rivers T. Perron
 1 Rivers T. Perron 12.001 After our discussions of large-scale topography, how we represent topography in maps, and how topography interacts with geologic structures, you should be frothing at the mouth
Do you think sediment transport is a concern?
 STREAM RESTORATION FRAMEWORK AND SEDIMENT TRANSPORT BASICS Pete Klingeman 1 What is Your Restoration Project Like? k? Do you think sediment transport is a concern? East Fork Lewis River, WA Tidal creek,
mountain rivers fixed channel boundaries (bedrock banks and bed) high transport capacity low storage input output
 high transport capacity low storage input output") mountain rivers fixed channel boundaries (bedrock banks and bed) high transport capacity low storage input output strong interaction between streams & hillslopes Sediment Budgets for Mountain Rivers Little
mountain rivers fixed channel boundaries (bedrock banks and bed) high transport capacity low storage input output strong interaction between streams & hillslopes Sediment Budgets for Mountain Rivers Little
Table 6.1 Progress in the identification of equilibrium states in geomorphology
 6 The concept of equilibrium emerged in geomorphology once ideas of catastrophism had been succeeded by the understanding that gradual land-forming processes were responsible for the shape of the Earth
Sediment Transport Analysis for Stream Restoration Design: The Good, the Bad, and the Ugly.
 Sediment Transport Analysis for Stream Restoration Design: The Good, the Bad, and the Ugly. Brett Jordan Phd, PE HydroGeo Designs LLC. Land and Water Services Inc. THE GOOD THE BAD THE UGLY THE GOOD THE
Hydrology and Watershed Analysis
 Hydrology and Watershed Analysis Manual By: Elyse Maurer Reference Map Figure 1. This map provides context to the area of Washington State that is being focused on. The red outline indicates the boundary
Using Earthscope and B4 LiDAR data to analyze Southern California s active faults
 Using Earthscope and B4 LiDAR data to analyze Southern California s active faults Exercise 8: Simple landscape morphometry and stream network delineation Introduction This exercise covers sample activities
Sediments and bedrock erosion
 Eroding landscapes: fluvial processes Sediments and bedrock erosion Mikaël ATTAL Marsyandi valley, Himalayas, Nepal Acknowledgements: Jérôme Lavé, Peter van der Beek and other scientists from LGCA (Grenoble)
Landscape Development
 Landscape Development Slopes Dominate Natural Landscapes Created by the interplay of tectonic and igneous activity and gradation Deformation and uplift Volcanic activity Agents of gradation Mass wasting
Overview of fluvial and geotechnical processes for TMDL assessment
 Overview of fluvial and geotechnical processes for TMDL assessment Christian F Lenhart, Assistant Prof, MSU Research Assoc., U of M Biosystems Engineering Fluvial processes in a glaciated landscape Martin
![)UDQFR54XHQWLQ(DQG'tD]'HOJDGR&](/thumbs/95/125846872.jpg ")UDQFR54XHQWLQ(DQG'tD]'HOJDGR&") &21&(37,21$1',03/(0(17$7,212)$1+
&21&(37,21$1',03/(0(17$7,212)$1+ The Effects of Geomorphology and Watershed Land Use on Spawning Habitat
 The Effects of Geomorphology and Watershed Land Use on Spawning Habitat By Evan Buckland INTRODUCTION The distribution and frequency of large geomorphic features in a watershed govern where suitable spawning
(3) Sediment Movement Classes of sediment transported
 Sediment Movement Classes of sediment transported") (3) Sediment Movement Classes of sediment transported Dissolved load Suspended (and wash load ) Important for scouring algae Bedload (5-10% total load Moves along bed during floods Source of crushing for
(3) Sediment Movement Classes of sediment transported Dissolved load Suspended (and wash load ) Important for scouring algae Bedload (5-10% total load Moves along bed during floods Source of crushing for
A Simple Drainage Enforcement Procedure for Estimating Catchment Area Using DEM Data
 A Simple Drainage Enforcement Procedure for Estimating Catchment Area Using DEM Data David Nagel, John M. Buffington, and Charles Luce U.S. Forest Service, Rocky Mountain Research Station Boise Aquatic
Erosion Surface Water. moving, transporting, and depositing sediment.
 + Erosion Surface Water moving, transporting, and depositing sediment. + Surface Water 2 Water from rainfall can hit Earth s surface and do a number of things: Slowly soak into the ground: Infiltration
Unconventional Wisdom and the Effects of Dams on Downstream Coarse Sediment Supply. Byron Amerson, Jay Stallman, John Wooster, and Derek Booth
 Unconventional Wisdom and the Effects of Dams on Downstream Coarse Sediment Supply 3 February 2009 Byron Amerson, Jay Stallman, John Wooster, and Derek Booth Sultan River, WA OBJECTIVE Consider the landscape
Creating Watersheds and Stream Networks. Steve Kopp
 Creating Watersheds and Stream Networks Steve Kopp Workshop Overview Demo Data Understanding the tools Elevation Data Types DEM : Digital Elevation Model bare Earth DSM : Digital Surface Model Data Structure
Geomorphology: Mechanics and Evolution of Landscapes (GES )
") Geomorphology: Mechanics and Evolution of Landscapes (GES 206.2.5401) Instructor: Itai Haviv, haviv@bgu.ac.il, room 331, building 58, office hours: Tuesday 11:15-13:15 Teaching assistant: May-Tal Sadeh,
Geomorphology: Mechanics and Evolution of Landscapes (GES 206.2.5401) Instructor: Itai Haviv, haviv@bgu.ac.il, room 331, building 58, office hours: Tuesday 11:15-13:15 Teaching assistant: May-Tal Sadeh,
STUDY GUIDE FOR CONTENT MASTERY. Surface Water Movement
 Surface Water SECTION 9.1 Surface Water Movement In your textbook, read about surface water and the way in which it moves sediment. Complete each statement. 1. An excessive amount of water flowing downslope
MATHEMATICAL MODELING OF FLUVIAL SEDIMENT DELIVERY, NEKA RIVER, IRAN. S.E. Kermani H. Golmaee M.Z. Ahmadi
 JOURNAL OF ENVIRONMENTAL HYDROLOGY The Electronic Journal of the International Association for Environmental Hydrology On the World Wide Web at http://www.hydroweb.com VOLUME 16 2008 MATHEMATICAL MODELING
Implications of the Saltation Abrasion Bedrock Incision Model for Steady-State River Longitudinal Profile Relief and Concavity
 Earth Surface Processes and Landforms Steady-State Earth Surf. Process. Bedrock Landforms River Longitudinal 33, 1129 1151 Profile (2008) Relief and Concavity 1129 Published online in Wiley InterScience
Erosion Rate is a Function of Erodibility and Excess Shear Stress = k ( o - c ) From Relation between Shear Stress and Erosion We Calculate c and
 From Relation between Shear Stress and Erosion We Calculate c and") Equilibrium, Shear Stress, Stream Power and Trends of Vertical Adjustment Andrew Simon USDA-ARS, Oxford, MS asimon@msa-oxford.ars.usda.gov Non-Cohesive versus Cohesive Materials Non-cohesive: sands and
Equilibrium, Shear Stress, Stream Power and Trends of Vertical Adjustment Andrew Simon USDA-ARS, Oxford, MS asimon@msa-oxford.ars.usda.gov Non-Cohesive versus Cohesive Materials Non-cohesive: sands and
Geomorphology 5. Stream Sediment Stream Sediment
 Geomorphology 5. Stream Sediment 1 Name 47 Points LEARNING OUTCOMES 5. Stream Sediment By the end of this assignment you should be able to: Describe the relationship between particle size and critical
How Do Geology and Physical Streambed Characteristics Affect Water Quality?
 Teacher s Guide How Do Geology and Physical Streambed Characteristics Affect Water Quality? Lesson Description In this lesson, the students research a dynamic, vertical dimension of a watershed - the geological
Management and Sharing of Hydrologic Information of Cache County
 Geographic Information System in Water Resources CEE6440 Fall Semester 2012 Management and Sharing of Hydrologic Information of Cache County To: Dr. David Tarboton Instructor By: Tian Gan Dec.7, 2012 I.
Rick Faber CE 513 Watershed and Streamwork Delineation Lab # 3 4/24/2006
 Rick Faber CE 513 Watershed and Streamwork Delineation Lab # 3 4/24/2006 1. Objective & Discussion: 2 To learn to use the ArcHydro tools to produce hydrologically descriptive data sets starting from a
MAPPING POTENTIAL LAND DEGRADATION IN BHUTAN
 MAPPING POTENTIAL LAND DEGRADATION IN BHUTAN Moe Myint, Geoinformatics Consultant Rue du Midi-8, CH-1196, Gland, Switzerland moemyint@bluewin.ch Pema Thinley, GIS Analyst Renewable Natural Resources Research
Dan Miller + Kelly Burnett, Kelly Christiansen, Sharon Clarke, Lee Benda. GOAL Predict Channel Characteristics in Space and Time
 Broad-Scale Models Dan Miller + Kelly Burnett, Kelly Christiansen, Sharon Clarke, Lee Benda GOAL Predict Channel Characteristics in Space and Time Assess Potential for Fish Use and Productivity Assess
Watershed Analysis of the Blue Ridge Mountains in Northwestern Virginia
 Watershed Analysis of the Blue Ridge Mountains in Northwestern Virginia Mason Fredericks December 6, 2018 Purpose The Blue Ridge Mountain range is one of the most popular mountain ranges in the United
Colorado River sediment transport 1. Natural sediment supply limitation and the influence of Glen Canyon Dam
 WATER RESOURCES RESEARCH, VOL. 36, NO. 2, PAGES 515 542, FEBRUARY 2000 Colorado River sediment transport 1. Natural sediment supply limitation and the influence of Glen Canyon Dam David J. Topping U.S.
Terrain Analysis Using Digital Elevation Models in Hydrology
 Terrain Analysis Using Digital Elevation Models in Hydrology David Tarboton, Utah State University This paper describes methods that use digital elevation models (DEMs) in hydrology, implemented as an
National Hydrography Dataset (NHD) Update Project for US Forest Service Region 3
 Update Project for US Forest Service Region 3") National Hydrography Dataset (NHD) Update Project for US Forest Service Region 3 Allison Moncada California State University, Northridge February 2017 July 2017 Advisor: Joel Osuna Center for Geographical
National Hydrography Dataset (NHD) Update Project for US Forest Service Region 3 Allison Moncada California State University, Northridge February 2017 July 2017 Advisor: Joel Osuna Center for Geographical
Lectures Hydrology & Fluvial Geomorphology. Gauley River Images. Ancients' (= Biblical) Model of Water (Hydrologic) Cycle
 Model of Water (Hydrologic) Cycle") Lectures 11-13 13 Hydrology & Fluvial Geomorphology Gauley River Images http://www.youtube.com/watch?v=eulmuyegtz4&feature=related Ancients' (= Biblical) Model of Water (Hydrologic) Cycle Stream Water
Lectures 11-13 13 Hydrology & Fluvial Geomorphology Gauley River Images http://www.youtube.com/watch?v=eulmuyegtz4&feature=related Ancients' (= Biblical) Model of Water (Hydrologic) Cycle Stream Water
Watershed concepts for community environmental planning
 Purpose and Objectives Watershed concepts for community environmental planning Dale Bruns, Wilkes University USDA Rural GIS Consortium May 2007 Provide background on basic concepts in watershed, stream,
The Effect of Bedform-induced Spatial Acceleration on Turbulence and Sediment Transport
 The Effect of Bedform-induced Spatial Acceleration on Turbulence and Sediment Transport S. McLean (1) (1) Mechanical and Environmental Engineering Dept., University of California, Santa Barbara, CA 93106,
NWT Open Report Delineation of Watersheds in the Mackenzie Mountains
 NWT Open Report 2015-007 Delineation of Watersheds in the Mackenzie Mountains K.L. Pierce and H. Falck Recommended Citation: Pierce, K.L. and Falck, H., 2015. Delineation of watersheds in the Mackenzie
NATURAL RIVER. Karima Attia Nile Research Institute
 NATURAL RIVER CHARACTERISTICS Karima Attia Nile Research Institute NATURAL RIVER DEFINITION NATURAL RIVER DEFINITION Is natural stream of water that flows in channels with ih more or less defined banks.
SCOPE OF PRESENTATION STREAM DYNAMICS, CHANNEL RESTORATION PLANS, & SEDIMENT TRANSPORT ANALYSES IN RELATION TO RESTORATION PLANS
 DESIGN METHODS B: SEDIMENT TRANSPORT PROCESSES FOR STREAM RESTORATION DESIGN PETER KLINGEMAN OREGON STATE UNIVERSITY CIVIL ENGINEERING DEPT., CORVALLIS 2 ND ANNUAL NORTHWEST STREAM RESTORATION DESIGN SYMPOSIUM
Monitoring Headwater Streams for Landscape Response to
 Monitoring Headwater Streams for Landscape Response to Climate Change Matthew Connor, PhD Connor nvironmental, nc. www.oe-i.com icom Healdsburg, California verview Headwater stream geomorphology Response
SECTION G SEDIMENT BUDGET
 SECTION G SEDIMENT BUDGET INTRODUCTION A sediment budget has been constructed for the for the time period 1952-2000. The purpose of the sediment budget is to determine the relative importance of different
Appendix K.2: Sediment Management Excerpt from South Orange County Hydromodification Management Plan
 Appendix K.2: Sediment Management Excerpt from South Orange County Hydromodification Management Plan 4 Sediment Supply Management Requirements Permit Order R9-2013-0001 as amended by Order No. R9-2015-0001Section
KINEROS2/AGWA. Fig. 1. Schematic view (Woolhiser et al., 1990).
.") KINEROS2/AGWA Introduction Kineros2 (KINematic runoff and EROSion) (K2) model was originated at the USDA-ARS in late 1960s and released until 1990 (Smith et al., 1995; Woolhiser et al., 1990). The spatial
KINEROS2/AGWA Introduction Kineros2 (KINematic runoff and EROSion) (K2) model was originated at the USDA-ARS in late 1960s and released until 1990 (Smith et al., 1995; Woolhiser et al., 1990). The spatial
A GIS-based Approach to Watershed Analysis in Texas Author: Allison Guettner
 Texas A&M University Zachry Department of Civil Engineering CVEN 658 Civil Engineering Applications of GIS Instructor: Dr. Francisco Olivera A GIS-based Approach to Watershed Analysis in Texas Author:
MEANDER MIGRATION MODEL ASSESSMENT FOR THE 50- AND 100-YEAR STORMS, WHITMAN PROPERTY, SAN ANTONIO CREEK, VENTURA COUNTY, CALIFORNIA
 MEANDER MIGRATION MODEL ASSESSMENT FOR THE 50- AND 100-YEAR STORMS, WHITMAN PROPERTY, SAN ANTONIO CREEK, VENTURA COUNTY, CALIFORNIA Prepared by Eric Larsen, Ph.D. Mark Rains, Ph.D. October 2006 TABLE OF
Geo-spatial Analysis for Prediction of River Floods
 Geo-spatial Analysis for Prediction of River Floods Abstract. Due to the serious climate change, severe weather conditions constantly change the environment s phenomena. Floods turned out to be one of
Susquehanna River Basin A Research Community Hydrologic Observatory. NSF-Funded Infrastructure Proposal in Support of River Basin Hydrologic Sciences
 Susquehanna River Basin A Research Community Hydrologic Observatory NSF-Funded Infrastructure Proposal in Support of River Basin Hydrologic Sciences Fundamental Problem: How Do Humans and Climate Impact
THE FLUVIAL ACTION OF THE KARLA BASIN STREAMS IN A NATURAL AND MAN MADE ENVIRONMENT
 Δελτίο της Ελληνικής Γεωλογικής Εταιρίας, 2010 Bulletin of the Geological Society of Greece, 2010 Πρακτικά 12ου Διεθνούς Συνεδρίου Proceedings of the 12th International Congress Πάτρα, Μάιος 2010 Patras,
Aquifer an underground zone or layer of sand, gravel, or porous rock that is saturated with water.
 Aggradation raising of the streambed by deposition that occurs when the energy of the water flowing through a stream reach is insufficient to transport sediment conveyed from upstream. Alluvium a general
Improvement of the National Hydrography Dataset for US Forest Service Region 3 in Cooperation with the National Forest Service
 Improvement of the National Hydrography Dataset for US Forest Service Region 3 in Cooperation with the National Forest Service Christian L. DeCasas California State University, Northridge November 7 th,
(3) Sediment Movement Classes of sediment transported
 Sediment Movement Classes of sediment transported") 9/17/15 (3) Sediment Movement Classes of sediment transported Dissolved load Suspended load Important for scouring algae Bedload (5-10% total load) Moves along bed during floods Source of crushing for
9/17/15 (3) Sediment Movement Classes of sediment transported Dissolved load Suspended load Important for scouring algae Bedload (5-10% total load) Moves along bed during floods Source of crushing for
Groundwater-Surface Water Interactions along the Hangman, California, and Rock Creeks, September 30, 2009
 Groundwater-Surface Water Interactions along the Hangman, California, and Rock Creeks, September 30, 2009 Abstract This data collection effort was required to complete recommendations in the Hangman Creek
Environmental Science Institute The University of Texas - Austin
 Environmental Science Institute The University of Texas - Austin Geologic Wonders of Central Texas Dr. Leon Long This file contains suggestions for how to incorporate the material from this CDROM into
Sediment transport and river bed evolution
 1 Chapter 1 Sediment transport and river bed evolution 1.1 What is the sediment transport? What is the river bed evolution? System of the interaction between flow and river beds Rivers transport a variety
Model Integration - How WEPP inputs are calculated from GIS data. ( ArcGIS,TOPAZ, Topwepp)
") Model Integration - How WEPP inputs are calculated from GIS data. ( ArcGIS,TOPAZ, Topwepp) ArcGIS 9.1-9.3 Allows user to locate area of interest, assemble grids, visualize outputs. TOPAZ Performs DEM
Model Integration - How WEPP inputs are calculated from GIS data. ( ArcGIS,TOPAZ, Topwepp) ArcGIS 9.1-9.3 Allows user to locate area of interest, assemble grids, visualize outputs. TOPAZ Performs DEM
Variability in discharge, stream power, and particlesize distributions in ephemeral-stream channel systems
 Variability in Stream Erosion and Sediment Transport (Proceedings of the Canberra Symposium December 1994). IAHS Publ. no. 224, 1994. 335 Variability in discharge, stream power, and particlesize distributions
GIS APPLICATIONS IN SOIL SURVEY UPDATES
 GIS APPLICATIONS IN SOIL SURVEY UPDATES ABSTRACT Recent computer hardware and GIS software developments provide new methods that can be used to update existing digital soil surveys. Multi-perspective visualization
ES 105 Surface Processes I. Hydrologic cycle A. Distribution % in oceans 2. >3% surface water a. +99% surface water in glaciers b.
 ES 105 Surface Processes I. Hydrologic cycle A. Distribution 1. +97% in oceans 2. >3% surface water a. +99% surface water in glaciers b. >1/3% liquid, fresh water in streams and lakes~1/10,000 of water
River Morphology. EAD 511 River management
 River Morphology EAD 511 River management Introduction FLUVIAL GEOMORPHOLOGY Webster's New World Dictionary defines fluvial as: of, found in, or produced by a river or rivers. The same reference defines
Slide #2. What is the drainage pattern that you can see on this hillslope? What hillslope hydrologic phenomenon is well exemplified on this hillslope?
 Geology 22 Process Geomorphology Final Exam Fall, 1999 Name This exam is closed book and closed notes. Take some time to read the questions carefully before you begin writing. Answer the questions concisely
Sensitivity Analysis of the Effective Parameters with Respect to Cantilever Type Failure in Composite Riverbanks
 Sensitivity Analysis of the Effective Parameters with Respect to Cantilever Type Failure in Composite Riverbanks A. Samadi 1, E. Amiri-Tokaldany 2, and M. H. Davoudi 3 1 Ph.D. Candidate, Department of
What discharge (cfs) is required to entrain the D 84 (84 th percentile of sediment size distribution) in Red Canyon Wash?
 is required to entrain the D 84 (84 th percentile of sediment size distribution) in Red Canyon Wash?") Gregory Indivero 31 October 2011 What discharge (cfs) is required to entrain the D 84 (84 th percentile of sediment size distribution) in Red Canyon Wash? What discharge was required to deposit observed
Gregory Indivero 31 October 2011 What discharge (cfs) is required to entrain the D 84 (84 th percentile of sediment size distribution) in Red Canyon Wash? What discharge was required to deposit observed
Why Geomorphology for Fish Passage
 Channel Morphology - Stream Crossing Interactions An Overview Michael Love Michael Love & Associates mlove@h2odesigns.com (707) 476-8938 Why Geomorphology for Fish Passage 1. Understand the Scale of the
Stream Geomorphology. Leslie A. Morrissey UVM July 25, 2012
 Stream Geomorphology Leslie A. Morrissey UVM July 25, 2012 What Functions do Healthy Streams Provide? Flood mitigation Water supply Water quality Sediment storage and transport Habitat Recreation Transportation
Thank you to all of our 2015 sponsors: Media Partner
 Thank you to all of our 2015 sponsors: Media Partner Fluvial System Concepts and Their Application in Greenfield Stream Corridor Realignment Dr. Paul Villard, P.Geo. GEO Morphix Ltd. Overview Major realignment
FOREST RESEARCH INSTITUTE, DEHRADUN
 PROJECT REPORT DRAINAGE AND REPLENISHMENT STUDY OF MINED AREA OF GANGA SHYAMPUR RIVER HARIDWAR Submitted to UTTARAKHAND FOREST DEVELOPMENT CORPORATION (UFDC) 73, Nehru Road, Deharadun Prepared&Submitted
Down-stream process transition (f (q s ) = 1)
 = 1)") Down-stream process transition (f (q s ) = 1) Detachment Limited S d >> S t Transport Limited Channel Gradient (m/m) 10-1 Stochastic Variation { Detachment Limited Equilibrium Slope S d = k sd A -θ d S
Down-stream process transition (f (q s ) = 1) Detachment Limited S d >> S t Transport Limited Channel Gradient (m/m) 10-1 Stochastic Variation { Detachment Limited Equilibrium Slope S d = k sd A -θ d S
Characterisation of valleys from DEMs
 18 th World IMACS / MODSIM Congress, Cairns, Australia 13-17 July 2009 http://mssanz.org.au/modsim09 Characterisation of valleys from DEMs Wang, D. 1,2 and Laffan, S.W. 1 1. School of Biological, Earth
APPENDIX E. GEOMORPHOLOGICAL MONTORING REPORT Prepared by Steve Vrooman, Keystone Restoration Ecology September 2013
 APPENDIX E GEOMORPHOLOGICAL MONTORING REPORT Prepared by Steve Vrooman, Keystone Restoration Ecology September 2 Introduction Keystone Restoration Ecology (KRE) conducted geomorphological monitoring in
GIS in Water Resources Exercise #4 Solution
 GIS in Water Resources Exercise #4 Solution 1. Table giving the length of the Logan River main stream from NHDPlus Length (km) column, Landscape.gdb\NHDPlusv shape_length and Logan.gdb\Basemap\LoganMain
Module/Unit: Landforms Grade Level: Fifth
 Module/Unit: Landforms Grade Level: Fifth PA Academic Standards for Science and Technology and Environment and Ecology: 3.1.7.B Describe the use of models as an application or scientific or technological
GLG362/GLG598 Geomorphology K. Whipple October, 2009 I. Characteristics of Alluvial Channels
 I. Characteristics of Alluvial Channels Self-formed morphology set by entrainment, transport, and deposition They move unconsolidated sedimentary materials present in the valley fill flood plain/bank flow
Civil Engineering Journal
 Available online at www.civilejournal.org Civil Engineering Journal Vol. 1, No. 2, December, 2015 Comparative Study of Landsat and Aster Data by Morphometric Analysis Sujit Kumar a*, Tapasi Bhandary b
Technical Memorandum. To: From: Copies: Date: 10/19/2017. Subject: Project No.: Greg Laird, Courtney Moore. Kevin Pilgrim and Travis Stroth
 Technical Memorandum To: From: Greg Laird, Courtney Moore Kevin Pilgrim and Travis Stroth 5777 Central Avenue Suite 228 Boulder, CO 80301 www.otak.com Copies: [Electronic submittal] Date: 10/19/2017 Subject:
Perspectives on river restoration science, geomorphic processes, and channel stability
 Perspectives on river restoration science, geomorphic processes, and channel stability Stream Restoration Forum: Science and Regulatory Connections Andrew C. Wilcox Department of Geosciences University
MODULE 7 LECTURE NOTES 5 DRAINAGE PATTERN AND CATCHMENT AREA DELINEATION
 MODULE 7 LECTURE NOTES 5 DRAINAGE PATTERN AND CATCHMENT AREA DELINEATION 1. Introduction Topography of the river basin plays an important role in hydrologic modelling, by providing information on different
Development of Kanako, a wide use 1-D and 2-D debris flow simulator equipped with GUI
 Monitoring, Simulation, Prevention and Remediation of Dense Debris Flows II 49 Development of Kanako, a wide use 1-D and 2-D debris flow simulator equipped with GUI K. Nakatani, T. Wada, Y. Satofuka &
11/12/2014. Running Water. Introduction. Water on Earth. The Hydrologic Cycle. Fluid Flow
 Introduction Mercury, Venus, Earth and Mars share a similar history, but Earth is the only terrestrial planet with abundant water! Mercury is too small and hot Venus has a runaway green house effect so
Summary. Streams and Drainage Systems
 Streams and Drainage Systems Summary Streams are part of the hydrologic cycle and the chief means by which water returns from the land to the sea. They help shape the Earth s surface and transport sediment
Predictions of steady state and transient landscape morphology using sediment-flux-dependent river incision models
 Click Here for Full Article JOURNAL OF GEOPHYSICAL RESEARCH, VOL. 112,, doi:10.1029/2006jf000567, 2007 Predictions of steady state and transient landscape morphology using sediment-flux-dependent river
Mountain Rivers. Gutta cavat lapidem. (Dripping water hollows out a stone) -Ovid, Epistulae Ex Ponto, Book 3, no. 10, 1. 5
 -Ovid, Epistulae Ex Ponto, Book 3, no. 10, 1. 5") Mountain Rivers Gutta cavat lapidem (Dripping water hollows out a stone) -Ovid, Epistulae Ex Ponto, Book 3, no. 10, 1. 5 Mountain Rivers Fixed channel boundaries (bedrock banks and bed) High transport
Mountain Rivers Gutta cavat lapidem (Dripping water hollows out a stone) -Ovid, Epistulae Ex Ponto, Book 3, no. 10, 1. 5 Mountain Rivers Fixed channel boundaries (bedrock banks and bed) High transport
PART 2:! FLUVIAL HYDRAULICS" HYDROEUROPE
 PART 2:! FLUVIAL HYDRAULICS" HYDROEUROPE 2009 1 HYDROEUROPE 2009 2 About shear stress!! Extremely complex concept, can not be measured directly!! Computation is based on very primitive hypotheses that
Workshops funded by the Minnesota Environment and Natural Resources Trust Fund
 Workshops funded by the Minnesota Environment and Natural Resources Trust Fund Conservation Applications of LiDAR Data Workshops funded by: Minnesota Environment and Natural Resources Trust Fund Presented
Height Above Nearest Drainage in Houston THE UNIVERSITY OF TEXAS AT AUSTIN
 Height Above Nearest Drainage in Houston THE UNIVERSITY OF TEXAS AT AUSTIN Jeff Yuanhe Zheng GIS in Water Resources December 2 nd, 2016 Table of Contents 1.0 Introduction... 1 2.0 Project Objective...
Figure 1 The map shows the top view of a meandering stream as it enters a lake. At which points along the stream are erosion and deposition dominant?
 1. In which type of climate does chemical weathering usually occur most rapidly? 1. hot and dry 3. cold and dry 2. hot and wet 4. cold and wet 2. Figure 1 The map shows the top view of a meandering stream
Watershed Modeling With DEMs
 Watershed Modeling With DEMs Lesson 6 6-1 Objectives Use DEMs for watershed delineation. Explain the relationship between DEMs and feature objects. Use WMS to compute geometric basin data from a delineated
SELBY CREEK STREAM HABITAT RESTORATION AND RIPARIAN REVEGETATION PROJECT: GEOMORPHIC ANALYSIS AND REVIEW
 SELBY CREEK STREAM HABITAT RESTORATION AND RIPARIAN REVEGETATION PROJECT: GEOMORPHIC ANALYSIS AND REVIEW Submitted to Bioengineering Institute P.O. Box 1554 Laytonville, CA 95454 By Matthew O Connor, PhD,