Rick Faber CE 513 Watershed and Streamwork Delineation Lab # 3 4/24/2006
|
|
|
- Anastasia Thornton
- 5 years ago
- Views:
Transcription
1 Rick Faber CE 513 Watershed and Streamwork Delineation Lab # 3 4/24/2006
2 1. Objective & Discussion: 2 To learn to use the ArcHydro tools to produce hydrologically descriptive data sets starting from a DEM. Some of these data sets include: drainage lines, catchment extent, stream definition, and watershed delineation. 2. Major Steps Utilized in this Lab 1. DEM Reconditioning impose linear features on DEM, (burning/fencing) 2. Fill Sinks remove sinkholes (what if there really is one?) 3. Flow Direction calculate the steepest slope & direction 4. Flow Accumulation How many pixels flow into this pixel, i.e. how many upstream pixels. 5. Stream Definition threshold for defining area that would typically represent a stream 7. Catchment Grid Delineation - which stream segment this pixel drains to 8. Catchment Polygon Processing convert catchment grid into a catchment polygon feature 9. Drainage Line Processing Convert stream link raster into Drainage line vectors feature 10. Adjoint Catchment Processing Catchments for all outlet points i.e. the aggregated upstream catchments 11. Drainage Point Processing drainage point feature class for all catchments. I.e. the outlet of each catchment 12. Drainage Density Evaluation Streams per area calculations & comparisons. Watershed Processing 1. Batch Watershed Delineation Delineate watersheds from a point feature class. 2. Interactive Point Delineation Delineate watershed from a single interactive point. 3. Batch Subwatershed Delineation Calculate subwatersheds for a point feature class. 4. Flow Path Tracing trace the path water would flow from any given direction. 3. Flow Chart of Major Steps The ArcHydro tools flow just down the Terrain Processing Menu:

3 3 4. Lab Questions: 1. Cell size, Number of rows and columns of smdem, maximum and minimum elevation values in smdem. 1 pt Cell 100m, 1300 columns, 818 rows. Elevation ranges from 70 to 618m

4 2. Layout with a depiction of topography either with contours or hillshade in nice colors. Include the streams from NHD. Mark your point of highest elevation and indicate its elevation. 5pts 4 San Marcos Watershed This map shows the general features of the San Marcos watershed. The point of highest elevation in the watershed is indicated, and the district topography differences between the eastern & western portions of the watershed are very noticeable.

5 3. Make a screen capture of the attribute table of Fdr and give an interpretation for the values in the Value field using a sketch.2 pst 5 Screen shot showing the Attribute Table of Flow Direction Table shows direction values 1,2,4,8,16,32,64,128 and the count. As the basin flows generally southeast, you notice the small number of NE (32) direction pixels. For a given cell, the flow directions are coded as: I.e. if the flow direction from one cell is to the cell just below it, it is given a value of Report the drainage area of the San Marcos basin in both number of 100 m grid cells and km2 as estimated by flow accumulation m 2 grid cells = km 2 Report the omitted drainage area assumed due to imprecise delineation at the location indicated on the southern edge, in both number of 100 m grid cells and km2. 2pts m 2 grid cells = 7.54km 2

6 6 5. A layout with a comparison of the generated DrainageLine and the NHD river network for San Marcos. Make comments on this comparison and suggest ways to improve the match between them.5pts 59

7 6. How many DrainagePoints, DrainageLines and Catchments are there? 7 116,116,116 What is the ID field in each feature class that associates the appropriate DrainagePoint with its DrainageLine and Catchment? GRIDID Make a graphic showing how one associated DrainagePoint, DrainageLine and Catchment are related.3pts DrainagePoint, DrainageLine & Catchment Associations This plot shows the GridID of the indicated features. The Drainage point relationship to the catchment and the Drainageline become obvious 7. Report the drainage area of the San Marcos basin in km2 estimated from both the DEM flow accumulation and subbasin HUC km 2 vs km 2 respectively. (3520 from the Adjoint catchment calculation) Report the length of streams in the San Marcos basin in km from both the DEM delineated drainage lines and NHD flowlines. 567 km vs km respectively Calculate the drainage density (length/area) in km/km2 for both the DEM delineated drainage lines and NHD flowlines. Use the area that you feel is most appropriate. Comment on reasons for the differences in drainage density.5pts DEM: 567 km / km 2 = 0.30 km/ km 2 NHD(HUC): 1892 km / 3538 km 2 = 0.53 km/ km 2 The NHD flowlines are much denser. We chose a Stream definition area that was larger during the calculation of streams and all the subsequent calculations. Fewer streams for the same area. Again a tradeoff of accuracy vs. calculation performance.

8 8. Layout showing the delineated watershed for your selected outlet. Report the Drainage Area of the watershed you delineated in km2. 5pts (area in Map Text) 8
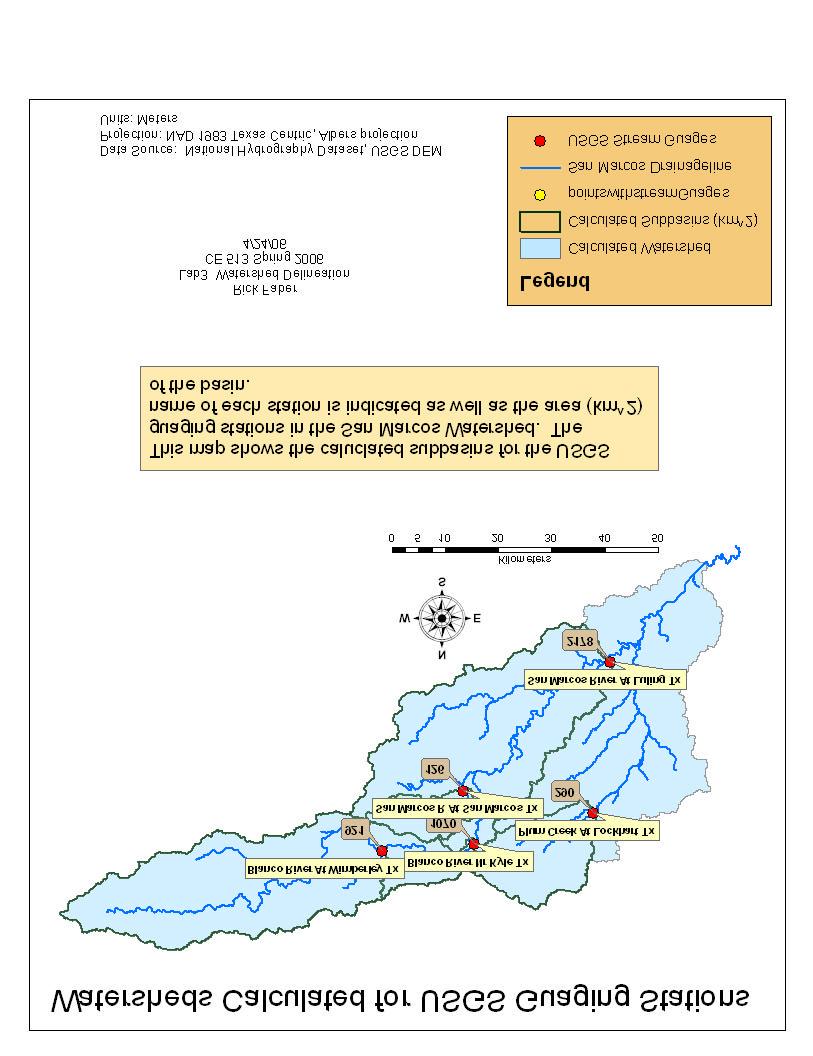
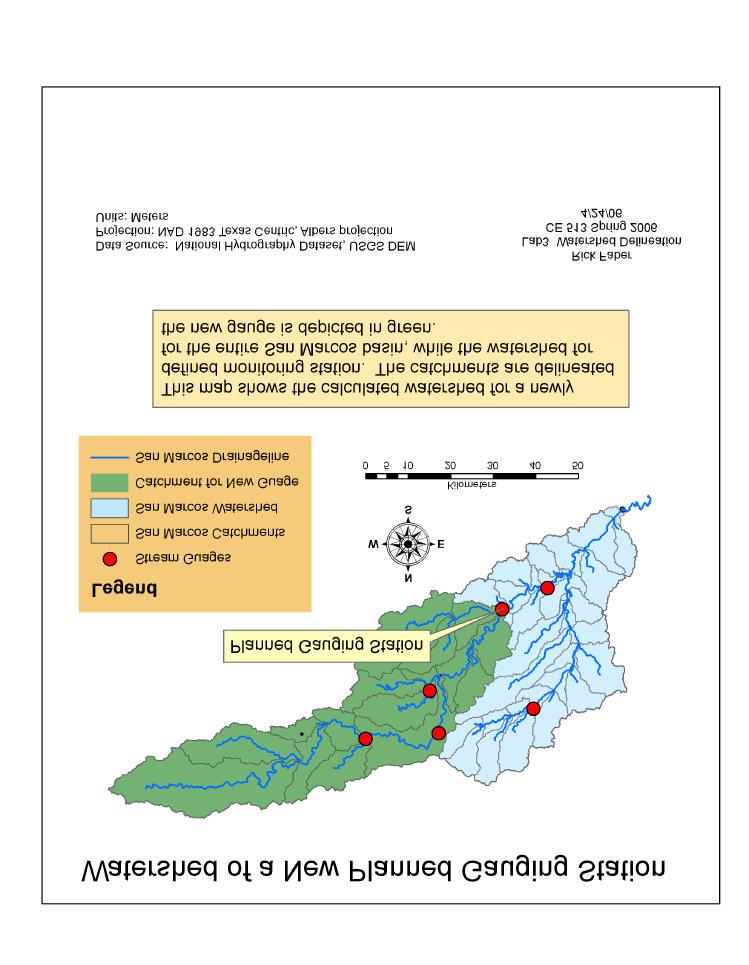
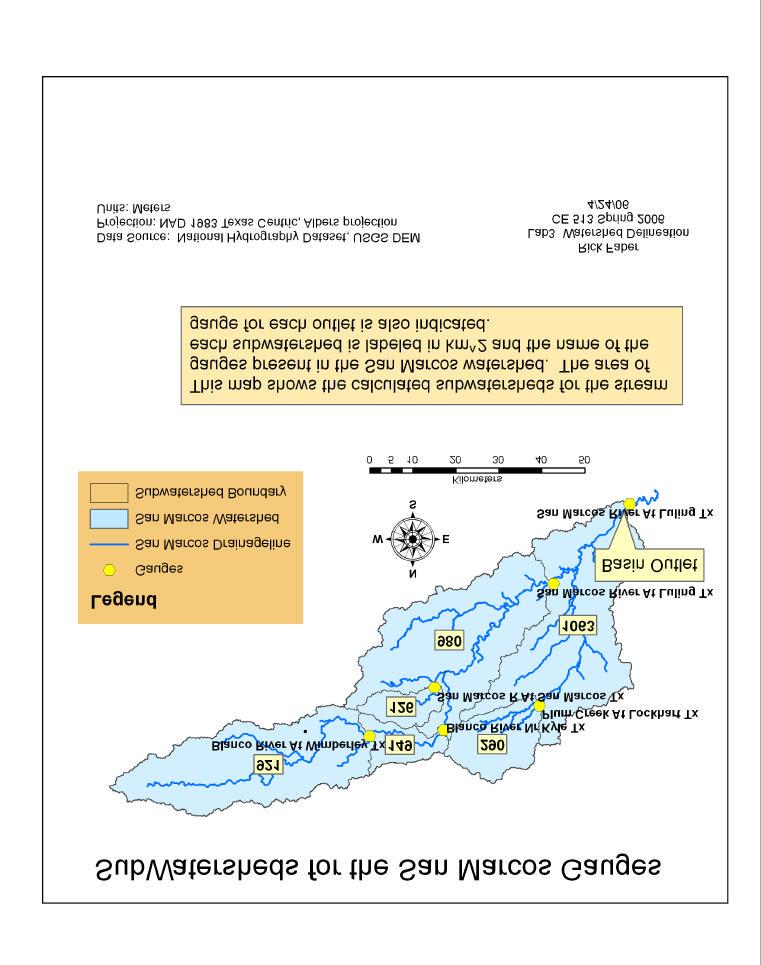
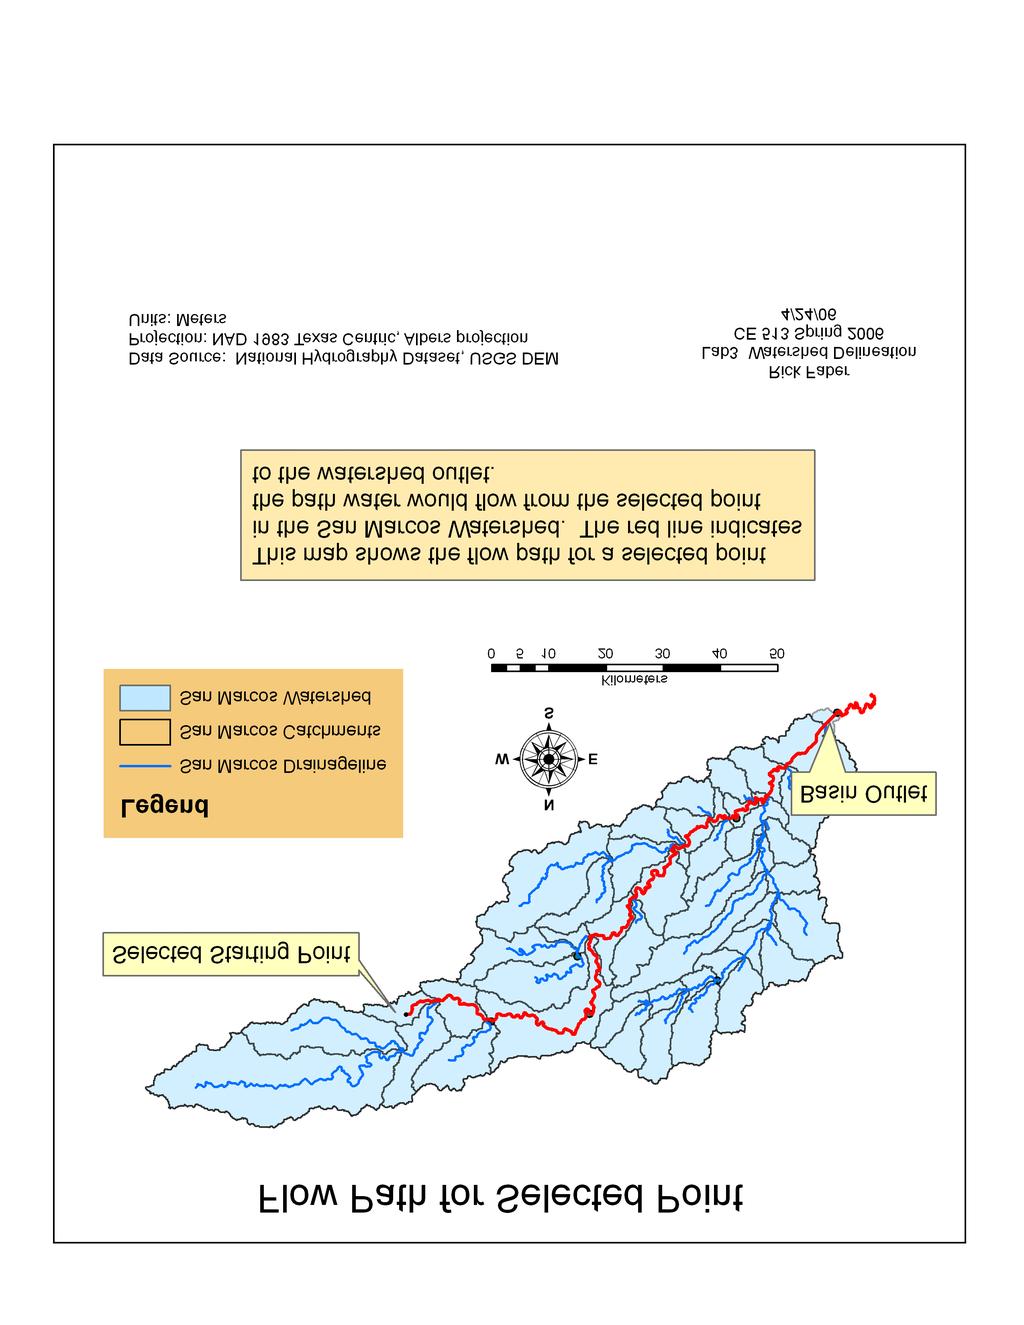
9 9 9. Layout showing the delineated watershed for each USGS Gauging Station. Label each watershed outlet with its contributing Drainage Area obtained from the Watershed Feature class. Prepare a table using Excel giving Name, USGS gage number, Watershed point HydroID, Watershed HydroID, Drainage area from ArcGIS (converted km2). 5pts Table of Watershed Info for the USGS gauging stations Gauge Name USGS guage # Watershed point HydroID Watershed HydroID Drainage Area from ArcGIS km^2 Blanco River At Wimberley Tx Blanco River Nr Kyle Tx Plum Creek At Lockhart Tx San Marcos R At San Marcos Tx San Marcos River At Luling Tx This Table shows the Watersheds defined by the different USGS gauging stations in the study area. Note that the watersheds are not exclusive, that is the watershed for the point lowest on the river includes all of the watersheds above it. The table also shows the difference in HydroID s for the two feature classes. See page 10 for layout 10. Layout showing the delineated watershed for your point including the DrainageLine and Catchments See page Layout showing the delineated subwatersheds the San Marcos stream gages and basin outlet point. Include the DrainageLine and the Catchments feature classes. See Page 12 Prepare a table giving Name, USGS gage number, and subwatershed area (converted km2) for each subwatershed. Show that the total area is the sum of subwatershed areas.5pts Table of Subwatershed Name,USGS ID & Area Name USGS Gauge # Subwatershed Area (km^2) Blanco River At Wimberley Tx Blanco River Nr Kyle Tx Plum Creek At Lockhart Tx San Marcos R At San Marcos Tx Outlet Point na 1063 San Marcos River At Luling Tx Total Area of all Subbasins 3529 This table shows the gauging stations identities & corresponding subbasin area. The sum of the subwatershed areas are nearly identical to the area of the entire watershed as opposed to the watershed table above. 12. Layout showing the flow path for your selected point including the DrainageLine and the Catchments. See Page 13
10 10
11 11
12 12
13 13
ArcHYDRO: GIS for Water Resources
 SOCRATES ERASMUS Intensive Programme ArcHYDRO: GIS for Water Resources Source: Center for Research in Water Resources, University of Texas at Austin Tutorial: Watershed and Stream Network Delineation Goals
GIS in Water Resources Exercise #4 Solution
 GIS in Water Resources Exercise #4 Solution 1. Table giving the length of the Logan River main stream from NHDPlus Length (km) column, Landscape.gdb\NHDPlusv shape_length and Logan.gdb\Basemap\LoganMain
GIS in Water Resources Exercise #4 Solution Prepared by Irene Garousi-Nejad and David Tarboton
 GIS in Water Resources Exercise 4 Solution Prepared by Irene Garousi-Nejad and David Tarboton 1. Cell length (N-S) in m, width (E-W) in m, area in m 2 for the DEM cells in the merged DEM. N-S y = R e φ
Watershed and Stream Network Delineation
 Watershed and Stream Network Delineation GIS in Water Resources, Fall 2011 Prepared by David Tarboton, Utah State University Purpose The purpose of this exercise is to illustrate watershed and stream network
GIS in Water Resources Midterm Exam Fall 2016 There are four questions on this exam. Please do all four. They are not all of equal weight.
 Page 1 of 7 Name: GIS in Water Resources Midterm Exam Fall 2016 There are four questions on this exam. Please do all four. They are not all of equal weight. Question 1. (20%) (a) Three key functions of
GIS in Water Resources Midterm Quiz Fall There are 5 questions on this exam. Please do all 5. They are of equal credit.
 Page 1 of 7 Name: GIS in Water Resources Midterm Quiz Fall 2004 There are 5 questions on this exam. Please do all 5. They are of equal credit. 1. In exercises in this class you have developed the skills
A GIS-based Approach to Watershed Analysis in Texas Author: Allison Guettner
 Texas A&M University Zachry Department of Civil Engineering CVEN 658 Civil Engineering Applications of GIS Instructor: Dr. Francisco Olivera A GIS-based Approach to Watershed Analysis in Texas Author:
GRAPEVINE LAKE MODELING & WATERSHED CHARACTERISTICS
 GRAPEVINE LAKE MODELING & WATERSHED CHARACTERISTICS Photo Credit: Lake Grapevine Boat Ramps Nash Mock GIS in Water Resources Fall 2016 Table of Contents Figures and Tables... 2 Introduction... 3 Objectives...
MODULE 7 LECTURE NOTES 5 DRAINAGE PATTERN AND CATCHMENT AREA DELINEATION
 MODULE 7 LECTURE NOTES 5 DRAINAGE PATTERN AND CATCHMENT AREA DELINEATION 1. Introduction Topography of the river basin plays an important role in hydrologic modelling, by providing information on different
Exercise 4. Watershed and Stream Network Delineation
 Exercise 4. Watershed and Stream Network Delineation GIS in Water Resources, Fall 2018 Prepared by David G Tarboton and David R. Maidment Revised 9 October, 2018 Purpose The purpose of this exercise is
Exercise 4. Watershed and Stream Network Delineation
 Exercise 4. Watershed and Stream Network Delineation GIS in Water Resources, Fall 2017 Prepared by David G Tarboton and David R. Maidment Updated to ArcGIS Pro by Paul Ruess Purpose The purpose of this
Watershed Analysis of the Blue Ridge Mountains in Northwestern Virginia
 Watershed Analysis of the Blue Ridge Mountains in Northwestern Virginia Mason Fredericks December 6, 2018 Purpose The Blue Ridge Mountain range is one of the most popular mountain ranges in the United
Exercise 4. Watershed and Stream Network Delineation
 Exercise 4. Watershed and Stream Network Delineation GIS in Water Resources, Fall 2015 Prepared by David G Tarboton and David R. Maidment Purpose The purpose of this exercise is to illustrate watershed
Exercise 4. Watershed and Stream Network Delineation
 Exercise 4. Watershed and Stream Network Delineation GIS in Water Resources, Fall 2014 Prepared by David G Tarboton and David R. Maidment Purpose The purpose of this exercise is to illustrate watershed
Using ArcGIS for Hydrology and Watershed Analysis:
 Using ArcGIS 10.2.2 for Hydrology and Watershed Analysis: A guide for running hydrologic analysis using elevation and a suite of ArcGIS tools Anna Nakae Feb. 10, 2015 Introduction Hydrology and watershed
Exercise 4. Watershed and Stream Network Delineation
 Exercise 4. Watershed and Stream Network Delineation GIS in Water Resources, Fall 2016 Prepared by David G Tarboton and David R. Maidment Updated to ArcGIS Pro by Paul Ruess [9/29/16 Further updated to
Exercise 5 - Watershed and Stream Network Delineation from DEMs GIS in Water Resources Fall 2014
 1 Exercise 5 - Watershed and Stream Network Delineation from DEMs GIS in Water Resources Fall 2014 Prepared by Ayse Kilic and Bhavneet Soni 1 University of Nebraska-Lincoln This exercise illustrates watershed
GIS in Water Resources Midterm Exam Fall 2012 There are five questions on this exam. Please do all five.
 Page 1 of 6 Name: Key GIS in Water Resources Midterm Exam Fall 2012 There are five questions on this exam. Please do all five. Question 1 (a) You have worked with the location of Utah State University
Hydrology and Watershed Analysis
 Hydrology and Watershed Analysis Manual By: Elyse Maurer Reference Map Figure 1. This map provides context to the area of Washington State that is being focused on. The red outline indicates the boundary
Rick Faber CE 513 Building a Base Map Lab #2 6/2/06
 Rick Faber CE 513 Building a Base Map Lab #2 6/2/06 1. Objective & Discussion: By using data for the Guadalupe river basin in Texas, we will get a chance to build a base map of hydrologic features. These
International Journal of Advance Engineering and Research Development
 Scientific Journal of Impact Factor (SJIF): 4.72 International Journal of Advance Engineering and Research Development Volume 4, Issue 5, May -2017 Watershed Delineation of Purna River using Geographical
Exercise 2. Building a Base Dataset of the San Marcos Basin
 Exercise 2. Building a Base Dataset of the San Marcos Basin GIS in Water Resources Fall 2015 Prepared by David R. Maidment and David G. Tarboton Goals of the Exercise Computer and Data Requirements Procedure
Lab 1: Landuse and Hydrology, learning ArcGIS II. MANIPULATING DATA
 Lab 1: Landuse and Hydrology, learning ArcGIS II. MANIPULATING DATA As you experienced in the first lab session when you created a hillshade, high resolution data can be unwieldy if you are trying to perform
GIS in Water Resources Midterm Quiz Fall There are 5 questions on this exam. Please do all 5. They are of equal credit.
 Name: GIS in Water Resources Midterm Quiz Fall 2003 There are 5 questions on this exam. Please do all 5. They are of equal credit. 1. Data Representation (a) In ArcGIS, vector and tabular data have a number
GIS in Water Resources Midterm Exam Fall 2008 There are 4 questions on this exam. Please do all 4.
 Page 1 of 8 Name: GIS in Water Resources Midterm Exam Fall 2008 There are 4 questions on this exam. Please do all 4. 1. Basic Concepts [20 points] Find the letter with the best answer for each term: 1.
Using the Stock Hydrology Tools in ArcGIS
 Using the Stock Hydrology Tools in ArcGIS This lab exercise contains a homework assignment, detailed at the bottom, which is due Wednesday, October 6th. Several hydrology tools are part of the basic ArcGIS
CE 394K/CEE6440 GIS in Water Resources Fall 2018 Final Exam Solution
 CE 394K/CEE6440 GIS in Water Resources Fall 2018 Final Exam Solution 3. Austin Population The figure below shows two feature classes, one being the extent of the 1:24,000 Austin East topographic map and
Application of Geographical Information System (GIS) tools in watershed analysis
 tools in watershed analysis") Application of Geographical Information System (GIS) tools in watershed analysis Paritosh Gupta 1, Damanjit S Minhas 2, Rajendra M Tamhane 1, A K Mookerjee 2 1.ESRI India New Delhi 2. LEA Associates South
Application of Geographical Information System (GIS) tools in watershed analysis Paritosh Gupta 1, Damanjit S Minhas 2, Rajendra M Tamhane 1, A K Mookerjee 2 1.ESRI India New Delhi 2. LEA Associates South
Streams in the Ranching Country of South Texas
 Streams in the Ranching Country of South Texas Watershed Analysis of HUC 12110207 Sandranell Moerbe CE GIS in Water Resources Fall 2015 INTRODUCTION This project investigates the portion of South Texas
Within this document, the term NHDPlus is used when referring to NHDPlus Version 2.1 (unless otherwise noted).
.") Exercise 7 Watershed Delineation Using ArcGIS Spatial Analyst Last Updated 4/6/2017 Within this document, the term NHDPlus is used when referring to NHDPlus Version 2.1 (unless otherwise noted). There
Exercise 7 Watershed Delineation Using ArcGIS Spatial Analyst Last Updated 4/6/2017 Within this document, the term NHDPlus is used when referring to NHDPlus Version 2.1 (unless otherwise noted). There
Using Earthscope and B4 LiDAR data to analyze Southern California s active faults
 Using Earthscope and B4 LiDAR data to analyze Southern California s active faults Exercise 8: Simple landscape morphometry and stream network delineation Introduction This exercise covers sample activities
Creating Watersheds and Stream Networks. Steve Kopp
 Creating Watersheds and Stream Networks Steve Kopp Workshop Overview Demo Data Understanding the tools Elevation Data Types DEM : Digital Elevation Model bare Earth DSM : Digital Surface Model Data Structure
Lidar-derived Hydrography as a Source for the National Hydrography Dataset
 Lidar-derived Hydrography as a Source for the National Hydrography Dataset Lidar-Derived Hydrography, Bathymetry, and Topobathymetry in the National Hydrography Dataset and 3-Dimensional Elevation Program
Watershed Modeling With DEMs
 Watershed Modeling With DEMs Lesson 6 6-1 Objectives Use DEMs for watershed delineation. Explain the relationship between DEMs and feature objects. Use WMS to compute geometric basin data from a delineated
Basin characteristics
 Basin characteristics From hydrological processes at the point scale to hydrological processes throughout the space continuum: point scale à river basin The watershed characteristics (shape, length, topography,
Designing a Dam for Blockhouse Ranch. Haley Born
 Designing a Dam for Blockhouse Ranch Haley Born CE 394K GIS in Water Resources Term Paper Fall 2011 Table of Contents Introduction... 1 Data Sources... 2 Precipitation Data... 2 Elevation Data... 3 Geographic
A Simple Drainage Enforcement Procedure for Estimating Catchment Area Using DEM Data
 A Simple Drainage Enforcement Procedure for Estimating Catchment Area Using DEM Data David Nagel, John M. Buffington, and Charles Luce U.S. Forest Service, Rocky Mountain Research Station Boise Aquatic
RiparianZone = buffer( River, 100 Feet )
") GIS Analysts perform spatial analysis when they need to derive new data from existing data. In GIS I, for example, you used the vector approach to derive a riparian buffer feature (output polygon) around
GIS Analysts perform spatial analysis when they need to derive new data from existing data. In GIS I, for example, you used the vector approach to derive a riparian buffer feature (output polygon) around
Introduction to HEC-GeoHMS. Watershed boundary delineation. Assembling Hydrologic Modeling System
 Introduction to HEC-GeoHMS Watershed boundary delineation Assembling Hydrologic Modeling System HEC-GeoHMS GIS tool set supporting HEC-HMS modeling S Developed by USACE S ArcView 3.x extension v1.1 supported
ENGRG Introduction to GIS
 ENGRG 59910 Introduction to GIS Michael Piasecki March 17, 2014 Lecture 08: Terrain Analysis Outline: Terrain Analysis Earth Surface Representation Contour TIN Mass Points Digital Elevation Models Slope
13 Watershed Delineation & Modeling
 Module 4 (L12 - L18): Watershed Modeling Standard modeling approaches and classifications, system concept for watershed modeling, overall description of different hydrologic processes, modeling of rainfall,
Creating Watersheds from a DEM in ArcGIS 9.x
 Creating Watersheds from a DEM in ArcGIS 9.x These instructions enable you to create watersheds (a.k.a. catchments or basins) using a good quality Digital Elevation Model (DEM) in ArcGIS 9.1. The modeling
4. GIS Implementation of the TxDOT Hydrology Extensions
 4. GIS Implementation of the TxDOT Hydrology Extensions A Geographic Information System (GIS) is a computer-assisted system for the capture, storage, retrieval, analysis and display of spatial data. It
ENGRG Introduction to GIS
 ENGRG 59910 Introduction to GIS Michael Piasecki November 17, 2017 Lecture 11: Terrain Analysis Outline: Terrain Analysis Earth Surface Representation Contour TIN Mass Points Digital Elevation Models Slope
Digital Elevation Models. Using elevation data in raster format in a GIS
 Digital Elevation Models Using elevation data in raster format in a GIS What is a Digital Elevation Model (DEM)? Digital representation of topography Model based on scale of original data Commonly a raster
GIS feature extraction tools in diverse landscapes
 CE 394K.3 GIS in Water Resources GIS feature extraction tools in diverse landscapes Final Project Anna G. Kladzyk M.S. Candidate, Expected 2015 Department of Environmental and Water Resources Engineering
The National Hydrography Dataset in the Pacific Region. U.S. Department of the Interior U.S. Geological Survey
 The National Hydrography Dataset in the Pacific Region U.S. Department of the Interior U.S. Geological Survey The National Map The National Map is built on partnerships and standards The National Map consists
BSEN 6220 GIS LAB #5
 BSEN 6220 GIS LAB #5 Dustin Till 10/29/2014 INTRODUCTION: ArcGIS is a geographic information system for working with maps and geographic information. It is used for creating and using maps, compiling geographic
Height Above Nearest Drainage in Houston THE UNIVERSITY OF TEXAS AT AUSTIN
 Height Above Nearest Drainage in Houston THE UNIVERSITY OF TEXAS AT AUSTIN Jeff Yuanhe Zheng GIS in Water Resources December 2 nd, 2016 Table of Contents 1.0 Introduction... 1 2.0 Project Objective...
Terrain and Satellite Imagery in Madre de Dios, Peru
 Rhett Butler/mongabay.com Terrain and Satellite Imagery in Madre de Dios, Peru Katherine Lininger CE 394 GIS for Water Resources Term Paper December 1, 2011 Introduction Informal and small-scale gold mining
Lecture 3. Data Sources for GIS in Water Resources
 Lecture 3 Data Sources for GIS in Water Resources GIS in Water Resources Spring 2015 http://www.data.gov/ 1 USGS GIS data for Water http://water.usgs.gov/maps.html Watersheds of the US 2-digit water resource
HYDROLOGIC AND WATER RESOURCES EVALUATIONS FOR SG. LUI WATERSHED
 HYDROLOGIC AND WATER RESOURCES EVALUATIONS FOR SG. LUI WATERSHED 1.0 Introduction The Sg. Lui watershed is the upper part of Langat River Basin, in the state of Selangor which located approximately 20
Watershed Delineation
 Watershed Delineation Jessica L. Watkins, University of Georgia 2 April 2009 Updated by KC Love February 25, 2011 PURPOSE For this project, I delineated watersheds for the Coweeta synoptic sampling area
![)UDQFR54XHQWLQ(DQG'tD]'HOJDGR&](/thumbs/95/125846872.jpg ")UDQFR54XHQWLQ(DQG'tD]'HOJDGR&") &21&(37,21$1',03/(0(17$7,212)$1+
&21&(37,21$1',03/(0(17$7,212)$1+ Leon Creek Watershed October 17-18, 1998 Rainfall Analysis Examination of USGS Gauge Helotes Creek at Helotes, Texas
 Leon Creek Watershed October 17-18, 1998 Rainfall Analysis Examination of USGS Gauge 8181400 Helotes Creek at Helotes, Texas Terrance Jackson MSCE Candidate University of Texas San Antonio Abstract The
Influence of spatial variation in precipitation on artificial neural network rainfall-runoff model
 Hydrology Days 212 Influence of spatial variation in precipitation on artificial neural network rainfall-runoff model André Dozier 1 Department of Civil and Environmental Engineering, Colorado State University
GIS Based Delineation of Micro-watershed and its Applications: Mahendergarh District, Haryana
 Kamla-Raj 2012 J Hum Ecol, 38(2): 155-164 (2012) GIS Based Delineation of Micro-watershed and its Applications: Mahendergarh District, Haryana Gulshan Mehra and Rajeshwari * Department of Geography, Kurukshetra
Governing Rules of Water Movement
 Governing Rules of Water Movement Like all physical processes, the flow of water always occurs across some form of energy gradient from high to low e.g., a topographic (slope) gradient from high to low
CE 394K.3 GIS in Water Resources Midterm Quiz Fall There are 5 questions on this exam. Please do all 5. They are of equal credit.
 Name: CE 394K.3 GIS in Water Resources Midterm Quiz Fall 2000 There are 5 questions on this exam. Please do all 5. They are of equal credit. 1. The ArcView Geographic Information System can display different
DEM Practice. University of Oklahoma/HyDROS Module 3.1
 DEM Practice University of Oklahoma/HyDROS Module 3.1 Outline Day 3 DEM PRACTICE Review creation and processing workflow Pitfalls and potential problems Prepare topographical files for Example 3 EF5 DEM
JJ Munoz. Explanation of the Project/Outline
 JJ Munoz Helper GEO 386G 1 December, 2016 GIS Project: Using ArcHydro and Surface Roughness tools to Determine Alluvial Fan Catchment Area Morphology Statistics from 1-meter resolution LiDAR DEM s. Explanation
Civil Engineering 394K: Topic 3 Geographic Information Systems (GIS) in Water Resources Engineering FALL 2014
 in Water Resources Engineering FALL 2014") Civil Engineering 394K: Topic 3 Geographic Information Systems (GIS) in Water Resources Engineering TERM PROJECT REPORT Reinvestigation of the Halloween Flood and Hydrologic Modeling of the Onion Creek
Civil Engineering 394K: Topic 3 Geographic Information Systems (GIS) in Water Resources Engineering TERM PROJECT REPORT Reinvestigation of the Halloween Flood and Hydrologic Modeling of the Onion Creek
Influence of Terrain on Scaling Laws for River Networks
 Utah State University DigitalCommons@USU All Physics Faculty Publications Physics 11-1-2002 Influence of Terrain on Scaling Laws for River Networks D. A. Vasquez D. H. Smith Boyd F. Edwards Utah State
Delineation of Watersheds
 Delineation of Watersheds Adirondack Park, New York by Introduction Problem Watershed boundaries are increasingly being used in land and water management, separating the direction of water flow such that
Development of GIS Tools to Optimize Identification of Road Segments Prone to Flood Damage
 A Report from the University of Vermont Transportation Research Center Development of GIS Tools to Optimize Identification of Road Segments Prone to Flood Damage Final Report TRC Report 15-005 September
Automatic Watershed Delineation using ArcSWAT/Arc GIS
 Automatic Watershed Delineation using ArcSWAT/Arc GIS By: - Endager G. and Yalelet.F 1. Watershed Delineation This tool allows the user to delineate sub watersheds based on an automatic procedure using
Drainage Area: GL, VPU: 04 - Release Notes. 12/01/2018 Updated and New Data
 Drainage Area: GL, VPU: 04 - Release Notes 12/01/2018 Updated and New Data Time of Travel and Related Attributes: The new and updated data is included in new versions of the NHDPlusAttributes and EROMExtension
A GIS View of Hydrology
 Quantitative Elements of Hydrology A GIS View of Hydrology Contact information: Jack Hermance Environmental Geophysics/Hydrology Department of Geological Sciences Brown University, Providence, RI 02912-1846
Copyright. Hema Gopalan
 Copyright by Hema Gopalan 2003 WRAPHydro Data Model: Finding Input Parameters for the Water Rights Analysis Package by Hema Gopalan, B.E. Thesis Presented to the Faculty of the Graduate School of The University
Delineation of the Watersheds Basin in the Konya City and Modelling by Geographical Information System
 Delineation of the Watersheds Basin in the Konya City and Modelling by Geographical Information System Nahida Hameed Hamza Alqaysi a,b,, Mushtaq Abdulameer Alwan Almuslehi a a Environmental Engineering
Finding the Relationship Between Elevation and Isotopic Compositions of Stream Waters in the Peruvian Andes
 Abstract Finding the Relationship Between Elevation and Isotopic Compositions of Stream Waters in the Peruvian Andes The Peruvian Andes is a prime example of highly-elevated topography generated by oceanic
Elevations are in meters above mean sea level. Scale 1:2000
 12.001 LAB 7: TOPOGRAPHIC MAPS Due: Monday, April 11 PART I: CONTOURING AND PROFILES (20 PTS) 1. Contour this area map using a 5 meter contour interval. Remember some fundamental rules of contour lines,
Terrain and Watershed Analysis. James Frew ESM 263 Winter
 Terrain and Watershed Analysis 1 Digital ElevaBon Model (DEM) raster of elevabons 2 Slope magnitude of gradient tan(slope) = ( ( z/ x) 2 + ( z/ y) 2 ) 1/2 3 Aspect (aka Exposure) direc,on of gradient tan(aspect)
CENTRAL TEXAS HILL COUNTRY FLOOD
 CENTRAL TEXAS HILL COUNTRY FLOOD Term project report DECEMBER 7, 2018 UNIVERSITY OF TEXAS AT AUSTIN CE394K: GIS in Water Resources Engineering RIFAAI Mohamed Talha Table of Contents Introduction... 3 Context...
CATCHMENT AND OVERLAND FLOW PATHWAY DELINEATION USING LIDAR AND GIS GRID BASED APPROACH IN URBAN STORMWATER AND SEWER NETWORK MODELS
 CATCHMENT AND OVERLAND FLOW PATHWAY DELINEATION USING LIDAR AND GIS GRID BASED APPROACH IN URBAN STORMWATER AND SEWER NETWORK MODELS Thomas Joseph (AWT) ABSTRACT This paper presents specific examples comparing
Development and Land Use Change in the Central Potomac River Watershed. Rebecca Posa. GIS for Water Resources, Fall 2014 University of Texas
 Development and Land Use Change in the Central Potomac River Watershed Rebecca Posa GIS for Water Resources, Fall 2014 University of Texas December 5, 2014 Table of Contents I. Introduction and Motivation..4
Geology 101 Lab Worksheet: Topographic Maps
 Geology 101 Lab Worksheet: Topographic Maps Name: Refer to the Topographic Maps Lab for the information you need to complete this worksheet (http://commons.wvc.edu/rdawes/g101ocl/labs/topomapslab.html).
GeoWEPP Tutorial Appendix
 GeoWEPP Tutorial Appendix Chris S. Renschler University at Buffalo - The State University of New York Department of Geography, 116 Wilkeson Quad Buffalo, New York 14261, USA Prepared for use at the WEPP/GeoWEPP
Creating Watersheds from a DEM
 Creating Watersheds from a DEM These instructions enable you to create watersheds of specified area using a good quality Digital Elevation Model (DEM) in ArcGIS 8.1. The modeling is performed in ArcMap
Current and Future Plans. R. Srinivasan
 Current and Future Plans R. Srinivasan Contents 1 The ArcSWAT Interface 2 VizSWAT: Output Visualization 3 User online support 4 MapWindows SWAT interface 5 ArcGIS SWAT/APEX interfaces 6 Radar Rainfall
Determining the Location of the Simav Fault
 Lindsey German May 3, 2012 Determining the Location of the Simav Fault 1. Introduction and Problem Formulation: The issue I will be focusing on involves interpreting the location of the Simav fault in
INTERNATIONAL JOURNAL OF GEOMATICS AND GEOSCIENCES Volume 6, No 1, 2015
 INTERNATIONAL JOURNAL OF GEOMATICS AND GEOSCIENCES Volume 6, No 1, 2015 Copyright by the authors - Licensee IPA- Under Creative Commons license 3.0 Research article ISSN 0976 4380 Sustainable watershed
A Comparison of Manual and Computer-Assisted Drainage Delineation Methods for Hydrologic-Unit Map Development
 This paper was peer-reviewed for scientific content. Pages 1118-1127. In: D.E. Stott, R.H. Mohtar and G.C. Steinhardt (eds). 2001. Sustaining the Global Farm. Selected papers from the 10th International
Hydrologic Engineering Applications of Geographic Information Systems
 Hydrologic Engineering Applications of Geographic Information Systems Davis, California Objectives: The participant will acquire practical knowledge and skills in the application of GIS technologies for
GIS Geographic Information System
 GIS Geographic Information System Andrea Petroselli Tuscia University, Italy petro@unitus.it SUMMARY Part 1: Part 2: Part 3: Part 4: What is a GIS? Why do we need a GIS? Which are the possibilities of
Building a Hydrologic Base Map Prepared by David R. Maidment Waterways Centre for Freshwater Research University of Canterbury
 Building a Hydrologic Base Map Prepared by David R. Maidment Waterways Centre for Freshwater Research University of Canterbury 14 March 2018 Goals of the Exercise This exercise shows how to develop a hydrologic
Remote Sensing and GIS Applications for Hilly Watersheds SUBASHISA DUTTA DEPARTMENT OF CIVIL ENGINEERING IIT GUWAHATI
 Remote Sensing and GIS Applications for Hilly Watersheds SUBASHISA DUTTA DEPARTMENT OF CIVIL ENGINEERING IIT GUWAHATI Deciding Alternative Land Use Options in a Watershed Using GIS Source: Anita Prakash
Assessment of a Rapid Approach for Estimating Catchment Areas for Surface Drainage Lines
 Assessment of a Rapid Approach for Estimating Catchment Areas for Surface Drainage Lines U.S. Geological Survey Center of Excellence for Geospatial Information Science 1400 Independence Road, Rolla Missouri,
Rapid Flood Mapping Using Inundation Libraries
 Rapid Flood Mapping Using Inundation Libraries Jude Kastens, Kevin Dobbs, James Halgren, Katherine Balster 2017 ASFPM Conference May 3, 2017 5 mi Kansas River Valley between Manhattan and Topeka Email:
Recent Advances in Continuum Mechanics, Hydrology and Ecology
 Effect of DEM Type and Resolution in Extraction of Hydro- Geomorphologic Parameters Vahid Nourani 1, Safa Mokhtarian Asl 2 and Maryam Khosravi Sorkhkolaee 3, Elnaz Sharghi 4 1 Associate Prof., 2,3 M.Sc.
Introducing Iowa StreamStats Version 4, a Redesign of the USGS Application for Estimating Streamflow Stats
 Introducing Iowa StreamStats Version 4, a Redesign of the USGS Application for Estimating Streamflow Stats Presented at the 2016 Iowa Water Conference Ames, IA March 24, 2016 by David Eash U.S. Geological
Using GIS to Delineate Watersheds Ed Poyer NRS 509, Fall 2010
 Using GIS to Delineate Watersheds Ed Poyer NRS 509, Fall 2010 A watershed is an area that contributes flow to a point on the landscape. (Bolstad, 2005). Watersheds are an important focus of study because
SUB CATCHMENT AREA DELINEATION BY POUR POINT IN BATU PAHAT DISTRICT
 SUB CATCHMENT AREA DELINEATION BY POUR POINT IN BATU PAHAT DISTRICT Saifullizan Mohd Bukari, Tan Lai Wai &Mustaffa Anjang Ahmad Faculty of Civil Engineering & Environmental University Tun Hussein Onn Malaysia
Land Cover and Soil Properties of the San Marcos Subbasin
 Land Cover and Soil Properties of the San Marcos Subbasin Cody McCann EWRE Graduate Studies December 6, 2012 Table of Contents Project Background............................................................
Welcome to NetMap Portal Tutorial
 Welcome to NetMap Portal Tutorial Potential Applications What Can you do with the Portal? At least 25 things! 1) Locate the best potential fish habitats. 2) Identify biological hotspots. 3) Map floodplain
APPENDIX A. Watershed Delineation and Stream Network Defined from WMS
 APPENDIX A Watershed Delineation and Stream Network Defined from WMS Figure A.1. Subbasins Delineation and Stream Network for Goodwin Creek Watershed APPENDIX B Summary Statistics of Monthly Peak Discharge
What s New in Topographic Information - USGS National Map
 + What s New in Topographic Information - USGS National Map SARGIS Workshop November 14, 2016 Rob Dollison, 703-648-5724 rdollison@usgs.gov + USGS 2 National Geospatial Program The National Geospatial
Hydrography Webinar Series
 Hydrography Webinar Series Session 2 May 21, 2015 U.S. Department of the Interior U.S. Geological Survey U.S. GEOLOGICAL SURVEY HYDROGRAPHY WEBINAR SERIES Hosted by: Jeff Simley Al Rea Hydrography Webinar
Watershed Delineation in GIS Environment Rasheed Saleem Abed Lecturer, Remote Sensing Centre, University of Mosul, Iraq
 Watershed Delineation in GIS Environment Rasheed Saleem Abed Lecturer, Remote Sensing Centre, University of Mosul, Iraq Abstract: The management and protection of watershed areas is a major issue for human
Preparing a NFIE-Geo Database for Travis County
 Preparing a NFIE-Geo Database for Travis County By David R. Maidment Center for Research in Water Resources University of Texas at Austin 2 February 2015 Contents Introduction... 1 Step 1. Download and