Modelling of Potential Tsunami Inundation Limits and Run-Up
|
|
|
- Allison King
- 5 years ago
- Views:
Transcription
1 Water Capital Regional District Modelling of Potential Tsunami Prepared by: AECOM Gorge Road East tel Victoria, BC, Canada V8T 2W fax Project Number: Task ID #400.1 Date: 14 June, 2013
2 Statement of Qualifications and Limitations The attached Report (the Report ) has been prepared by AECOM Canada Ltd. ( Consultant ) for the benefit of the client ( Client ) in accordance with the agreement between Consultant and Client, including the scope of work detailed therein (the Agreement ). The information, data, recommendations and conclusions contained in the Report (collectively, the Information ): is subject to the scope, schedule, and other constraints and limitations in the Agreement and the qualifications contained in the Report (the Limitations ); represents Consultant s professional judgement in light of the Limitations and industry standards for the preparation of similar reports; may be based on information provided to Consultant which has not been independently verified; has not been updated since the date of issuance of the Report and its accuracy is limited to the time period and circumstances in which it was collected, processed, made or issued; must be read as a whole and sections thereof should not be read out of such context; was prepared for the specific purposes described in the Report and the Agreement; and in the case of subsurface, environmental or geotechnical conditions, may be based on limited testing and on the assumption that such conditions are uniform and not variable either geographically or over time. Consultant shall be entitled to rely upon the accuracy and completeness of information that was provided to it and has no obligation to update such information. Consultant accepts no responsibility for any events or circumstances that may have occurred since the date on which the Report was prepared and, in the case of subsurface, environmental or geotechnical conditions, is not responsible for any variability in such conditions, geographically or over time. Consultant agrees that the Report represents its professional judgement as described above and that the Information has been prepared for the specific purpose and use described in the Report and the Agreement, but Consultant makes no other representations, or any guarantees or warranties whatsoever, whether express or implied, with respect to the Report, the Information or any part thereof. Without in any way limiting the generality of the foregoing, any estimates or opinions regarding probable construction costs or construction schedule provided by Consultant represent Consultant s professional judgement in light of its experience and the knowledge and information available to it at the time of preparation. Since Consultant has no control over market or economic conditions, prices for construction labour, equipment or materials or bidding procedures, Consultant, its directors, officers and employees are not able to, nor do they, make any representations, warranties or guarantees whatsoever, whether express or implied, with respect to such estimates or opinions, or their variance from actual construction costs or schedules, and accept no responsibility for any loss or damage arising therefrom or in any way related thereto. Persons relying on such estimates or opinions do so at their own risk. Except (1) as agreed to in writing by Consultant and Client; (2) as required by-law; or (3) to the extent used by governmental reviewing agencies for the purpose of obtaining permits or approvals, the Report and the Information may be used and relied upon only by Client. Consultant accepts no responsibility, and denies any liability whatsoever, to parties other than Client who may obtain access to the Report or the Information for any injury, loss or damage suffered by such parties arising from their use of, reliance upon, or decisions or actions based on the Report or any of the Information ( improper use of the Report ), except to the extent those parties have obtained the prior written consent of Consultant to use and rely upon the Report and the Information. Any injury, loss or damages arising from improper use of the Report shall be borne by the party making such use. AECOM: AECOM Canada Ltd. All Rights Reserved Rpt_CRD_Modelling of PotentialTsunami_InundationLimits_and_Run-Up_MB_Final_14June2013.docx
3 AECOM Gorge Road East tel Victoria, BC, Canada V8T 2W fax 14 June, 2013 Project No: Task ID #400.1 Travis Whiting CRD Protective Services Capital Regional District 625 Fisgard Street Victoria, BC V8W 1R7 Dear Mr. Whiting: Re: Modelling of Potential Tsunami AECOM Canada Ltd. (AECOM) is pleased to submit this FINAL report, Modelling of Potential Tsunami, summarizing the work performed, tsunami modelling results, and suggested next steps related to use of the information and emergency planning. As you are aware, this project has been a collaboration between AECOM and Applied Research International (ARILLC), a sole proprietorship firm of Dr. K.F. Cheung, a professor of Ocean Engineering at University of Hawaii. ARILLC s involvement in this project has been a key to the tsunami modelling and the successful completion of the work. This has been a very interesting, yet complex, project and we are confident that the CRD will find the project deliverables of significant value. Sincerely, AECOM Canada Ltd. Mike Brady, P.Eng. Manager, Victoria Office mike.brady@aecom.com MB/bl Encl. Rpt_CRD_Modelling Of Potentialtsunami_Inundationlimits_And_Run-Up_MB_Final_14June2013.Docx
4 Distribution List # of Hard Copies PDF Required Association / Company Name 1 Travis Whiting, Capital Regional District, CRD Protective Services Revision Log Revision # Revised By Date Issue / Revision Description AECOM Signatures Report Prepared By: M. Brady, P.Eng. (BC) Manager, Victoria Office Report Reviewed By: K. Coulton, P.E. (Ore) Rpt_CRD_Modelling Of Potentialtsunami_Inundationlimits_And_Run-Up_MB_Final_14June2013.Docx
5 Executive Summary This report, Modelling of Potential Tsunami summarizes the work performed and the results of modelling the tsunami impacts along the entire coastline within the Capital Regional District (CRD) that would result from a possible, predicted Cascadia Subduction Zone (CSZ) earthquake occurring off the west coast of Vancouver Island. Cascadia Subduction Zone earthquakes have occurred, on average, every 500 years and the most recent 1-in-500-year earthquake for this zone is thought to have occurred in the year The report was developed to inform the CRD, in relation to Emergency Management, the types of risk and impacts they should consider when developing preparedness and response plans, including evacuation routes based on tsunami risk from this type of event. This study shows predicted tsunami effects resulting from the CSZ earthquake off the west coast of Vancouver Island and does not include potential effects of secondary events, such as landslides or slumps that may occur within the general geographical area surrounding Greater Victoria. The likelihoods of these possible secondary events are unknown and they would need to be the subjects of separate studies of the specific areas taking into account local geotechnical and geological information. The US National Seismic Hazard Maps shows 12 possible combinations of earthquake magnitudes and rupture configuration scenarios that would each represent a 1-in-500-year earthquake. Amongst these, the combination having the highest joint probability, which comprises a magnitude Mw 9.0 and global analog (GA) rupture scenario, was selected as the event to be analyzed. The model used to analyze the tsunami wave generation and their impacts when reaching land was NEOWAVE. It is a model developed by researchers at the University of Hawaii and University of Alaska led by Dr. Kwok Fai Cheung, who was the lead modeller for this project. In 2009, NEOWAVE competed and won against seven other tsunami numerical models and it has been validated against data obtained from a number of recent tsunami events, including the 2011 Tohoku tsunami in Japan. It is the official model for tsunami inundation mapping in Hawaii, American Samoa, and the US Gulf of Mexico coastal states. In order to perform the tsunami modelling, a complete and seamless digital elevation model (DEM) containing both topographic (land) and bathymetric (sea-floor) information was first required. To accurately model the propagation of the tsunami through the Strait of Juan de Fuca the area to be covered included shoreline areas of the entire CRD and, within the USA, the Olympic Peninsula, San Juan Islands and portions of Puget Sound. This whole process required the compilation of data from multiple original sources (sometimes overlapping), having varying accuracies and reliabilities that needed to be resolved. Some of the challenges encountered and overcome included differences in both coordinates and elevations used in Canada and USA; use of differing elevation datums within the various sources; overlapping data providing differing elevations; and shoreline discontinuities, all of which could have had a significant impact on the modelling results. The NEOWAVE model was applied to the DEM in a series of nested grids, with increasing accuracy applied to smaller grid areas as follows: The complete CRD was modelled at a 90-m grid size Esquimalt Harbour, including the area from Albert Head to Clover Point was further modelled at an 18-m grid size; and Victoria Harbour including Inner Harbour, Upper Harbour and Selkirk Waterway was then further modelled at a 9-m grid size. The models were run using the Higher High Water Mean Tide (HHWMT) at Victoria as the base water level, which is approximately m above Mean Water Level (MWL). Modelling results are presented in a series of colourscaled figures or maps showing: Maximum water level this includes, and is not additive to, the HHWMT (i.e. this is not the wave height, which is smaller) Rpt_CRD_Modelling Of Potentialtsunami_Inundationlimits_And_Run-Up_MB_Final_14June2013.Docx
6 Maximum Drawdown of Water - this value is relative to the base water level (HHWMT) Maximum water flow speed similar to the water current Tsunami Arrival Time time to first positive wave Time to Maximum Water Level time that water reaches its maximum (impacted by resonating wave effects) The use of HHWMT (or its US equivalent) as the initial water level is supported by the National Tsunami Hazard Mitigation Program (NTHMP) as a standard. However, the HHWMT is an average of Higher High Tides and there may be tide levels that are higher than this value. As well, the use of the current HHWMT does not include allowances for potential sea level rise due to climate change. It is expected that revision of the initial water beyond HHWMT would increase the Maximum Water Level results by a similar amount; and this has been verified within a range of 2 m variation. Table ES-1 provides a summary of the values referenced above for several selected locations within the CRD. The values in the tables have been inferred from Figures 5.1 through 5.5 the reader is encouraged to refer to the figures for these and any other specific values. Table ES1 Summary of Tsunami Model Results at Selected Locations Location Maximum Water Level (m) Maximum Drawdown of Water (m) Maximum Water Flow Speed (m/s) Tsunami Arrival Time (min) Time to Maximum Water Level (min) Port San Juan (entrance near Port Renfrew) Sooke Harbour (entrance) Esquimalt Harbour (entrance) Victoria Harbour (entrance) Cadboro Bay Sidney As can be seen from the figures in the report, for much of Greater Victoria, the maximum water level is predicted to be less than 3.5 m and the maximum flow speed is predicted to be in the order of 1 m/s, excluding areas with narrows or waterway constrictions. To provide a comparative reference, the 2011 Tohoku tsunami resulted in a maximum water level of 40 m (recorded at a cliff on the Iwate coast) and a maximum water flow speed of approximately 12 m/s (inferred from video images taken in Myagi). Based upon the modelling results, a Tsunami Hazard Line has been prepared for all coastline areas within the CRD. The Tsunami Hazard Line has been developed based upon the model-predicted Maximum Water Level, with consideration for earthquake-induced land subsidence and a Factor for Public Safety, as follows: Maximum water level, plus Land subsidence (since lowering of the ground surface effectively adds to the water level), plus An allowance of 50% added to the total of maximum water level and subsidence. Rpt_CRD_Modelling Of Potentialtsunami_Inundationlimits_And_Run-Up_MB_Final_14June2013.Docx
7 The 50% allowance has been included as a Factor for Public Safety to account for a) uncertainty related to the magnitude of the earthquake event that occurs; b) possible variations in the initial tide condition; and c) variability of the available topographic information. The resulting Tsunami Hazard Line has been created as a layer to be added to CRD s GIS mapping. To further benefit from the model developed and its results, a series of potential next steps has been suggested. These include: Using the results and Tsunami Hazard Line for other emergency considerations, including: Evacuation planning Emergency response planning Infrastructure assessment Transportation planning It should be noted that any infrastructure assessment, for example, should include risk parameters suitable to the infrastructure project and use this report as a baseline of current levels with adjustments made to address all risk factors as required. This report, its data and interpretations made are intended for emergency management personnel and purposes only and the CRD and AECOM are not responsible for interpretations by others for any other purpose. Rpt_CRD_Modelling Of Potentialtsunami_Inundationlimits_And_Run-Up_MB_Final_14June2013.Docx
8 List of Acronyms ARILLC Applied Research International BT Base Transition CD Chart Datum CGVD28 Canadian Geodetic Vertical Datum of 1928 CRD Capital Regional District CSZ Cascadia Subduction Zone CVN US Nuclear Aircraft Carrier DEM Digital Elevation Model ETOPO1 1 Arc-Minute Global Relief Model GA Global Analogs GIS Geographic Information System HHWLT Higher High Water Large Tide HHWMT Higher High Water Mean Tide (MMHW in USA) ISEC Inundation Science and Engineering Cooperative LG EPAC Local Government Emergency Program Advisory Commission LiDAR Light Detection And Ranging LLWLT Lower Low Water, Large Tide (MLLW in the USA) LZ Locked Zone MHHW Mean Highest High Water (HHWLT in Canada) MLLW Mean Lower Low Water (USA - LLWMT in Canada) MSL Mean Sea Level (USA - MWL in Canada) MT Midpoint Transition MWL Mean Water Level (MSL in the USA) NAVD29 North American Vertical Datum 1929 NAVD88 North American Vertical Datum 1988 NAVFAC Naval Facilities Engineering Command NEOWAVE Non-hydrostatic Evolution of Ocean WAVE NOAA National Oceanic and Atmospheric Administration NRC National Research Council NTHMP National Tsunami Hazard Mitigation Program ODOT Oregon Department of Transportation TIN Triangulated Irregular Network UNESCO United Nations Educational, Scientific and Cultural Organization USGS United States Geological Survey UTM Universal Transverse Mercator (Coordinate System) Rpt_CRD_Modelling Of Potentialtsunami_Inundationlimits_And_Run-Up_MB_Final_14June2013.Docx
9 Table of Contents Statement of Qualifications and Limitations Letter of Transmittal Distribution List Executive Summary List of Acronyms page 1. Background Selection of 500-Year Earthquake Scenario Tsunami Model Development of Digital Elevation Model (DEM) Approach Available Data Establishing Vertical and Horizontal Datums U.S and Canadian Vertical Datums Local Tidal Datums Terrestrial and Bathymetric Data Discontinuities Data Integration Shoreline Delineation Build TIN Surface Bare-Earth Topography Summary Tsunami Modelling Results Maximum Water Levels Levels 1 and 2 Grids Level 3 Grid Levels 4 and 5 Grids Water Level Drawdown Tsunami Water Flow Velocities Tsunami Arrival Time Water Level Resonance and Time to Maximum Water Level Tsunami Hazard Line Maximum Water in Conjunction with Subsidence Factor for Public Safety Tsunami Hazard Line Potential Next Steps Summary Potential Next Steps Additional Risk Modelling Evacuation Planning Rpt_CRD_Modelling Of Potentialtsunami_Inundationlimits_And_Run-Up_MB_Final_14June2013.Docx i
10 7.2.3 Emergency Response Planning Infrastructure Design Transportation Planning References List of Figures Figure 2.1 Slip Distribution at the Rupture Plane and Vertical Displacement of the Earth Surface... 3 Figure 2.2 Uplift and Subsidence in metres - near Vancouver Island... 4 Figure 4.1 Datasets Used in the Development of the DEM... 8 Figure 4.2 US and Canadian Bathymetric Data... 9 Figure 4.3 Example of Topo-Bathy Data Overlap Challenges Figure 4.4 Shoreline Challenges including Discontinuities (left) and Missing Islands (right) Figure 4.5 Nested Model Grids with Final Shoreline Figure 4.6 Conversion to Bare-Earth Topography Figure 5.1 Maximum Surface Elevation above MWL Figure 5.2 Maximum Drawdown of Water Level Figure 5.3 Maximum Flow Speed in the Level 3, 4, and 5 grids Figure 5.4 Tsunami Arrival Time Figure 5.5 Time to Peak Water Level After the Earthquake Figure 6.1 Maximum Water Level from MWL Augmented to include Subsidence Figure 6.2 Level 5 Grid Tsunami Hazard Line Figure 6.3 Level 4 Grid Tsunami Hazard Line Figure 6.4 Port Renfrew - Level 3 - Tsunami Hazard Line List of Tables Table ES1 Summary of Tsunami Model Results at Selected Locations...ii Table 2.1 Relative Probability of Rupture Scenarios for a 500-Year Earthquake (from 2008 US National Seismic Hazard Maps)... 2 Table Benchmark Elevation and Water Levels at Victoria Harbour, British Columbia Rpt_CRD_Modelling Of Potentialtsunami_Inundationlimits_And_Run-Up_MB_Final_14June2013.Docx ii
11 1. Background The Capital Regional District (CRD) is located on the southern tip of Vancouver Island adjacent to the Cascadia Subduction Zone (CSZ) that runs from the coast of Northern California to Northern Vancouver Island and separates the Juan de Fuca and North America plates. This zone can produce very large earthquakes with magnitudes of 9.0 or greater which are known as Great Subduction Zone Earthquakes. This type of earthquake poses the largest tsunami threat to the area, and several studies and models have been completed in other areas adjacent to this zone using 9.0 magnitude CSZ earthquake scenarios. The importance of the 9.0 magnitude event was recognized at the project outset and identified as a requirement in the CRD s Request for Proposals. Data from various studies shows a recurrence interval for great earthquakes of between 300 and 700 years with an average return period of 500 years. The last great rupture in 1700 generated a destructive tsunami reaching as far as Japan and reportedly produced extensive geological evidence on the west coast of North America. Despite the uncertainty associated with seismic activities, paleoseismic studies of tsunami deposits, tree rings, and coastal subsidence have established that at least seven great earthquakes might have occurred in the Cascadia Subduction Zone during the last 3500 years. Many residents of the Capital Region live in coastal areas, and the region is also home to many parks and beaches that receive intensive recreational use from both residents and tourists. The combination of the high tsunami hazard, coastal habitation, and intensive recreational use creates the potential for very high tsunami hazard risk levels in the coastal regions in the Capital Region. Previously the CRD had prepared simple mapping for a selected few areas within the region, including Greater Victoria, Saanich Peninsula and Port Renfrew/San Juan River estuary, which were considered to be at higher risk. However, these maps were based upon a single elevation for each area (4 m for Greater Victoria and Saanich Peninsula, and 20 m for Port Renfrew), and, in order to more properly help mitigate risk the CRD wanted tsunami mapping developed that would be based upon a more detailed, scientific approach and would specify potential tsunami inundation limits and run-up elevations. These could then be used for determining evacuation zones and for other emergency planning purposes. Numerical modelling can provide an effective means to assess the impact of a great Cascadia tsunami for hazard mitigation and emergency planning. This report describes: selection of a 500-year earthquake scenario, numerical model used, development of digital elevation model (DEM) covering CRD, computed flow conditions along the CRD coasts, development of a continuous Tsunami Hazard Line, and other outputs and considerations for emergency planning and management. Rpt_CRD_Modelling Of Potentialtsunami_Inundationlimits_And_Run-Up_MB_Final_14June2013.Docx 1
12 2. Selection of 500-Year Earthquake Scenario The Cascadia subduction zone extends 1100 km from Cape Mendocino in northern California to Vancouver Island in British Columbia. The US National Seismic Hazard Maps includes four rupture configurations at moment magnitude Mw 8.8, 9.0, and 9.2, each with a return period of 500 years. Table 2.1 provides the joint probability distribution of the rupture configuration and magnitude in the event of a 500-year earthquake. Each configuration includes the entire locked zone (LZ), but may extend to the midpoint (MT) or the base (BT) of a plastic transition zone. In addition, global analogs (GA) of shallow-dipping subduction zones place the eastern boundary of the rupture at W (near the Pacific coastline of Washington and Oregon states) around a depth of 30 km below the earth surface. In all four configurations, the slip follows a uniform distribution in the locked zone and decreases linearly to zero across the respective transition zone (if present). Table 2.1 Relative Probability of Rupture Scenarios for a 500-Year Earthquake (from 2008 US National Seismic Hazard Maps) Moment Magnitude Mw Rupture Total LZ MT BT GA Total The logic tree in the Pacific Northwest seismic source model assigns the highest occurrence probability of 0.5 to the GA rupture configurations and a total probability of 0.6 to the magnitude of Mw 9.0. In addition, the GA rupture at Mw 9.0 has the highest occurrence probability of 0.3 among the 12 scenarios for tsunami modelling, thus representing the most likely magnitude and rupture for a 500-year earthquake. This then represents the rupture scenario selected for tsunami modelling. Figure 2.1 shows the slip distribution over the rupture area and the vertical displacement of the earth surface. The rupture is modelled by 550 planar faults and the slip distribution is computed from the seismic moment using dyne/cm 2 for the rigidity. The 15.4 m slip in the locked zone is equivalent to 428 years of strain at the current subduction rate of 36 mm/year and is representative of a great Cascadia earthquake that might occur within the next 100 years. Superposition of the planar fault solution provides the earth surface deformation. The rupture produces 6.2 m of uplift along the trench and up to 1.5 m of subsidence (sinking of land level) on the western side of Vancouver Island. Figure 2.2 provides a close-up view of the earth surface deformation around Vancouver Island. The subsidence decreases from approximately 1 m at Port Renfrew to 0.2 m at Victoria. When considering tsunami impacts on ocean water level, subsidence of the land effectively acts to raise the water level due to tsunamis; that is, subsided lands will be more at risk to tsunami inundation than prior to the earthquake and land subsidence. Judging from the uplift and subsidence, the tsunami modelled from the selected earthquake should cover the lower 50 th percentile (half) of the 12 rupture scenarios in terms of the potential tsunami impact. It also produces the best agreement with the extent of 3,500 years of paleotsunami deposits in Siletz Bay, Oregon (Cheung et al., 2011). Rpt_CRD_Modelling Of Potentialtsunami_Inundationlimits_And_Run-Up_MB_Final_14June2013.Docx 2


13 Figure 2.1 Slip Distribution at the Rupture Plane and Vertical Displacement of the Earth Surface Rpt_CRD_Modelling Of Potentialtsunami_Inundationlimits_And_Run-Up_MB_Final_14June2013.Docx 3
 utilized a rupture scenario similar to BT to investigate impacts of tsunami")
14 Figure 2.2 Uplift and Subsidence in metres - near Vancouver Island For comparison, it should be noted that Cherniawsky et al (2007) utilized a rupture scenario similar to BT to investigate impacts of tsunami waves and currents on southern Vancouver Island coasts. They considered 19 m of slip in the locked zone for a 520-year earthquake and admitted their value represents an overestimate for an event that might possibly occur in the immediate future. Rpt_CRD_Modelling Of Potentialtsunami_Inundationlimits_And_Run-Up_MB_Final_14June2013.Docx 4
15 3. Tsunami Model The model selected and used for the tsunami inundation mapping of the Capital Region District is NEOWAVE (Nonhydrostatic Evolution of Ocean WAVE). This is a depth integrated model for wave propagation, transformation, breaking and run-up developed by researchers at University of Hawaii and University of Alaska led by Dr. Cheung, who was the lead modeller for this project. NEOWAVE was entered in the 2009 Benchmark Challenge at the Inundation Science and Engineering Cooperative (ISEC) community workshop sponsored by National Science Foundation. This is the premier workshop in the tsunami inundation modelling community that was held only four times since NEOWAVE correctly reproduced the energetic breaking waves and hydraulic processes over a complex reef system in the Tsunami Wave Basin at Oregon State University and won the competition from the seven numerical models developed in the U.S. and Europe, including: GeoCLAW, Bouss2d, Delft3d, MOST, FUNWAVE, and SELFE. NEOWAVE has been validated against the benchmarks put forth by the National Tsunami Hazard Mitigation Program (NTHMP) and is approved by NOAA for use in tsunami flood hazard mapping for evacuation and planning purposes. It also has been validated against water level and/or run-up data from recent tsunamis generated by the 2009 Samoa Earthquake, the 2010 Mentawai Earthquake, the 2010 Chile Tsunami, and the 2011 Tohoku Tsunami with a wide range of magnitudes from Mw 7.8 to 9.0. Oregon Department of Transportation (ODOT) used NEOWAVE for modelling of 500-year tsunami for probabilistic design of coastal infrastructure in the Pacific Northwest. This study involved investigating tsunami design criteria for four bridges at Siletz Bay, Oregon by utilizing 12 scenarios of the 500 year Cascadia earthquake in the Pacific Northwest seismic source model of the National Seismic Hazard Maps. The model utilized four levels of two way grids with varying resolution to capture bathymetric features of a scale appropriate to the physical processes. NEOWAVE has provided engineering design criteria for CVN (Aircraft Carrier) berthing facilities at Apra Harbor, Naval Facilities Engineering Command (NAVFAC) Guam. It is the official model for tsunami inundation mapping in Hawaii, American Samoa, and the US Gulf coast states. In addition, the UNESCO Inter-government Oceanographic Commission has distributed NEOWAVE to Chile, Peru, Eduardo, Colombia, and Nicaragua for development of tsunami warning guidance and inundation maps. Rpt_CRD_Modelling Of Potentialtsunami_Inundationlimits_And_Run-Up_MB_Final_14June2013.Docx 5
16 4. Development of Digital Elevation Model (DEM) The NTHMP guidelines call for a grid size of 90 m or smaller for inundation mapping. The modelling for this project was performed using five levels of two-way nested grids as follows: Level 1 northeastern Pacific Ocean using 1800 m grid size, Level 2 Juan de Fuca Strait to the continental margin using 450 m grid size, Level 3 entire CRD using 90 m grid size, Level 4 Esquimalt Harbour, including Victoria Harbour, using 18 m grid size, Level 5 Victoria Harbour, using 9 m grid size. The decreasing grid size and area covered reflects an increasing level of detail to be applied to the analysis and results, which at the Level 3, 4, and 5 grids includes computation of inundation and wave run-up on initially dry land. Modelling of tsunami propagation and inundation requires accurate bathymetry across the ocean and high-resolution topography near the coast. Due to there being several sources of information with varying degrees of accuracy, this was not completely the case for the CRD tsunami model. AECOM used topographic and bathymetric data provided by the CRD and public sources to develop a seamless topographic-bathymetric (topo-bathy) Digital Elevation Model (DEM). The DEM forms a single surface that extends from open water up to a specified interior land surface elevation; an interior contour elevation of 10 m CGVD28 was used as the upland cutoff. 4.1 Approach Six important steps in the development of the seamless topo-bathy DEM included: 1. Obtain and review data, 2. Establish a uniform horizontal and vertical reference frame (datum) for all of the various data sets by applying an appropriate datum conversion technique, 3. Prioritize and integrate (e.g., merge) the various data sets together into a single seamless surface, 4. Delineate a zero metre contour shoreline, 5. Build a TIN surface and sample the various model DEM grids from that surface, 6. Provide a bare-earth surface. Each of these steps, along with challenges and hurdles, is described briefly in the following paragraphs. Rpt_CRD_Modelling Of Potentialtsunami_Inundationlimits_And_Run-Up_MB_Final_14June2013.Docx 6
17 4.2 Available Data Data were obtained from many sources and adjustments were made to prepare the data for use. The following summarizes the data, sources, and adjustments, with the colour references indicating the spatial extent of the different datasets as shown in Figure CRD LiDAR (light green with outline) AECOM received 483 text files containing LiDAR data (XYZ format); however, no metadata (e.g., data accuracy, projections, acquisition dates, 1 & 2 classifications) were available and without attribute field matching names on LiDAR files, a conversion had to be run to develop an index file. 2. CRD Mass Points and breaklines (red) AECOM converted these data from a geodatabase format to a 3D shapefile; issues were discovered with some breaklines that were fixed. 3. Canadian NRC DEM (Canadian land area)(orange) AECOM converted these data from 2D shapefiles to 3D shapefiles; a bounding polygon for these data was not provided and had to be created. 4. USGS DEM (US land area)(grey hillshade) AECOM obtained these data from public sources; however, the data had to be reprojected from geographic to UTM coordinates and a bounding polygon had to be created for these data also. 5. CRD Victoria Bathymetric Data (light blue) this information was obtained by CRD from the National Resources Canada, Canadian Hydrographic Service, Pacific Region; AECOM transferred into UTM coordinates and elevations were available as Chart Datum referenced to Victoria Harbour. 6. NOAA Coastal Relief Bathymetry Data (dark blue) available as UTM coordinates but vertical datum did not match with Canadian sources and there is no direct transformation from US to Canadian elevations (see discussion that follows). Several challenges were presented for the direct use of these data including: inconsistent vertical and horizontal datums, lack of bare-earth topography in LIDAR data, terrestrial and bathymetric data discontinuities, and, discontinuous zero metre shoreline delineation. These challenges and resolutions are described in the following sections. 4.3 Establishing Vertical and Horizontal Datums The methodologies selected for creating the seamless topo-bathy DEM required a uniform vertical and horizontal datum to integrate the various datasets into a single seamless surface. AECOM confirmed with the CRD that the vertical datum and units of the CRD data provided are in CGVD 28 (Canadian Geodetic Vertical Datum of 1928) and in metres, and that the horizontal datum and units of the CRD data provided are in UTM Zone 10N and that units are in metres. Rpt_CRD_Modelling Of Potentialtsunami_Inundationlimits_And_Run-Up_MB_Final_14June2013.Docx 7
18 Figure 4.1 Datasets Used in the Development of the DEM U.S and Canadian Vertical Datums Literature searches and discussions with U.S and Canadian government staff indicated merged U.S and Canadian topo-bathy datasets have been compiled only down to a 6 arcsecond level of resolution; however, this project required a 3 arcsecond (90 m) dataset. Therefore, finer resolution datasets were joined together, but vertical datum differences were observed between U.S and Canadian data. Figure 4.2 shows a section across the Strait of Juan de Fuca and a sampling of U.S (blue) and Canadian (red) bathymetric data points within the red circle are shown in the bottom portion of the figure. Inquiries with NOAA on 06/11/12 indicated, there is no direct transformation from CGVD 28 to NAVD 88. In general CGVD 28 is considered about the same as NGVD 29. Therefore AECOM used the NOAA VERTCON tool (National Geodetic Survey, 2013) to estimate that NAVD88 elevations are approximately 1.09 m higher than NGVD29, and by association CGVD28. We also observed that the U.S. data are not always consistently higher in elevation than the Canadian data. However, this difference in bathymetric elevations was deemed insignificant for offshore tsunami wave modelling in strait with 90 m grid and depths greater than 100 m, and the values were used as presented. Rpt_CRD_Modelling Of Potentialtsunami_Inundationlimits_And_Run-Up_MB_Final_14June2013.Docx 8
19 Figure 4.2 US and Canadian Bathymetric Data Rpt_CRD_Modelling Of Potentialtsunami_Inundationlimits_And_Run-Up_MB_Final_14June2013.Docx 9
20 4.3.2 Local Tidal Datums Modelling of tsunami propagation and inundation requires accurate bathymetry across the ocean and high-resolution topography near the coast. The source data includes the ETOPO1 Global Relief Model and Coastal Relief Model at 1 arcmin and 3 arcsec (~1800 and ~90 m) resolution obtained from the US National Geophysical Data Center. AECOM also prepared elevation datasets of the Juan de Fuca Strait, the Greater Victoria area, and Victoria Harbour at 50, 18, and 9 m resolution. While the Global and Coastal Relief Models reference the mean sea level, the AECOM datasets use the chart datum (CD) in Canadian waters that were adjusted in the development of the digital elevation model. Table 4.1 summarizes the benchmark elevation and water levels at Victoria Harbour from the Canadian Hydrographic Services. Contrary to U.S. practice, the water levels in Canada are derived from 19 years of predicted tides. The present sea levels are based on the epoch. The Canadian Chart Datum (CD) target is the Lower Low Water, Large Tide (LLWLT) as opposed to the Mean Lower Low Water (MLLW) used in the US. The AECOM datasets are adjusted uniformly to reference the Mean Water Level (MWL) at Victoria Harbour. This provides a reasonable approximation of the water level along the CRD coasts. However, due to variations in chart datums, the adjustment might not produce representative results for outlying areas such as the San Juan Islands and U.S. land areas in Puget Sound. Table Benchmark Elevation and Water Levels at Victoria Harbour, British Columbia. Reference Elev (m) Referenced to Chart Datum Elev (m) Referenced to Geodetic Datum Benchmark 87C HHWLT (average of annual highest tides) HHWMT (MHHW in US) CGVD MWL (MSL in US) LLWMT (MLLW in US) CD LLWLT (average of annual lowest tides) Bathymetry is usually referenced to the CD, while topography is referenced to the MWL or geodetic datum; however, the MWL and geodetic datum are practically the same at Victoria (difference is m or 8.5 cm). Since the CRD LiDAR elevations are based on the CD, land elevations were reduced by m to align with MWL in the vicinity of Victoria Harbour. This resulted in a potential downward offset of m in the land elevations in the Level 3, 90 m grid areas, depending upon the source of original data. This was considered reasonable for general hazard assessment since it was expected that this offset would not noticeably change tsunami wave heights and, ultimately, maximum water levels. The lack of a significant variation in predicted maximum water levels was confirmed by performing the tsunami modelling using both datums. It is the maximum water level that is later used to derive the Tsunami Hazard Line, which is entirely referenced to the geodetic datum Terrestrial and Bathymetric Data Discontinuities Rpt_CRD_Modelling Of Potentialtsunami_Inundationlimits_And_Run-Up_MB_Final_14June2013.Docx 10

21 As the datasets were converted to a common vertical and horizontal datum, it was observed that the CRD terrestrial LiDAR data overlapped with the Canadian NRC DEM bathymetric data. As a result, LiDAR data created an unnatural shelf (Figure 4.3) because the water surface at the time of flight was captured in the LIDAR data, showing a flat surface at approximately 2 m elevation for all ocean areas. Because the LiDAR was considered to be most accurate and therefore assigned a higher priority in terms of which data could be relied upon at which locations, the unnatural flat surface or shelf resulted in erroneous data that would significantly impact the shoreline effects of the tsunami model. To correct this a zero metre elevation shoreline was used to trim the LiDAR terrain data back and allow the merged bathymetric data to take priority in those areas, as approximated by the red dashed line in Figure 4.3. Figure 4.3 Example of Topo-Bathy Data Overlap Challenges 4.4 Data Integration Integrating all of the various survey data was a significant and major step in developing the seamless topo-bathy DEM. Data integration consisted of combining or merging data sets into a single, continuous surface. Figure 4.1 shown earlier, shows how the various datasets were merged with the prioritized data on top of other data; the following data were used in prioritized order: 1. CRD LiDAR Light Green with Outline 2. CRD Mass Points and breaklines Red 3. Canadian NRC DEM (Canadian SIDE) Orange 4. CRD Victoria Bathymetric Data Light Blue 5. NOAA Coastal Relief Bathymetric Data Dark Blue Rpt_CRD_Modelling Of Potentialtsunami_Inundationlimits_And_Run-Up_MB_Final_14June2013.Docx 11
22 4.5 Shoreline Delineation As noted, the delineation of a shoreline, defined as the zero metre contour, was intended to be used to clip back the LiDAR data to prevent the erroneous points reflected back from the water surface from being used in the final DEM. However, on the zero metre contour made available to AECOM as a shapefile from the CRD, the shoreline was discontinuous along the coast (Figure 4.4- left) and some islands were not included in the zero metre contour (Figure right). Figure 4.4 Shoreline Challenges including Discontinuities (left) and Missing Islands (right) At the request of the CRD, AECOM completed the process of establishing the zero metre contour in the areas with LiDAR, including: closing all gaps in the CRD coastline; adding the river at Port Renfrew; extending the Inner Harbour; and, adding large islands that were not previously included in the CRD DEM. Figure 4.4 (right) shows an example of a large missing island (missing from the shoreline file) and this was digitized where LiDAR data exist; i.e., the green areas. Islands were included where they are larger than approximately 270 m (or three 90-m Level 3 DEM grid cells); e.g., as a rule of thumb, islands that are smaller than about 3 times the grid size can be omitted from the tsunami model grid. Once the LiDAR topography was separated from the bathymetry using the zero metre contour in the areas with LiDAR, the continuous zero metre shoreline was used to separate bathymetry from topography in the areas with mass-points/breaklines. The shoreline for the mass-points and breaklines data is over 65,000 m in length. 4.6 Build TIN Surface Then the CRD and USGS DEMs were clipped to the new shoreline and the more dense bathymetric data in the new 9 m and 18 m grids were added, prioritizing it into the CRD and NOAA bathymetric data, and removing all the bathymetric data that has topographic data on top. At this point the TIN surface was built using an automated computer process from which the various grid sizes of the DEM were sampled. Due to the large amount of data involved this process required the use of four very powerful micro-computers calculating continuously for approximately two weeks. Rpt_CRD_Modelling Of Potentialtsunami_Inundationlimits_And_Run-Up_MB_Final_14June2013.Docx 12
23 AECOM Capital Regional District Modelling of Potential Tsunami Figure 4.5 provides a screenshot of the resulting DEM including the 9 m grid (red border), 18 m grid (black border), within the 50 m grid and with the shoreline shown for reference. Figure 4.5 Nested Model Grids with Final Shoreline Rpt_CRD_Modelling Of Potentialtsunami_Inundationlimits_And_Run-Up_MB_Final_14June2013.Docx 13
24 4.7 Bare-Earth Topography The final step in the processing of land-side topographic data was to prepare the DEM for bare-earth topography. In the original data, buildings and vegetation from LiDAR surveys were visible in the LIDAR datasets. Since tsunami models treat buildings and vegetation as solid blocks, their inclusion would artificially reflect incoming waves and unduly restrict flows. With permission from CRD, buildings and vegetation were filtered out from the DEM. The algorithm systematically replaced building and canopy elevations by those of adjacent roadways and open areas. Figure 4.6 shows the unfiltered (left panel) and filtered (right panel) land surface for inundation modelling in the Greater Victoria area. A comparison with the original data shows minimal effects of the filtering algorithm on the topography. The use of bare-earth topography is consistent with, and recommended by, the NTHMP Modeling and Mapping Guidelines. Figure 4.6 Conversion to Bare-Earth Topography Rpt_CRD_Modelling Of Potentialtsunami_Inundationlimits_And_Run-Up_MB_Final_14June2013.Docx 14
25 4.8 Summary The preceding pages summarize what proved to be an extensive and, at times, labour-intensive process. However, the effort required to provide a continuous coastline and seamless topographic-bathymetric DEM was essential for the tsunami modelling, to provide accurate and realistic results. The process of assembling the DEM is never simple, and it is inevitable that inconsistencies will exist. Although establishing a uniform reference frame will reduce the error in the final DEM, it will not eliminate all data mismatches in the merged data set. Additional potential sources of errors stem from differences in the collection date, as the morphology and topology of the area is likely to change over time, particularly in dynamic coastal systems, and after extreme events such as floods. Having stated that, it should also be noted that the assembled continuous, seamless dataset is much better information than the CRD possessed prior to this assignment and effort. Its existence now creates other opportunities for the CRD (and possibly, its member municipalities and stakeholders) to undertake other investigations and reviews or, simply, related to mapping purposes near the coasts. However, it should be noted that the DEM still relies on some old topography (NRC DEM) for a large portion of the region outside of the Level 4 (18 m) and level 5 (9 m) grid areas, and that the original source(s) of this information are often unknown. Rpt_CRD_Modelling Of Potentialtsunami_Inundationlimits_And_Run-Up_MB_Final_14June2013.Docx 15
26 5. Tsunami Modelling Results 5.1 Maximum Water Levels The NEOWAVE model was run for 8 hours of event time to capture potential resonance over the continental margin and in the Strait of Juan de Fuca. The computation was performed using the base water level of Higher High Water Mean Tide (HHWMT). Figure 5.1 shows the maximum surface elevation from the five levels of nested grids. The maximum surface elevation references the MWL and thus includes m of tides corresponding to the HHWMT, i.e., maximum water level is not the wave height, which is smaller. While subsidence will also have an impact, it acts to lower the land elevation, making subsided land more at risk to tsunami impacts; however, it does not change the water level calculations, so that the water-level definitions, such as MWL and HHWMT, remain unchanged by the earth surface deformation Levels 1 and 2 Grids The tsunami transforms over the continental shelf and maximum water levels reach 6 to 9 m elevation along the open coast of western Vancouver Island modelled at 15 arcsec (~450 m) resolution. After subtracting the tide level, the coastal wave amplitude is consistent with the 5 m of run-up inferred by Clague et al. (2000) from the spatial distribution of the deposits of the 1700 Cascadia tsunami. Although the run-up would be higher at heads of inlets and embayment, the agreement of the results along the open coasts of Vancouver Island renders additional support for the selection of the GA rupture scenario for the tsunami hazard assessment Level 3 Grid The Level 3 results provide a reasonable depiction of the water level along open coasts, but might underestimate the run-up at inlets and waterways not resolvable at the 90 m grid. The model shows rapid attenuation of the energy as the tsunami enters the Strait of Juan de Fuca. The maximum water level reduces from 3.1 m at Port Renfrew to approximately 2.4 m at Victoria. The maximum water level continues at 2.2 m along the relatively sheltered Saanich Peninsula coast because of local shoaling. Similarly, the water level builds up to over 3 m on either side of the Strait of Juan de Fuca with shallow water along the coast. An exception is at Race Rocks, where the shoals and outcrops accelerate the flow and lower the water surface locally. The model captures the build-up of the water level at Sooke Inlet and the formation of a weir at the entrance to Sooke Basin, where the water level is discontinuous. As the tsunami exits the Strait of Juan de Fuca and enters the Strait of Georgia, its amplitude decreases to less than 1 m along the coasts. The lack of energetic wave activities provides an explanation for the absence of tsunami deposits in the region as reported by Clague et al. (2000). Rpt_CRD_Modelling Of Potentialtsunami_Inundationlimits_And_Run-Up_MB_Final_14June2013.Docx 16


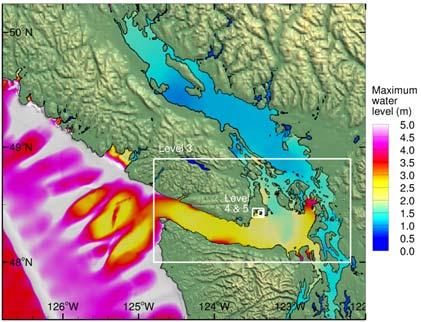
27 Figure 5.1 Maximum Surface Elevation above MWL Rpt_CRD_Modelling Of Potentialtsunami_Inundationlimits_And_Run-Up_MB_Final_14June2013.Docx 17
28 5.1.3 Levels 4 and 5 Grids The Level 4 to 5 grids provide detailed flow conditions in the Esquimalt Harbour and Victoria Harbour areas that cannot be resolved by the 90 m grid at Level 3. The computed maximum water levels, which are consistent with those from Cherniawsky et al. (2007), do not show widespread inundation in these areas. The tsunami overtops the barrier of Esquimalt Lagoon, where the water level increases to 2.3 m, and there are resonance effects in Esquimalt Harbour, so that the surge at the head of the embayment reaches 4.3 m above MWL. The water level increases from 2.5 m at Victoria Harbour to 3.1 m in Gorge Waterway with minor inundation at pockets of low-lying areas. Weirs are formed at a couple of locations along the waterway, where the flow is discontinuous. The tsunami does not overtop the cruise ship terminals and the harbour promenade areas, which have a pre-rupture elevation of about 3 m above the MWL. For comparison, the maximum water level associated with the 2011 Tohoku tsunami was approximately 40 m measured at a cliff on the Iwate coast. 5.2 Water Level Drawdown Along with potential flooding and inundation there are also effects due to water levels dropping during the complete tsunami cycle. The drawdown in harbours and waterways during a tsunami may ground vessels and damage berthing facilities. Figure 5.2 shows the computed drawdown from the initial still water level in the level 3 to 5 grids. Although the computation was performed at HHWMT, the results provide an indication of navigational hazards should a tsunami occur at a lower tide level. The drawdown is much smaller than the wave amplitude along the Strait of Juan de Fuca, but increases dramatically over shallow shoals and embayments. Port Renfrew experiences up to 1.4 m of drawdown. The value increases from 1.2 m at the Esquimalt Harbour entrance to 2.0 m at the head of the embayment in association with the first mode of resonance oscillation. Victoria Harbour, which is less prone to resonance because of its irregular geometry, experiences relatively uniform drawdown of 1.1 m extending through most of the Inner Harbour, Upper Harbour, and Gorge Waterway. Rpt_CRD_Modelling Of Potentialtsunami_Inundationlimits_And_Run-Up_MB_Final_14June2013.Docx 18

29 AECOM Capital Regional District Modelling of Potential Tsunami Figure 5.2 Maximum Drawdown of Water Level Rpt_CRD_Modelling Of Potentialtsunami_Inundationlimits_And_Run-Up_MB_Final_14June2013.Docx 19
30 5.3 Tsunami Water Flow Velocities Tsunamis can generate damaging flow velocity conditions (similar to water currents) in harbours and waterways even when there is only nominal inundation on land. NEOWAVE is the only NTHMP-approved model that has been validated with measurements of coastal currents generated by a tsunami (Yamazaki et al., 2012b). Figure 5.3 plots the maximum water flow speed in the Level 3, 4, and 5 grids. The Level 3 grid at 90 m resolution provides a reasonable depiction of the currents over large coastal features. The current in the Strait of Juan de Fuca is typically less than 1 m/s, but increases to over 2 m/s in inlets and waterways. High flow speeds of 2.7 and 2.4 m/s develop at Port Renfrew and Sooke. The jet into Sooke Basin is reasonably determined and depicted. Further east, the model captures the flow speed increase 3.1 m/s at Race Rocks, where the tidal currents are known to generate strong eddies. Tolkova (2012) indicated that a tsunami in a strong tidal river can be amplified when propagating into the ebb flow after a high tide. However, recent studies by Tolkova (personal communication) showed that the nonlinear tide-tsunami interaction is almost negligible in the Strait of Juan de Fuca The Level 4 grid at 18-m resolution provides the water flow speed at more refined coastal features. The model depicts the inflow and outflow jets at Witty s Lagoon near Albert Head as well as high speed flows over the barrier and at the inlet of Esquimalt Lagoon. The flow speed increases to 3.2 m/s at the entrance to Esquimalt Harbour, where a node is developed from the standing wave. Local acceleration of the flow is evident in the upper reach of the basin, where small islands and outcrops produce constrictions of the flow. The level 5 grid provides detailed water flow conditions at 9-m resolution in Victoria Harbour and Gorge Waterway. The inner and outer harbours show strong outflow jets reaching 3.4 and 3.1 m/s due to ponding of floodwater in the upper reach of Gorge Waterway and rapid withdrawal of the tsunami in Victoria Harbour after the initial wave. The high-speed water flow from the tsunami could conceivably damage dock facilities and generate debris in the downstream region. The flow might also erode channels and inlets that in turn might modify the flood conditions computed from the current (fixed-bed) model. The impacts of these possible changes is unknown. For comparison, the maximum water flow velocity associated with the 2011 Tohoku tsunami was approximately 12 m/s, as inferred from video images taken in Myagi. Rpt_CRD_Modelling Of Potentialtsunami_Inundationlimits_And_Run-Up_MB_Final_14June2013.Docx 20
31 AECOM Capital Regional District Modelling of Potential Tsunami Figure 5.3 Maximum Flow Speed in the Level 3, 4, and 5 grids Rpt_CRD_Modelling Of Potentialtsunami_Inundationlimits_And_Run-Up_MB_Final_14June2013.Docx 21
32 5.4 Tsunami Arrival Time Tsunami arrival time is an important consideration in emergency planning and management. Because of greater subsidence over the continental shelf, the water in the Strait of Juan de Fuca will retreat to the Pacific Ocean immediately after the rupture. Part of the initial wave generated by uplift of the continental slope will propagate toward the coastlines. Tsunamis are shallow-water waves, whose propagation speed given by, where = 9.81 m/s 2 is acceleration due to gravity and d is the local water depth. Figure 5.4 shows the time when the water surface rises above the initially subsided water level. The tsunami arrives at Port Renfrew in 45 min after the earthquake. Sooke sees the arrival of the initial positive wave 60 min after the earthquake. The wave reaches the entrances of Esquimalt Harbour and Victoria Harbour 76 min after the earthquake, while the formation of weirs delays the arrival of the flood waves along Gorge Waterway even further. Because of the shallow coastal water, the wave does not reach Sidney on the Saanich Peninsula coast until 110 min after the earthquake. Rpt_CRD_Modelling Of Potentialtsunami_Inundationlimits_And_Run-Up_MB_Final_14June2013.Docx 22
33 AECOM Capital Regional District Modelling of Potential Tsunami Figure 5.4 Tsunami Arrival Time Rpt_CRD_Modelling Of Potentialtsunami_Inundationlimits_And_Run-Up_MB_Final_14June2013.Docx 23
34 5.5 Water Level Resonance and Time to Maximum Water Level The continental shelves, straits, and embayments in southern Vancouver Island are prone to resonance caused by tsunamis. Constructive interferences from resonance modes have resulted in late arrivals of destructive waves in previous tsunami events. Figure 5.5 plots the time to reach the peak water levels after the earthquake. The initial wave crest determines the peak water level at most locations along the Strait of Juan de Fuca. The water level at Port Renfrew reaches its peak in 60 min, however, the water at the head of the embayment takes another 60 min to reach the peak level. Similar, the peak flow reaches the Sooke channel in 80 min, but it takes another 60 min to fill the Sooke basin to the maximum level. This highlights the fact that a tsunami comprises a series of waves and subsequent arrivals might augment the amplitude of resonance oscillations. The waters off Esquimalt and Victoria Harbours rise to the peak level in 95 min after the earthquake. The peak flow enters Victoria Harbour and the lower reach of Gorge Waterway almost instantaneously. In contrast, the resonance oscillation in Esquimalt Harbour reaches its peak 60 min later. Resonance and persistent wave activities occur around the Gulf Islands, so that the Saanich Peninsula coast does not see the peak flow until 166 min after the earthquake. The Strait of Georgia, which resonates with the longer period waves, does not exhibit the peak surface elevation for at least another 100 min. Coastal resonance is a common occurrence during tsunami events. Standing edge waves formed along the continental margin have low dissipation rates and continue to send waves into the Strait of Juan de Fuca long after the rupture. Because of the semi-enclosed basin, the oscillations in the Strait of Juan de Fuca and Strait of Georgia might take many hours to subside. From an emergency management perspective, it will be important to maintain the tsunami warning until the water level shows an obvious downward trend. Rpt_CRD_Modelling Of Potentialtsunami_Inundationlimits_And_Run-Up_MB_Final_14June2013.Docx 24

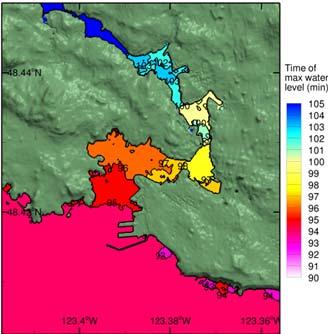
35 Figure 5.5 Time to Peak Water Level After the Earthquake Rpt_CRD_Modelling Of Potentialtsunami_Inundationlimits_And_Run-Up_MB_Final_14June2013.Docx 25
36 6. Tsunami Hazard Line 6.1 Maximum Water in Conjunction with Subsidence The tsunami model defines the time sequence of the event from the subsidence and uplift of the earth surface at the time of the magnitude 9.0 CSZ earthquake to propagation of the tsunami through the Straits of Juan de Fuca and Georgia. Maximum water levels and time to maximum water levels were identified in the previous section. Flood depths overland can demonstrate the risk of flooding for various CRD communities, industrial areas, waterfront facilities, critical facilities, and highway infrastructure. Subsidence lowers the land elevation after the earthquake and exacerbates the subsequent flood hazards. Subsidence levels within the CRD were shown earlier in the discussion of the selection of the earthquake scenario, and vary from approximately 1.0 m near Port Renfrew to approximately 0.2 m near Greater Victoria. Although the model already includes the earth surface deformation in the initial condition, presentation of the resulting water surface elevation relative to the subsided ground level provides a better indication of the tsunami flood hazard. Figure 6.1 shows the maximum surface elevation augmented to include subsidence. Using this approach the determined flood level, which increases approximately by 1.0 m at Port Renfrew and 0.2 m at Greater Victoria, can be compared directly with the pre-event land surface elevation from the MWL for purposes of emergency planning and management. 6.2 Factor for Public Safety As noted above, mapping has been prepared for all coastline locations within the CRD showing the combined impact of both water level rise due to tsunami and subsidence of the land mass. Both of these parameters vary across the region, so application of a single factor or total elevation is not appropriate. To account for some of the variability of the input information AECOM also recommends that a Factor for Public Safety be included in the resulting calculations to determine the continuous Tsunami Hazard Line. Some of the variables that could impact the calculated results include: Uncertainty related to the magnitude event and the initial tsunami wave amplitude While the earthquake event selected is the most likely event, other scenarios could result in higher initial tsunami wave amplitudes and higher maximum water levels within the CRD Tide variations The base water level to which the tsunami wave amplitude has been added in this analysis is HHWMT (or MHHW in the US) While this is supported and recommended by NTHMP, the tsunami could occur at another higher water condition Variablility of topographic information While topographic information at the Level 4 and 5 grids is considered to have a high degree of accuracy, much of the topographic information for the CRD total coastline is of varying quality and the original source of the information is unknown. Rpt_CRD_Modelling Of Potentialtsunami_Inundationlimits_And_Run-Up_MB_Final_14June2013.Docx 26
37 AECOM Capital Regional District Modelling of Potential Tsunami Figure 6.1 Maximum Water Level from MWL Augmented to include Subsidence Rpt_CRD_Modelling Of Potentialtsunami_Inundationlimits_And_Run-Up_MB_Final_14June2013.Docx 27
38 For these reasons AECOM is recommending that a Factor for Public Safety of 50% be added to the calculated combination of maximum water level rise and land subsidence (fall), and that the resulting maximum elevation be applied as the Tsunami Hazard Line. As examples of how this would be applied, the following sample locations are discussed: Using the Level 3 90 m grid: Port Renfrew is predicted to see a Maximum Water Level of 3 m, Subsidence is predicted to be approximately 1 m, The calculated total water level relative to the original coastline at Mean Water Level (MWL) is then 4 m, Apply a 50% factor for public safety, resulting in a Tsunami Hazard Line located at the 6 m current elevation based upon topographic information. Using the Level 5 9 m grid: McLoughlin Point is predicted to see a Maximum Water Level of 2.5 m, Subsidence is predicted to be approximately 0.15 m, The calculated total water level relative to the original coastline at MWL is 2.65 m, Apply a 50% factor for public safety, resulting in a Tsunami Hazard Line located at the 4.0 m current elevation. 6.3 Tsunami Hazard Line Applying the above approach to all CRD coastline locations results in a completed Tsunami Hazard Line throughout the CRD and is a product of this study that has been provided to the CRD to be incorporated into its GIS mapping layers. Figures 6.2 through 6.4 show several samples of the Tsunami Hazard Line superimposed on the land topography, showing: Victoria Harbour, including Inner Harbour, Upper Harbour and Gorge Waterway (using the Level 5 grid information) Esquimalt Harbour, showing the area from Albert Head past Victoria Harbour to Clover Point (using the Level 4 grid) Port Renfrew, including the San Juan River estuary (using the Level 3 grid) Each of these examples can be compared with previous Tsunami Inundation mapping prepared for the CRD but which was based upon a single elevation for each of Greater Victoria (4 m), Saanich Peninsula (4 m) and Port Renfrew (20 m). We would expect to see general concurrence between the mapping for Greater Victoria and Saanich Peninsula since the elevation previously chosen is similar to the calculated elevations used for the Tsunami Hazard Line in these areas. However there are differences expected as well due to the dynamic nature of this Tsunami modelling exercise and the higher precision now being applied to the data and final determined elevation. The differences for Port Renfrew should appear significant since the NEOWAVE model has determined an overall lower total elevation (6 m) for the combination of maximum water level and subsidence, along with addition of a 50% factor for public safety, than that used for the previous mapping (20 m). Rpt_CRD_Modelling Of Potentialtsunami_Inundationlimits_And_Run-Up_MB_Final_14June2013.Docx 28


39 Figure 6.2 Level 5 Grid Tsunami Hazard Line Rpt_CRD_Modelling Of Potentialtsunami_Inundationlimits_And_Run-Up_MB_Final_14June2013.Docx 29
40 Figure 6.3 Level 4 Grid Tsunami Hazard Line Rpt_CRD_Modelling Of Potentialtsunami_Inundationlimits_And_Run-Up_MB_Final_14June2013.Docx 30


41 Figure 6.4 Port Renfrew - Level 3 - Tsunami Hazard Line Rpt_CRD_Modelling Of Potentialtsunami_Inundationlimits_And_Run-Up_MB_Final_14June2013.Docx 31
REPORT TO THE PLANNING, TRANSPORTATION AND PROTECTIVE SERVICES COMMITTEE MEETING OF JUNE 26, 2013
 PPS/PS 2013-07 REPORT TO THE PLANNING, TRANSPORTATION AND PROTECTIVE SERVICES COMMITTEE MEETING OF JUNE 26, 2013 SUBJECT UPDATES TO THE CAPITAL REGIONAL DISTRICT MODELLING OF POTENTIAL TSUNAMI INUNDATION
What is a tsunami? Capital Regional District Tsunami Frequently Asked Questions (FAQ s) Tsunami (soo-nah-mee)
 Tsunami (soo-nah-mee)") Tsunami (soo-nah-mee) Tsunamis (Japanese translation harbour wave ) are waves with a great distance between crests, and are caused by any widespread, sudden movement of large volumes of water. The tsunami
Tsunami (soo-nah-mee) Tsunamis (Japanese translation harbour wave ) are waves with a great distance between crests, and are caused by any widespread, sudden movement of large volumes of water. The tsunami
Coastal Sea Level Rise Risk Assessment
 Attachment 1 to Appendix A Capital Regional District Coastal Sea Level Rise Risk Assessment Prepared by: AECOM 200 415 Gorge Road East Victoria, BC, Canada V8T 2W1 www.aecom.com January 2015 Statement
Cascadia Seismic Event Planning for the Maritime Community
 Cascadia Seismic Event Planning for the Maritime Community Jonathan Allan, Oregon Dept. of Geology and Mineral Industries Presentation to Annual Pacific Northwest Waterways Association Meeting (PNWA) October
Wainui Beach Management Strategy (WBMS) Summary of Existing Documents. GNS Tsunami Reports
 Summary of Existing Documents. GNS Tsunami Reports") Wainui Beach Management Strategy (WBMS) Summary of Existing Documents GNS Tsunami Reports a) Review of Tsunami Hazard and Risk in New Zealand ( National Risk Report ) b) Review of New Zealand s Preparedness
Wainui Beach Management Strategy (WBMS) Summary of Existing Documents GNS Tsunami Reports a) Review of Tsunami Hazard and Risk in New Zealand ( National Risk Report ) b) Review of New Zealand s Preparedness
Bathymetry Data and Models: Best Practices
 Bathymetry Data and Models: Best Practices Barry Eakins & Lisa Taylor The NOAA National Geophysical Data Center Over 600 data types - from the core of the Earth to the surface of the Sun NGDC Bathymetry
Digital Elevation Model of Tutuila, American Samoa: Procedures, Data Sources, and Analysis
 Digital Elevation Model of Tutuila, American Samoa: Procedures, Data Sources, and Analysis Prepared for the National Tsunami Hazard Mitigation Program (NTHMP) by the NOAA National Geophysical Data Center
Predicting tsunami waves and currents on the West Coast of Canada: A case study for Ucluelet, BC
 Predicting tsunami waves and currents on the West Coast of Canada: A case study for Ucluelet, BC Josef Cherniawsky, Kelin Wang and Roy Walters Institute of Ocean Sciences, Fisheries & Oceans Canada Pacific
Tsunami Inundation Modelling for Bay of Plenty - Executive Summary March 2013
 Tsunami Inundation Modelling for Bay of Plenty - Executive Summary March 2013 1 Inundation Modelling for the Bay of Plenty Executive Summary Tsunami Inundation Modelling for Bay of Plenty - Executive
MRD 207 METADATA DETAIL PAGE
 MRD 207 METADATA DETAIL PAGE The following represents the Basic description of an information holding. To obtain more information about this holding, see the section named Contacts. GENERAL INFORMATION
Design and Implementation of a NOAA/NOS Cook Inlet and Shelikof Straits Circulation Modeling System
 Design and Implementation of a NOAA/NOS Cook Inlet and Shelikof Straits Circulation Modeling System Presented at a NOAA/AEA Stakeholders Meeting, August 24, 2011, Anchorage Alaska Richard Patchen and Lyon
Preliminary Data Release for the Humboldt Bay Sea Level Rise Vulnerability Assessment: Humboldt Bay Sea Level Rise Inundation Mapping
 Preliminary Data Release for the Humboldt Bay Sea Level Rise Vulnerability Assessment: Humboldt Bay Sea Level Rise Inundation Mapping Prepared by: Jeff Anderson, Northern Hydrology & Engineering (jeff@northernhydrology.com)
4. Regions Northland Region Distant Eastern source: South America (Chile/Peru)
") 4. Regions Maximum water surface elevation images are presented below for tsunamis generated from the sources discussed above; Distant Eastern source: South America (Chile/Peru), Regional Eastern source:
4. Regions Maximum water surface elevation images are presented below for tsunamis generated from the sources discussed above; Distant Eastern source: South America (Chile/Peru), Regional Eastern source:
Guidelines for Site-Specific Seismic Hazard Reports for Essential and Hazardous Facilities and Major and Special-Occupancy Structures in Oregon
 Guidelines for Site-Specific Seismic Hazard Reports for Essential and Hazardous Facilities and Major and Special-Occupancy Structures in Oregon By the Oregon Board of Geologist Examiners and the Oregon
DRAFT - Tsunami Response Plan Playbook Santa Cruz Harbor Maritime Community
 DRAFT - Tsunami Response Plan Playbook Santa Cruz Harbor Maritime Community Page 1 Best to display on 11X17 paper Purpose and Use of this Real-time Tsunami Response Plan Playbook PURPOSE: This product
Modeling of the 2011 Tohoku-oki. oki Tsunami and it s s impacts to Hawaii
 WAVES 11, KONA HAWAI`I Modeling of the 2011 Tohoku-oki oki Tsunami and it s s impacts to Hawaii Yoshiki Yamazaki 1, Volker Roeber 1, Kwok Fai Cheung 1 and Thorne Lay 2 1 Department of Ocean and Resources
Characterization of the Nigerian Shoreline using Publicly-Available Satellite Imagery
 University of New Hampshire University of New Hampshire Scholars' Repository Center for Coastal and Ocean Mapping Center for Coastal and Ocean Mapping 1-2014 Characterization of the Nigerian Shoreline
Scientific Research on the Cascadia Subduction Zone that Will Help Improve Seismic Hazard Maps, Building Codes, and Other Risk-Mitigation Measures
 Scientific Research on the Cascadia Subduction Zone that Will Help Improve Seismic Hazard Maps, Building Codes, and Other Risk-Mitigation Measures Art Frankel U.S. Geological Survey Seattle, WA GeoPrisms-Earthscope
RECENT COMPREHENSIVE TSUNAMI MODELING FOR COASTAL OREGON
 RECENT COMPREHENSIVE TSUNAMI MODELING FOR COASTAL OREGON Speaker: George R. Priest, Oregon Dept. of Geology and Mineral Industries Pardee Keynote Symposium Great Earthquakes, the Cascadia Subduction Zone,
NOISE IMPACT ASSESSMENT 114 ISABELLA STREET RESIDENTIAL DEVELOPMENT OTTAWA, ONTARIO
 Smart Property Advisors Ltd. 802-500 Laurier Avenue West Ottawa, ON NOISE IMPACT ASSESSMENT 114 ISABELLA STREET RESIDENTIAL DEVELOPMENT OTTAWA, ONTARIO Prepared by: SMART PROPERTY ADVISORS LTD. 802 500
MISSOURI LiDAR Stakeholders Meeting
 MISSOURI LiDAR Stakeholders Meeting East-West Gateway June 18, 2010 Tim Haithcoat Missouri GIO Enhanced Elevation Data What s different about it? Business requirements are changing.fast New data collection
Riskscape module Documentation: Inundation Modelling in Bay of Plenty. X. Wang C. Mueller
 Riskscape module Documentation: Inundation Modelling in Bay of Plenty X. Wang C. Mueller CONTENTS 1.0 GENERAL INFORMATION... 2 1.1 SITE OF STUDY... 5 1.2 SOURCE SCENARIOS... 5 1.3 NUMERICAL MODEL... 5
Submitted to. Prepared by
 Prepared by Tim Webster, PhD Candace MacDonald Applied Geomatics Research Group NSCC, Middleton Tel. 902 825 5475 email: tim.webster@nscc.ca Submitted to Harold MacNeil Engineering Manager Halifax Water
2. Tsunami Source Details
 2. Tsunami Source Details The Northland area faces a range of potential tsunamigenic sources that include several local and distant fault systems and underwater landslides. A NIWA study (Goff et al. 2006)
Indian Ocean Tsunami Warning System: Example from the 12 th September 2007 Tsunami
 Indian Ocean Tsunami Warning System: Example from the 12 th September 2007 Tsunami Charitha Pattiaratchi 1 Professor of Coastal Oceanography, The University of Western Australia Email: chari.pattiaratchi@uwa.edu.au
Downtown Anchorage Seismic Risk Assessment & Land Use Regulations to Mitigate Seismic Risk
 Prepared for: The Municipality of Anchorage Planning Department and the Geotechnical Advisory Commission Downtown Anchorage Seismic Risk Assessment & Land Use Regulations to Mitigate Seismic Risk Prepared
Positioning the Pacific: NOAA s Geospatial Activities. Juliana Blackwell, Director NOAA s National Geodetic Survey March 6, 2012
 Positioning the Pacific: NOAA s Geospatial Activities Juliana Blackwell, Director NOAA s National Geodetic Survey March 6, 2012 A Common Problem of the Early 19 th Century 1807 President Thomas Jefferson
AGGREGATE RESOURCES OF ONTARIO (ARO) METADATA
 METADATA") AGGREGATE RESOURCES OF ONTARIO (ARO) METADATA GENERAL INFORMATION Official Name of the Data Set or Information Holding: Aggregate Resources of Ontario Acronyms are Used to Identify the Data Set or Information
AGGREGATE RESOURCES OF ONTARIO (ARO) METADATA GENERAL INFORMATION Official Name of the Data Set or Information Holding: Aggregate Resources of Ontario Acronyms are Used to Identify the Data Set or Information
Outline of Guideline for Development and Utilization of Tsunami Disaster Management Map
 Outline of Guideline for Development and Utilization of Tsunami Disaster Management Map Port and Airport Research Institute, Japan The Overseas Coastal Area Development Institute of Japan Ports and Harbours
Updating the GEBCO Grid
 Updating the GEBCO Grid PAULINE WEATHERALL, GEBCO DIGITAL ATLAS MANAGER, BRITISH OCEANOGRAPHIC DATA CENTRE (BODC), NATIONAL OCEANOGRAPHY CENTRE (NOC), LIVERPOOL, UK. GEBCO TSCOM and SCRUM meeting, Kuala
WESTERN STATES SEISMIC POLICY COUNCIL POLICY RECOMMENDATION Earthquake and Tsunami Planning Scenarios
 WESTERN STATES SEISMIC POLICY COUNCIL POLICY RECOMMENDATION 18-1 Earthquake and Tsunami Planning Scenarios Policy Recommendation 18-1 WSSPC strongly encourages states, provinces, territories, First Nations,
Predicting of Tsunami Inundation Area based on Propagation and Runup Numerical Model in Pacitan City
 Predicting of Tsunami Inundation Area based on Propagation and Runup Numerical Model in Pacitan City 1 Agus Suharyanto, 1 Alwafi Pujiraharjo, 2 Adipandang Yudono, 3 Keisuke Murakami, and 3 Chikashi Deguchi
This article is provided courtesy of the American Museum of Natural History.
 Avoiding Earthquake Surprises in the Pacific Northwest This article is provided courtesy of the American Museum of Natural History. How Vulnerable Is the Pacific Northwest? Cascadia is a region in the
Cascadia megathrust earthquakes: reducing risk through science, engineering, and planning
 Cascadia megathrust earthquakes: reducing risk through science, engineering, and planning NSF Hazards SEES EAR-1331412 Urban Science and Engineering Workshop 21 July 2014 Everything to do with M9 Cascadia
The Integration of Land and Marine Spatial Data Set As Part of Indonesian Spatial Data Infrastructure Development
 UNITED NATIONS E/CONF.97/6/IP. 46 ECONOMIC AND SOCIAL COUNCIL Seventeenth United Nations Regional Cartographic Conference for Asia and the Pacific Bangkok, 18-22 September 2006 Item 7 of the provisional
REPORT. Coastal Inundation Hazard Zone Mapping. Addendum to Coastal Protection Areas Re-assessment Stage Two
 REPORT Coastal Inundation Hazard Zone Mapping Addendum to Coastal Protection Areas Re-assessment Stage Two Prepared for Prepared by Date Job Number 851833 Distribution: (FILE) 1 copy 1 copy Table of contents
NUMERICAL SIMULATION AS GUIDANCE IN MAKING TSUNAMI HAZARD MAP FOR LABUAN ISLAND
 NUMERICAL SIMULATION AS GUIDANCE IN MAKING TSUNAMI HAZARD MAP FOR LABUAN ISLAND MOHD RIDZUAN bin Adam Supervisor: Fumihiko IMAMURA MEE09199 ABSTRACT At the northeast end of the South China Sea, tsunamis
Differentiating earthquake tsunamis from other sources; how do we tell the difference?
 Differentiating earthquake tsunamis from other sources; how do we tell the difference? David Tappin (1), Stephan Grilli (2), Jeffrey Harris (2), Timothy Masterlark (3), James Kirby (4), Fengyan Shi Shi
MRD273-REV METADATA. Acronyms are Used to Identify the Data Set or Information Holding: MRD273-REV
 MRD273-REV METADATA GENERAL INFORMATION Official Name of the Data Set or Information Holding: Ontario Precambrian Bedrock Magnetic Susceptibility Geodatabase for 2001 to 2012 Acronyms are Used to Identify
Predicting Tsunami Inundated Area and Evacuation Road Based On Local Condition Using GIS
 IOSR Journal of Environmental Science, Toxicology and Food Technology (IOSR-JESTFT) ISSN: 2319-2402, ISBN: 2319-2399. Volume 1, Issue 4 (Sep-Oct. 2012), PP 05-11 Predicting Tsunami Inundated Area and Evacuation
SCIENCE OF TSUNAMI HAZARDS
 SCIENCE OF TSUNAMI HAZARDS ISSN 8755-6839 Journal of Tsunami Society International Volume 29 Number 3 2010 POTENTIAL DEFICIENCIES IN EDUCATION, INSTRUMENTATION, AND WARNINGS FOR LOCALLY GENERATED TSUNAMIS
Application #: TEXT
 TOWN OF FORT MYERS BEACH 2008 PROPOSED COMPREHENSIVE PLAN AMENDMENTS Application #: 2008-13-TEXT Description: Modify the Coastal Management and Future Land Use Elements to reflect the state s new definition
MRD283-REV METADATA. Acronyms are Used to Identify the Data Set or Information Holding: MRD283-REV
 MRD283-REV METADATA GENERAL INFORMATION Official Name of the Data Set or Information Holding: Ambient Groundwater Geochemistry Data for Southern Ontario, 2007 2014 Acronyms are Used to Identify the Data
GEOPHYSICAL DATA SET (GDS) 1084B METADATA
 1084B METADATA") GEOPHYSICAL DATA SET (GDS) 1084B METADATA GENERAL INFORMATION Official Name of the Data Set or Information Holding: Ontario Airborne Geophysical Surveys, Magnetic Gradiometer and Gamma-Ray Spectrometric
GEOPHYSICAL DATA SET (GDS) 1084B METADATA GENERAL INFORMATION Official Name of the Data Set or Information Holding: Ontario Airborne Geophysical Surveys, Magnetic Gradiometer and Gamma-Ray Spectrometric
MRD 228 METADATA. Official Name of the Data Set or Information Holding: Physiography of Southern Ontario
 MRD 228 METADATA GENERAL INFORMATION Official Name of the Data Set or Information Holding: Physiography of Southern Ontario Acronyms are Used to Identify the Data Set or Information Holding: MRD228 Describe
Magnitude 6.5 OFFSHORE NORTHERN CALIFORNIA
 A powerful offshore earthquake that struck near the Northern California coast left a hodgepodge of debris for communities to sort through Sunday but spared residents any serious injury. After 25,000 people
Tsunami Sign Placement Guidelines
 State of Oregon Department of Geology and Mineral Industries Vicki S. McConnell, Acting State Geologist Open-File Report OFR-03-06 Tsunami Sign Placement Guidelines by Mark Darienzo Oregon Emergency Management
Use of Elevation Data in NOAA Coastal Mapping Shoreline Products. Coastal GeoTools April 1, 2015
 Use of Elevation Data in NOAA Coastal Mapping Shoreline Products Coastal GeoTools April 1, 2015 - NOAA s Coastal Mapping Program & CUSP - Shoreline Uses, Delineation Issues, Definitions - Current Extraction
Annual transport rates at two locations on the fore-slope.
 Sediment Transport by Currents Fore-slope Sediment transport rates and sediment concentrations were computed from the hydrodynamic model runs as well as from direct measurements of current velocities at
EXECUTIVE SUMMARY A SUBMISSION OF DATA AND INFORMATION ON THE OUTER LIMITS OF THE CONTINENTAL SHELF OF THE REPUBLIC OF NIGERIA PURSUANT TO
 EXECUTIVE SUMMARY A SUBMISSION OF DATA AND INFORMATION ON THE OUTER LIMITS OF THE CONTINENTAL SHELF OF THE REPUBLIC OF NIGERIA PURSUANT TO PART VI OF AND ANNEX II TO THE UNITED NATIONS CONVENTION ON THE
NUMERICAL SIMULATION OF TSUNAMI PROPAGATION AND INUNDATION ALONG THE RAKHINE COAST AREAS IN MYANMAR
 NUMERICAL SIMULATION OF TSUNAMI PROPAGATION AND INUNDATION ALONG THE RAKHINE COAST AREAS IN MYANMAR Su Hninn Htwe Supervisor: Bunichiro SHIBAZAKI MEE12619 Yushiro FUJII ABSTRACT This study aimed to assess
Area-wide geotechnical information summary for CERA zoning review panel
 Area-wide geotechnical information summary for CERA zoning review panel This document contains all the area-wide geotechnical information which was considered by CERA as part of the process for making
TSUNAMI HAZARD ASSESSMENT IN NORTHERN EGYPT USING NUMERICAL SIMULATION
 TSUNAMI HAZARD ASSESSMENT IN NORTHERN EGYPT USING NUMERICAL SIMULATION Abutaleb Ali Supervisor: Bunichiro SHIBAZAKI MEE16717 Yushiro FUJII ABSTRACT To investigate the tsunami hazard along the northern
Creating a Bathymetric Database & Datum Conversion
 Creating a Bathymetric Database & Datum Conversion Mitchell Brown Civil Engineering Technician Mitchell.E.Brown@erdc.dren.mil June 11, 2012 US Army Corps of Engineers BUILDING STRONG Introduction to Bathymetric
Papua New Guinea LiDAR Factsheet. Pacific-Australia Climate Change Science and Adaptation Planning. Vanimo. Bismark Sea. Wewak
 Pacific-Australia Climate Change Science and Adaptation Planning INDONESIA Vanimo Ninigo Group Wewak Madang Mount Hagen Kundiawa Goroka Mendi Daru AUSTRALIA Kerema Gulf of Papua Admiralty Islands Mussau
A) B) C) D) 4. Which diagram below best represents the pattern of magnetic orientation in the seafloor on the west (left) side of the ocean ridge?
 B) C) D) 4. Which diagram below best represents the pattern of magnetic orientation in the seafloor on the west (left) side of the ocean ridge?") 1. Crustal formation, which may cause the widening of an ocean, is most likely occurring at the boundary between the A) African Plate and the Eurasian Plate B) Pacific Plate and the Philippine Plate C)
1. Crustal formation, which may cause the widening of an ocean, is most likely occurring at the boundary between the A) African Plate and the Eurasian Plate B) Pacific Plate and the Philippine Plate C)
New Zealand s Next Top Model: integrating tsunami modelling into land use planning
 New Zealand s Next Top Model: integrating tsunami modelling into land use planning Wendy Saunders (MZNZPI), Gegar Prasetya, Graham Leonard GNS Science, Lower Hutt, w.saunders@gns.cri.nz In April 2011 a
ELEVATION. The Base Map
 ELEVATION The Base Map Basic Elevation Types: Points X, Y, Z Irregular distribution Cumbersome Typical sources Lidar Stereo photography Ground survey ASCII, LAS formats Basic Elevation Types: Contour Lines
Update on the It s Our Fault project
 Report 12.552 Date 29 October 2012 File 12/01/01 Committee Author CDEM Group Bruce Pepperell, Regional Manager, WREMO Update on the It s Our Fault project 1. Purpose To inform the CDEM Group of progress
Modeling Tsunami Inundation and Assessing Tsunami Hazards for the U. S. East Coast (Phase 3) NTHMP Semi-Annual Report May 21, 2015
 NTHMP Semi-Annual Report May 21, 2015") Modeling Tsunami Inundation and Assessing Tsunami Hazards for the U. S. East Coast (Phase 3) NTHMP Semi-Annual Report May 21, 2015 Project Progress Report Award Number: NA14NWS4670041 National Weather
Modeling Tsunami Inundation and Assessing Tsunami Hazards for the U. S. East Coast (Phase 3) NTHMP Semi-Annual Report May 21, 2015 Project Progress Report Award Number: NA14NWS4670041 National Weather
Estimated Sediment Volume: Bridge Street Dam Impoundment, Royal River, Yarmouth, Maine
 University of Southern Maine USM Digital Commons Publications Casco Bay Estuary Partnership (CBEP) 2015 Estimated Sediment Volume: Bridge Street Dam Impoundment, Royal River, Yarmouth, Maine Stantec Follow
Tsunami Inundation Modeling in the Aegean Sea
 Tsunami Inundation Modeling in the Aegean Sea B. Aydın Akdeniz University, Antalya, Turkey O. Hoto & U. Kânoğlu Middle East Technical University, Ankara, Turkey SUMMARY: The tsunami forecasting system
B.C. s Offshore Oil and Gas: a Guide to the Geology and Resources.
 B.C. s Offshore Oil and Gas: a Guide to the Geology and Resources. Introduction Beneath the offshore regions of British Columbia are four moderately large, geologically young sedimentary basins (Figure
DEVELOPMENT OF TSUNAMI DESIGN CRITERIA FOR OREGON COASTAL BRIDGES. Bruce Johnson 1 Based on research and documents by Solomon Yim 2 et al
 DEVELOPMENT OF TSUNAMI DESIGN CRITERIA FOR OREGON COASTAL BRIDGES Bruce Johnson 1 Based on research and documents by Solomon Yim 2 et al Abstract This paper describes Oregon Department of Transportation
Introduction to Environmental Geology, 5e Case History: Indonesian Tsunami Indonesian Tsunami (2) Introduction Historic Tsunamis
 Introduction Historic Tsunamis") 1 2 3 4 5 6 7 8 9 Introduction to Environmental Geology, 5e Chapter 7 Tsunami Case History: Indonesian Tsunami December 26, 2004, within a few hours, close to 250,000 people were killed With no warning
1 2 3 4 5 6 7 8 9 Introduction to Environmental Geology, 5e Chapter 7 Tsunami Case History: Indonesian Tsunami December 26, 2004, within a few hours, close to 250,000 people were killed With no warning
Models of tsunami waves at the Institute of Ocean Sciences
 Models of tsunami waves at the Institute of Ocean Sciences Josef Cherniawsky and Isaac Fine Ocean Science Division, Fisheries & Oceans Canada, Sidney, BC Port Alberni, March 27, 2014 Acknowledgements:
Connecticut Coastal Management Program
 Connecticut Coastal Management Program Fact Sheet for SHORELINE FLOOD AND EROSION CONTROL STRUCTURES What are Shoreline Flood and Erosion Control Structures? The Connecticut General Statutes (CGS) define
Lessons Learned from Past Tsunamis Warning and Emergency Response
 UNESCO IOC CTIC US NOAA ITIC Regional Training Workshop on Strengthening Tsunami Warning and Emergency Response Standard Operating Procedures and the Development of the ICG/CARIBE-EWS PTWC New Enhanced
NUMERICAL SIMULATIONS FOR TSUNAMI FORECASTING AT PADANG CITY USING OFFSHORE TSUNAMI SENSORS
 NUMERICAL SIMULATIONS FOR TSUNAMI FORECASTING AT PADANG CITY USING OFFSHORE TSUNAMI SENSORS Setyoajie Prayoedhie Supervisor: Yushiro FUJII MEE10518 Bunichiro SHIBAZAKI ABSTRACT We conducted numerical simulations
Mapping Coastal Change Using LiDAR and Multispectral Imagery
 Mapping Coastal Change Using LiDAR and Multispectral Imagery Contributor: Patrick Collins, Technical Solutions Engineer Presented by TABLE OF CONTENTS Introduction... 1 Coastal Change... 1 Mapping Coastal
MARINE GEOLOGY & GEOGRAPHY
 MARINE GEOLOGY MARINE GEOLOGY & GEOGRAPHY Marine Geology 4 LAYERS OF THE EARTH CRUST THICKNESS: VARIES BETWEEN OCEAN & CONTINENTS 5-40 KM STATE: SOLID ELEMENTS: SILICON, ALUMINUM, CALCIUM, SODIUM, POTASSIUM
USGS National Geospatial Program Understanding User Needs. Dick Vraga National Map Liaison for Federal Agencies July 2015
 + USGS National Geospatial Program Understanding User Needs Dick Vraga National Map Liaison for Federal Agencies July 2015 + Topics 2 Background Communities of Use User Surveys National Map Liaisons Partnerships
STUDY ON APPROPRIATE MODELING OF TSUNAMIS IN MALAYSIA FOR RISK EVALUATION
 STUDY ON APPROPRIATE MODELING OF TSUNAMIS IN MALAYSIA FOR RISK EVALUATION Zaty Aktar binti Mokhtar* Supervisor: Fumihiko Imamura** MEE06025 Shunichi Koshimura** ABSTRACT In order to design a tsunami warning
Establishment and Operation of a Regional Tsunami Warning Centre
 Establishment and Operation of a Regional Tsunami Warning Centre Dr. Charles McCreery, Director NOAA Richard H. Hagemeyer Pacific Tsunami Warning Center Ewa Beach, Hawaii USA Why A Regional Tsunami Warning
Meeting the New Queensland Coastal Plan Storm Surge Requirements for Redland City Council. Queensland Coastal Conference 2011
 Meeting the New Queensland Coastal Plan Storm Surge Requirements for Redland City Council Ancient Knowledge Contemporary Innovation The Pullman Reef Hotel, Cairns Daniel Niven 1 and David Taylor 2 1 Cardno
Lessons from the 2004 Sumatra earthquake and the Asian tsunami
 Lessons from the 2004 Sumatra earthquake and the Asian tsunami Kenji Satake National Institute of Advanced Industrial Science and Technology Outline 1. The largest earthquake in the last 40 years 2. Tsunami
Introduction to Environmental Geology, 5e
 Lecture Presentation prepared by X. Mara Chen, Salisbury University Introduction to Environmental Geology, 5e Edward A. Keller Chapter 7 Tsunami Case History: Indonesian Tsunami December 26, 2004, within
Probabilistic Tsunami Hazard Analysis. Hong Kie Thio AECOM, Los Angeles
 Probabilistic Tsunami Hazard Analysis Hong Kie Thio AECOM, Los Angeles May 18, 2015 Overview Introduction Types of hazard analysis Similarities and differences to seismic hazard Methodology Elements o
Magnitude 7.0 N of ANCHORAGE, ALASKA
 A magnitude 7.0 earthquake occurred just before 8:30 am local time 8 miles north of Anchorage at a depth of 40.9 km (25.4 miles). There are reports of major infrastructure damage and damage to many homes
Storm Surge Analysis Update Meeting Cross City, Florida June 17, 2014
 Big Bend Coastal Storm Surge Study Storm Surge Analysis Update Meeting Cross City, Florida June 17, 2014 Introductions Risk MAP Project Team FEMA Region IV Florida Division of Emergency Management (FDEM)
Surviving the Big One: Understanding and Preparing for a Major Earthquake in Western Oregon
 Surviving the Big One: Understanding and Preparing for a Major Earthquake in Western Oregon May 21, 2013 City of Salem Salem Public Library Althea Rizzo, Geological Hazards Program Coordinator Oregon Emergency
The 1700/01/26 Cascadia subduction zone Earthquake and Tsunami
 Jason R. Patton GEO 142 1/13/15 Abstract: Cascadia subduction zone earthquakes (CSZ) can generate strong ground shaking and deadly tsunamis. Geologists used sediment cores and stream bank exposures to
- West Africa. Abuja, Nigeria May Fredericton Canada Heeswijk The Netherlands Washington DC United States Adelaide Australia
 A Case Study in Land and Sea Data Interoperability Patricia GASPAR(Netherlands), Andrew HOGGARTH(Canade), Gordon JOHNSTON(UK), Charles de JONG(Netherlands) - West Africa Abuja, Nigeria - 6-10 May 2013
The ITSU System in the Pacific Region and Future Upgrades
 The ITSU System in the Pacific Region and Future Upgrades Eddie Bernard Director, Pacific Marine Environmental Laboratory (PMEL) NOAA/USA Pacific Tsunami Warning Center OPERATIONAL ACTIVITIES SEISMIC DATA
Specification & Content of Marine Reference Information
 Specification & Content of Marine Reference Information By Mike Osborne and James Rapaport SeaZone Solutions Limited CONTENTS 1. History of Marine Data 2. User Requirements 3. Geographic Content 4. SeaZone
GC Briefing. Weather Sentinel Hurricane Florence. Status at 5 PM EDT (21 UTC) Today (NHC) Discussion. September 13, 2018
 Today (NHC) Discussion. September 13, 2018") GC Briefing September 13, 2018 Weather Sentinel Hurricane Florence Tropical storm conditions have been reported for areas of North Carolina and will continue to spread inland to the west and south. Hurricane
GC Briefing September 13, 2018 Weather Sentinel Hurricane Florence Tropical storm conditions have been reported for areas of North Carolina and will continue to spread inland to the west and south. Hurricane
EMERGENCY PLANNING IN NORTHERN ALGERIA BASED ON REMOTE SENSING DATA IN RESPECT TO TSUNAMI HAZARD PREPAREDNESS
 EMERGENCY PLANNING IN NORTHERN ALGERIA BASED ON REMOTE SENSING DATA IN RESPECT TO TSUNAMI HAZARD PREPAREDNESS Barbara Theilen-Willige Technical University of Berlin, Institute of Applied Geosciences Department
Efficiencies in Data Acquisition and Transformation
 Efficiencies in Data Acquisition and Transformation Andrew LEYZACK Canada Key words: Hydrography, IHO S-57, Nautical Chart SUMMARY For many hydrographic offices, the introduction of electronic nautical
Area-wide geotechnical information summary for CERA zoning review panel
 Area-wide geotechnical information summary for CERA zoning review panel This document contains all the area-wide geotechnical information which was considered by CERA as part of the process for making
Earthquake Hazards. Tsunami
 Earthquake Hazards Tsunami Review: What is an earthquake? Earthquake is the vibration (shaking) and/or displacement of the ground produced by the sudden release of energy. The point inside the Earth where
Area-wide geotechnical information summary for CERA zoning review panel
 Area-wide geotechnical information summary for CERA zoning review panel This document contains all the area-wide geotechnical information which was considered by CERA as part of the process for making
LOMR SUBMITTAL LOWER NESTUCCA RIVER TILLAMOOK COUNTY, OREGON
 LOMR SUBMITTAL LOWER NESTUCCA RIVER TILLAMOOK COUNTY, OREGON Prepared for: TILLAMOOK COUNTY DEPARTMENT OF COMMUNITY DEVELOPMENT 1510-B THIRD STREET TILLAMOOK, OR 97141 Prepared by: 10300 SW GREENBURG ROAD,
BEFORE THE ENVIRONMENTAL PROTECTION AUTHORITY AT WELLINGTON
 BEFORE THE ENVIRONMENTAL PROTECTION AUTHORITY AT WELLINGTON IN THE MATTER of the Exclusive Economic Zone and Continental Shelf (Environmental Effects) Act 2012 (EEZ Act) AND IN THE MATTER BETWEEN AND AND
USGS Hydrography Overview. May 9, 2018
 + 1 USGS Hydrography Overview May 9, 2018 + 2 The National Geospatial Program Provides the geospatial baseline of the Nation s topography, natural landscape and built environment through The National Map,
LOMR SUBMITTAL LOWER NEHALEM RIVER TILLAMOOK COUNTY, OREGON
 LOMR SUBMITTAL LOWER NEHALEM RIVER TILLAMOOK COUNTY, OREGON Prepared for: TILLAMOOK COUNTY DEPARTMENT OF COMMUNITY DEVELOPMENT 1510-B THIRD STREET TILLAMOOK, OR 97141 Prepared by: 10300 SW GREENBURG ROAD,
MAPS AND COORDINATES...
 Table of Contents 1 INTRODUCTION... 2 2 MAPS AND COORDINATES... 3 3 ADVISORY ASSISTANCE FROM COMMISSION MEMBERS... 3 4 PROVISIONS OF ARTICLE 76 INVOKED... 3 5 OUTSTANDING MARITIME DELIMITATIONS... 4 6
Knowledge of in-slab earthquakes needed to improve seismic hazard estimates for southwestern British Columbia
 USGS OPEN FILE REPORT #: Intraslab Earthquakes 1 Knowledge of in-slab earthquakes needed to improve seismic hazard estimates for southwestern British Columbia John Adams and Stephen Halchuk Geological
Gravity and Magnetic Anomalies Compared to Moho Depth throughout the State of Texas
 Gravity and Magnetic Anomalies Compared to Moho Depth throughout the State of Texas Taylor Borgfeldt Introduction My Master s thesis is to improve and create additional crustal seismic velocity models
Economic and Social Council 10 July 2013
 ADVANCE UNEDITED VERSION UNITED NATIONS E/C.20/2013/10/Add.1 Economic and Social Council 10 July 2013 Committee of Experts on Global Geospatial Information Management Third session Cambridge, United Kingdom
Redcliffs Park Coastal inundation and coastal erosion
 48 Hereford Street Christchurch 8013 Attention: Deb Taylor Dear Deb 1 Introduction The (MoE) are looking to relocate Redcliffs School to a new school development at and are currently undertaking their