BIOGEOGRAPHIC ASSESSMENTS: INTEGRATION OF ECOLOGY AND GIS TO DEFINE AND EVALUATE MARINE PROTECTED AREA BOUNDARIES
|
|
|
- Cecilia Dean
- 5 years ago
- Views:
Transcription
1 BIOGEOGRAPHIC ASSESSMENTS: INTEGRATION OF ECOLOGY AND GIS TO DEFINE AND EVALUATE MARINE PROTECTED AREA BOUNDARIES Mark E. Monaco, Chris Caldow, and John D. Christensen Introduction The world s marine resources face multiple stresses from both human activities and natural environmental perturbations. As pressures on marine resources continue to increase, it has become evident that data required to make informed management decisions, bounded by policy aspects, are either lacking or not easily accessed (Battista and Monaco 2004). Information technologies provide a suite of capabilities that can be used to organize, visualize, analyze, and conduct integrated assessments of geographic data in support of the world s estuarine, coastal, and marine habitats and associated living marine resources (Parker 1988; Haddad and Michener 1991). However, to make maximum use of geographic information system (GIS), remote sensing, and database management technologies, a clear process must be implemented to consistently and efficiently collect, ingest, and analyze spatial and temporal ecological data sets. The purpose of this chapter is to demonstrate how the implementation of a biogeographic assessment process can be utilized to define and evaluate marine protected area (MPA) boundaries, including no take marine reserves. The designation and implementation of marine reserves is a tool available to marine resource managers to effectively protect and maintain the complexity of quality fish habitat as well as mitigate the effects of fishing (Bohnsack and Ault 1996). The biogeographic assessment process facilitates the integration of ecology and GIS technology to define and address issues of place based management, such as defining MPA boundaries (Battista and Monaco 2004). Biogeography is the study of spatial and temporal distributions of organisms, habitats, and the historical and biological factors produced them (Cox and Moore 1993). The principles of biogeography can be used to visualize and integrate biological and physical data through GIS to support development of management tools such as, MPAs (Kendall and Monaco 2003). Implementation of the process begins with the development of individual biogeographic data layers (e.g., bottom substrates and species distributions), integrated biogeographic analyses (e.g., areas of high species diversity), and concludes with products to support marine resource management (Figure 1). This chapter provides three case examples that utilize the biogeographic assessment process to: 1) define biologically relevant boundaries for MPAs, 2) evaluate current MPA boundaries relative to the distribution of marine resources, and 3) evaluate alternative MPA boundaries. The three case studies address MPA science and management issues in the US Caribbean and four National Oceanic and Atmospheric Administration (NOAA) national marine sanctuaries along the California coastline. CASE STUDIES Defining Caribbean Reef Fish Marine Protected Areas Background NOAA s National Centers for Coastal Ocean Science (NCCOS) Biogeography Team conducts mapping, research, and monitoring in tropical coral reef ecosystems to support coastal marine resource management (Monaco et al. 2001). Defining the strength of coupling between species and habitat is facilitated by integrating spatial statistics and indices that are visualized in GIS and result in spatially articulated ecological models (Monaco et al. 1998, Gill et al. 2001). The biogeographic approach enables defining of biologically significant areas that can be used to identify and evaluate MPA boundaries (NCCOS 2003, Monaco et al. In press). Specific areas 1


2 Study Area Catch Data Sightings Bathymetry Substrate Temperature Life History Data Data Layers Analyses and Products Species Distributions Community Distributions Modeled Distributions Ecological Linkages Report Integrated Analyses and Products to Aid Sanctuary Management Integrated Geographic Information System Significant Biological Areas
3 where Caribbean reef fish ecology studies are underway include Buck Island Reef National Monument, just north of St. Croix, US Virgin Islands (USVI), around the island of St. John, USVI, and in southwestern Puerto Rico (Kendall et al. 2004). The reef fish ecology studies are based on NOAA s integrative mapping and monitoring activities of coral reef ecosystems (Monaco et al. 2001). Approach Benthic Habitat Mapping In 1999, NOAA s NCCOS acquired and visually interpreted orthorectified aerial photography for the near-shore waters (nominally 25 meters water depth) off Puerto Rico and the US Virgin Islands. Features visible in the Caribbean imagery were mapped directly into a GIS. Visual interpretation of the imagery was guided by a hierarchical classification scheme that defines and delineates benthic polygon types based on insular-shelf zones and habitat structures of the benthic community. Zones describe the insular-shelf location (e.g., back reef or fore reef), whereas habitat structure includes the cover type (reef, mangrove, submerged aquatic vegetation (SAV), unconsolidated sediments, etc.) of the benthic community (Kendall et al. 2001). This process resulted in digital maps classified to 27 levels of habitats (e.g., seagrass, patch reef) and these habitats are located in cross-shelf zones (e.g., back reef). Reef Fish Surveys The digital habitat maps were used to stratify study areas into distinct zone-structure combinations, or strata. Random stratified sampling sites were selected based on the distribution of habitats contained within the digital habitat maps (Christensen et al. 2003). Scuba divers estimated fish abundance and size at each sample location, and conducted micro-scale measurements of benthic habitat variables, such as percent cover of abiotic and biotic substrates, depth, and rugosity along each 25 X 4 m visual belt transect. The belt-transect diver swam a random compass heading at a constant speed for 15 minutes. The diver identified to the lowest possible taxon, counts, and estimated the size of all fishes observed within 2 m on either side of a centerline (100 m2 total area). Results and Discussion Christensen et al. (2003) demonstrated the use of the biogeographic assessment process to define species habitat utilization patterns in southwestern Puerto Rico to aid in determining biologically relevant boundaries for potential MPAs. Analyses included determining the size and number of fish and the calculation of mean species density, sighting frequency, richness, and diversity within each zone, structure, and stratum (zone-structure combination). Hierarchical clustering (classification) of species presence resulted in persistent similarities in the composition of fish assemblages among Puerto Rico habitat strata. There was a distinct grouping of sites by habitat, indicating that species composition is more similar among sites within the same structure (e.g., seagrass, hardbottom, mangroves) than among zones (e.g., fore reef, lagoon). Species richness and diversity was greatest among reef sites, followed by mangrove sites, and SAV sites (Figure 2). Species richness at reef sites was significantly higher than in SAV sites, but no difference was observed among sites in reef and mangrove structures. The lower diversity in mangroves and SAV was accounted for by the dominance of a few species in each habitat. Many forces act in concert to shape the assemblage structure of a reef fish community. At the scale of a single patch-reef, a multitude of ecological forces such as localized predation and competition may be the primary factors in shaping reef fish communities. By increasing study scale to tens of kilometers, the relative effects of habitat zone and structure on community assemblages become apparent. Habitat structure is the overriding factor shaping southwestern Puerto Rico reef fish assemblages (Christensen et al. 2003). Furthermore, the abundance and distribution of single families, species, and even life stages, showed strong spatial correlations 2
4
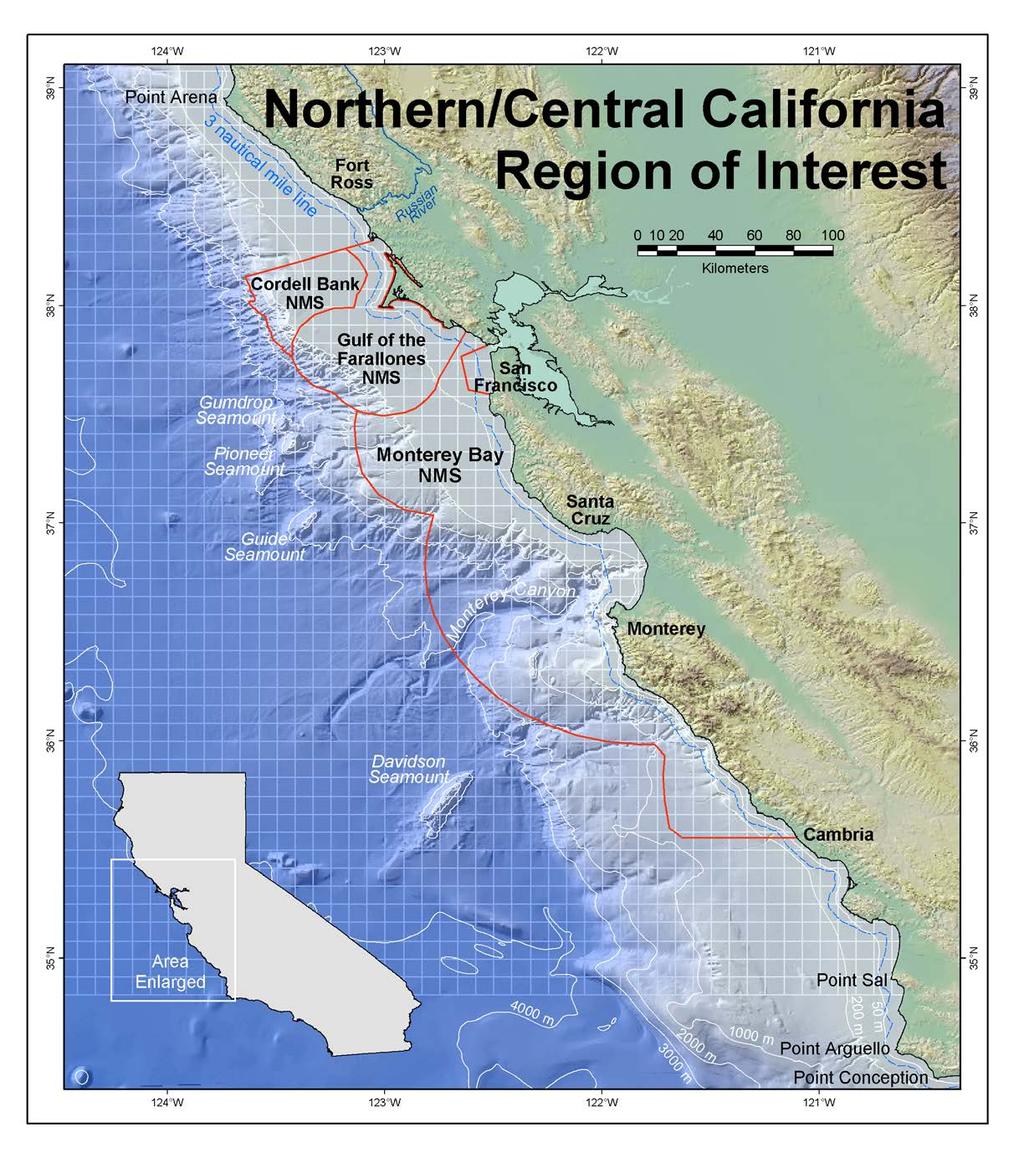
5 with habitat types that enables modeling of the potential distribution of species across the seascape. The biogeographic modeling efforts suggested that a mosaic of habitats must be protected to support reef fish populations across all life history stages. Exclusion of any habitat type could impose a bottleneck at which population maintenance and growth potential might be significantly reduced (Christensen et al. 2003, Kendall et al. 2004)). To enable integration of community metrics (e.g., species richness), habitat, and bathymetry variables, canonical correlation analyses were conducted to define the statistical relationships between the physical and biological parameters across multiple spatial units. An analysis matrix comprised of information on habitat type, the variance in the spatial extent of each habitat type, depth, and the variance in depth were correlated to the biological parameters of species richness, diversity, and abundance. Figure 3 represents the canonical solution between the seascape physiography and reef fish community structure data. The predicted super diversity comprised of the biological parameters resulted in a prediction surface with and overall map accuracy (kappa) of 77% (p<.0001) when validated with independent data. Areas within the prediction map that displayed relatively high diversity (warmer colors) are under exploration with the University of Puerto Rico to further determine if they are biologically relevant boundaries for potential MPAs. The results indicate that when defining an MPA boundary the overall seascape should be considered to enable protection of all species life stages across the spatial extent of the study area. In summary, a biogeographic approach enables the coupling of digital benthic habitat maps and species habitat utilization patterns to define biologically relevant MPA boundaries, define the strength of species habitat affinities, and evaluate MPA effectiveness. Biogeographic assessment products include species distribution maps depicting the probability of encountering a species or groups of species based on their habitat affinities, maps of community metrics (e.g., species richness), and a suite of other spatially-articulated models. These products have been used by the US Caribbean Fisheries Management Council to define essential fish habitats, the National Park Service to characterize benthic habitats and associated species found around US Virgin Islands National Parks and Monuments, and the University of Puerto Rico to define biologically relevant MPA boundaries (NOAA 1998, Christensen et al. 2003, Monaco et al. in review, Kendall et al. 2004). Biogeographic Assessment off North/Central California Background NCCOS and the National Marine Sanctuary Program (NMSP) conducted a 24-month investigation to assess biogeographic patterns of selected marine species found within and adjacent to the boundaries of three contiguous West Coast National Marine Sanctuaries (NCCOS 2003). These sanctuaries, Monterey Bay, Gulf of the Farallones, and Cordell Bank, are conducting a joint review to update sanctuary management plans. To support the management plan review process, the Biogeography Team is leading a partnership effort to conduct a robust analytical assessment to define important biological areas and time periods within the region. Phase I of this project provided data, analytical results, and descriptions of ecosystems and their linkages; it also identified data gaps, and suggested future activities now underway in Phase II (NCCOS 2003, Monaco et al. In press). Phase I of this effort was a biogeographic assessment using existing data on the distribution and abundance of marine fishes, marine birds, marine mammals and their associated habitats. The study did not attempt to define biogeographic patterns along the entire US West Coast nor in very near-shore environments (e.g., estuaries). Rather, the study area was restricted to the marine area from Point Arena in Mendocino County (the northern bound) to Point Sal in northern Santa Barbara County (the southern bound). This relatively large study area enabled the assessment to 3
6 Ecological Linkages Report Develop Statement of Work and select PIs to write the report PIs deliver iterative draft reports for NOAA review PIs deliver final report PIs develop presentation of results Ecolinkage Report Project Kickoff Meetings with Team Members Biogeographic Analyses Identify species and habitats of interest with sanctuaries staff DATA COLLECTION GIS Data Development Data collection and standardization Evaluate data sets and conduct preliminary analyses Metadata creation Revise species and habitat list based on data quality and availability Organize data and transfer to CD-ROM Determine optimal analytical approach Conduct analyses and develop draft products for review Integrate into NMSP s MarIS system Conduct review and revise analytical products Phase 1 GIS Analytical Results Digital Products Interim Products Create web page for project information and product review Interim Product: Biogeographic Assessment Atlas Draft Biogeographic Assessment Biogeographic Assessment Phase I Biogeographic Assessment Phase II
7 extend beyond the limits of individual sanctuary boundaries and to place study results in the context of west coast biogeographic patterns. Results of this assessment are being used to assist the NMSP in addressing issues such as evaluating potential modification of sanctuary boundaries and changes in management strategies or administration. Approach The integrated biogeographic assessment consisted of three complementary study components: (1) an Ecological Linkages Report, (2) biogeographic analyses, and (3) development of GIS data for incorporation into NMSP s Marine Information System. The majority of the results from the assessment were presented as a suite of GIS maps to visually display species biogeographic patterns across the study area. NCCOS (2003) provided examples of the entire suite of digital map products, data, and analyses found on a companion CD-ROM. The spatial data and additional information, such as digital species distribution maps and details on analytical methodologies are also included on the companion CD-ROM and on the internet at: Ideally, biogeographic assessments utilize significant amounts of data that have been collected over the entire spatial extent of the study area over a long time period. However, such a wealth of data is rarely available. In many instances, little information exists to adequately characterize the study area or associated living marine resources. This paucity of comprehensive data can limit the efficacy of biogeographic assessments, but additional analytical methods can be employed to complement the assessment. In addition to analysis of existing databases, two additional techniques were used to conduct the assessment. First a synthesis of existing information was compiled and presented in the Ecological Linkages Report to provide qualitative information on marine ecosystems and linkages within the study area. Second, species habitat suitability models were constructed for fishes to define potential species distributions based on known habitat affinities and physiological limitations (Brown et al. 2000, NCCOS 2003). A critical component of the biogeographic assessment process for central/northern California was the extensive effort to have the data, analytical approaches, and results peer reviewed. Initial results from the suite of biogeographic analyses were presented to experts familiar with the marine ecosystem off north/central California, as well as to the originators of the data sources, in an attempt to improve the analyses. The role of expert review and input was considerable, and the contributions made by experts significantly enhanced the assessment. Thus, the integration of the synthesis of ecological linkage information, statistical analyses of existing databases, species habitat suitability modeling, and peer review resulted in the biogeographic assessment product (NCCOS 2003). Ecological Linkages Report The Ecological Linkages Report provided the context to understand overall biogeographic results, relative to the biogeography of the US West Coast (Airamé et al. 2003). The bulk of the report described ecosystems in the region, key species associated with these ecosystems, ecosystem status, and linkages among them. The report presented the latitudinal range distributions of species groups, such as invertebrates, fish, marine birds and marine mammals. This analysis provided an overview of marine species distributions along the entire west coast of North America by documenting the reported northern and southern range endpoints of species that occur in all or part of this region. In addition, the report identified gaps in current knowledge about regional ecosystems. Biogeographic Analyses This component of the assessment was the cornerstone of the overall biogeographic product to support the NMSP joint management plan review process. Primary data included fisheriesindependent data, such as those collected by the National Marine Fisheries Service (NMFS), and fisheries-dependent data, such as those collected by the California Department of Fish and Game for recreational fisheries. The data, analyses, and supporting information were linked using statistical and GIS tools to portray in space and time significant biological areas or hot spots. 4
8 The term hot spot was defined based on specific criteria or metrics (e.g., species diversity, high species abundance) (Figure 4). The vast majority of the results were displayed as a series of maps to visualize where the analyses identified biologically significant areas (NCCOS 2003, Monaco et al. In press). There are many different ways to analyze and organize biogeographic information; however, to effectively support the management plan process, only a limited number of analytical options were invoked. These analyses were selected based on reviewers' comments on the Project s Interim Atlas Product, feedback from technical review meetings, and peer review workshops. Results and Discussion Many possible combinations of the data layers could be integrated for the biogeographic assessment. In most instances, however, it was not appropriate to integrate all results across taxa. Therefore, to minimize confounding of results and to focus on the "protection of biodiversity" component of the NMSP mission, the integration of patterns in diversity was utilized to define biologically significant areas across species groups. In addition, results of individual species habitat suitability models were integrated across species. Thus, an approach was developed to integrate individual species habitat suitability models into a single cumulative suitability metric indicating areas of high potential groundfish abundance (Brown et al. 2000, NCCOS 2003). These results complemented the community metrics derived for fish and marine bird populations to define areas of integrated biological hot spots. In an attempt to achieve the most explanatory information describing community metrics, analyses were conducted to detect recurring spatial patterns that were present among the multiple species groups. Thus, areas that showed significant biological concentrations, high species diversity, or usage by multiple species groups were delineated. These areas of significant biological importance contributed to defining and assessing biogeographic patterns within the study area. Figure 5 portrays overlays of the top 20% of fish diversity and density cells along with the top 20% of marine bird diversity and density cells. These analyses indicated that the majority (71%) of the fish biological hot spots were coincident with the much larger marine bird hot spots. Although the majority of the area that was identified as hot spots for fish and marine birds occur within National Marine Sanctuary waters, there are hot spots beyond sanctuary boundaries to the north and south. This type of biogeographic assessment has been used to aid in assessing the biological relevancy of existing boundaries and stimulate discussions on potential modification of existing sanctuary boundaries (NCCOS 2003). Biogeographic Assessment of Channel Islands National Marine Sanctuaries Background NCCOS and NSMP are jointly conducting a biogeographic assessment of the marine region surrounding the Channel Islands National Marine Sanctuary (CINMS). The assessment supports revision of the CINMS management plan. The primary objective of the study is to assimilate and analyze comprehensive spatial data on the distribution of habitats and species to evaluate potential implications of six different boundary expansion alternatives. The six sanctuary boundary expansion alternatives that are under investigation have not been rigorously assessed from a biogeographic perspective (Figure 6). Defining how these boundary alternatives correspond to the distribution of critical biotic and habitat resources is a necessary component of assessing the potential implications of changes in the boundaries or management of the CINMS. The study area to conduct the spatially articulated characterization of the Channel Islands ecosystem and surrounding areas extends from Morro Bay, California to 30 km south of Santa Catalina Island. Within this study area an initial suite of biogeographic data layers are being compiled and include information of the distribution of habitats, marine fishes, marine birds, and marine mammals. Using this suite of data a series of assessment activities are underway for each 5

9

10 124 W 123 W 122 W 121 W 124 W 123 W 122 W 121 W 39 N Dover sole Adult 39 N Dover sole Subadult 39 N 38 N HSI Results Highest Moderate Low Lowest Unsuitable 38 N HSI Results Highest Moderate Low Lowest Unsuitable 38 N 37 N Km 37 N Km 37 N 35 N 36 N Mean Abundance 36 N 36 N Validation - NMFS Trawl Data r 2 =0.90 p= N Mean Abundance Validation - NMFS Trawl Data r 2 =0.79 p= N HSI Value HSI Value 124 W 123 W 122 W 121 W 124 W 123 W 122 W 121 W 10 Bathymetry Sediment 10 Bathymetry Sediment 8 8 SI Values SI Values Sand Mud Pebble Cobble Gravel Rock Sand Mud Pebble Cobble Gravel Rock

11
12 proposed boundary alternative. The results will enable visualization and quantification of the spatial extent of biologically significant areas defined in each boundary alternative. The information provided below addresses the preliminary analyses for marine birds as an example of how the assessment will be conducted across all species groups. Ultimately, analysis of marine fishes, invertebrates, birds, and mammals will result in a series of integrated map products to evaluate biological relevancy of the various boundary alternatives. Approach Metrics The choice of appropriate metrics for comparison of boundary alternatives is a difficult one, and involves implicit value judgments. Since such judgments are often policy decisions, and inherently beyond the scope of a biogeographic assessment, three separate metrics along with a discussion of their biases and implied values are presented. A fundamental distinction can be made between metrics, which are based on absolute quantity, and those based on relative quantity. Examples of absolute metrics include: the total number of blue whale observations recorded in boundary alternative 5 or the total area of above average bird density falling within the current CINMS boundaries. Examples of relative metrics include: the number of blue whale observations per square kilometer recorded in boundary alternative 5 or the average bird density within the current CINMS boundaries. For many of the species and community metrics discussed in this assessment, the hypothetical example above is an apt description of the situation. The current boundary of the CINMS was chosen in part because for many species it encompasses an area of optimal habitat. The smaller boundary alternatives are also generally subsets of the larger alternatives, with all options encompassing the current boundary. To the extent that each species or community metric matches the hypothetical situation, absolute metrics will be biased toward the larger boundary alternatives and relative metrics will favor the smaller options. Because of the inherent biases of absolute and relative metrics, an index was used to provide a more balanced gauge of the relative merits of different boundary alternatives. This third metric, the Biological Area Index (BAI) represents the relative increase in biological value divided by the relative increase in area compared to the current boundaries. The BAI is calculated using the formula: BAI = ( B1 B0 / B0 ) ( A A / A ) where B 1 and B 0 refer to the value of the biological estimate (e.g. sightings, diversity, richness, etc.) within the boundary alternative and the current boundaries, respectively, and A 1 and A 0 are the respective areas. This provides some balance against the previously discussed biases, but may not eliminate them entirely. Marine Bird Diversity The marine bird diversity data were derived from six at-sea surveys (including both marine and aerial platforms) of marine birds from the period The results of these surveys are compiled in the Computer Database Analysis System (CDAS) v.2.1 (MMS 2001). Although CDAS contains survey data from the entire US west coast, the analyses were limited to sightings data south of Point Arena. A total of 95 bird species were observed in the combined surveys. The Shannon index of diversity (Shannon and Weaver 1949) was chosen for this analysis, because it is one of the most commonly used diversity metrics in community ecology and has 6
13 relatively small statistical bias when sample sizes are large (as is the case with this source data). The diversity index attempts to balance species richness (i.e. the total number of unique species) with species evenness (i.e. the distribution of individuals among the species). For a given number of individuals and species, the diversity index is highest when there is an equal number of individuals of each species. Since the CDAS data includes summaries for 5-minute of latitude by 5-minute of longitude grid cells, we calculated total observed diversity for each 5-minute cell. The diversity index (H ) was calculated using the formula: H ' = s i= 1 '- ni * - ni * $ % + ( ln+ (" &, N ), N )# where n i is the number of individuals belonging to the i th species (S) in the sample (5 minute grid), and N is the total number of individuals in the sample (Magurran 1988). To aid analysis and visual interpretation of the diversity map, estimated diversity was then interpolated using kriging to provide a statistically smoothed 1km raster surface (Figure 7). Results and Discussion Marine Bird Diversity The marine bird diversity model resulted in several meso-scale patches (tens to hundreds of kilometers in size) from Point Arena in the north to the US-Mexico border in the south. Regions of high estimated diversity (warmer colors) appear along the entire stretch, with a large patch extending from the shelf waters north of Cordell Bank National Marine Sanctuary through the Gulf of the Farallones and Monterey Bay National Marine Sanctuaries along the shelf break terminating in the region of Monterey Bay and Point Sur (Figure 7). A second conspicuous area of high estimated diversity appears approximately 140 kilometers west of Monterey Bay in the open waters over the Guide Seamount. Farther to the south another much smaller patch of high diversity appears in the vicinity of the Santa Lucia Banks. This small patch appears to be a seaward extension of the most prominent extent of high diversity, which ranges from Morro Bay in the north along the shelf down to Point Conception. This significant feature then spreads throughout the entire Southern California Bight, with concentrations around the Channel Islands (San Miguel, Santa Rosa, Santa Cruz, and Anacapa, Santa Catalina, and San Clemente Islands), the Santa Barbara Channel, and shelf areas throughout the southern portion of the Bight. In general, model results indicate that the current configuration of National Marine Sanctuaries (NMS) along the California coastline captures substantial areas of high estimated diversity. In this analysis (ranging from 39o to 32o north latitude), the total area represented by the top 25% of the estimate was 33,881 km2. Roughly 5,770 km2 (17%) of this overall area is contained within the four California Sanctuaries, with 6% falling inside the boundaries of the CINMS. A total of 61% of the area contained within current CINMS boundaries was classified as having high marine bird diversity. This is the largest area proportion of any California NMS. The estimated patterns of bird diversity should be interpreted with care, as they represent a compilation of six surveys with different methods occurring over a period of nearly 25 years. The distribution and abundance of some species are known to have changed since 1975 (the earliest data used in this analysis). A drawback common to nearly all diversity metrics, is the strong positive and non-linear correlation between diversity and sampling effort (He et al., 1994). As sampling effort increases in a given region, the calculated diversity within that region increases as well. Consequently, when sampling effort varies over a given area (as it does within the project study area) some of the observed patterns in diversity may be related to patterns in the distribution of sampling effort. Analysis of Boundary Alternatives 7


14 124 W 123 W 122 W 121 W 39 N Data Integration: Species Diversity 39 N Legend 38 N Fish - Top 20% Diversity Birds - Top 20% Diversity Overlap of both Fish and Birds Kelp Beds (1999) 38 N N Kilometers 35 N 35 N 36 N 36 N 37 N 4000 m 2000 m 200 m 50 m 3000 m 1000 m 124 W 123 W 122 W 121 W
15 The preceding discussion identified a large region of high bird diversity centered on the Channel Islands, ranging from Morro Bay in the north along the shelf down to Point Conception, where it then spreads throughout the entire Southern California Bight. A total of 61% of the area contained within current CINMS boundaries was classified as having high (top 25%) marine bird diversity. Thus, it is important to recognize that the no action alternative (NAA, current boundary) is well configured to capture areas of high marine bird diversity; however, a review of the remaining alternatives suggests that an expansion could provide further benefit in terms of preserving areas of high bird diversity. Mean estimated diversity for the NAA was calculated to be 1.49 with a coefficient of variation (CV) of 8.8%. Mean diversity and CV values for the remaining alternatives, ranging from smallest in size to largest are as follows: Alternative , 8.7%; Alternative , 9.9%; Alternative , 9.8%; Alternative , 10%; Alternative 1a 1.37, 20.3%; Alternative , 20.4% (Figures 6, 7). These results are generally predictable, with a trend of boundary alternatives of larger areas exhibiting lower mean diversity values than smaller boundary alternatives. It should be noted; however, that this trend is largely driven by alternatives 1 and 1a, and that while the trend is predictable, alternatives 2, 3, and 4 are higher than expected. This indicates that the boundary configuration for these alternatives disproportionately captures areas of high bird diversity, and that any of these alternatives would be a suitable choice for expansion. Alternatives 1 and 1a would be a less suitable choice based on mean diversity alone. The more balanced BAI was used to assess the relative value of bird diversity as it provides the ratio of the relative change in mean diversity to the proportional gain in area. While the index decouples the predictable relationships between alternative area and biological value to some extent, results are still dependent upon the input data absolute vs. relative measures. Results indicate that alternatives 3 and 4 provide the largest biological value per area gained. The results of the preliminary biogeographic analyses to define biologically significant areas for marine birds under various boundary alternatives can be summarized by reviewing the three analytical metrics. Patterns of marine bird diversity appear to reflect the distribution of known upwelling regions and areas of high productivity. The current boundaries of the CINMS encompass a region of high bird diversity. Finally, of the five boundary alternatives being considered in addition to the NAA, options 3 and 4 provide relatively large increases in mean bird diversity within sanctuary boundaries (Figure 6). CONCLUDING COMMENTS The use of GIS in coastal and marine environments can provide scientists, managers, and the public with a powerful tool to address complex spatial issues for natural resource management (Battista and Monaco 2004). The biogeographic assessment process enables integration of ecology and GIS technologies to define and evaluate the spatial and temporal distributions of marine resources. Spatially explicit biogeographic assessments provide information necessary to strengthen the sustainable management of marine resources within and adjacent to MPAs. The three case studies presented in this chapter demonstrates the power of the biogeographic assessment approach to define MPA boundaries, evaluate biological relevancy of existing boundaries, and assess MPA boundary alternative scenarios. ACKNOWLEDGEMENTS We would like to thank all members of the NOAA/NCCOS Biogeography Team who contributed to the development of this assessment. We especially thank Matt Kendall, Tracy Gill, and Wendy Morrison for analytical contributions to the text. This work would not have been possible without the close cooperation of the University of Puerto Rico and the staff of the West Coast National Marine Sanctuaries. In addition, we thank Ms. Jamie Higgins for assisting in the production of this chapter. 8
16 LITERATURE CITED Airame, S., S. Gaines, and C. Caldow Ecological linkages: marine and estuarine ecosystems of central and northern California. NOAA, National Ocean Service. Silver Spring, MD. 164 p. Battista, T.A, and M.E. Monaco Geographic information systems applications in coastal marine fisheries. Pages in W.L. Fisher and F.J. Rahel, editors. Geographic information systems in fisheries. American Fisheries Society, Bethesda, Maryland. Bohnsack, J.A. and J.S. Ault Management strategies to conserve marine biodiversity. Oceanography 9: Brown, S.K., K.R. Buja, S.H. Jury, M.E. Monaco, and A. Banner Habitat suitability index models for eight fish and invertebrate species in Casco and Sheepscot bays, Maine. North American Journal of Fisheries Management 20: Christensen, J.D., C.F.G Jeffrey, C. Caldow, M.E. Monaco, M.S. Kendall, and R.S. Appledoorn Cross-shelf habitat utilization patterns of reef fishes in southwestern Puerto Rico. Gulf and Caribbean Research. Vol. 14 (2) Cox, C.B. and P.D. Moore Biogeography, an ecological and evolutionary approach, fifth edition. Blackwell Scientific Publications, Oxford, England. 326 p. Gill, T.A., M.E. Monaco, S.K. Brown, and S.P. Orlando Three GIS tools for assessing or predicting distributions of species, habitats, and impacts: CORA, HSM, and CA&DS. In: Proceedings of the First International Symposium on Geographic Information Systems (GIS) in Fishery Science. March 2-4, Seattle, WA. Bohnsack, J.A. and J.S. Ault Management strategies to conserve marine biodiversity. Oceanography 9: Haddad, K.D. and W.K. Michener Design and implementation of a coastal resource geographic information system: administrative consideration. Pages in O.T. Magoon, H. Converse, V. Tipple, L.T. Tobin, and D. Clark, editors. Coastal Zone 91, proceedings of the 7th symposium on coastal and ocean management. American Society of Civil Engineers, New York. He, F., P. Legendre, C. Bellehumeur, and J.V. La Frankie Diversity pattern and spatial scale: a study of tropical rain forest of Malaysia. Environmental and Ecological Statistics 1: Kendall, M.S., J.D. Christensen, C. Caldow, M. Coyne, C. Jeffery, M.E. Monaco, W. Morrison, and Z. Hillis-Starr The influence of bottom type and shelf position on biodiversity of tropical fish inside a recently enlarged marine reserve. Aquatic Conservation: Marine and Freshwater Ecosystems 14: Kendall, M.S., and M.E. Monaco Biogeography of the National Marine Sanctuaries: A partnership between the NOS Biogeography Program and the National Marine Sanctuary Program. NOAA, Silver Spring, MD. 8 p. Kendall, M.S., C.R. Kruer, K.R. Buja, J.D. Christensen, M. Finkbeiner, and M.E. Monaco Methods used to map the benthic habitats of Puerto Rico and the U.S. Virgin Islands. NOAA/NOS Biogeography Program Technical Report. Silver Spring, MD. 45 p. 9
17 Magurran, M.V Ecological diversity and its measurement. Princeton University Press, Princeton, N.J. 179 p. MMS (Minerals Management Service) Marine mammal and seabird computer database analysis system Washington, Oregon, and California (MMS-CDAS, version 2.1). Prepared by Ecological Consulting Inc. (now R.G. Ford Consulting Co.) Portland, OR for the Minerals Management Service, Pacific OCS Region, Order No PO Monaco, M.E., A.M. Friedlander, C. Caldow, J.D. Christensen, J. Beets, J. Miller, and C.S. Rogers. In Review. An initial assessment of the Virgin Islands Coral Reef National Monument: comparison of reef fish populations and habitat insided and outside of the monument. (Coral Reefs). Monaco, M.E., J.D. Christensen, and S.O. Rohmann Mapping and monitoring of U.S. coral reef ecosystems: the coupling of ecology, remote sensing, and GIS technology. Earth System Monitor. Vol. 12, No. 1. Monaco, M.E., M.S. Kendall, J.L. Higgins, C.E. Alexander, and M.S. Tartt. In Press. Biogeographic assessments of NOAA National Marine Sanctuaries: the integration of ecology and GIS technology. In: Proceedings of the California and the World Ocean 02 Conference. October 27-30, Santa Barbara, CA. Monaco, M.E., S.B. Weisberg, T.A. Lowery Summer habitat affinities of estuarine fish in US mid-atlantic coastal system. Fisheries Management and Ecology. Vol. 5, NCCOS (National Centers for Coastal Ocean Science) A biogeographic assessment off north/central California: To support the joint management plan review for Cordell Bank, Gulf of the Farallones, and Monterey Bay National Marine Sanctuaries: Phase I marine fishes, birds, and mammals. Prepared by NCCOS s Biogeography Team in cooperation with the National Marine Sanctuary Program. Silver Spring, MD. 145 p. NOAA (National Oceanic and Atmospheric Administration) Product Overview: Products and services for the identification of essential fish habitat in Puerto Rico and the U.S. Virgin Islands. National Ocean Service, Silver Spring, MD. 9 pages + appendices. On web: Parker, H.D The unique qualities of geographic information systems: a commentary. Photogrammetric Engineering and Remote Sensing 54: Shannon, C.E. and W. Weaver The mathematical theory of communication. University of Illinois Press, Urbana, IL. 125 p. 10


18 Figures 1.1, 1.2, Figure 1.1. Generalized biogeographic approach to study NOAA national marine sanctuaries. Figure 1.2. Locator map of entire study area from Point Arena to Point Sal. National marine sanctuary boundaries shown in red. Figure 1.4. Species richness of rockfish from individual NMFS shelf and slope trawls.


19 50 Place Matters Figure 1.5. Potential distribution of habitat suitability for adult and juvenile Dover sole. Map inset contains validation statistics, and Suitability Index values for bathymetry and substrate are displayed below the maps. Figure 1.6. Marine bird biomass, by season and for all seasons in study area.
 for fish and marine birds.")

, and the Northwest Atlantic from the Northwest Atlantic Fisheries")
20 Figures 1.5, 1.6, 1.6, 2.1, Figure 1.7. Data Integration: diversity hot spots (top 20%) for fish and marine birds. Coastal kelp bed areas are also shown. Figure 2.1. Reporting areas used for fisheries statistics by Food and Agriculture Organization (FAO) and its regional bodies, the International Council for the Exploration of the Sea (ICES), and the Northwest Atlantic from the Northwest Atlantic Fisheries Organization (NAFO), currently used Figure 2.2. Decade of maximum commercial landings.
Biogeographic Approach to Coastal Assessments & Spatial Planning
 NOAA s Biogeographic Approach to Coastal Assessments & Spatial Planning Mark E. Monaco Mark.Monaco@noaa.gov Center for Coastal Monitoring and Assessment http://ccma.nos.noaa.gov/about/biogeography Biogeography
Biogeographic Assessments of NOAA National Marine Sanctuaries: The Integration of Ecology and GIS Technology
 Biogeographic Assessments of NOAA National Marine Sanctuaries: The Integration of Ecology and GIS Technology Mark E. Monaco, Matt S. Kendall and Jamison L. Higgins NOAA/NOS National Centers for Coastal
Marine Spatial Planning: A Tool for Implementing Ecosystem-Based Management
 Marine Spatial Planning: A Tool for Implementing Ecosystem-Based Management Steven Murawski, Ph.D., Ecosystem Goal Team Lead National Oceanic and Atmospheric Administration NOAA November 16, 2009 1 To
9.0 Consistency with the Magnuson-Stevens Fishery Conservation and Management Act (MSFCMA)
") 9.0 Consistency with the Magnuson-Stevens Fishery Conservation and Management Act (MSFCMA) This analysis was prepared in accordance with the requirements of the Magnuson- Stevens Fishery Conservation and
9.0 Consistency with the Magnuson-Stevens Fishery Conservation and Management Act (MSFCMA) This analysis was prepared in accordance with the requirements of the Magnuson- Stevens Fishery Conservation and
Analysis of Sample Frames and Subsampling Methods for Reef Fish Surveys
 Analysis of Sample Frames and Subsampling Methods for Reef Fish Surveys NOAA Technical Memorandum NOS NCCOS 7 Mention of trade names or commercial products does not constitute endorsement or recommendation
GROUNDFISH AMENDMENT 28 REGULATION DEVELOPMENT UPDATE
 Agenda Item I.2.a NMFS Report 1 September 2018 GROUNDFISH AMENDMENT 28 REGULATION DEVELOPMENT UPDATE In drafting regulations for the Council s final preferred alternative for Amendment 28, recommended
Setting Priorities for Eelgrass Conservation and Restoration. Robert Buchsbaum Massachusetts Audubon Society
 Setting Priorities for Eelgrass Conservation and Restoration Robert Buchsbaum Massachusetts Audubon Society Eelgrass habitat values A rich, productive habitat for many marine organisms Nursery habitat
Designing Networks of Marine Protected Areas in DFO s Three Atlantic Bioregions
 Designing Networks of Marine Protected Areas in DFO s Three Atlantic Bioregions Presentation for Indigenous Protected Areas Workshop Max Westhead, DFO and Adrian Gerhartz-Abraham, Dalhousie March 29, 2017
Ecological mapping using satellite imagery: an Abu Dhabi case study Middle East Geospatial Forum 16 th February 2015
 Ecological mapping using satellite imagery: an Abu Dhabi case study Middle East Geospatial Forum 16 th February 2015 Richard Flemmings rf@proteusgeo.com About Proteus Formed in UAE 2011 We specialise in
Introduction: The Gulf of Mexico Alliance. The Gulf GAME project MERMAid and PHINS Results & Conclusions What s next? Examples
 AAG Las Vegas March 25, 2009 Introduction: Ocean governance and Ecosystem-Based Management The Gulf of Mexico Alliance Habitat Identification and Characterization The Gulf GAME project MERMAid and PHINS
Geospatial Decision Support Tools for Planning of Marine Protected Areas in California
 Geospatial Decision Support Tools for Planning of Marine Protected Areas in California WILL MCCLINTOCK (UNIVERSITY OF CALIFORNIA SANTA BARBARA), MATT MERRIFIELD (THE NATURE CONSERVANCY), SOPHIE DE BEUKELAER
National Marine Sanctuary Program
 National Marine Sanctuary Program NMSP/USGS Joint Seabed Mapping Initiative: September 2004 AA National Ocean Service National Marine Sanctuaries Interim Report September 2004 Background: Since 2002,
Biogeographic Assessments to Meet Local & Regional Management Needs
 Biogeographic Assessments to Meet Local & Regional Management Needs August 2012 / NCCOS / Center for Coastal Monitoring and Assessment Center for Coastal Fisheries and Habitat Research Chris Jeffrey Chris.Jeffrey@noaa.gov
SW Florida Escarpment Mapping Area
 Overview NOAA s Okeanos Explorer (EX) Program plans to conduct systematic mapping and telepresence-enabled ROV explorations in the Gulf of Mexico during Spring 2014. In 2011, the EX conducted mapping operations
Courtesy of John Mitchell
 Shrimp trawl fisheries Marine fish stocks are under increasing threat from a range of spatially based problems that might be natural or involve socio-economic factors. To best manage spatial problems,
Habitat Mapping in The Hauraki Gulf Marine Park. Dan Breen
 Habitat Mapping in The Hauraki Gulf Marine Park Dan Breen Outline 1. Intro Habitat mapping 2. Coastal marine habitats and marine protected areas in the New Zealand Territorial Sea: a broad scale gap analysis
Cross walking to the New Coastal and Marine Ecological Classification Standard (CMECS)
") Cross walking to the New Coastal and Marine Ecological Classification Standard (CMECS) Mark Finkbeiner and Chris Robinson NOAA Coastal Services Center EBM Tools Webinar 16 May 2013 Outline What is CMECS
Cross walking to the New Coastal and Marine Ecological Classification Standard (CMECS) Mark Finkbeiner and Chris Robinson NOAA Coastal Services Center EBM Tools Webinar 16 May 2013 Outline What is CMECS
Habitat Suitability for Forage Fishes in Chesapeake Bay
 Habitat Suitability for Forage Fishes in Chesapeake Bay Aug 2017 Jul 2019 Mary C Fabrizio Troy D Tuckey Aaron J Bever Michael L MacWilliams 21 June 2018 Photo: Chesapeake Bay Program Motivation Production
Offshore Video Survey and Oceanographic Analysis: Georges Bank to the Chesapeake project
 Non-Technical Synopsis of the Offshore Video Survey and Oceanographic Analysis: Georges Bank to the Chesapeake project Executive Summary Dave Bethoney Kristin Kleisner Mark Anderson Changsheng Chen Bradley
CLIMAR-III Third JCOMM Workshop on Advances in Marine Climatology 6-9 May Gdynia, Poland
 CLIMAR-III Third JCOMM Workshop on Advances in Marine Climatology 6-9 May 2008. Gdynia, Poland Catherine Marzin Historical Ecology Program Manager National Marine Sanctuary Program Stefan Claesson Research
Treasure Coast Science Scope and Sequence
 Course: Marine Science I Honors Course Code: 2002510 Quarter: 3 Topic(s) of Study: Marine Organisms and Ecosystems Bodies of Knowledge: Nature of Science and Life Science Standard(s): 1: The Practice of
Identifying and characterizing biodiversity hotspots in the BCLME: its relevance in the light of climate change
 Identifying and characterizing biodiversity hotspots in the BCLME: its relevance in the light of climate change Kirkman SP 1, Yemane D 2, Kathena J 3, Mafwila S 4, Nsiangango S 5, Samaai T 1, Singh L 2
Introduction to Part III Examining wildlife distributions and abundance using boat surveys
 Baseline Wildlife Studies in Atlantic Waters Offshore of Maryland: Final Report to the Maryland Department of Natural Resources and Maryland Energy Administration, 2015 Introduction to Part III Examining
Summary Description Municipality of Anchorage. Anchorage Coastal Resource Atlas Project
 Summary Description Municipality of Anchorage Anchorage Coastal Resource Atlas Project By: Thede Tobish, MOA Planner; and Charlie Barnwell, MOA GIS Manager Introduction Local governments often struggle
Coastal and Marine Ecological Classification Standard (CMECS)
") Coastal and Marine Ecological Classification Standard (CMECS) Kathy Goodin, NatureServe EMECS, August 2011 Baltimore, MD 1 Outline Objectives & Process Classification Content Questions 2 Objectives Develop
Coastal and Marine Ecological Classification Standard (CMECS) Kathy Goodin, NatureServe EMECS, August 2011 Baltimore, MD 1 Outline Objectives & Process Classification Content Questions 2 Objectives Develop
Jacqueline M. Grebmeier Chesapeake Biological Laboratory University of Maryland Center for Environmental Science, Solomons, MD, USA
 Update on the Pacific Arctic Region Synthesis Activity as part of the ICES/PICES/PAME Working Group on Integrated Ecosystem Assessment of the Central Arctic Ocean (WGICA) Jacqueline M. Grebmeier Chesapeake
OCEANOGRAPHIC DATA MANAGEMENT
 OCEANOGRAPHIC DATA MANAGEMENT Presented to: Environmental Disaster Data Management Meeting Russ Beard Director, National Coastal Data Development Center Interim Science Coordinator, Gulf Restoration Council
VCS MODULE VMD0018 METHODS TO DETERMINE STRATIFICATION
 VMD0018: Version 1.0 VCS MODULE VMD0018 METHODS TO DETERMINE STRATIFICATION Version 1.0 16 November 2012 Document Prepared by: The Earth Partners LLC. Table of Contents 1 SOURCES... 2 2 SUMMARY DESCRIPTION
Significant Ecological Marine Area Assessment Sheet
 Significant Ecological arine Area Assessment Sheet Name: Eastern Bay of Island Biogenic Soft Sediment Complex Summary: The semi-sheltered areas between the central islands of the Eastern Bay of Islands
Northwestern Hawaiian Islands Coral Reef Research Partnership: Ocean Mapping, Ecosystem Threats, and Information Management
 Northwestern Hawaiian Islands Coral Reef Research Partnership: Ocean Mapping, Ecosystem Threats, and Information Management Malia Chow Papahanaumokuakea Marine National Monument National Oceanic and Atmospheric
Joint Federal Agency Submerged Aquatic Vegetation Survey Guidance for the New England Region Updated August 11, 2016
 Joint Federal Agency Submerged Aquatic Vegetation Survey Guidance for the New England Region Updated August 11, 2016 FOREWORD This guidance is the result of on-going interagency collaboration between the
INVENTORY OF MARINE VERTEBRATE SPECIES AND FISH-HABITAT UTILIZATION
 INVENTORY OF MARINE VERTEBRATE SPECIES AND FISH-HABITAT UTILIZATION PATTERNS IN COASTAL WATERS OFF FOUR NATIONAL PARKS IN HAWAI I Inventory and Monitoring Program Pacific Island Network Hawaii, American
Abstract. Introduction
 Southern California Aquaculture Site Assessment Model Caitlyn Raines University of Redlands Master of Science in Geographic Information Systems Program Abstract The Southern California Aquaculture Site
Coastal and Marine Ecological Classification Standard (CMECS)
") Coastal and Marine Ecological Classification Standard (CMECS) Mark Finkbeiner NOAA Coastal Services Center Presented at the International Workshop on Seabed Mapping Methods and Technology 18 October 2012
Coastal and Marine Ecological Classification Standard (CMECS) Mark Finkbeiner NOAA Coastal Services Center Presented at the International Workshop on Seabed Mapping Methods and Technology 18 October 2012
Mapping Maine s Working Waterfront: for Our Heritage and Economy
 Mapping Maine s Working Waterfront: for Our Heritage and Economy Abstract Mapping Maine s Working Waterfronts is a collaborative project led by the Island Institute that inventories the state s current
UNIT 5: ECOLOGY Chapter 15: The Biosphere
 CORNELL NOTES Directions: You must create a minimum of 5 questions in this column per page (average). Use these to study your notes and prepare for tests and quizzes. Notes will be stamped after each assigned
Synthesis and Integrated Modeling of Long-term Data Sets to Support Fisheries and Hypoxia Management in the Northern Gulf of Mexico
 Synthesis and Integrated Modeling of Long-term Data Sets to Support Fisheries and Hypoxia Management in the Northern Gulf of Mexico Dan Obenour (Scientific/Hypoxia PI) Kevin Craig (Applications/Fisheries
Socioeconomic Profile and Spatial Analysis of Fisheries in the three central California National Marine Sanctuaries
 Socioeconomic Profile and Spatial Analysis of Fisheries in the three central California National Marine Sanctuaries 23 + 30 March 2004 Charles Steinback and Astrid Scholz Outline Who we are and why we
DFO Maritimes Region Update. Gulf of Maine Council - Coastal and Marine Spatial Planning (CMSP) Committee Web-Ex May 16, 2017
 Committee Web-Ex May 16, 2017") DFO Maritimes Region Update Gulf of Maine Council - Coastal and Marine Spatial Planning (CMSP) Committee Web-Ex May 16, 2017 1 National Oceans Priorities Marine Conservation Targets Oceans Protection Plan
DFO Maritimes Region Update Gulf of Maine Council - Coastal and Marine Spatial Planning (CMSP) Committee Web-Ex May 16, 2017 1 National Oceans Priorities Marine Conservation Targets Oceans Protection Plan
SIF_7.1_v2. Indicator. Measurement. What should the measurement tell us?
 Indicator 7 Area of natural and semi-natural habitat Measurement 7.1 Area of natural and semi-natural habitat What should the measurement tell us? Natural habitats are considered the land and water areas
McHenry County Property Search Sources of Information
 Disclaimer: The information in this system may contain inaccuracies or typographical errors. The information in this system is a digital representation of information derived from original documents; as
Name/ Affiliation: Ben Enticknap, Fishery Project Coordinator Alaska Marine Conservation Council Address: PO Box Anchorage, AK 99510
 Habitat Areas of Particular Concern (HAPC) Proposal Name/ Affiliation: Ben Enticknap, Fishery Project Coordinator Alaska Marine Conservation Council Address: PO Box 101145 Anchorage, AK 99510 Please check
GEOGRAPHIC INFORMATION SYSTEMS AND IT SOLUTIONS FOR THE ENVIRONMENT
 GEOGRAPHIC INFORMATION SYSTEMS AND IT SOLUTIONS FOR THE ENVIRONMENT Mission We focus on Solutions is a worldwide operating business offering Geographic Information Systems and IT solutions to assist environmental
The Use of Geographic Information Systems to Assess Change in Salt Marsh Ecosystems Under Rising Sea Level Scenarios.
 The Use of Geographic Information Systems to Assess Change in Salt Marsh Ecosystems Under Rising Sea Level Scenarios Robert Hancock The ecological challenges presented by global climate change are vast,
California Sea Grant College Program
 California Sea Grant College Program Research Completion Reports (University of California, San Diego) Year 2006 Paper MA06 01 Empirical evaluation of regional scale marine reserves and the groundfish
Chapter 1. CHAPTER 1 INTRODUCTION Chris Caldow, Julie Kellner, M. James Allen, Satie Airamé, Steve Gaines
 CHAPTER 1 INTRODUCTION Chris Caldow, Julie Kellner, M. James Allen, Satie Airamé, Steve Gaines 1.1 Project Background The National Marine Sanctuary Program (NMSP) is currently updating and revising the
McHenry County Property Search Sources of Information
 Disclaimer: The information in this system may contain inaccuracies or typographical errors. The information in this system is a digital representation of information derived from original documents; as
Using seascapes to help predict Australia s benthic marine habitat diversity in the development of a national system of marine protected areas
 Using seascapes to help predict Australia s benthic marine habitat diversity in the development of a national system of marine protected areas A.D. Heap 1, T. Whiteway 1, V. Lucieer 2, S. Nichol 1 1. Geoscience
The Use of GIS in Studying Benthic Marine Animal Movement and Habitat Use
 Julie Barber Overview Paper The Use of GIS in Studying Benthic Marine Animal Movement and Habitat Use Understanding the relationship between marine species and their habitats is a fundamental step in developing
"The Relationship Between Seagrass Cover and Species- richness of Invertebrates"
 "The Relationship Between Seagrass Cover and Species- richness of Invertebrates" SCIE 2204: Marine Systems The Cottesloe Marine Ecosystem Research Project 2014 By Baronie Shaw, K., Bortoloso, T., Cargill,
an accessible interface to marine environmental data Russell Moffitt
 an accessible interface to marine environmental data Russell Moffitt The Atlas Project GOAL: To provide a single point of access to oceanographic and environmental data for use by marine resource researchers,
Investigating the contribution of allochthonous subsidies to kelp forests in central California
 Investigating the contribution of allochthonous subsidies to kelp forests in central California melissa m foley UCSC Institute of Marine Science and Center for Ocean Solutions system connectivity rivers
2012 FORUM OF MARINE PROTECTED AREAS IN THE MEDITERRANEAN ANTALYA, TURKEY
 2012 FORUM OF MARINE PROTECTED AREAS IN THE MEDITERRANEAN ANTALYA, TURKEY SPECIAL EVENT Challenges for Open Seas MPAs in the Mediterranean region November 27, 2012. 15h00-16H00 Slide # 1 2012 FORUM OF
BOEM Marine Minerals Program
 BOEM Marine Minerals Program Restoring and Protecting Our Nation s Coasts through Stewardship of OCS Sand Resources SECOORA 2018 Annual Meeting May 22-24 Doug Piatkowski Douglas.piatkowski@boem.gov 703-787-1833
North Pacific Climate Overview N. Bond (UW/JISAO), J. Overland (NOAA/PMEL) Contact: Last updated: September 2008
, J. Overland (NOAA/PMEL) Contact: Last updated: September 2008") North Pacific Climate Overview N. Bond (UW/JISAO), J. Overland (NOAA/PMEL) Contact: Nicholas.Bond@noaa.gov Last updated: September 2008 Summary. The North Pacific atmosphere-ocean system from fall 2007
North Pacific Climate Overview N. Bond (UW/JISAO), J. Overland (NOAA/PMEL) Contact: Nicholas.Bond@noaa.gov Last updated: September 2008 Summary. The North Pacific atmosphere-ocean system from fall 2007
Modeling dispersal kernals with limited. information. Douglas T. Fischer, Louis W. Botsford, David M. Kaplan, J. William White, John Largier
 Modeling dispersal kernals with limited http://www.nmfs.noaa.gov/habitat/ habitatprotection/profile/pacificcouncil.htm information Douglas T. Fischer, Louis W. Botsford, David M. Kaplan, J. William White,
BIOLOGICAL OCEANOGRAPHY
 BIOLOGICAL OCEANOGRAPHY AN INTRODUCTION 0 ^ J ty - y\ 2 S CAROL M. LALLI and TIMOTHY R. PARSONS University of British Columbia, Vancouver, Canada PERGAMON PRESS OXFORD NEW YORK SEOUL TOKYO ABOUT THIS VOLUME
Distributional changes of west coast species and impacts of climate change on species and species groups
 Distributional changes of west coast species and impacts of climate change on species and species groups Elliott Hazen 1 Ole Shelton 2 Eric Ward 2 1 NOAA Southwest Fisheries Science Center 2 NOAA Northwest
Lesson 3: Protecting Ocean Hotspots
 Lesson 3: Protecting Ocean Hotspots Name: Date: Engage Think about the ocean and the seafloor. 1. Draw a sketch of what you picture when you think about the seafloor. Explore 2. When your teacher projects
Vegetation and Wildlife Habitat Mapping Study in the Upper and Middle Susitna Basin Study Plan Section 11.5
 (FERC No. 14241) Vegetation and Wildlife Habitat Mapping Study in the Upper and Middle Susitna Basin Study Plan Section 11.5 Initial Study Report Part C: Executive Summary and Section 7 Prepared for Prepared
Assessing state-wide biodiversity in the Florida Gap analysis project
 University of Nebraska - Lincoln DigitalCommons@University of Nebraska - Lincoln Nebraska Cooperative Fish & Wildlife Research Unit -- Staff Publications Nebraska Cooperative Fish & Wildlife Research Unit
Project 1.3.1: Improved knowledge of biota, habitats and risks. Project Leader: Dr Mick Haywood, CSIRO Division of Marine and Atmospheric Research
 Marine and Tropical Sciences Research Facility (MTSRF) June 2007 Milestone Report Project 1.3.1: Improved knowledge of biota, habitats and risks Project Leader: Dr Mick Haywood, CSIRO Division of Marine
6.0 Project Description. 6.1 Introduction. a. Situation and Need
 6.0 Project Description 6.1 Introduction a. Situation and Need Located on the west coast, the Cabo Rojo shelf is the widest section of the Puerto Rico (PR) shelf, comprising a diverse mosaic of benthic
Spatial Decision-Support for National Marine Conservation Areas in the Southern Strait of Georgia and Gwaii Haanas
 Spatial Decision-Support for National Marine Conservation Areas in the Southern Strait of Georgia and Gwaii Haanas Lindsay McBlane Krista Royle Greg MacMillan Photo: Mark Hiebert Western and Northern Service
Underwater Parks: Three Case Studies, and a Primer on Marine Boundary Issues. Robert E. Johnson Leland F. Thormahlen
 Robert E. Johnson Leland F. Thormahlen Underwater Parks: Three Case Studies, and a Primer on Marine Boundary Issues Unlike boundaries on land, most marine boundaries are not marked with monuments or fences.
Marine Spatial Planning Leslie-Ann McGee Battelle Memorial Institute
 Marine Spatial Planning Leslie-Ann McGee Battelle Memorial Institute Rev061708 1 Marine Spatial Planning What is it? Why is it different? Where is it currently being employed? What is happening in the
NOAA S Arctic Program in 2017
 NOAA S Arctic Program in 2017 NOAA s Arctic Mission To determine how the Arctic system is changing on time scales of weeks to decades, particularly with respect to the consequences that the loss of sea
NOAA s OCM: Services, tools and collaboration opportunities & Puerto Rico s NE Marine Corridor as a case study
 NOAA s OCM: Services, tools and collaboration opportunities & Puerto Rico s NE Marine Corridor as a case study Dr. Antares Ramos Álvarez NOAA s Office of Coastal Management September 15 th, 2016 Conservation
Discussion paper on spatial units
 Discussion paper on spatial units for the Forum of Experts in SEEA Experimental Ecosystem Accounting 2018 Version: 8 June 2018 Prepared by: SEEA EEA Revision Working Group 1 on spatial units (led by Sjoerd
Overview of Methods. Terrestrial areas that are most important for conservation Conservation
 Overview of Methods The goal of the Western Lake Erie Coastal Conservation Vision project (WLECCV) is to define where we should be working locally to optimally achieve regional conservation impact. The
Regional-scale understanding of the geologic character and sand resources of the Atlantic inner continental shelf, Maine to Virginia
 Regional-scale understanding of the geologic character and sand resources of the Atlantic inner continental shelf, Maine to Virginia Workshop on Dredging, Beach Nourishment and Bird Conservation Atlantic
High-resolution bottom albedo images and benthic habitat classification to develop baseline management tools in Natural Reserves
 High-resolution bottom albedo images and benthic habitat classification to develop baseline management tools in Natural Reserves *William J. Hernandez, Ph.D. and Roy A. Armstrong, Ph.D. *Post-Doctoral
Natural Resource Management. Northern Tasmania. Strategy. Appendix 2
 Natural Resource Management Strategy Northern Tasmania 2015 2020 Appendix 2 Appendix 2 Appendix 2. Carbon Planting Spatial Prioritisation In support of this Strategy s development and implementation, work
MEMORANDUM OF UNDERSTANDING ON THE CONSERVATION OF MIGRATORY SHARKS HABITAT CONSERVATION. (Prepared by the Advisory Committee)
") MEMORANDUM OF UNDERSTANDING ON THE CONSERVATION OF MIGRATORY SHARKS CMS/Sharks/MOS3/Doc.10.2 24 August 2018 Original: English 3 rd Meeting of the Signatories (Sharks MOS3) Monaco, 10 14 December 2018 Agenda
MEMORANDUM OF UNDERSTANDING ON THE CONSERVATION OF MIGRATORY SHARKS CMS/Sharks/MOS3/Doc.10.2 24 August 2018 Original: English 3 rd Meeting of the Signatories (Sharks MOS3) Monaco, 10 14 December 2018 Agenda
Geographic Information System (GIS) and its value to Large Marine Ecosystem (LME)-based management
 and its value to Large Marine Ecosystem (LME)-based management") Jesse Stuart Mechling Dept. of Marine Affairs NRS 509 Prof. Peter August Geographic Information System (GIS) and its value to Large Marine Ecosystem (LME)-based management Integrated or ecosystem-based
Jesse Stuart Mechling Dept. of Marine Affairs NRS 509 Prof. Peter August Geographic Information System (GIS) and its value to Large Marine Ecosystem (LME)-based management Integrated or ecosystem-based
III. Distribution and Abundance of Acropora Corals
 III. Distribution and Abundance of Acropora Corals Background The declines in abundance of two of the principal Caribbean reef-building corals, staghorn coral (Acropora cervicornis) and elkhorn coral (A.
Chapter 52: An Introduction to Ecology and the Biosphere
 AP Biology Guided Reading Name Chapter 52: An Introduction to Ecology and the Biosphere Overview 1. What is ecology? 2. Study Figure 52.2. It shows the different levels of the biological hierarchy studied
Outline. - Background of coastal and marine conservation - Species distribution modeling (SDM) - Reserve selection analysis. - Results & discussion
 - Reserve selection analysis. - Results & discussion") Application of GIS for data preparation and modeling for coastal and marine conservation planning in Madagascar Rija Rajaonson Technical Assistant, REBIOMA Wildlife Conservation Society Madagascar Outline
Application of GIS for data preparation and modeling for coastal and marine conservation planning in Madagascar Rija Rajaonson Technical Assistant, REBIOMA Wildlife Conservation Society Madagascar Outline
23. SUBSISTENCE USES AND TRADITIONAL KNOWLEDGE
 23. SUBSISTENCE USES AND TRADITIONAL KNOWLEDGE 23.1 Introduction The purpose of the subsistence uses and traditional knowledge study is to establish a description of subsistence uses and knowledge of local
WELCOME & INTRODUCTION
 MPA Management Capacity Building Training Module 1: WELCOME & INTRODUCTION Participants Distinguished Guests Welcome Site Overviews of MPAs represented Overview of Training Program What are Today s Objectives?
Impact of Climate Change on Chinook Salmon
 Region: Western Coastlines Grade Level(s): 5-8 Impact of Climate Change on Chinook Salmon Time Required: 2-3 class periods Focus Question(s): How will long term climate changes impact northwest Pacific
IV. Distribution and Abundance of Acropora Corals
 IV. Distribution and Abundance of Acropora Corals Background The declines in abundance of two of the principal Caribbean reef-building corals, staghorn coral (Acropora cervicornis) and elkhorn coral (A.
RECOMMENDED STUDY PLAN 2018
 RECOMMENDED STUDY PLAN 208 NAME STUDENT NUMBER DEGREE PROGRAM Graduate Diploma of Science MAJOR Marine Biology (MBY) Level 5: Year SP3 SP SP6/7 SP2 SP0/SP Major Core: Major Skill Core: Major Core: Major
2017 ESRI CANADA GIS SCHOLARSHIP REPORT CURRENT POLLUTION PROBLEMS IN THE OCEANS
 MAY 31, 2017 2017 ESRI CANADA GIS SCHOLARSHIP REPORT CURRENT POLLUTION PROBLEMS IN THE OCEANS HASSAAN RAFIQUE BACHELOR OF APPLIED TECHNOLOGY GEOGRAPHIC INFORMATION SYSTEMS SOUTHERN ALBERTA INSTITUTE OF
CORRELATION ANALYSIS BETWEEN PALAEMONETES SHRIMP AND VARIOUS ALGAL SPECIES IN ROCKY TIDE POOLS IN NEW ENGLAND
 CORRELATION ANALYSIS BETWEEN PALAEMONETES SHRIMP AND VARIOUS ALGAL SPECIES IN ROCKY TIDE POOLS IN NEW ENGLAND Douglas F., Department of Biology,, Worcester, MA 01610 USA (D@clarku.edu) Abstract Palamonetes
Joint Hydrographic Center, National Oceanic and Atmospheric Administration, Durham, NH 03824, USA
 Future directions in hydrography using satellite-derived bathymetry Shachak Pe eri 1, Christopher Parrish 2, 3, Lee Alexander 1, Chukwuma Azuike 1, Andrew Armstrong 1,3 and Maryellen Sault 2 1 Center for
III. Acropora coral habitat distribution
 2008 Quick Look Report: Miller et al. III. Acropora coral habitat distribution Background The declines in abundance of two of the principal Caribbean reef-building corals, staghorn coral (Acropora cervicornis)
Progress Report Year 2, NAG5-6003: The Dynamics of a Semi-Arid Region in Response to Climate and Water-Use Policy
 Progress Report Year 2, NAG5-6003: The Dynamics of a Semi-Arid Region in Response to Climate and Water-Use Policy Principal Investigator: Dr. John F. Mustard Department of Geological Sciences Brown University
Physical Geography: Patterns, Processes, and Interactions, Grade 11, University/College Expectations
 Geographic Foundations: Space and Systems SSV.01 explain major theories of the origin and internal structure of the earth; Page 1 SSV.02 demonstrate an understanding of the principal features of the earth
Modeling Fish Assemblages in Stream Networks Representation of Stream Network Introduction habitat attributes Criteria for Success
 Modeling Fish Assemblages in Stream Networks Joan P. Baker and Denis White Western Ecology Division National Health & Environmental Effects Research Laboratory U.S. Environmental Protection Agency baker.joan@epa.gov
An Introduction to Day Two. Linking Conservation and Transportation Planning Lakewood, Colorado August 15-16, 16, 2006
 An Introduction to Day Two Linking Conservation and Transportation Planning Lakewood, Colorado August 15-16, 16, 2006 1 Agenda Day One Transportation Planning Heritage Program State Wildlife Action Plan
Capturing a Holistic Understanding of a Large Marine Ecosystem The NOAA Gulf of Mexico Data Atlas
 Capturing a Holistic Understanding of a Large Marine Ecosystem The NOAA Gulf of Mexico Data Atlas NODC / National Coastal Data Development Center gulfalas.noaa.gov Need: data that contribute to long-term
Ecosystem History of Florida Bay and the Southern Estuaries Five Year Update. G. Lynn Wingard (USGS)
") Ecosystem History of Florida Bay and the Southern Estuaries Five Year Update G. Lynn Wingard (USGS) Progress since 2003 Florida Bay Science Conference Expansion of Ecosystem History Research into surrounding
Ecosystem History of Florida Bay and the Southern Estuaries Five Year Update G. Lynn Wingard (USGS) Progress since 2003 Florida Bay Science Conference Expansion of Ecosystem History Research into surrounding
Science and Policy Considerations for Coastal and Marine Spatial Planning in the Wider Caribbean. John Ogden, University of South Florida
 Science and Policy Considerations for Coastal and Marine Spatial Planning in the Wider Caribbean John Ogden, University of South Florida The Caribbean is Ecologically and Politically Complex The Caribbean
7B.4 ASSESSMENT OF THE GROSS U.S. OFFSHORE WIND ENERGY POTENTIAL
 7B.4 ASSESSMENT OF THE GROSS U.S. OFFSHORE WIND ENERGY POTENTIAL Marc Schwartz, Donna Heimiller, Steve Haymes, and Walt Musial National Renewable Energy Laboratory, Golden, Colorado 1. INTRODUCTION Offshore
The Use of Remote Sensing and GIS in MPA Delineation and Management
 Claire Hodson The Use of Remote Sensing and GIS in MPA Delineation and Management Marine Protected Areas (MPAs) are often defined as clearly distinct geographical space, recognized, dedicated and managed,
Kate Labrum
 2010-2011 Bren Group Project Proposal Boats, Whales, & the Santa Barbara Channel: An economic analysis & policy options for reducing the risk of vessel strikes to endangered whales Bren Student Proposers
Marine ecosystem mapping at the Prince Edward Islands
 Marine ecosystem mapping at the Prince Edward Islands Biodiversity Planning Forum NBA special session June 2018 R Adams, C von der Meden, A Dayaram, K Sink, A Lombard, A Bosman, M Dopolo, F Fourie, L Harris,
Fine-scale Survey of Right and Humpback Whale Prey Abundance and Distribution
 DISTRIBUTION STATEMENT A: Approved for public release; distribution is unlimited. Fine-scale Survey of Right and Humpback Whale Prey Abundance and Distribution Joseph D. Warren School of Marine and Atmospheric
17-20 November 2007 Incidental Take Monitoring Methodology and Results
 Sample Site Selection Protocol 17-20 November 2007 Incidental Take Monitoring Methodology and Results On 16 November 2007, the U.S. Fish and Wildlife Service (USFWS) provided the USACE Mobile District