Recognizing City Identity via Attribute Analysis of Geo-tagged Images
|
|
|
- Jared Scott
- 6 years ago
- Views:
Transcription
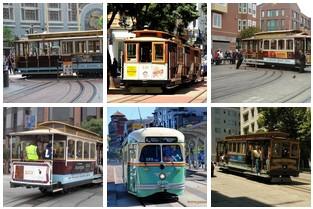
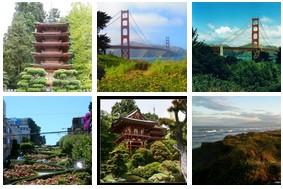
1 Recognizing City Identity via Attribute Analysis of Geo-tagged Images Bolei Zhou 1, Liu Liu 2, Aude Oliva 1, and Antonio Torralba 1 1 Computer Science and Artificial Intelligence Laboratory 2 Department of Urban Studies and Planning Massachusetts Institute of Technology {bolei,lyons66,oliva,torralba}@mit.edu Abstract. After hundreds of years of human settlement, each city has formed a distinct identity, distinguishing itself from other cities. In this work, we propose to characterize the identity of a city via an attribute analysis of 2 million geo-tagged images from 21 cities over 3 continents. First, we estimate the scene attributes of these images and use this representation to build a higher-level set of 7 city attributes, tailored to the form and function of cities. Then, we conduct the city identity recognition experiments on the geo-tagged images and identify images with salient city identity on each city attribute. Based on the misclassification rate of the city identity recognition, we analyze the visual similarity among different cities. Finally, we discuss the potential application of computer vision to urban planning. Keywords: Geo-tagged image analysis, attribute, spatial analysis, city identity, urban planning 1 Introduction In Kevin Lynch s work The Image of The City, a city is described as a form of temporal art in vast scale. Over hundreds of years of human settlement, different cities have formed distinctive identities. City identity is defined as the sense of a city that distinguishes itself from other cities [22]. It appears in every aspects of urban life. For instance, Fig.1 shows photos taken by people in different cities, organized by different urban dimensions. Although there are no symbolic landmarks in those images, people who have lived in these cities or even just visited there can tell which image come from which cities. Such a capability suggests that some images from a city might have unique identity information that different urban observers may share knowledge of. Akin to objects and scenes, cities are visual entities that differ in their shape and function [16, 22]. As the growth of cities is highly dynamic, urban researchers and planners often describe cities through various attributes: they use the proportion of green space to evaluate living quality, take the land use to reflect transportation and social activity, or rely on different indicators to evaluate the urban development [26, 16]. Here, we propose to characterize city identity


![phenomena [29] and human activity [9] occurring in the city.](/docs-images/77/74607150/images/2-4.jpg "In this work a set of 7 high-level attributes is used to describe the spatial form of a city")
.")


![Then based on the SUN attribute database [20] and deep learning features [5], we train the](/docs-images/77/74607150/images/2-8.jpg "state-ofthe-art scene attribute classifiers.")

 and city similarity estimation ( how similar are New York and Prague? ).")

2 2 Bolei Zhou et al. Transportation Architecture Athletic activity Fig. 1. City identity permeates every aspect of urban life. Can you guess from which cities these photos have been taken? Answer is below. 4 via attribute analysis of geo-tagged images from photo-sharing websites. Photosharing websites like Instagram, Flickr, and Panoramio have amassed about 4 billion geo-tagged images, with over 2 million new images uploaded every day by users manually. These images contain a huge amount of information about the cities, which are not only used for landmark detection and reconstruction [12, 3], but are also used to monitor ecological phenomena [29] and human activity [9] occurring in the city. In this work a set of 7 high-level attributes is used to describe the spatial form of a city (amount of vertical buildings, type of architecture, water coverage, and green space coverage) and its social functionality (transportation network, athletic activity, and social activity). These attributes characterize the specific identity of various cities across Asia, Europe, and North America. We first collect more than 2 million geo-tagged images from 21 cities and build a large scale geotagged image database: the City Perception Database. Then based on the SUN attribute database [20] and deep learning features [5], we train the state-ofthe-art scene attribute classifiers. The estimated scene attributes of images are further merged into 7 city attributes to describe each city within related urban dimensions. We conduct both city identity recognition experiment ( is it New York or Prague? ) and city similarity estimation ( how similar are New York and Prague? ). Moreover, we discuss the potential application of our study to urban planning. 1.1 Related Work The work on the geo-tagged images has received lots of attention in recent years. Landmarks of cities and countries are discovered, recognized, and reconstructed from large image collections [2, 12, 30, 13, 3]. Meanwhile, the IM2GPS approach [7] is used to predict image geolocation by matching visual appearance with geotagged images in dataset. Cross-view image matching is also used to correlate 4 New York, London, Armsterdam, Tokyo; San Francisco, Armsterdam, Beijing, New Delhi; Barcelona, Paris, New York, London.
3 Recognizing City Identity via Attribute Analysis of Geo-tagged Images 3 satellite images with ground-level information to localize images [14]. Additionally, geo-tagged images uploaded to social networking websites are also used to predict ecological phenomena [29] and people activity occurring in a city [9]. Besides, recent work [8] utilizes the visual cues of Google Street images to navigate the environment. Our present work is inspired from discovering visual styles of architectures and objects in images [4, 11], which use mid-level discriminative patches to characterize the identity of cities. Another relevant work [24] used Google street view images to estimate the inequality of urban perception with human s labeling. However, instead of detecting landmark images of cities and discovering local discriminative patches, our work aims at analyzing the city identity of the large geo-tagged image collection in the context of semantic attributes tailored to city form and function. Attributes are properties observable in images that have human-designated names (e.g. smooth, natural, vertical). Attribute-based representation has shown great potential for object recognition [1, 19] and scene recognition [18, 20]. Generally human-labeled attributes act as mid-level supervised information to describe and organize images. By leveraging attribute-based representations, we map images with a wide variety of image contents, from different cities, into the same semantic space with the common attribute dimension. Altogether, our approach presents an unified framework to measure the city identity and the similarity between cities. The proposed method not only automatically identifies landmarks and typical architectural styles of cities, but also detects unique albeit inconspicuous urban objects in cities. For instance, as shown in Fig.1 our results on the transportation attribute identify red double decker buses in London and yellow cabs in New York City as the objects with salient city identity value. 2 Describing City Perception by Attributes In this section, we introduce a novel database of geo-tagged images 5 and its statistical properties. Then we propose a set of high-level city attributes from scene attributes to describe the city s spatial form (the amount of vertical buildings, type of architecture, water coverage, and green space coverage), as well as the city s social function (transportation network, athletic activity, and social activity). Attribute classifiers are trained using ground-truth from the SUN attribute database [20]. Furthermore, we analyze how the spatial distributions of city attributes vary across the urban regions and cities. 2.1 City Perception Database Datasets of geo-tagged images can be either collected through cropping images from Google Street View as in [4] or downloading images from photo-sharing websites like Flickr and Panoramio as in [12, 13, 3]. These two data sources have 5 Available at

, given that people travel in a non-uniform way around a city, visiting more often the regions with historical, attractive tour sites as well as the regions with social events.")
4 4 Bolei Zhou et al. different properties. Images from Google Street View are taken on roads where the Google vehicle can go, so the content of these images is limited, as a lot of content related to city perceptions, such as mountains and crowded indoor scenes are missing. Here we choose geo-tagged images from photo sharing websites. Interestingly, these images are power-law distributed on city maps (see Fig.3), given that people travel in a non-uniform way around a city, visiting more often the regions with historical, attractive tour sites as well as the regions with social events. Thus, these images represent people s perception of the city. We build a new geo-tagged image dataset called City Perception Database. It consists of 2,034,980 geo-tagged images from 21 cities collected from Panoramio. To diversify the dataset, cities are selected from Europe, Asia, and North America. To get the geographical groundtruth for each city, we first outline the geographical area of the city, then segment the whole area into dense 500m 500m adjacent spatial cells. Geo-locations of these cells are further pushed to the API of Panoramio to query image URLs. Finally all the images lying within the city area are downloaded and the corrupted images are filtered out. The image numbers of the database along with their spatial statistics are listed in Fig.2. The negative Z-score of the Average Nearest Neighbor Index [23] indicates that the geo-locations of these images have the highly clustered pattern. Fig.3 shows the map plotting of all the images for two cities London and San Francisco. A) B) Fig. 2. A) The number of images obtained in each city. B) The Z-score of the Average Nearest Neighbor Index for each city. The more negative the value is, the more the geo-tagged images are spatially clustered. Thus images taken by people in a city are highly clustered. 2.2 From Scene Attributes to City Attributes We propose to use attributes as a mid-level representation of images in our city perception database. Our approach is to train scene attribute classifiers, then to combine and calibrate various scene attribute classifiers into higher level city attribute classifiers.


5 Recognizing City Identity via Attribute Analysis of Geo-tagged Images 5 Fig. 3. The spatial plot of all the images, along with the spatial cells, on the city map of London and San Francisco. Each image is a black point on the map, while the color of the cell varies with the number of images it contains. Though these two cities have different areas and cell numbers, the distributions of image number per cell both follow a power law. To train the scene attribute classifiers, we use the SUN attribute database [20], which consists of 102 scene attributes labeled on 14,340 images from 717 categories from the SUN database [28]. These scene attributes, such as natural, eating, and open area, are well tailored to represent the content of visual scenes. We use the deep convolutional network pre-trained on ImageNet [5] to extract features of images in the SUN attribute database, since deep learning features are shown to outperform other features in many large-scale visual recognition tasks [10, 5]. Every image is then represented by a 4096 dimensional vector from the output of the pre-trained network s last fully connected layer. These deep learning features are then used to train a linear SVM classifier for each of the scene attributes using Liblinear [6]. In Fig.4 we compare our approach to the methods of using single feature GIST, HoG, Self-Similarity, Geometric Color Histogram, and to the combined normalized kernel method in [20]. Our approach outperforms the current state-of-the-art attribute classifier with better accuracy and scalability. Average Precision [0.892] Ours [0.879] Combined Normalized Kernel [0.848] HoG 2x2 [0.820] Self Similarity [0.799] GIST [0.783] Geometric Color Histogram 1/1 5/5 20/20 50/50 150/150 Number of training examples (positive/negative) Fig. 4. Average precision (AP) averaged over all the scene attributes for different features. Our deep learning feature classifier is more accurate than the other individual feature classifiers and the combined kernel classifier used in [20]. For every image in the city perception database, we also use the pre-trained convolutional network to extract features. Fig. 5 shows images with 4 scene


6 6 Bolei Zhou et al. attributes detected by our scene attribute classifiers from 3 cities Boston, Hong Kong, and Barcelona. Images are ranked according to the SVM confidence. We can see that these scene attributes sufficiently describe the semantics of the image content. Boston Hong Kong Barcelona Vegetation Congregating Praying Sailing Fig. 5. Images detected with four scene attributes from Boston, Hong Kong, and Barcelona. Images are ranked according to their SVM confidences. Table 1. The number of images detected with city attribute in 5 cities. Green Water Trans. Arch. Ver. Ath. Soc. Total Images London 53,306 15,865 25,072 12,662 38,253 6,311 11, ,264 Boston 5,856 2,735 3,059 1,488 6, ,142 26,288 Hong Kong 47,708 18,878 14,914 2,066 21,690 1,346 8, ,147 Shanghai 8,373 1,623 5, , ,569 35,722 Barcelona 25,831 6,825 9,160 6,810 24,334 2,338 6, ,867 We further merge scene attributes into higher level city attributes. Given that some scene attributes are highly correlated with each other (like Vegetation and Farming ) and some other attributes like Medical activity and Rubber are not relevant to the city identity analysis, we choose a subset of 42 scene attributes that are most relevant to represent city form and function, and combine them into the 7 city attributes commonly used in urban study and city ranking [27, 26]: Green space, Water coverage, Transportation, Architecture, Vertical


.")


7 Recognizing City Identity via Attribute Analysis of Geo-tagged Images 7 building, Athletic activity, and Social activity (see the lists of selected scene attributes contained in each city attribute in the supplementary materials). Thus, each of the city attribute classifier is modeled as an ensemble of SVMs: One image is detected with that city attribute if any of the constituent scene attributes is detected, while the response of the city attribute is calibrated across the SVMs using logistic regression. We apply the city attribute classifiers to all the images in the City Perception Database. Table 1 shows the number of detected images on each city attribute across 5 cities. These numbers vary across city attributes due to the difference in the scenic spots, tourist places, or the urban characteristics of the cities. Note that one image might be detected with multiple attributes. 2.3 Spatial Analysis of City Attributes Barcelona New York City Athletic activity Social activity Vertical Building Architecture Transportation Water coverage Green space Fig. 6. Spatial distribution of city attributes and the top ranked images classified with each city attribute in Barcelona and New York. Fig.6 shows the images detected with each of the 7 city attributes on a map. We can see that different city attributes are unequally distributed on map. This


8 8 Bolei Zhou et al. makes sense, given that cities vary in structure and location of popular regions. For example, images with water coverage lie close to the coast line, rivers, or canals of the city, and images with social activities lie in the downtown areas of the city. Note that the images detected by city attribute classifiers have more visual variations to the result of the scene attribute classifiers. Fig.7 shows the city perception maps for Barcelona, New York City, Amsterdam, and Bangkok, which visualize the spatial distribution of the 7 city attributes in different colors. The city perception map exhibits the visitors and inhabitants own experience and perception of the cities, while it reflects the spatial popularity of places in the city across attributes. Green space Water coverage Transportation Architecture Vertical building Athletic activity Social activity Barcelona New York City Amsterdam Bangkok Fig. 7. City perception map of Barcelona, New York, Amsterdam, and Bangkok. Each colored dot represents a geo-tagged image detected with one city attribute. 3 Recognizing City Identity of Images City identity emerges in every aspect of daily life and implicitly exists in the people s perception of the city. As shown in Fig. 1, people can easily recognize the city identity of these photos based on their former experience and knowledge of the cities. This raises the interesting questions: 1) can we train classifiers to recognize the city identity of images? 2) what are the images with high city identity values, i.e., the representative images of the city?
9 Recognizing City Identity via Attribute Analysis of Geo-tagged Images 9 In this section, we formulate the city identity recognition as a discriminative classification task: Given some images randomly sampled from different cities, we hope to train a classifier that could predict which city the newly given images come from. The challenge of the task lies in the wide variety of the image contents across cities. Here we show that city identity actually could be recognized on different city attributes, while the misclassification rate in the city identity recognition experiment could be used to measure the similarity between cities. 3.1 Attribute-based city identity recognition As shown in Table 1 and Figure 6, images of each cities with different city attribute are detected. We are more curious about which images are unique in one city as well as discriminative across other cities on some city attribute. Thus we conduct the discriminative classification of all the 21 cities: For each of the 7 city attribute, 500 images with that city attribute are randomly sampled from each city as the train set, while all the remaining images are included in the test set. A linear SVM classifier is trained and tested for each of the 7 city attributes respectively. Here the train set size 500 is empirically determined, as we assume such a number of images contain enough information about the city identity Green space Water coverage Transportation Architecture Vertical building Athletic activity Social activity London New York Tokyo New Delhi Boston Berlin Beijing Barcelona Shanghai San Francisco Zurich Singapore Kuala Lumpur Hong Kong Seoul Prague Amsterdam Toronto Paris Bangkok Vienna Fig. 8. The accuracies of city identity recognition for each city attribute. Figure 8 plots the accuracies of city identity recognition for each city attribute. Figure 9 illustrates the confusion matrices of city identity recognition for architecture and green space. The performance of city identity recognition is not very high due to the large variety of image contents, but the trained linear SVM classifier actually has good enough discriminative ability compared to the chance. Meanwhile, we can see that the recognition accuracy varies across both cities and city attributes. It is related to the uniqueness of one city for that city attribute. For example, New Delhi and Bangkok have high accuracy in architecture attribute, since they have unique architectures compared to all the other cities selected in the City Perception Database. Interestingly, the misclassification rate in the city identity recognition actually reflects the similarity of two cities, since there are a high number of indistinguishable images from the
10 10 Bolei Zhou et al. two cities. In our case, Paris, Vienna, and Prague are all similar to Barcelona in architecture attribute. This observation leads to our data-driven similarity of cities in Section 3.2. London New York Tokyo Barcelona Beijing Berlin Boston New Delhi San Francisco Shanghai Singapore Zurich Hong Kong Kuala Lumpur Amsterdam Prague Seoul Toronte Vienna Bangkok Paris Architecture Green Space London New York Tokyo Barcelona Beijing Berlin Boston New Delhi San Francisco Shanghai Singapore Zurich Hong Kong Kuala Lumpur Amsterdam Prague Seoul Toronte Vienna Bangkok Paris Paris Bangkok Vienna Toronto Seoul Prague Amsterdam Kuala Lumpur Hong Kong Zurich Singapore Shanghai San Francisco New Delhi Boston Berlin Beijing Barcelona Tokyo New York London Paris Bangkok Vienna Toronto Seoul Prague Amsterdam Kuala Lumpur Hong Kong Zurich Singapore Shanghai San Francisco New Delhi Boston Berlin Beijing Barcelona Tokyo New York London Fig. 9. Confusion matrices of city identity recognition for architecture attribute and green space attribute. The SVM confidence of an image actually indicates the city identity value of that image. We rank the correctly classified images to discover the images representing salient city identity. Fig.10 shows the images with salient city identity on 5 city attributes respectively. For example, in transportation attribute, there are lots of canal cruises in Amsterdam since it has more than one hundred kilometers of canals across the whole city; Tokyo has narrow streets since it is pretty crowded; Red double decker buses and yellow cabs are everywhere on the street of London and New York respectively, while tram cars are unique in San Francisco. Images with salient city identity in architecture attribute show the representative construction styles, while images with salient city identity in athletic activity attribute indicate the most popular sports in these cities. 3.2 Data-driven visual similarity between cities How similar or different are two cities? Intuitively we feel that Paris is more similar to London than to Singapore, while Tokyo is more similar to Beijing than to Boston. Measuring the similarity of cities is still an open question [25, 21]. Here we use a data-driven similarity metric between two cities based on the misclassification rate of the city identity recognition. We assume that if two cities are visually similar to each other, the misclassification rate in the city identity recognition task should be high across all the city attributes. Thus we can use the pairwise misclassification rates averaged over all 7 city attributes as a similarity measure. The misclassification rate on each city attribute is computed from the city identity recognition repeated on every pairs of cities, which is the sum of the


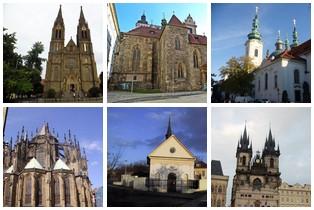


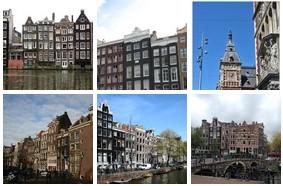


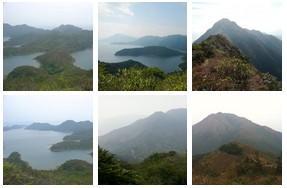

11 Recognizing City Identity via Attribute Analysis of Geo-tagged Images 11 San Francisco Prague Bangkok Green space Tokyo Hong Kong Kuala Lumpur Amsterdam London Tokyo Transportation New York City San Francisco Prague London Amsterdam Prague Architecture Beijing Tokyo San Francisco New York City Kuala Lumpur London Athletic activity Barcelona Hong Kong Beijing Fig. 10. Images with high city identity values on 4 city attributes.

12 12 Bolei Zhou et al. rate of misclassifying images of city A as city B and the rate of misclassifying images of city B as city A. Fig.11A plots the similarity network of all the 21 cities in our database. The thickness of the edges indicates the averaged pairwise misclassification rate (for better visualization we remove weak edges). Nodes with the same color are those that belong to the same group, clustered by the community detection algorithm [17]. Cities in one group are closely connected with each others: they are grouped based on their located continents-europe, North America, or Asia. In Fig.11B we scatter our data-driven similarity with the geodesic distances between the geographical centers of the cities. The correlation coefficient r is 0.57 (p < 0.01). Our result validates that the geographical distance between cities plays an important role in determining the similarity of cities. Indeed, historically there were more trade and cultural exchanges between spatially-neighboring cities, so they would share similar elements in their form and culture. Besides, there are some outliers detected in our result, such as New Delhi and New York. This is because the culture of New Delhi is quite different from other cities in our database, while New York is a metropolis which mixes the cultures from all over the world. Our data-driven similarity metric between cities is useful for the study of urban sociology and city history. A) B) Similarity Fig. 11. A) Similarity graph of cities. The nodes indicate cities, the thickness of the edges indicates the similarity computed from the misclassification rate of the city identity recognition. Nodes with the same color belong to the same cluster. B) The scatter of the data-driven similarity over geodesic distance of cities. Each point indicates one pair of cities. Some representative labels of points are plotted. There is high negative correlation between the geodesic distance of a pair of cities and their visual similarity.
13 Recognizing City Identity via Attribute Analysis of Geo-tagged Images 13 4 Further Application in Urban Planning Estimating people s perceptions of a city from a massive collection of geo-tagged images offers a new method for urban studies and planning. Our data-driven approach could help assess and guide urban form construction. Following the seminal work of Kevin Lynch [15], our data-driven analysis of images taken by people in a city relates the subjective perception of people with the urban construction. City identity has been described along various urban dimensions, which additionally allows us to think about urban design in various terms. Here we propose to quantify the correlation between our geo-tagged image analysis and urban construction, using a set of quantitative indicators provided by MassGIS and Boston(Mass.) Department of Innovation and Technology 6 :building height and density, openness rate, sidewalk density, block size, and the ratio of street height and width, available for the city of Boston. First, we segment the city into 50m 50m connected but non-overlapping spatial cells, so that city regions are quantified by hundreds of cells. For each cell, we represent the people s perception of this cell as the number of images inside, the attribute diversity (the number of the different city attributes in the cell), and the dominant city identity value. Then we calculate the Pearson correlation to see how people s perceptions are relevant to those urban design measurements. The result of the statistical analysis can be found in Table 2. Most of the urban design indicators are significantly correlated with people s perception of the city. For example, sidewalk density is positively correlated with the attribute diversity (0.296). This means that a place with more space of sidewalk is likely to provide more views of people while it allows people to move between areas more easily. Similar results are found for building height and the ratio of height and width of streets. Regarding the negative correlation, it shows that when block size grows the place becomes less friendly to the pedestrians. Therefore it has a negative impact on the people s perception of the city. Openness rate, which refers to the percentage of open space in a cell, is a more complex indicator. On the one hand, the positive coefficient between openness rate and city identity value suggests that a larger open space would have higher city identity value. On the other hand, the negative coefficient of the image number and attribute diversity indicates that such a place is less diverse and crowded. For example, Boston common is one of the Boston s well-known public center with a salient city identity, and it also has a very high openness rate. However, because visitors are scattered across the large park, the geo-tagged images won t look quite spatially dense. Fig.12 plots the attribute diversity value and the sidewalk density of Boston in the city maps. This comparison between urban form and city identity provides valuable reference and instructions for urban planners because they incorporate people s subjective preference toward the built environment


14 14 Bolei Zhou et al. Table 2. The correlation between the results of geo-tagged image analysis and the urban design indicators for the city of Boston. **: P-value<0.01 Indicators Building height Openness rate Sidewalk density Block size H/W Image number 0.156** ** 0.241** ** 0.112** Attribute diversity 0.098** ** 0.296** ** 0.080** City identity value 0.070** ** ** 0.065** Attribute Diversity Sidewalk density Fig. 12. The map of attribute diversity and the map of sidewalk density in Boston. Color indicates the value intensity. 5 Conclusion This work introduced a novel data-driven approach to understand what makes the identity of a city. From the attribute analysis of many geo-tagged images of cities, we found that the identity of a city could be represented and expressed in various urban dimensions, such as green space, architecture, transportation, and activity. Using the attribute representation of images tailored to describe the form and function of cities, we identified images with salient city identity and measured the similarity between cities. Further applications in the urban planning were discussed. Our work suggests a fruitful direction of computer vision research in the domain of urban computation. In the future work, we plan to study how a city identity develops over time based on the time-stamps of the geo-tagged images. Meanwhile, by collecting additional urban measurements, such as the distribution of the crime rates and the cleanliness of neighborhoods, we hope to more faithfully identify what makes a city distinctive and suggest how to optimize the urban planning of a specific city, or a cluster of cities, to take into account the people s needs and expectations. Acknowledgments. We thank Zoya Bylinskii, Christopher Dean, Scott Hu, and the reviewers for insightful suggestions. This work is partly funded by NSF grant to A.O, and Google Research Awards to A.O and A.T.
15 Recognizing City Identity via Attribute Analysis of Geo-tagged Images 15 References 1. Branson, S., Wah, C., Schroff, F., Babenko, B., Welinder, P., Perona, P., Belongie, S.: Visual recognition with humans in the loop. In: Proc. ECCV (2010) 2. Chen, D.M., Baatz, G., Koser, K., Tsai, S.S., Vedantham, R., Pylvanainen, T., Roimela, K., Chen, X., Bach, J., Pollefeys, M., et al.: City-scale landmark identification on mobile devices. In: Proc. CVPR (2011) 3. Crandall, D.J., Backstrom, L., Huttenlocher, D., Kleinberg, J.: Mapping the world s photos. In: Proceedings of the 18th international conference on World wide web (2009) 4. Doersch, C., Singh, S., Gupta, A., Sivic, J., Efros, A.A.: What makes paris look like paris? ACM Transactions on Graphics (TOG) (2012) 5. Donahue, J., Jia, Y., Vinyals, O., Hoffman, J., Zhang, N., Tzeng, E., Darrell, T.: Decaf: A deep convolutional activation feature for generic visual recognition. arxiv preprint arxiv: (2013) 6. Fan, R.E., Chang, K.W., Hsieh, C.J., Wang, X.R., Lin, C.J.: Liblinear: A library for large linear classification. The Journal of Machine Learning Research (2008) 7. Hays, J., Efros, A.A.: Im2gps: estimating geographic information from a single image. In: Proc. CVPR (2008) 8. Khosla, A., An, B., Lim, J.J., Torralba, A.: Looking beyond the visible scene. In: Proc. CVPR (2014) 9. Kisilevich, S., Krstajic, M., Keim, D., Andrienko, N., Andrienko, G.: Event-based analysis of people s activities and behavior using flickr and panoramio geotagged photo collections. In: Information Visualisation (IV), th International Conference (2010) 10. Krizhevsky, A., Sutskever, I., Hinton, G.E.: Imagenet classification with deep convolutional neural networks. In: In Advances in Neural Information Processing Systems (2012) 11. Lee, Y.J., Efros, A.A., Hebert, M.: Style-aware mid-level representation for discovering visual connections in space and time. In: Proc. ICCV (2013) 12. Li, X., Wu, C., Zach, C., Lazebnik, S., Frahm, J.M.: Modeling and recognition of landmark image collections using iconic scene graphs. In: Proc. ECCV (2008) 13. Li, Y., Crandall, D.J., Huttenlocher, D.P.: Landmark classification in large-scale image collections. In: Proc. ICCV (2009) 14. Lin, T.Y., Belongie, S., Hays, J.: Cross-view image geolocalization. In: Proc. CVPR (2013) 15. Lynch, K.: The image of the city. MIT press (1960) 16. Nasar, J.L.: The evaluative image of the city. Sage Publications Thousand Oaks, CA (1998) 17. Newman, M.E.: Modularity and community structure in networks. Proceedings of the National Academy of Sciences (2006) 18. Oliva, A., Torralba, A.: Modeling the shape of the scene: A holistic representation of the spatial envelope. Int l Journal of Computer Vision (2001) 19. Parikh, D., Grauman, K.: Relative attributes. In: Proc. ICCV (2011) 20. Patterson, G., Hays, J.: Sun attribute database: Discovering, annotating, and recognizing scene attributes. In: Proc. CVPR (2012) 21. Preoţiuc-Pietro, D., Cranshaw, J., Yano, T.: Exploring venue-based city-to-city similarity measures. In: Proceedings of the 2nd ACM SIGKDD International Workshop on Urban Computing (2013)
16 16 Bolei Zhou et al. 22. Proshansky, H.M., Fabian, A.K., Kaminoff, R.: Place-identity: Physical world socialization of the self. Journal of environmental psychology (1983) 23. Ripley, B.D.: Spatial statistics, vol John Wiley & Sons (2005) 24. Salesses, P., Schechtner, K., Hidalgo, C.A.: The collaborative image of the city: mapping the inequality of urban perception. PloS one (2013) 25. Seth, R., Covell, M., Ravichandran, D., Sivakumar, D., Baluja, S.: A tale of two (similar) cities: Inferring city similarity through geo-spatial query log analysis. In: Proceedings of the International Conference on Knowledge Discovery and Information Retrieval (2011) 26. Unit, E.I.: Best cities ranking and report. In: The Economist (2012) 27. Unit, E.I.: Global liveability ranking and report. In: The Economist (2013) 28. Xiao, J., Hays, J., Ehinger, K.A., Oliva, A., Torralba, A.: Sun database: Large-scale scene recognition from abbey to zoo. In: Proc. CVPR (2010) 29. Zhang, H., Korayem, M., Crandall, D.J., LeBuhn, G.: Mining photo-sharing websites to study ecological phenomena. In: Proceedings of the 21st international conference on World Wide Web (2012) 30. Zheng, Y.T., Zhao, M., Song, Y., Adam, H., Buddemeier, U., Bissacco, A., Brucher, F., Chua, T.S., Neven, H.: Tour the world: building a web-scale landmark recognition engine. In: Proc. CVPR (2009)
Urban land use information retrieval based on scene classification of Google Street View images
 Urban land use information retrieval based on scene classification of Google Street View images Xiaojiang Li 1, Chuanrong Zhang 1 1 Department of Geography, University of Connecticut, Storrs Email: {xiaojiang.li;chuanrong.zhang}@uconn.edu
Global Scene Representations. Tilke Judd
 Global Scene Representations Tilke Judd Papers Oliva and Torralba [2001] Fei Fei and Perona [2005] Labzebnik, Schmid and Ponce [2006] Commonalities Goal: Recognize natural scene categories Extract features
Photo Tourism and im2gps: 3D Reconstruction and Geolocation of Internet Photo Collections Part II
 Photo Tourism and im2gps: 3D Reconstruction and Geolocation of Internet Photo Collections Part II Noah Snavely Cornell James Hays CMU MIT (Fall 2009) Brown (Spring 2010 ) Complexity of the Visual World
Distinguish between different types of scenes. Matching human perception Understanding the environment
 Scene Recognition Adriana Kovashka UTCS, PhD student Problem Statement Distinguish between different types of scenes Applications Matching human perception Understanding the environment Indexing of images
Style-aware Mid-level Representation for Discovering Visual Connections in Space and Time
 Style-aware Mid-level Representation for Discovering Visual Connections in Space and Time Experiment presentation for CS3710:Visual Recognition Presenter: Zitao Liu University of Pittsburgh ztliu@cs.pitt.edu
Two at Once: Enhancing Learning and Generalization Capacities via IBN-Net
 Two at Once: Enhancing Learning and Generalization Capacities via IBN-Net Supplementary Material Xingang Pan 1, Ping Luo 1, Jianping Shi 2, and Xiaoou Tang 1 1 CUHK-SenseTime Joint Lab, The Chinese University
Slides of BCL. ID of the slides 56. How to cite.
 ID of the slides 56 Slides of BCL www.beijingcitylab.com How to cite Author(s), Year, Title, Slides at Beijing City Lab, http://www.beijingcitylab.com E.g. Long Y, 2014, Automated identification and characterization
Deep Convolutional Neural Networks for Pairwise Causality
 Deep Convolutional Neural Networks for Pairwise Causality Karamjit Singh, Garima Gupta, Lovekesh Vig, Gautam Shroff, and Puneet Agarwal TCS Research, Delhi Tata Consultancy Services Ltd. {karamjit.singh,
arxiv: v1 [cs.cv] 11 May 2015 Abstract
![arxiv: v1 [cs.cv] 11 May 2015 Abstract](/thumbs/80/80674557.jpg "arxiv: v1 [cs.cv] 11 May 2015 Abstract") Training Deeper Convolutional Networks with Deep Supervision Liwei Wang Computer Science Dept UIUC lwang97@illinois.edu Chen-Yu Lee ECE Dept UCSD chl260@ucsd.edu Zhuowen Tu CogSci Dept UCSD ztu0@ucsd.edu
Training Deeper Convolutional Networks with Deep Supervision Liwei Wang Computer Science Dept UIUC lwang97@illinois.edu Chen-Yu Lee ECE Dept UCSD chl260@ucsd.edu Zhuowen Tu CogSci Dept UCSD ztu0@ucsd.edu
Place this Photo on a Map: A Study of Explicit Disclosure of Location Information
 Place this Photo on a Map: A Study of Explicit Disclosure of Location Information Fabien Girardin 1, Josep Blat 1 1 Department of ICT, Pompeu Fabra University, 08003 Barcelona, Spain {Fabien.Girardin,
GeoFaceExplorer: Exploring the Geo-Dependence of Facial Attributes
 GeoFaceExplorer: Exploring the Geo-Dependence of Facial Attributes ABSTRACT Connor Greenwell University of Kentucky csgr222@uky.edu Richard Souvenir UNC Charlotte souvenir@uncc.edu The images uploaded
Geographic Knowledge Discovery Using Ground-Level Images and Videos
 This work was funded in part by a DOE Early Career award, an NSF CAREER award (#IIS- 1150115), and a PECASE award. We gratefully acknowledge NVIDIA for their donated hardware. Geographic Knowledge Discovery
Toward Correlating and Solving Abstract Tasks Using Convolutional Neural Networks Supplementary Material
 Toward Correlating and Solving Abstract Tasks Using Convolutional Neural Networks Supplementary Material Kuan-Chuan Peng Cornell University kp388@cornell.edu Tsuhan Chen Cornell University tsuhan@cornell.edu
Domain adaptation for deep learning
 What you saw is not what you get Domain adaptation for deep learning Kate Saenko Successes of Deep Learning in AI A Learning Advance in Artificial Intelligence Rivals Human Abilities Deep Learning for
Orbital Insight Energy: Oil Storage v5.1 Methodologies & Data Documentation
 Orbital Insight Energy: Oil Storage v5.1 Methodologies & Data Documentation Overview and Summary Orbital Insight Global Oil Storage leverages commercial satellite imagery, proprietary computer vision algorithms,
Mining Tourist Routes from Flickr Photos
 Mining Tourist Routes from Flickr Photos Evaggelos Spyrou Computational Intelligence Laboratory (CIL) Institute of Informatics and Telecommunications National Center for Scientific Research-Demokritos
The state of the art and beyond
 Feature Detectors and Descriptors The state of the art and beyond Local covariant detectors and descriptors have been successful in many applications Registration Stereo vision Motion estimation Matching
DETECTING HUMAN ACTIVITIES IN THE ARCTIC OCEAN BY CONSTRUCTING AND ANALYZING SUPER-RESOLUTION IMAGES FROM MODIS DATA INTRODUCTION
 DETECTING HUMAN ACTIVITIES IN THE ARCTIC OCEAN BY CONSTRUCTING AND ANALYZING SUPER-RESOLUTION IMAGES FROM MODIS DATA Shizhi Chen and YingLi Tian Department of Electrical Engineering The City College of
Assessing pervasive user-generated content to describe tourist dynamics
 Assessing pervasive user-generated content to describe tourist dynamics Fabien Girardin, Josep Blat Universitat Pompeu Fabra, Barcelona, Spain {Fabien.Girardin, Josep.Blat}@upf.edu Abstract. In recent
Multiple Similarities Based Kernel Subspace Learning for Image Classification
 Multiple Similarities Based Kernel Subspace Learning for Image Classification Wang Yan, Qingshan Liu, Hanqing Lu, and Songde Ma National Laboratory of Pattern Recognition, Institute of Automation, Chinese
Prediction of Citations for Academic Papers
 000 001 002 003 004 005 006 007 008 009 010 011 012 013 014 015 016 017 018 019 020 021 022 023 024 025 026 027 028 029 030 031 032 033 034 035 036 037 038 039 040 041 042 043 044 045 046 047 048 049 050
Fantope Regularization in Metric Learning
 Fantope Regularization in Metric Learning CVPR 2014 Marc T. Law (LIP6, UPMC), Nicolas Thome (LIP6 - UPMC Sorbonne Universités), Matthieu Cord (LIP6 - UPMC Sorbonne Universités), Paris, France Introduction
Iterative Laplacian Score for Feature Selection
 Iterative Laplacian Score for Feature Selection Linling Zhu, Linsong Miao, and Daoqiang Zhang College of Computer Science and echnology, Nanjing University of Aeronautics and Astronautics, Nanjing 2006,
A Hierarchical, Multi-modal Approach for Placing Videos on the Map using Millions of Flickr Photographs
 A Hierarchical, Multi-modal Approach for Placing Videos on the Map using Millions of Flickr Photographs Pascal Kelm Communication Systems Group Technische Universität Berlin Germany kelm@nue.tu-berlin.de
Sound Recognition in Mixtures
 Sound Recognition in Mixtures Juhan Nam, Gautham J. Mysore 2, and Paris Smaragdis 2,3 Center for Computer Research in Music and Acoustics, Stanford University, 2 Advanced Technology Labs, Adobe Systems
CS570 Data Mining. Anomaly Detection. Li Xiong. Slide credits: Tan, Steinbach, Kumar Jiawei Han and Micheline Kamber.
 CS570 Data Mining Anomaly Detection Li Xiong Slide credits: Tan, Steinbach, Kumar Jiawei Han and Micheline Kamber April 3, 2011 1 Anomaly Detection Anomaly is a pattern in the data that does not conform
Detection of Metadata Tampering through Discrepancy between Image Content and Metadata using Multi-task Deep Learning
 Detection of Metadata Tampering through Discrepancy between Image Content and Metadata using Multi-task Deep Learning Bor-Chun Chen University of Maryland College Park sirius@umd.edu Pallabi Ghosh University
Asaf Bar Zvi Adi Hayat. Semantic Segmentation
 Asaf Bar Zvi Adi Hayat Semantic Segmentation Today s Topics Fully Convolutional Networks (FCN) (CVPR 2015) Conditional Random Fields as Recurrent Neural Networks (ICCV 2015) Gaussian Conditional random
Discriminative Direction for Kernel Classifiers
 Discriminative Direction for Kernel Classifiers Polina Golland Artificial Intelligence Lab Massachusetts Institute of Technology Cambridge, MA 02139 polina@ai.mit.edu Abstract In many scientific and engineering
Empirical Discriminative Tensor Analysis for Crime Forecasting
 Empirical Discriminative Tensor Analysis for Crime Forecasting Yang Mu 1, Wei Ding 1, Melissa Morabito 2, Dacheng Tao 3, 1 Department of Computer Science, University of Massachusetts Boston,100 Morrissey
CS 3710: Visual Recognition Describing Images with Features. Adriana Kovashka Department of Computer Science January 8, 2015
 CS 3710: Visual Recognition Describing Images with Features Adriana Kovashka Department of Computer Science January 8, 2015 Plan for Today Presentation assignments + schedule changes Image filtering Feature
Lecture 13 Visual recognition
 Lecture 13 Visual recognition Announcements Silvio Savarese Lecture 13-20-Feb-14 Lecture 13 Visual recognition Object classification bag of words models Discriminative methods Generative methods Object
Inferring Friendship from Check-in Data of Location-Based Social Networks
 Inferring Friendship from Check-in Data of Location-Based Social Networks Ran Cheng, Jun Pang, Yang Zhang Interdisciplinary Centre for Security, Reliability and Trust, University of Luxembourg, Luxembourg
Crowdsourcing approach for large scale mapping of built-up land
 Crowdsourcing approach for large scale mapping of built-up land Kavinda Gunasekara Kavinda@ait.asia Geoinformatics Center Asian Institute of Technology, Thailand. Regional expert workshop on land accounting
Fine-grained Classification
 Fine-grained Classification Marcel Simon Department of Mathematics and Computer Science, Germany marcel.simon@uni-jena.de http://www.inf-cv.uni-jena.de/ Seminar Talk 23.06.2015 Outline 1 Motivation 2 3
Exploring the Patterns of Human Mobility Using Heterogeneous Traffic Trajectory Data
 Exploring the Patterns of Human Mobility Using Heterogeneous Traffic Trajectory Data Jinzhong Wang April 13, 2016 The UBD Group Mobile and Social Computing Laboratory School of Software, Dalian University
Anticipating Visual Representations from Unlabeled Data. Carl Vondrick, Hamed Pirsiavash, Antonio Torralba
 Anticipating Visual Representations from Unlabeled Data Carl Vondrick, Hamed Pirsiavash, Antonio Torralba Overview Problem Key Insight Methods Experiments Problem: Predict future actions and objects Image
ATINER's Conference Paper Series PLA
 ATINER CONFERENCE PAPER SERIES No: LNG2014-1176 Athens Institute for Education and Research ATINER ATINER's Conference Paper Series PLA2015-1709 A Tool for Quantifying the Urban Gradient Agnes Lipovits
DM-Group Meeting. Subhodip Biswas 10/16/2014
 DM-Group Meeting Subhodip Biswas 10/16/2014 Papers to be discussed 1. Crowdsourcing Land Use Maps via Twitter Vanessa Frias-Martinez and Enrique Frias-Martinez in KDD 2014 2. Tracking Climate Change Opinions
Hierarchical Visual Feature Analysis for City Street View Datasets
 Hierarchical Visual Feature Analysis for City Street View Datasets Lezhi Li, James Tompkin, Panagiotis Michalatos, and Hanspeter Pfister Fig. 1. Exploring perceptual neighborhood with our hierarchical
Neural Networks. Single-layer neural network. CSE 446: Machine Learning Emily Fox University of Washington March 10, /9/17
 3/9/7 Neural Networks Emily Fox University of Washington March 0, 207 Slides adapted from Ali Farhadi (via Carlos Guestrin and Luke Zettlemoyer) Single-layer neural network 3/9/7 Perceptron as a neural
HYPERGRAPH BASED SEMI-SUPERVISED LEARNING ALGORITHMS APPLIED TO SPEECH RECOGNITION PROBLEM: A NOVEL APPROACH
 HYPERGRAPH BASED SEMI-SUPERVISED LEARNING ALGORITHMS APPLIED TO SPEECH RECOGNITION PROBLEM: A NOVEL APPROACH Hoang Trang 1, Tran Hoang Loc 1 1 Ho Chi Minh City University of Technology-VNU HCM, Ho Chi
Towards a Data-driven Approach to Exploring Galaxy Evolution via Generative Adversarial Networks
 Towards a Data-driven Approach to Exploring Galaxy Evolution via Generative Adversarial Networks Tian Li tian.li@pku.edu.cn EECS, Peking University Abstract Since laboratory experiments for exploring astrophysical
RAGAV VENKATESAN VIJETHA GATUPALLI BAOXIN LI NEURAL DATASET GENERALITY
 RAGAV VENKATESAN VIJETHA GATUPALLI BAOXIN LI NEURAL DATASET GENERALITY SIFT HOG ALL ABOUT THE FEATURES DAISY GABOR AlexNet GoogleNet CONVOLUTIONAL NEURAL NETWORKS VGG-19 ResNet FEATURES COMES FROM DATA
Reading, UK 1 2 Abstract
 , pp.45-54 http://dx.doi.org/10.14257/ijseia.2013.7.5.05 A Case Study on the Application of Computational Intelligence to Identifying Relationships between Land use Characteristics and Damages caused by
Layer-wise Relevance Propagation for Neural Networks with Local Renormalization Layers
 Layer-wise Relevance Propagation for Neural Networks with Local Renormalization Layers Alexander Binder 1, Grégoire Montavon 2, Sebastian Lapuschkin 3, Klaus-Robert Müller 2,4, and Wojciech Samek 3 1 ISTD
arxiv: v1 [cs.lg] 3 Jan 2017
![arxiv: v1 [cs.lg] 3 Jan 2017](/thumbs/85/91755568.jpg "arxiv: v1 [cs.lg] 3 Jan 2017") Deep Convolutional Neural Networks for Pairwise Causality Karamjit Singh, Garima Gupta, Lovekesh Vig, Gautam Shroff, and Puneet Agarwal TCS Research, New-Delhi, India January 4, 2017 arxiv:1701.00597v1
Deep Convolutional Neural Networks for Pairwise Causality Karamjit Singh, Garima Gupta, Lovekesh Vig, Gautam Shroff, and Puneet Agarwal TCS Research, New-Delhi, India January 4, 2017 arxiv:1701.00597v1
From Research Objects to Research Networks: Combining Spatial and Semantic Search
 From Research Objects to Research Networks: Combining Spatial and Semantic Search Sara Lafia 1 and Lisa Staehli 2 1 Department of Geography, UCSB, Santa Barbara, CA, USA 2 Institute of Cartography and
Spatial Decision Tree: A Novel Approach to Land-Cover Classification
 Spatial Decision Tree: A Novel Approach to Land-Cover Classification Zhe Jiang 1, Shashi Shekhar 1, Xun Zhou 1, Joseph Knight 2, Jennifer Corcoran 2 1 Department of Computer Science & Engineering 2 Department
Kernel Density Topic Models: Visual Topics Without Visual Words
 Kernel Density Topic Models: Visual Topics Without Visual Words Konstantinos Rematas K.U. Leuven ESAT-iMinds krematas@esat.kuleuven.be Mario Fritz Max Planck Institute for Informatics mfrtiz@mpi-inf.mpg.de
Classification of Hand-Written Digits Using Scattering Convolutional Network
 Mid-year Progress Report Classification of Hand-Written Digits Using Scattering Convolutional Network Dongmian Zou Advisor: Professor Radu Balan Co-Advisor: Dr. Maneesh Singh (SRI) Background Overview
Dynamic Data Modeling, Recognition, and Synthesis. Rui Zhao Thesis Defense Advisor: Professor Qiang Ji
 Dynamic Data Modeling, Recognition, and Synthesis Rui Zhao Thesis Defense Advisor: Professor Qiang Ji Contents Introduction Related Work Dynamic Data Modeling & Analysis Temporal localization Insufficient
Spatial Analysis I. Spatial data analysis Spatial analysis and inference
 Spatial Analysis I Spatial data analysis Spatial analysis and inference Roadmap Outline: What is spatial analysis? Spatial Joins Step 1: Analysis of attributes Step 2: Preparing for analyses: working with
GOVERNMENT GIS BUILDING BASED ON THE THEORY OF INFORMATION ARCHITECTURE
 GOVERNMENT GIS BUILDING BASED ON THE THEORY OF INFORMATION ARCHITECTURE Abstract SHI Lihong 1 LI Haiyong 1,2 LIU Jiping 1 LI Bin 1 1 Chinese Academy Surveying and Mapping, Beijing, China, 100039 2 Liaoning
Predicting Geo-informative Attributes in Large-scale Image Collections using Convolutional Neural Networks
 Predicting Geo-informative Attributes in Large-scale Image Collections using Convolutional Neural Networks Stefan Lee Haipeng Zhang David J. Crandall School of Informatics and Computing Indiana University
Sky Segmentation in the Wild: An Empirical Study
 Sky Segmentation in the Wild: An Empirical Study Radu P. Mihail 1 Scott Workman 2 Zach Bessinger 2 Nathan Jacobs 2 rpmihail@valdosta.edu scott@cs.uky.edu zach@cs.uky.edu jacobs@cs.uky.edu 1 Valdosta State
Chapter 3 Large-Scale Image Geolocalization
 Chapter 3 Large-Scale Image Geolocalization James Hays and Alexei A. Efros Abstract In this chapter, we explore the task of global image geolocalization estimating where on the Earth a photograph was captured.
Introducing GIS analysis
 1 Introducing GIS analysis GIS analysis lets you see patterns and relationships in your geographic data. The results of your analysis will give you insight into a place, help you focus your actions, or
Reconnaissance d objetsd et vision artificielle
 Reconnaissance d objetsd et vision artificielle http://www.di.ens.fr/willow/teaching/recvis09 Lecture 6 Face recognition Face detection Neural nets Attention! Troisième exercice de programmation du le
Lecture 2. Judging the Performance of Classifiers. Nitin R. Patel
 Lecture 2 Judging the Performance of Classifiers Nitin R. Patel 1 In this note we will examine the question of how to udge the usefulness of a classifier and how to compare different classifiers. Not only
Deep Domain Adaptation by Geodesic Distance Minimization
 Deep Domain Adaptation by Geodesic Distance Minimization Yifei Wang, Wen Li, Dengxin Dai, Luc Van Gool EHT Zurich Ramistrasse 101, 8092 Zurich yifewang@ethz.ch {liwen, dai, vangool}@vision.ee.ethz.ch Abstract
38 1 Vol. 38, No ACTA AUTOMATICA SINICA January, Bag-of-phrases.. Image Representation Using Bag-of-phrases
 38 1 Vol. 38, No. 1 2012 1 ACTA AUTOMATICA SINICA January, 2012 Bag-of-phrases 1, 2 1 1 1, Bag-of-words,,, Bag-of-words, Bag-of-phrases, Bag-of-words DOI,, Bag-of-words, Bag-of-phrases, SIFT 10.3724/SP.J.1004.2012.00046
Large-scale classification of traffic signs under real-world conditions
 Large-scale classification of traffic signs under real-world conditions Lykele Hazelhoff a,b, Ivo Creusen a,b, Dennis van de Wouw a,b and Peter H.N. de With a,b a CycloMedia Technology B.V., Achterweg
Nonlinear Classification
 Nonlinear Classification INFO-4604, Applied Machine Learning University of Colorado Boulder October 5-10, 2017 Prof. Michael Paul Linear Classification Most classifiers we ve seen use linear functions
Correlation Autoencoder Hashing for Supervised Cross-Modal Search
 Correlation Autoencoder Hashing for Supervised Cross-Modal Search Yue Cao, Mingsheng Long, Jianmin Wang, and Han Zhu School of Software Tsinghua University The Annual ACM International Conference on Multimedia
OVERLAPPING ANIMAL SOUND CLASSIFICATION USING SPARSE REPRESENTATION
 OVERLAPPING ANIMAL SOUND CLASSIFICATION USING SPARSE REPRESENTATION Na Lin, Haixin Sun Xiamen University Key Laboratory of Underwater Acoustic Communication and Marine Information Technology, Ministry
The Changing Landscape of Land Administration
 The Changing Landscape of Land Administration B r e n t J o n e s P E, PLS E s r i World s Largest Media Company No Journalists No Content Producers No Photographers World s Largest Hospitality Company
Geo-identification and pedestrian navigation with geo-mobile applications: how do users proceed?
 TU Vienna presentation 17 th July 2008 Geo-identification and pedestrian navigation with geo-mobile applications: how do users proceed? Ioannis Delikostidis Corné van Elzakker INTERNATIONAL INSTITUTE FOR
1. Introduction. S.S. Patil 1, Sachidananda 1, U.B. Angadi 2, and D.K. Prabhuraj 3
 Cloud Publications International Journal of Advanced Remote Sensing and GIS 2014, Volume 3, Issue 1, pp. 525-531, Article ID Tech-249 ISSN 2320-0243 Research Article Open Access Machine Learning Technique
Exploring Human Mobility with Multi-Source Data at Extremely Large Metropolitan Scales. ACM MobiCom 2014, Maui, HI
 Exploring Human Mobility with Multi-Source Data at Extremely Large Metropolitan Scales Desheng Zhang & Tian He University of Minnesota, USA Jun Huang, Ye Li, Fan Zhang, Chengzhong Xu Shenzhen Institute
Analysis of the Tourism Locations of Chinese Provinces and Autonomous Regions: An Analysis Based on Cities
 Chinese Journal of Urban and Environmental Studies Vol. 2, No. 1 (2014) 1450004 (9 pages) World Scientific Publishing Company DOI: 10.1142/S2345748114500043 Analysis of the Tourism Locations of Chinese
Aspect Term Extraction with History Attention and Selective Transformation 1
 Aspect Term Extraction with History Attention and Selective Transformation 1 Xin Li 1, Lidong Bing 2, Piji Li 1, Wai Lam 1, Zhimou Yang 3 Presenter: Lin Ma 2 1 The Chinese University of Hong Kong 2 Tencent
Machine learning comes from Bayesian decision theory in statistics. There we want to minimize the expected value of the loss function.
 Bayesian learning: Machine learning comes from Bayesian decision theory in statistics. There we want to minimize the expected value of the loss function. Let y be the true label and y be the predicted
CS4495/6495 Introduction to Computer Vision. 8C-L3 Support Vector Machines
 CS4495/6495 Introduction to Computer Vision 8C-L3 Support Vector Machines Discriminative classifiers Discriminative classifiers find a division (surface) in feature space that separates the classes Several
James Hays and Alexei A. Efros Carnegie Mellon University
 IM2GPS: estimating geographic information from a single image James Hays and Alexei A. Efros Carnegie Mellon University Abstract Estimating geographic information from an image is an excellent, difficult
Urban Geo-Informatics John W Z Shi
 Urban Geo-Informatics John W Z Shi Urban Geo-Informatics studies the regularity, structure, behavior and interaction of natural and artificial systems in the urban context, aiming at improving the living
CSE446: Neural Networks Spring Many slides are adapted from Carlos Guestrin and Luke Zettlemoyer
 CSE446: Neural Networks Spring 2017 Many slides are adapted from Carlos Guestrin and Luke Zettlemoyer Human Neurons Switching time ~ 0.001 second Number of neurons 10 10 Connections per neuron 10 4-5 Scene
CITS 4402 Computer Vision
 CITS 4402 Computer Vision A/Prof Ajmal Mian Adj/A/Prof Mehdi Ravanbakhsh Lecture 06 Object Recognition Objectives To understand the concept of image based object recognition To learn how to match images
Spectral Hashing: Learning to Leverage 80 Million Images
 Spectral Hashing: Learning to Leverage 80 Million Images Yair Weiss, Antonio Torralba, Rob Fergus Hebrew University, MIT, NYU Outline Motivation: Brute Force Computer Vision. Semantic Hashing. Spectral
Spatial Information Retrieval
 Spatial Information Retrieval Wenwen LI 1, 2, Phil Yang 1, Bin Zhou 1, 3 [1] Joint Center for Intelligent Spatial Computing, and Earth System & GeoInformation Sciences College of Science, George Mason
Deep Learning (CNNs)
") 10-601 Introduction to Machine Learning Machine Learning Department School of Computer Science Carnegie Mellon University Deep Learning (CNNs) Deep Learning Readings: Murphy 28 Bishop - - HTF - - Mitchell
10-601 Introduction to Machine Learning Machine Learning Department School of Computer Science Carnegie Mellon University Deep Learning (CNNs) Deep Learning Readings: Murphy 28 Bishop - - HTF - - Mitchell
Understanding and Measuring Urban Expansion
 VOLUME 1: AREAS AND DENSITIES 21 CHAPTER 3 Understanding and Measuring Urban Expansion THE CLASSIFICATION OF SATELLITE IMAGERY The maps of the urban extent of cities in the global sample were created using
Neural networks and optimization
 Neural networks and optimization Nicolas Le Roux Criteo 18/05/15 Nicolas Le Roux (Criteo) Neural networks and optimization 18/05/15 1 / 85 1 Introduction 2 Deep networks 3 Optimization 4 Convolutional
RaRE: Social Rank Regulated Large-scale Network Embedding
 RaRE: Social Rank Regulated Large-scale Network Embedding Authors: Yupeng Gu 1, Yizhou Sun 1, Yanen Li 2, Yang Yang 3 04/26/2018 The Web Conference, 2018 1 University of California, Los Angeles 2 Snapchat
Supplementary Material SPNet: Shape Prediction using a Fully Convolutional Neural Network
 Supplementary Material SPNet: Shape Prediction using a Fully Convolutional Neural Network S M Masudur Rahman Al Arif 1, Karen Knapp 2 and Greg Slabaugh 1 1 City, University of London 2 University of Exeter
A method of Area of Interest and Shooting Spot Detection using Geo-tagged Photographs
 A method of Area of Interest and Shooting Spot Detection using Geo-tagged Photographs Motohiro Shirai Graduate School of Informatics, Shizuoka University 3-5-1 Johoku, Naka-ku Hamamatsu-shi, Shizuoka,
Spatial Data Science. Soumya K Ghosh
 Workshop on Data Science and Machine Learning (DSML 17) ISI Kolkata, March 28-31, 2017 Spatial Data Science Soumya K Ghosh Professor Department of Computer Science and Engineering Indian Institute of Technology,
Mobility Analytics through Social and Personal Data. Pierre Senellart
 Mobility Analytics through Social and Personal Data Pierre Senellart Session: Big Data & Transport Business Convention on Big Data Université Paris-Saclay, 25 novembre 2015 Analyzing Transportation and
18.9 SUPPORT VECTOR MACHINES
 744 Chapter 8. Learning from Examples is the fact that each regression problem will be easier to solve, because it involves only the examples with nonzero weight the examples whose kernels overlap the
Improving the travel time prediction by using the real-time floating car data
 Improving the travel time prediction by using the real-time floating car data Krzysztof Dembczyński Przemys law Gawe l Andrzej Jaszkiewicz Wojciech Kot lowski Adam Szarecki Institute of Computing Science,
Machine Learning to Automatically Detect Human Development from Satellite Imagery
 Technical Disclosure Commons Defensive Publications Series April 24, 2017 Machine Learning to Automatically Detect Human Development from Satellite Imagery Matthew Manolides Follow this and additional
Predictive analysis on Multivariate, Time Series datasets using Shapelets
 1 Predictive analysis on Multivariate, Time Series datasets using Shapelets Hemal Thakkar Department of Computer Science, Stanford University hemal@stanford.edu hemal.tt@gmail.com Abstract Multivariate,
 DEIM Forum 04 E-3 43 80 3 5 / DC 43 80 3 5 90065 6-6 43 80 3 5 E-mail: gs3007@s.inf.shizuoka.ac.jp, dgs538@s.inf.shizuoka.ac.jp, ishikawa-hiroshi@sd.tmu.ac.jp, yokoyama@inf.shizuoka.ac.jp Flickr Exif OpenLayers
Extracting Touristic Information from Online Image Collections
 2012 Eighth International Conference on Signal Image Technology and Internet Based Systems Extracting Touristic Information from Online Image Collections Edoardo Ardizzone *, Francesco Di Miceli **, Marco
Classification goals: Make 1 guess about the label (Top-1 error) Make 5 guesses about the label (Top-5 error) No Bounding Box
 Make 5 guesses about the label (Top-5 error) No Bounding Box") ImageNet Classification with Deep Convolutional Neural Networks Alex Krizhevsky, Ilya Sutskever, Geoffrey E. Hinton Motivation Classification goals: Make 1 guess about the label (Top-1 error) Make 5 guesses
ImageNet Classification with Deep Convolutional Neural Networks Alex Krizhevsky, Ilya Sutskever, Geoffrey E. Hinton Motivation Classification goals: Make 1 guess about the label (Top-1 error) Make 5 guesses
Parking Occupancy Prediction and Pattern Analysis
 Parking Occupancy Prediction and Pattern Analysis Xiao Chen markcx@stanford.edu Abstract Finding a parking space in San Francisco City Area is really a headache issue. We try to find a reliable way to
Real Estate Price Prediction with Regression and Classification CS 229 Autumn 2016 Project Final Report
 Real Estate Price Prediction with Regression and Classification CS 229 Autumn 2016 Project Final Report Hujia Yu, Jiafu Wu [hujiay, jiafuwu]@stanford.edu 1. Introduction Housing prices are an important
Encoder Based Lifelong Learning - Supplementary materials
 Encoder Based Lifelong Learning - Supplementary materials Amal Rannen Rahaf Aljundi Mathew B. Blaschko Tinne Tuytelaars KU Leuven KU Leuven, ESAT-PSI, IMEC, Belgium firstname.lastname@esat.kuleuven.be
A MULTISCALE APPROACH TO DETECT SPATIAL-TEMPORAL OUTLIERS
 A MULTISCALE APPROACH TO DETECT SPATIAL-TEMPORAL OUTLIERS Tao Cheng Zhilin Li Department of Land Surveying and Geo-Informatics The Hong Kong Polytechnic University Hung Hom, Kowloon, Hong Kong Email: {lstc;
TUTORIAL PART 1 Unsupervised Learning
 TUTORIAL PART 1 Unsupervised Learning Marc'Aurelio Ranzato Department of Computer Science Univ. of Toronto ranzato@cs.toronto.edu Co-organizers: Honglak Lee, Yoshua Bengio, Geoff Hinton, Yann LeCun, Andrew