Global Analysis of Urban Population Distributions and the Physical Environment
|
|
|
- Silvia Curtis
- 6 years ago
- Views:
Transcription
1 Global Analysis of Urban Population Distributions and the Physical Environment Christopher Small Lamont Doherty Earth Observatory Columbia University Palisades, NY USA Urbanization represents a significant recent change in the human habitat. The physical environment of modern urban areas is very different from the environments in which humans evolved and from those of the modern rural settlements that serve as population catchment areas for growing cities. In this sense, migration from rural to urban areas is a form of rapid environmental change that has affected a large fraction of the human population in the past century. This paper presents results of a global spatial analysis of modern urban population distribution with respect to several environmental parameters related to continental physiography and climate. Some of the differences between urban and rural population distributions can be illustrated by comparison of the areal extent of human population to spatial variations in local population density. The spatial distribution of population on Earth's potentially habitable landmass is extremely non-uniform. A large fraction of the current population lives in dense settlements occupying a very small fraction of the available land area. These dense populations span a wide range of climatic environments but are extremely localized with respect to continental physiography. The results of this analysis demonstrate the strong correspondence between continental physiography and settlement patterns and the extent to which humans have adapted to a wide range of climatic conditions. The implication is that adaptation to climate allows the expansion of the human habitat while the physical characteristics of the landscape induce a simultaneous spatial concentration of population within the expanding habitat. These factors have implications for impacts of climate change and natural hazards on urban sustainability. Introduction Human adaptation to the physical environment has resulted in habitation of almost every biome on Earth yet the current rate of urbanization represents a significant transition of the human habitat. Within the past 40,000 years the human habitat has expanded over almost all of Earth's ice-free land area. Within the past 4000 years humans have intensified settlement in areas conducive to agriculture and begun to localize in cities (Hassan, 1981). Within the past 40 years the growth rate of large cities has accelerated to the point where the majority of humans will soon live in urban environments (United Nations, 1999). This represents a significant recent change in the human habitat. Physical environments favorable to hunter-gatherers are fundamentally different from those favorable to pastoralists and agriculturists (Reader, 1988). Similarly, urban settlements often exist in areas unfavorable for agriculture. Throughout most of recorded history the majority of humans have engaged in agriculture so the recent large scale migration to urban centers represents an significant evolutionary transition for the human species. The purpose of this analysis is to quantify the extent to which modern human settlement patterns, specifically large urban areas, occupy different physical environments and to consider the implications of this migration for the sustainability of urban centers. 1
2 The environment of a large city is fundamentally different from the environment of smaller settlements in rural settings. The environments differ in terms of physical, biological, social and cultural factors (e.g. Berry, 1990). The focus of this discussion is on the physical factors. The other factors are at least as important as the physical factors but the physical factors are probably the most amenable to simple analysis at global scales. One significant difference between the urban environment and traditional human habitats is related to the energy balance. Solar energy flux is, by far, the largest and most persistent form of energetic exchange that most humans are exposed to on a daily basis (Landsberg, 1981). Interestingly, most of this energy is not exploited and an increasing number of humans expend significant amounts of resources in attempts to counteract the effects of solar energy flux. In most rural environments, humans live amidst moderately abundant vegetation but in most urban environments, vegetation is relatively sparse. Vegetation cover has a profound influence on solar energy flux (Figure 1). Vegetation absorbs radiation in the most energetic part of the solar spectrum to conduct photosynthesis. The unused fraction of the incoming solar energy is either transpired with water or reflected at Near Infrared wavelengths. Most building materials used in the urban mosaic absorb a significant fraction of this incoming solar energy and reradiate it as sensable heat resulting in the Urban Heat Island phenemenon (Oke, 1982). An increasing percentage of the human population lives in urban areas where this heat induces physical stress and even loss of life during heatwaves. While the average temperature difference between urban and rural environments is small compared to the range of temperatures humans have adapted to, the nature of the physical space in urban areas tends to compound the effect of the heat island. The combination of higher temperature, restricted airflow and increased ozone and particulate concentrations creates a distinct physical environment associated with urban settlements at local scales (Landsberg, 1981). On a regional scale, there is also evidence that areally extensive urban landcover may influence albedo and transpiration enough to influence local weather patterns near large cities (Bornstein & Lin, 2000). Both deliberate and inadvertent human modification of the physical environment occur at different spatial scales. For the purposes of this discussion, micro refers to scales ranging from the individual to hundreds of meters while local scale covers the range from hundreds to tens of thousands of meters and regional refers to scales between tens and hundreds of kilometers. Although humans seem to be influencing the physical environment at all of these scales, deliberate manipulation of the physical environment is limited to micro and local scales. When available, significant resources are expended on "climate control" at the scale of residences and workspaces. Cities represent extensive habitat modification on scales of tens of kilometers but this modification rarely encompasses deliberate manipulation of physical conditions at these scales. Light levels and water flow are often controlled at local scales but human influence on air temperature and quality is largely inadvertent. At regional and global scales, human influence on these components of the physical environment is not well understood but it could not be considered direct intentional manipulation. Questions related to human modification the physical environment at regional and global scales have been the subject of extensive research within the global change research community for several years now (e.g. Turner et al, 1990), but the the study of local scale urban environments is still a comparatively new field. A complementary, and equally important, form of global change is occurring with the expansion of these urban environments where much of the world's population now resides. 2

3
4 The current demographic shift from sparsely populated rural to densely populated urban environments is a distinct form of global change. It is distinct from other types of global change in the sense that a rapidly increasing number of people are experiencing environmental change, not only as result of the environment of a particular location changing, but also as a result of growth centers shifting to different physical environments. The regional physical environment of urban areas is often different from the physical environments of its catchment areas in the rural hinterlands so the localization of populations in cities can result in the exposure of large numbers of people to different regional scale physical environments. On a smaller scale, locations where cities evolve are generally physiographically distinct from those of the nearby agricultural production regions. In some cases, this localization may result in dense habitation of hazard-prone sites (Figure 2). This is often a consequence of the physiography and climate of the city's location. The following analysis will quantify the extent of this localization and the relationship of the densely populated areas to physiographic and climatic characteristics of the physical environment. Urban Population Distribution In this global analysis, population distribution and density are determined from the latest Gridded Population of the World (GPW2) population dataset produced by CIESIN in 1999 (CIESIN, 2000, Deichmann et al, 2001). This compilation of 127,105 census estimates provides a median spatial resolution of 31 km, and allows 90% of the 1990 global population to be located to within 88 km (Small and Cohen, 2002). For the purposes of a global analysis, this dataset provides more than adequate spatial resolution relative to the regional environmental variables that will be considered. Each of the census estimates links a population count to an administrative area. Dividing the population count by the area provides an average population density for that area and allows the population to be distributed evenly over the area of the administrative unit (Tobler et al, 1999). The spatial resolution of the population data supports inference at scales of tens of kilometers. For the purposes of this analysis, urban areas and populations within the GPW2 dataset will be considered as those with a population density greater than 1000 people/sq.km. Justification for using this threshold density is provided by Pozzi and Small, (2001). In addition to dense populations, we will also consider the urban population living in large cities. In this case, large cities will be considered those with populations greater than 1,000,000 people. The United Nations (1998) provides an enumeration of 290 cities with populations greater than 1 million in The total population of these 290 cities is 795,009,000 people. By considering both administratively defined large urban areas and dense population two complementary measures of global urban population can be evaluated relative to different physical environmental factors. The global spatial distribution of human population is extremely nonuniform. Figure 3a shows the spatial distribution of population density at a global scale. Figure 3c shows the corresponding distribution of people as a function of population density for the global dataset. It is immediately apparent that most of Earth s land surface is sparsely populated at densities less than 10 people/km 2 while most of the people on Earth live at population densities greater than 100 people/km 2, The global map shows considerable spatial variation in population density but the range of densities is so large that it is difficult to appreciate the extent of clustering because so many people are concentrated in urban areas that are not visible at a global scale. 4

5
6
7 The degree of spatial clustering of population can be summarized with a spatial Lorenz curve. Plotting the cumulative population as a function of cumulative land area for increasing population density shows the percentage of land area occupied by the corresponding percentage of population. Uniform spatial distribution of population would yield a linear relationship (30% of population on 30% of the land area, 80% on 80% etc.) and increasing curvature indicates increasing clustering. The spatial Lorenz curve in Figure 4 shows that the global population is strongly clustered with 50% of the world s population inhabiting less than 3% of available land area (excluding Antarctica) at average densities greater than 300 people/km 2, This clustering of population is significant because it emphasizes the simultaneous abundance of potentially habitable land area and preferential dense settlement of a small fraction of this land area. The next part of the analysis considers the physical environmental characteristics of the densely populated areas relative to those of the entire inhabited area of Earth's landmass. Continental Physiography, Climate and Cities Populations are not uniformly distributed on Earth's landmass and neither are physical environments. Quantifying the spatial coincidence of populations and environments can give some indication of the factors that may influence human settlement patterns. The spatial relationship between population and the physical environment can be quantified by calculating the distribution of people with respect to a particular parameter that characterizes the environment. Environments are often described in terms of climatic parameters related to temperature and precipitation. Both of these parameters vary appreciably at different temporal and spatial scales so averages are often used to summarize the climate of specific locations. Environments are also characterized by landscape or continental physiography. Physiographic parameters that might be expected to influence human habitation include elevation and proximity to coastlines and rivers. All of these quantities can be measured or estimated to different degrees of accuracy and resolution and used as a basis on which to calculate global distributions of land area and population. A more detailed discussion of this type of analysis is given by Small and Cohen (1999, 2002). Global maps of these and other environmental parameters are available online at: The distribution of population with respect to continental physiographic parameters is extremely localized. In this context, localization refers to clustering of population within a range of parameter values (like temperature or elevation) that is significantly smaller than the total available range. Figure 5 shows global distributions of population and land area with respect to elevation, permanent rivers and sea coasts. It is immediately apparent that population decreases monotonically with elevation and distance from rivers and coasts. To some extent this is a consequence of the fact that the amount of available land area also diminishes. When the number of people at a given distance (or elevation) is divided by the total land area available at that distance (or elevation) the resulting Integrated Population Density (IPD) gives some indication of how densely a particular distance (or elevation) is populated relative to other distances (or elevations). The IPD curves shown on figure 5 indicate the extent to which the land areas at low elevations, near coasts and rivers is more densely populated than land areas farther away. These curves give an indication of the relative density but tend to de-emphasize the absolute numbers. For example, the spike in IPD at 2300 m elevation corresponds to the densely populated Mexican plateau. Although the integrated density of the plateau is comparable to the high integrated densities at sea level, the upper histogram indicates that there are many more people living near sea level than on the Mexican plateau. 7
8
9
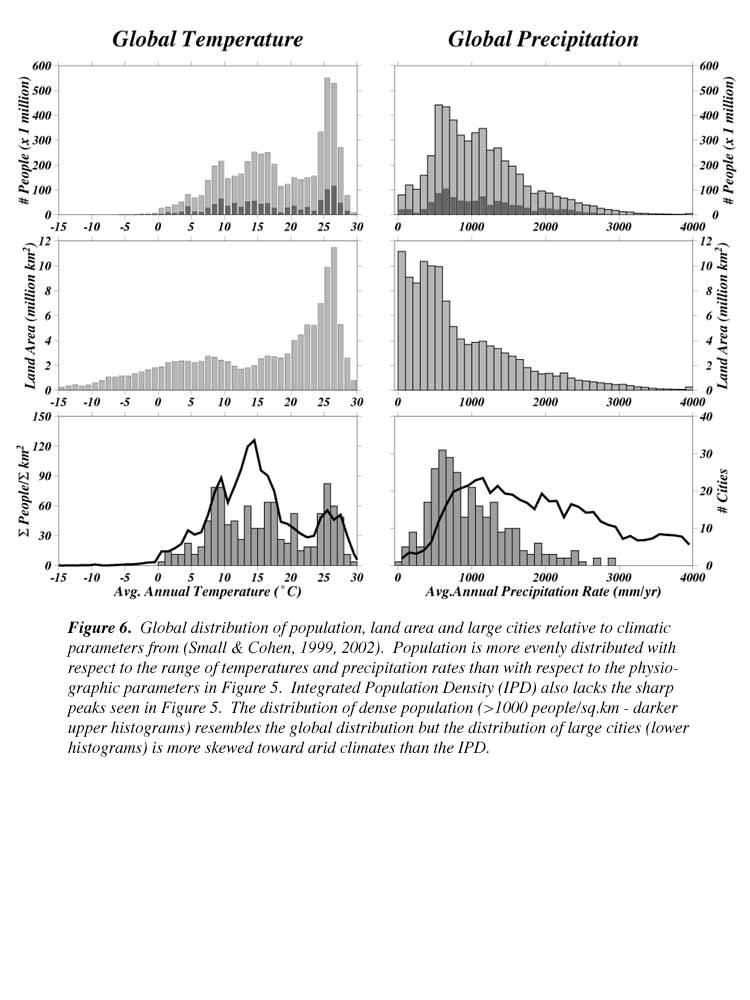
10 The distributions of dense population and large cities are also extremely localized with respect to physiographic environment The darker population histograms superimposed on the global histograms in Figure 5 show the distribution of people at high population densities with respect to these parameters. The peaked distributions of high density population are even more pronounced than the global distribution, particularly with respect to fluvial and coastal proximity. This emphasizes the preferential settlement of these physiographic environments at urban densities. The lower histograms superimposed on the IPD curves show the distribution of large cities with respect to these parameters. It is apparent that the large cities are even more strongly localized in these physiographic environments. The global distribution of population with respect to climatic parameters is not strongly localized. Figure 6 shows distributions of people, land area and large cities with respect to 30 year averages of temperature and precipitation. While these distributions are hardly uniform, they are not dominated by sharp peaks and monotonic decreases as the physiographic parameters are. The distributions of dense populations and large cities are even less localized with respect to these climatic parameters. The distribution of dense population resembles the overall distribution in nearly even proportion for both parameters. The distribution of large cities is multimodal for temperature and somewhat skewed toward arid environments relative to global population as indicated by the IPD. The implication is that climate imposes less of a constraint on the locations of cities relative to sparser agrarian populations. A more detailed analysis of climatic parameters is provided by Small and Cohen (1999, 2002). Taken together, the distributions of global population, dense populations and large cities have implications for the comparative influence of physiographic and climatic components of the physical environment. This simple analysis does not account for microclimate or the temporal components of climatic environment and, as such, should not be over interpreted. The point is to demonstrate how strongly populations and cities are localized relative to physiographic parameters on a global scale. Climate is obviously a very important influence on human settlement but it is presumably less of a constraint on dense urban settlements than on sparse agrarian populations. This analysis quantifies the extent to which urban populations are environmentally localized compared to the overall global population. The implication is that adaptation to climate change allows the expansion of the human habitat while the physical characteristics of the landscape drive a simultaneous spatial concentration of population within the expanding habitat. This impacts the sustainability of urban settlements because the physiographic environments discussed here are often associated with natural hazards. Low elevation river basins and coastal zones are especially susceptible to the extreme weather events that some climate change scenarios show increases for. The tendency for cities to evolve in hazard prone physiographic environments combined with the increasing shift of populations from rural to urban environments implies that more people will be exposed to natural hazards as this transition progresses. Dense settlements in hazard prone locations expose large numbers of people to risk but at the same time the financial and organizational resources of some cities may allow for more effective hazard mitigation than would be possible for dispersed populations. In any case, the current growth rate of urban populations suggests that the impact of natural hazards on the global population may change. Acknowledgments This paper was presented in connection with the Socioeconomic Data and Applications Center ( The research was funded by the UCAR Visiting Scientist Program ( and the Columbia Earth Institute in connection with the NASA SocioEconomic Data and Applications Center (SEDAC). Copyright Christopher Small,
11 References Berry, B. L. (1990). Urbanization. The Earth as Transformed by Human Action. B. L. T. II, W. C. Clark, R. W. Kates et al. Cambridge, Cambridge University Press: Bornstein, R. and Q. Lin (2000). Urban heat islands and summertime convective thunderstorms in Atlanta: three case studies. Atmospheric Environment 34: Center for International Earth Science Information Network (CIESIN), Columbia University; International Food Policy Research Institute (IFPRI); and World Resources Institute (WRI) Gridded Population of theworld (GPW), Version 2. Palisades, NY: CIESIN, Columbia University. Available at Cohen, J.E., and C. Small, 1998, Hypsographic Demography: The distribution of human population by altitude, Proceedings of the National Academy of Sciences, November Deichmann, Uwe, Deborah Balk and Greg Yetman, Transforming Population Data for Interdisciplanary Usages: From Census to Grid, unpublished manuscript available on-line at: Hassan, F. A. (1981). Demographic Archaeology. New York, Academic Press. Landsberg, H. E. (1981). The Urban Climate. New York, Academic Press. Oke, T. R. (1982). The energetic basis of the urban heat island. Quarterly Journal of the Royal Meteorological Society 108(1): 24. Pozzi, F. and C. Small (2001). Exploratory analysis of suburban land cover and population density in the U.S.A. IEEE/ISPRS Conference on Remote Sensing and Data Fusion over Urban Areas, Rome, Italy, IEEE Press. Reader, J. (1988). Man on Earth. Austin, Texas, University of Texas Press. Small, C. and J. E. Cohen (1999). Continental physiography, climate and the global distrubution of human population. International Symposium on Digital Earth, Beijing, China, Chinese Academy of Sciences. Small, C. and J. E. Cohen (2001). Continental physiography, climate and the global distribution of human population. Current Anthropology Submitted. Tobler, W., U. Deichmann, et al. (1997). World population in a grid of spherical quadrilaterals. International Journal of Population Geography 3: Turner, B. L. I., W. C. Clark, et al., Eds. (1990). The Earth as Transformed by Human Action. Cambridge, UK, Cambridge University Press. United, Nations. (1998). World Urbanization Prospects: 1996 Revision United Nations Department of Economic and Social Affairs, Population Division, ST/ESA/SER.A/170. United, Nations. (1999). Prospects for Urbanization Revision, United Nations Department of Economic and Social Affairs, Population Division. 11
Multiresolution Analysis of Urban Reflectance
 Multiresolution Analysis of Urban Reflectance Christopher Small Lamont Doherty Earth Observatory Columbia University Palisades, NY 10964 USA small@ldeo.columbia.edu Reprinted from: IEEE/ISPRS joint Workshop
MODELING THE DISTRIBUTION OF HUMAN POPULATION WITH NIGHT-TIME SATELLITE IMAGERY AND GRIDDED POPULATION OF THE WORLD INTRODUCTION
 MODELING THE DISTRIBUTION OF HUMAN POPULATION WITH NIGHT-TIME SATELLITE IMAGERY AND GRIDDED POPULATION OF THE WORLD Francesca Pozzi, CIESIN Christopher Small, Lamont-Doherty Earth Observatory Gregory Yetman,
Deborah Balk 1,2 Gordon McGranahan 3 Bridget Anderson 2
 Preference and Risks of Coastal Population Distribution: A systematic assessment of population and land area in urban and rural areas of coastal zones. Deborah Balk 1,2 Gordon McGranahan 3 Bridget Anderson
Städte im Klimawandel...
 10.000 Städte im Klimawandel... Was wissen wir dank GIS? Steffen Kriewald 19. November 2014 Global Urbanization: 75% 50% WUP 14 Cities are most responsible for Climate Change... Climate Change highly threatens
Gridded Population of the World Version 4 (GPWv4)
") Gridded Population of the World Version 4 (GPWv4) Greg Yetman Chris Small Erin Doxsey-Whitfield Kytt MacManus May 28, 2015 Global Urbanization Workshop http://sedac.ciesin.columbia.edu 1 Focus on applying
Gridded Population of the World Version 4 (GPWv4) Greg Yetman Chris Small Erin Doxsey-Whitfield Kytt MacManus May 28, 2015 Global Urbanization Workshop http://sedac.ciesin.columbia.edu 1 Focus on applying
Urbanization in Japan since 1960 viewed from the DID Statistics
 Institute of Geography, Asahikawa Campus Hokkaido University of Education Asahikawa, 070-8621, Japan 1. Introduction Urban expansion is one of the most important features of land use/cover changes in the
Research Article A Quantitative Assessment of Surface Urban Heat Islands Using Satellite Multitemporal Data over Abeokuta, Nigeria
 International Atmospheric Sciences Volume 2016, Article ID 3170789, 6 pages http://dx.doi.org/10.1155/2016/3170789 Research Article A Quantitative Assessment of Surface Urban Heat Islands Using Satellite
G E O G RAP H Y Geomorphology: Climatology : Oceanography: Geographic Thought : Population Geography :
 GEOGRAPHY SYALLABUS Geomorphology: Fundamental concepts; Endogenetic and Exogenetic forces; Denudation and weathering; Geosynclines, continental drift and plate tectonics; Concept of geomorphic cycle;
Lessons Learned from the production of Gridded Population of the World Version 4 (GPW4) Columbia University, CIESIN, USA EFGS October 2014
 Columbia University, CIESIN, USA EFGS October 2014") Lessons Learned from the production of Gridded Population of the World Version 4 (GPW4) Columbia University, CIESIN, USA EFGS October 2014 Gridded Population of the World Gridded (raster) data product
Lessons Learned from the production of Gridded Population of the World Version 4 (GPW4) Columbia University, CIESIN, USA EFGS October 2014 Gridded Population of the World Gridded (raster) data product
Geography GCSE. Year 9 Term and Topic Unit Content Homework Opportunities
 Geography GCSE Year 9 Term and Topic Unit Content Homework Opportunities Autumn Term 1: Geographical Skills Autumn Term 2: Tectonic Hazards Spring Term 1: Ecosystems Rainforest Students are required to
City definitions. Sara Ben Amer. PhD Student Climate Change and Sustainable Development Group Systems Analysis Division
 City definitions Sara Ben Amer PhD Student Climate Change and Sustainable Development Group Systems Analysis Division sbea@dtu.dk Contents 1. Concept of a city 2. Need for the city definition? 3. Challenges
PÀ ÁðlPÀ gádå G À Áå ÀPÀgÀ CºÀðvÁ ÀjÃPÉë KARNATAKA STATE ELIGIBILITY TEST FOR LECTUERSHIP
 PÀ ÁðlPÀ gádå G À Áå ÀPÀgÀ CºÀðvÁ ÀjÃPÉë KARNATAKA STATE ELIGIBILITY TEST FOR LECTUERSHIP Subject: GEOGRAPHY Subject Code: 08 Note: There will be two question papers, Paper-II and Paper-III. Paper II will
Subject Area: Geography
 Long Term Planning Overview Key Stage 3 Subject Area: Geography Academic : 08-9 7 Assessment Your Island Home the physical and human geography of the UK and will investigate weather patterns, population
Arizona Educator Proficiency Assessments (AEPA ) FIELD 04: GEOGRAPHY TEST OBJECTIVES
 FIELD 04: GEOGRAPHY TEST OBJECTIVES") Arizona Educator Proficiency Assessments (AEPA ) TEST OBJECTIVES Subarea Range of Objectives Approximate Test Proportions I. Geographic Concepts and Skills 1 6 25% II. World Geography 7 14 34% III. United
Arizona Educator Proficiency Assessments (AEPA ) TEST OBJECTIVES Subarea Range of Objectives Approximate Test Proportions I. Geographic Concepts and Skills 1 6 25% II. World Geography 7 14 34% III. United
Switching to AQA from Edexcel: Draft Geography AS and A-level (teaching from September 2016)
") Switching to AQA from Edexcel: Draft Geography AS and A-level (teaching from September 2016) If you are thinking of switching from OCR to AQA (from September 2016), this resource is an easy reference guide.
Switching to AQA from Edexcel: Draft Geography AS and A-level (teaching from September 2016) If you are thinking of switching from OCR to AQA (from September 2016), this resource is an easy reference guide.
What is Climate? Understanding and predicting climatic changes are the basic goals of climatology.
 What is Climate? Understanding and predicting climatic changes are the basic goals of climatology. Climatology is the study of Earth s climate and the factors that affect past, present, and future climatic
Ethiopian Journal of Environmental Studies and Management Vol. 6 No
 EVALUATION OF URBANIZATION INFLUENCES ON URBAN WINDS OF KENYAN CITIES *ONGOMA, V., 1 MUTHAMA, N. J., 2 and GITAU, W. 2 http://dx.doi.org/10.4314/ejesm.v6i3.1 Received 27th July 2012; accepted 12th March
Understanding and Measuring Urban Expansion
 VOLUME 1: AREAS AND DENSITIES 21 CHAPTER 3 Understanding and Measuring Urban Expansion THE CLASSIFICATION OF SATELLITE IMAGERY The maps of the urban extent of cities in the global sample were created using
AP Human Geography Free Response Questions Categorized
 AP Human Geography Free Response Questions Categorized 2002-2010 2. Population (13-17%) 3. Over the past 150 years, Europe has changed from a source to a destination region for international migration.
A Case Study of Regional Dynamics of China 中国区域动态案例研究
 A Case Study of Regional Dynamics of China 中国区域动态案例研究 Shuming Bao Spatial Data Center & China Data Center University of Michigan 1:00 PM - 2:00 PM, Tue, Feb 6, 2018 EST USA A Case Study of Regional Dynamics
A GLOBAL ANALYSIS OF URBAN REFLECTANCE. Christopher SMALL
 A GLOBAL ANALYSIS OF URBAN REFLECTANCE Christopher SMALL Lamont Doherty Earth Observatory Columbia University Palisades, NY 10964 USA small@ldeo.columbia.edu ABSTRACT Spectral characterization of urban
The Atmosphere and Atmospheric Energy Chapter 3 and 4
 The Atmosphere and Atmospheric Energy Chapter 3 and 4 Size of the Earth s Atmosphere Atmosphere produced over 4.6 billion years of development Protects us from radiation Completely surrounds the earth
By Geri Flanary To accompany AP Human Geography: A Study Guide 3 rd edition By Ethel Wood
 Session 1 By Geri Flanary To accompany AP Human Geography: A Study Guide 3 rd edition By Ethel Wood WHAT IS DEMOGRAPHY? It is the scientific or statistical study of population. It comes from the Greek
Land Use/Cover Changes & Modeling Urban Expansion of Nairobi City
 Land Use/Cover Changes & Modeling Urban Expansion of Nairobi City Overview Introduction Objectives Land use/cover changes Modeling with Cellular Automata Conclusions Introduction Urban land use/cover types
Social Science Data for High Latitudes
 LCLUC Science Team Meeting High Latitudes in the Context of the International Polar Year Social Science Data for High Latitudes 2 May 2008 Dr. Robert S. Chen Director and Senior Research Scientist, CIESIN
Belfairs Academy GEOGRAPHY Fundamentals Map
 YEAR 12 Fundamentals Unit 1 Contemporary Urban Places Urbanisation Urbanisation and its importance in human affairs. Global patterns of urbanisation since 1945. Urbanisation, suburbanisation, counter-urbanisation,
Graduate Courses Meteorology / Atmospheric Science UNC Charlotte
 Graduate Courses Meteorology / Atmospheric Science UNC Charlotte In order to inform prospective M.S. Earth Science students as to what graduate-level courses are offered across the broad disciplines of
DEPARTMENT OF GEOGRAPHY B.A. PROGRAMME COURSE DESCRIPTION
 DEPARTMENT OF GEOGRAPHY B.A. PROGRAMME COURSE DESCRIPTION (3 Cr. Hrs) (2340100) Geography of Jordan (University Requirement) This Course pursues the following objectives: - The study the physical geographical
Identifying Global Natural Disaster Hotspots
 Identifying Global Natural Disaster Hotspots Gregory Yetman and Robert S. Chen Center for International Earth Science Information Network (CIESIN), Columbia University Abstract The World Bank and Columbia
Liana Talaue McManus. Division of Marine Affairs and Policy Rosenstiel School of Marine & Atmospheric Science University of Miami
 Liana Talaue McManus Division of Marine Affairs and Policy Rosenstiel School of Marine & Atmospheric Science University of Miami Outline 1. Coasts as vulnerable & resilient social ecological systems 2.
USING DOWNSCALED POPULATION IN LOCAL DATA GENERATION
 USING DOWNSCALED POPULATION IN LOCAL DATA GENERATION A COUNTRY-LEVEL EXAMINATION CONTENT Research Context and Approach. This part outlines the background to and methodology of the examination of downscaled
Analysis on Climate Change of Guangzhou in Nearly 65 Years
 , pp.111-117 http://dx.doi.org/10.14257/astl.2016.138.24 Analysis on Climate Change of Guangzhou in Nearly 65 Years Wenzheng Yu, Haitao Liu, Chunyong Yin, Jin Wang College of Environmental Science and
Local Climate Zones. Origins, development, and application to urban heat islands. Iain Stewart and Tim Oke
 Local Climate Zones Origins, development, and application to urban heat islands Iain Stewart and Tim Oke Department Geography University of British Columbia Vancouver CANADA Annual Meeting of the American
Atmospheric Composition and Structure
 Atmospheric Composition and Structure Weather and Climate What is weather? The state of the atmosphere at a specific time and place. Defined by: Humidity, temperature, wind speed, clouds, precipitation,
INDIANA ACADEMIC STANDARDS FOR SOCIAL STUDIES, WORLD GEOGRAPHY. PAGE(S) WHERE TAUGHT (If submission is not a book, cite appropriate location(s))
 WHERE TAUGHT (If submission is not a book, cite appropriate location(s))") Prentice Hall: The Cultural Landscape, An Introduction to Human Geography 2002 Indiana Academic Standards for Social Studies, World Geography (Grades 9-12) STANDARD 1: THE WORLD IN SPATIAL TERMS Students
Prentice Hall: The Cultural Landscape, An Introduction to Human Geography 2002 Indiana Academic Standards for Social Studies, World Geography (Grades 9-12) STANDARD 1: THE WORLD IN SPATIAL TERMS Students
Mutah university faculty of Social Sciences The Study plan of the department of Geography 2006/2007
 Mutah university faculty of Social Sciences The Study plan of the department of Geography 2006/2007 Requirements university compulsory 22 Credit hours Course No Credit hours Prerequisite Requirements Faculty
GRAAD 12 NATIONAL SENIOR CERTIFICATE GRADE 12
 GRAAD 12 NATIONAL SENIOR CERTIFICATE GRADE 12 GEOGRAPHY P1 FEBRUARY/MARCH 2013 MARKS: 300 TIME: 3 hours This question paper consists of 11 pages and a 12-page annexure. Geography/P1 2 DBE/Feb. Mar. 2013
Your web browser (Safari 7) is out of date. For more security, comfort and the best experience on this site: Update your browser Ignore
 is out of date. For more security, comfort and the best experience on this site: Update your browser Ignore") Your web browser (Safari 7) is out of date. For more security, comfort and the best experience on this site: Update your browser Ignore DOGGERL AND - THE EU RO PE THAT WAS The British Isles were once neither
Your web browser (Safari 7) is out of date. For more security, comfort and the best experience on this site: Update your browser Ignore DOGGERL AND - THE EU RO PE THAT WAS The British Isles were once neither
Jun Tu. Department of Geography and Anthropology Kennesaw State University
 Examining Spatially Varying Relationships between Preterm Births and Ambient Air Pollution in Georgia using Geographically Weighted Logistic Regression Jun Tu Department of Geography and Anthropology Kennesaw
What do we think of our cities?
 What do we think of our cities? Do we think of cities as beautiful places? Are cities healthy places to live? Do most of the world s people live in cities? Do cities function like other natural systems,
How Will Melting Ice Sheets Affect Us?
 PASSAGE 4 How Will Melting Ice Sheets Affect Us? Variation is normal. During the last ice age, for example, ice sheets also covered much of North America and Scandinavia. Why is what s happening now different
Climates of NYS. Definitions. Climate Regions of NYS. Storm Tracks. Climate Controls 10/13/2011. Characteristics of NYS s Climates
 Definitions Climates of NYS Prof. Anthony Grande 2011 Weather and Climate Weather the state of the atmosphere at one point in time. The elements of weather are temperature, air pressure, wind and moisture.
Operational Definitions of Urban, Rural and Urban Agglomeration for Monitoring Human Settlements
 Operational Definitions of Urban, Rural and Urban Agglomeration for Monitoring Human Settlements By Markandey Rai United Nations Human Settlements Programme PO Box-30030 Nairobi, Kenya Abstract The United
MULTIPLE CHOICE. Choose the one alternative that best completes the statement or answers the question.
 Exam Name MULTIPLE CHOICE. Choose the one alternative that best completes the statement or answers the question. 1) One important feature of the world's population with the most significant future implications
Chapter 10 Human Settlement Geography Book 1 Class 12
 CHAPTER 10 HUMAN SETTLEMENTS 1. RURAL, SUB URBAN AND URBAN SETTLEMENTS: This classification is common worldwide but the criteria differ from country to country. 5. Criteria for classification differs from
Spatial Analysis of Natural Hazard and Climate Change Risks in Peri-Urban Expansion Areas of Dakar, Senegal
 1 Spatial Analysis of Natural Hazard and Climate Change Risks in Peri-Urban Expansion Areas of Dakar, Senegal URBAN WEEK 2009 BBL Preston Lounge Thursday, March 12, 2009 Christian Hoffmann GeoVille group
Measuring Disaster Risk for Urban areas in Asia-Pacific
 Measuring Disaster Risk for Urban areas in Asia-Pacific Acknowledgement: Trevor Clifford, Intl Consultant 1 SDG 11 Make cities and human settlements inclusive, safe, resilient and sustainable 11.1: By
CLIMATE READY BOSTON. Climate Projections Consensus ADAPTED FROM THE BOSTON RESEARCH ADVISORY GROUP REPORT MAY 2016
 CLIMATE READY BOSTON Sasaki Steering Committee Meeting, March 28 nd, 2016 Climate Projections Consensus ADAPTED FROM THE BOSTON RESEARCH ADVISORY GROUP REPORT MAY 2016 WHAT S IN STORE FOR BOSTON S CLIMATE?
DROUGHT ASSESSMENT USING SATELLITE DERIVED METEOROLOGICAL PARAMETERS AND NDVI IN POTOHAR REGION
 DROUGHT ASSESSMENT USING SATELLITE DERIVED METEOROLOGICAL PARAMETERS AND NDVI IN POTOHAR REGION Researcher: Saad-ul-Haque Supervisor: Dr. Badar Ghauri Department of RS & GISc Institute of Space Technology
Physical Geography: Patterns, Processes, and Interactions, Grade 11, University/College Expectations
 Geographic Foundations: Space and Systems SSV.01 explain major theories of the origin and internal structure of the earth; Page 1 SSV.02 demonstrate an understanding of the principal features of the earth
AP Human Geography Free-response Questions
 AP Human Geography Free-response Questions 2000-2010 2000-preliminary test 1. A student concludes from maps of world languages and religions that Western Europe has greater cultural diversity than the
CHAPTER 1 INTRODUCTION
 CHAPTER 1 INTRODUCTION Mean annual precipitation (MAP) is perhaps the most widely used variable in hydrological design, water resources planning and agrohydrology. In the past two decades one of the basic
Summary. The Ice Ages and Global Climate
 The Ice Ages and Global Climate Summary Earth s climate system involves the atmosphere, hydrosphere, lithosphere, and biosphere. Changes affecting it operate on time scales ranging from decades to millions
ENVIRONMENTAL VULNERABILITY INDICATORS OF THE COASTAL SLOPES OF SÃO PAULO, BRAZIL *
 ENVIRONMENTAL VULNERABILITY INDICATORS OF THE COASTAL SLOPES OF SÃO PAULO, BRAZIL * D ANTONA, Álvaro de O. (FCA, NEPO-Unicamp, Brazil) BUENO, Maria do Carmo D. (IBGE; IFCH-Unicamp, Brazil) IWAMA, Allan
Cycles, Systems and Changing Places 5 days
 AS Level Geography AQA Cycles, Systems and Changing Places 5 days Complete the fieldwork requirements for AS level students within physical and human environments. Fieldwork in these locations provides
TOPIC 8: POPULATION DISTRIBUTION AND URBANIZATION
 TOPIC 8: POPULATION DISTRIBUTION AND URBANIZATION Concept of population distribution Factors affecting population distribution and density Urbanization: Concept and issues associated Introduction WORLD
Rural Pennsylvania: Where Is It Anyway? A Compendium of the Definitions of Rural and Rationale for Their Use
 Rural Pennsylvania: Where Is It Anyway? A Compendium of the Definitions of Rural and Rationale for Their Use Pennsylvania Office of Rural Health 310 Nursing Sciences Building University Park, PA 16802
A Framework for the Study of Urban Health. Abdullah Baqui, DrPH, MPH, MBBS Johns Hopkins University
 This work is licensed under a Creative Commons Attribution-NonCommercial-ShareAlike License. Your use of this material constitutes acceptance of that license and the conditions of use of materials on this
Global City Definition
 Regional Training Workshop on Human Settlement Indicators Global City Definition Dennis Mwaniki Global Urban Observatory, Research and Capacity Development Branch, UN-Habitat Bangkok, Thailand Outline
Social Vulnerability Index. Susan L. Cutter Department of Geography, University of South Carolina
 Social Vulnerability Index Susan L. Cutter Department of Geography, University of South Carolina scutter@sc.edu Great Lakes and St. Lawrence Cities Initiative Webinar December 3, 2014 Vulnerability The
Earth Science Lesson Plan Quarter 2, Week 6, Day 1
 Earth Science Lesson Plan Quarter 2, Week 6, Day 1 1 Outcomes for Today Standard Focus: Earth Sciences 5.f students know the interaction of wind patterns, ocean currents, and mountain ranges results in
Definitions Weather and Climate Climates of NYS Weather Climate 2012 Characteristics of Climate Regions of NYS NYS s Climates 1.
 Definitions Climates of NYS Prof. Anthony Grande 2012 Weather and Climate Weather the state of the atmosphere at one point in time. The elements of weather are temperature, t air pressure, wind and moisture.
Spatiotemporal Monitoring of Urban Vegetation
 Spatiotemporal Monitoring of Urban Vegetation Christopher Small Lamont Doherty Earth Observatory, Columbia University, USA small@ldeo.columbia.edu Roberta Balstad Miller CIESIN Columbia University, USA
Name Per Date Earth Science Climate & Insolation Test
 Name Per Date Earth Science Climate & Insolation Test 1) Which graph best represents the general relationship between latitude and average surface temperature? 2) The diagram below shows the apparent path
SRJIS/BIMONTHLY/S. A. BORUDE. ( ) APPLICATION OF SPATIAL VARIATION URBAN DENSITY MODEL: A STUDY OF AHMEDNAGAR CITY, MAHARASHTRA, INDIA
 APPLICATION OF SPATIAL VARIATION URBAN DENSITY MODEL: A STUDY OF AHMEDNAGAR CITY, MAHARASHTRA, INDIA") APPLICATION OF SPATIAL VARIATION URBAN DENSITY MODEL: A STUDY OF AHMEDNAGAR CITY, MAHARASHTRA, INDIA S.A. Borude, Assistant Professor, PG, Dept. of Geography, Ahmednagar College, Ahmednagar, Maharashtra.
APPLICATION OF SPATIAL VARIATION URBAN DENSITY MODEL: A STUDY OF AHMEDNAGAR CITY, MAHARASHTRA, INDIA S.A. Borude, Assistant Professor, PG, Dept. of Geography, Ahmednagar College, Ahmednagar, Maharashtra.
Climate Modeling Dr. Jehangir Ashraf Awan Pakistan Meteorological Department
 Climate Modeling Dr. Jehangir Ashraf Awan Pakistan Meteorological Department Source: Slides partially taken from A. Pier Siebesma, KNMI & TU Delft Key Questions What is a climate model? What types of climate
Effects of Sea Level Rise in Florida
 Abstract International Research Journal of Earth Sciences ISSN 2321 2527 Int. Res.J. Earth Sci. Effects of Sea Level Rise in Florida Praveen Khanna, Udaya Kumar and Riyaz Ahamed Osankhan Department of
Introduction to the Gozo & Comino Local Plan
 Introduction to the Gozo & Comino Local Plan What is a Local Plan? A Local Plan is a land use document with written text (policies and justifications) and maps; Reconciles local needs with strategic considerations;
GACE Geography Assessment Test at a Glance
 GACE Geography Assessment Test at a Glance Updated June 2017 See the GACE Geography Assessment Study Companion for practice questions and preparation resources. Assessment Name Geography Grade Level 6
ESTIMATION OF LANDFORM CLASSIFICATION BASED ON LAND USE AND ITS CHANGE - Use of Object-based Classification and Altitude Data -
 ESTIMATION OF LANDFORM CLASSIFICATION BASED ON LAND USE AND ITS CHANGE - Use of Object-based Classification and Altitude Data - Shoichi NAKAI 1 and Jaegyu BAE 2 1 Professor, Chiba University, Chiba, Japan.
STAAR Vocabulary Words extracted directly from the standard and/or associated with the instruction of the content within the standard.
 STAAR Vocabulary Words extracted directly from the standard and/or associated with the instruction of the content within the standard. READINESS STANDARDS - World Geography (WG.1) History. The student
Climate Change and Biomes
 Climate Change and Biomes Key Concepts: Greenhouse Gas WHAT YOU WILL LEARN Biome Climate zone Greenhouse gases 1. You will learn the difference between weather and climate. 2. You will analyze how climate
International Journal of Scientific & Engineering Research, Volume 4, Issue 12, December-2013 ISSN
 29 Assessment of Green Space Requirement and Site Analysis in Colombo, Sri Lanka A Remote Sensing and GIS Approach I.P. Senanayake*1, W.D.D.P. Welivitiya1, P.M. Nadeeka1 ABSTRACT - Green space distribution
INTERNATIONAL JOURNAL OF GEOMATICS AND GEOSCIENCES Volume 2, No 1, 2011
 INTERNATIONAL JOURNAL OF GEOMATICS AND GEOSCIENCES Volume 2, No 1, 2011 Copyright 2010 All rights reserved Integrated Publishing services Research article ISSN 0976 4380 Spatio-Temporal changes of Land
Coastal Vulnerability Assessment in Semarang City, Indonesia Based on Sea Level Rise and Land Subsidence Scenarios
 Coastal Vulnerability Assessment in Semarang City, Indonesia Based on Sea Level Rise and Land Subsidence Scenarios I. M. Radjawane, D. Hartadi and W. R. Lusano Oceanography Research Division Fac. of Earth
Day 1 of Global Warming. Copyright 2008 Pearson Education, Inc., publishing as Pearson Benjamin Cummings
 Day 1 of Global Warming Copyright 2008 Pearson Education, Inc., publishing as Pearson Benjamin Cummings The Atmosphere Atmosphere = the thin layer (1/100 th of Earth s diameter) of gases that surrounds
Defining microclimates on Long Island using interannual surface temperature records from satellite imagery
 Defining microclimates on Long Island using interannual surface temperature records from satellite imagery Deanne Rogers*, Katherine Schwarting, and Gilbert Hanson Dept. of Geosciences, Stony Brook University,
Global Perspectives Goals & Objectives: (include numbers) Learning Essentials Materials/ Resources
 Learning Essentials Materials/ Resources") August/ September Early Civilizations Goal 1.6: Explain the rise of human civilization. 6-9.WHC.1.6.1 Describe types of evidence used by anthropologists, archaeologists, and other scholars to reconstruct
August/ September Early Civilizations Goal 1.6: Explain the rise of human civilization. 6-9.WHC.1.6.1 Describe types of evidence used by anthropologists, archaeologists, and other scholars to reconstruct
Geographical knowledge and understanding scope and sequence: Foundation to Year 10
 Geographical knowledge and understanding scope and sequence: Foundation to Year 10 Foundation Year 1 Year 2 Year 3 Year 4 Year 5 Year 6 Year level focus People live in places Places have distinctive features
AP * human Geography. Syllabus. Course Description. Course Description Materials. Course Goals
 AP * human Geography Syllabus Course Description AP Human Geography is a college-level, yearlong course designed to prepare students for the Advanced Placement (AP) Human Geography Exam. The goal of this
OCR 2008 AS and A level Geography Specification Mapping Guide
 OCR 2008 AS and A level Geography Specification Mapping Guide Contents Introduction Error! Bookmark not defined. Specification map: 2008 OCR AS and A level Geography 3 What's new? 10 Introduction This
Rio Santa Geodatabase Project
 Rio Santa Geodatabase Project Amanda Cuellar December 7, 2012 Introduction The McKinney research group (of which I am a part) collaborates with international and onsite researchers to evaluate the risks
Tracey Farrigan Research Geographer USDA-Economic Research Service
 Rural Poverty Symposium Federal Reserve Bank of Atlanta December 2-3, 2013 Tracey Farrigan Research Geographer USDA-Economic Research Service Justification Increasing demand for sub-county analysis Policy
Ice Sheets and Sea Level -- Concerns at the Coast (Teachers Guide)
") Ice Sheets and Sea Level -- Concerns at the Coast (Teachers Guide) Roughly 153 million Americans (~53% of the US population) live in coastal counties. World wide some 3 billion people live within 200 km
Ice Sheets and Sea Level -- Concerns at the Coast (Teachers Guide) Roughly 153 million Americans (~53% of the US population) live in coastal counties. World wide some 3 billion people live within 200 km
Chapter 3: Temperature
 Chapter 3: Temperature Elements of WAC (Basic Measurable Properties) 1. Temperature of Air 2. Humidity of Air 3. Cloud Cover (type and amount) 4. Precipitation (type and amount) 5. Air Pressure 6. Wind
P1.34 MULTISEASONALVALIDATION OF GOES-BASED INSOLATION ESTIMATES. Jason A. Otkin*, Martha C. Anderson*, and John R. Mecikalski #
 P1.34 MULTISEASONALVALIDATION OF GOES-BASED INSOLATION ESTIMATES Jason A. Otkin*, Martha C. Anderson*, and John R. Mecikalski # *Cooperative Institute for Meteorological Satellite Studies, University of
NGSS Example Bundles. Page 1 of 14
 Middle School Phenomenon Model Course 2 Bundle 2 Climate Diversity This is the second bundle of the Middle School Phenomenon Model Course 2. Each bundle has connections to the other bundles in the course,
Post Independence Trends of Urbanization and Role of Small and Medium Towns in Maharashtra- A Geographical Analysis
 Post Independence Trends of Urbanization and Role of Small and Medium Towns in Maharashtra- A Geographical Analysis A careful and systematic study of the process of urbanization and related factors is
Overview of proposed approach to the Desktop Study to inform discussion
 LTAS Phase 2: Climate Change Implications for the Human Settlements sector in South Africa Overview of proposed approach to the Desktop Study to inform discussion Project Team Project Lead: Crispian Olver
Improving rural statistics. Defining rural territories and key indicators of rural development
 Improving rural statistics Defining rural territories and key indicators of rural development Improving rural statistics Improving Rural Statistics In 2016, the Global Strategy to improve Agricultural
Approach of Estimating Tsunami Economic Losses in The. Okinawa Island with Scenario-based of Input-Output Table. and Okinawa Earthquake Sources
 ORIGINAL ARTICLE Approach of Estimating Tsunami Economic Losses in The Okinawa Island with Scenario-based of Input-Output Table and Okinawa Earthquake Sources Kwanchai Pakoksung 1*, Anawat Suppasri 1,
Geography for Life. Course Overview
 Geography for Life Description In Geography for Life students will explore the world around them. Using the six essential elements established by the National Geographic Society students will be able to
IMPACT OF URBAN EVOLUTION ON LAND-USE CHANGE OF SARGODHA CITY, PAKISTAN
 Impact of Urban Evolution on Land-Use Change of Sargodha City in Pakistan J. Sc. & Tech. Univ. Peshawar, 2015, 39 (2), 29-36. IMPACT OF URBAN EVOLUTION ON LAND-USE CHANGE OF SARGODHA CITY, PAKISTAN SAJJAD
Year 10 Geography Curriculum Plan. Geography Edexcel B (9-1) Investigating Geographical Issues (2016)
 Investigating Geographical Issues (2016)") Topic 1: Development Dynamics Paper 1 > Topic 2) Year 10 Geography Curriculum Plan Geography Edexcel B (9-1) Investigating Geographical Issues (2016) Key concept/ Key question Overview of the unit Assessment
Topic 1: Development Dynamics Paper 1 > Topic 2) Year 10 Geography Curriculum Plan Geography Edexcel B (9-1) Investigating Geographical Issues (2016) Key concept/ Key question Overview of the unit Assessment
Vol112, No11 Feb1, 2010 JOURNAL OF GEO2INFORMATION SC IENCE , CBERS IRS - P5, ;, : ; : E2mail: lreis1ac1cn [ 6-13 ]
![Vol112, No11 Feb1, 2010 JOURNAL OF GEO2INFORMATION SC IENCE , CBERS IRS - P5, ;, : ; : E2mail: lreis1ac1cn [ 6-13 ]](/thumbs/91/105645535.jpg "Vol112, No11 Feb1, 2010 JOURNAL OF GEO2INFORMATION SC IENCE , CBERS IRS - P5, ;, : ; : E2mail: lreis1ac1cn [ 6-13 ]") 12 1 2010 2 JOURNAL OF GEO2INFORMATION SC IENCE Vol112, No11 Feb1, 2010, 3, (, 100101) :,,,,,, CBERS IRS - P5, ;,, 20m 1km ;,, CBERS, 200m, 76% ; P5, 100m, 84% : ; ; ; 1 [ 4-5 ], GIS, [ 6-13 ], ( 1995
12 1 2010 2 JOURNAL OF GEO2INFORMATION SC IENCE Vol112, No11 Feb1, 2010, 3, (, 100101) :,,,,,, CBERS IRS - P5, ;,, 20m 1km ;,, CBERS, 200m, 76% ; P5, 100m, 84% : ; ; ; 1 [ 4-5 ], GIS, [ 6-13 ], ( 1995
CORRELATION BETWEEN URBAN HEAT ISLAND EFFECT AND THE THERMAL INERTIA USING ASTER DATA IN BEIJING, CHINA
 CORRELATION BETWEEN URBAN HEAT ISLAND EFFECT AND THE THERMAL INERTIA USING ASTER DATA IN BEIJING, CHINA Yurong CHEN a, *, Mingyi DU a, Rentao DONG b a School of Geomatics and Urban Information, Beijing
- continental vs. marine regimes
 (1 of 14) Further Reading: Chapter 05 of the text book Outline - continental vs. marine regimes - temperature structure of the atmosphere - seasonal variations - urban heat island (2 of 14) Introduction
Developing a global, people-based definition of cities and settlements
 Developing a global, people-based definition of cities and settlements Cooperation between: Directorate General for Regional and, Joint Research Centre, EUROSTAT (European Commission, European Union) OECD,
Deriving Spatially Refined Consistent Small Area Estimates over Time Using Cadastral Data
 Deriving Spatially Refined Consistent Small Area Estimates over Time Using Cadastral Data H. Zoraghein 1,*, S. Leyk 1, M. Ruther 2, B. P. Buttenfield 1 1 Department of Geography, University of Colorado,
Edexcel GCSE Geography A
 Edexcel GCSE Comparing the 2012 AQA GCSE specification with the new 2016 Edexcel specification This document is designed to help you compare the existing 2012 AQA GCSE specification (9030) with the new