Near field microscopy and optical spectroscopy Bringing some color to materials science Julio A. Soares, Ph.D.
|
|
|
- Roland Wade
- 6 years ago
- Views:
Transcription


1 2008 Advanced Materials Characterization Workshop Near field microscopy and optical spectroscopy Bringing some color to materials science Julio A. Soares, Ph.D. Sponsors: Sponsors: Supported by the U.S. Supported Department by the of Energy U.S. Department under grants of Energy DEFG02-07-ER46453 under grant DEFG02-91-ER45439 and DEFG02-07-ER University 2007 University of Illinois of Illinois Board of Board Trustees. of Trustees. All rights All reserved. rights reserved.
2 Optical characterization Visual characterization: Color Transparency Reflectivity Refractivity Luminosity absorption bands, thickness, homogeneity, composition, temperature, index of refraction, surface morphology/ nanostructure, etc. Colored glass optical filters 1

3 Optical characterization Visual characterization: Color Transparency Reflectivity Refractivity Luminosity absorption bands, thickness, homogeneity, composition, temperature, index of refraction, surface morphology/ nanostructure, etc. SiO 2 thin film with variable thickness Optics Express 12, 5789 (2004) 1

, and Amazon river")
4 Optical characterization Visual characterization: Color Transparency Reflectivity Refractivity Luminosity absorption bands, thickness, homogeneity, composition, temperature, index of refraction, surface morphology/ nanostructure, etc. Solimões and Negro rivers joining to form the Amazon river (right), and Amazon river joining with Tapajós river (left) 1

5 Optical characterization Visual characterization: Color Transparency Reflectivity Refractivity Luminosity absorption bands, thickness, homogeneity, composition, temperature, index of refraction, surface morphology/ nanostructure, etc. Steel being forged. 1

6 Optical characterization Visual characterization: Color Transparency Reflectivity Refractivity Luminosity absorption bands, thickness, homogeneity, composition, temperature, index of refraction, surface morphology/ nanostructure, etc. Birefringent crystal. 1


7 Optical characterization Visual characterization: Color Transparency Reflectivity Refractivity Luminosity absorption bands, thickness, homogeneity, composition, temperature, index of refraction, surface morphology/ nanostructure, etc. Structural color of butterfly wings Prum, et al. Journal of Experimental Biology 209, (2006) 1
. Modulation spectroscopy thermoreflectance (pump-probe). 2 2008 2007 University of Illinois Board of Trustees.")
8 Optical spectroscopy Spectrophotometry (UV-VIS-NIR). Fourier transform infra-red spectroscopy (FTIR). Raman spectroscopy. Luminescence spectroscopy photoluminescence (PL). Ellipsometry. Sum frequency generation (SFG). Modulation spectroscopy thermoreflectance (pump-probe) University of Illinois Board of Trustees. All rights reserved.
9 Spectrophotometry (UV-VIS-NIR) What is measured? The transmission, reflection and absorption of light as a function of the incident photon energy. Basic principle: When a material interacts with light, the manner it does so depends on the material electronic, atomic, and morphological structure. Thus by measuring the optical spectra of a material, we are indirectly probing its electronic, chemical, and structural properties. 3
10 Spectrophotometry (UV-VIS-NIR) Instrumentation: Light passes through a monochromator, and is directed to the sample. A detector measures the intensity of light that is transmitted by the sample as a function of wavelength. For quantitative measurements, the signal is compared to the intensity of the light transmitted by a reference sample. mirror detector monochromator reference sample beam splitter sample 4 Light source
11 Spectrophotometry (UV-VIS-NIR) Instrumentation: Light passes through a monochromator, and is directed to the sample. A detector measures the intensity of light that is transmitted by the sample as a function of wavelength. For quantitative measurements, the signal is compared to the intensity of the light transmitted by a reference sample. Operation modes: Transmission (liquids and solids) Specular reflection Diffuse reflection Total fluorescence 5
12 Spectrophotometry (UV-VIS-NIR) Applications of spectrophotometry include: Transmission / reflectance (measured directly). Absorption edges / electronic structure (calculated from the optical data). Thin film thickness (from interference fringes, if present). Surface plasmonic modes (from optical data). Concentration (from optical data and comparison with standards). 6
13 Spectrophotometry (UV-VIS-NIR) Absorption ml Au/.1ml Hg 3ml Au/1ml Hg 2ml Au/2ml Hg 1ml Au/3ml Hg.5mM solutions Using absorption to determine Au/Hg concentration in water solutions Wavelength (nm) As Au relative concentration rises, the absorption peak shifts toward shorter wavelengths, increase in intensity, and its FWHM decreases. 7
 Optics")
 ϕ M θ Γ X k r")


14 Spectrophotometry (UV-VIS-NIR) Optics Express 13, 5669 (2005) ϕ M θ Γ X k r nm 3 μm M Γ X Plasmonic crystal Brillouin zone from the transmission spectra measured for many different angles of incidence. k r x 8
15 Spectrophotometry (UV-VIS-NIR) Strengths: Very little to no sample preparation. Simplicity of use and data interpretation. Short acquisition time, for most cases. Non destructive. Requirements and limitations: Reference sample is often needed for quantitative analysis. Different regions of the sample contribute to the final spectrum. Many contributions to the spectrum are small and can be buried in the background. Complementary techniques: EXAFS, FTIR. 9


16 Fourier Transform IR Spectroscopy (FTIR) What is measured? The transmission, reflection and absorption of light as a function of the incident photon energy in the mid and far IR region of the electromagnetic spectrum. Basic principle: Absorption in the IR is dominated by phonon and vibrational absorption. The phonon spectrum of a material is very sensitive to variations on atomic arrangement, and bonds length and strength, making FTIR a powerful tool for structural characterization, and molecular identification. 10
17 Fourier Transform IR Spectroscopy (FTIR) Instrumentation: The FTIR spectrometer is very similar in function to the spectrophotometer, with a fundamental difference. It uses a Michelson interferometer with a moving mirror, in place of a diffractive element for obtaining spectrally resolved data. The beam coming from each mirror will interfere, and different wavelengths will be modulated at different frequencies. The light impinging the sample is not monochromatic as in the spectrophotometer, and all wavelengths are detected at the same time. moving mirror Detector voltage fixed mirror detector beamsplitter sample IR source ΔL = nλ/2 => destructive interference ΔL = nλ => constructive interference Time
18 Fourier Transform IR Spectroscopy (FTIR) Spectrum formation:. Detector voltage I( ν ) = S( t) e 2iνπt dt Intensity Time Frequency 12
19 Fourier Transform IR Spectroscopy An example of an interferogram and its corresponding FTIR spectrum. Polystyrene Frequency (Hz) 2.0 Amplitude Absorbance W avenum ber (cm -1 )
20 Fourier Transform IR Spectroscopy (FTIR) FT vs. Dispersive optics spectrometers Advantages: Multiplexing (all wavelengths are measured simultaneously). No chromatic aberrations or artifacts. Higher throughput. Improved S/N ratio. Better resolution and accuracy. Disadvantages: More complex system. More expensive. Linearity of detectors (working closer to saturation levels). Stray light scattering at low signal level. 13
21 Fourier Transform IR Spectroscopy (FTIR) Applications of FTIR include: Transmission / reflectance in the IR (measured directly). Vibrational / rotational levels (calculated from the optical data). Thin film thickness (from interference fringes, if present). Molecular and crystalline structure (from optical data). Concentration (from optical data and comparison with reference standards). Detection and identification of compounds fingerprinting (from optical data and comparison with compiled tables and libraries, and/or to reference samples). 14
22 Fourier Transform IR Spectroscopy (FTIR) Fingerprinting: FTIR can be used to identify components in a mixture by comparison with reference spectra. Absorbance ASA 99% Aspirin tablet Ibuprofen Wavenumber (cm -1 )
23 Fourier Transform IR Spectroscopy Strengths: Very little sample preparation. Simplicity of use and interpretation. Short acquisition time, for most cases. Non destructive technique. High sensitivity. Requirements and limitations: Reference sample. Overlapping of signal from different regions of the sample. Usually, unambiguous chemical identification requires the use of complementary techniques. Limited spatial resolution. Hard to apply to solutions, due to IR absorption of solvents. Complementary techniques: Raman, EELS, Mass spectroscopy, EXAFS, XPS, AES, SIMS, XRD, SFG. 16


24 Raman Spectroscopy What is measured? The inelastically scattered light from a sample under strong illumination by a laser beam. Basic principle: The impinging light couples with the lattice vibrations (phonons) of the material, and a small portion of it is inelastically scattered. The difference between the energy of the scattered light and the incident beam is the energy absorbed or released by the phonons. Rayleigh scattering Anti-Stokes Raman scattering Stokes Raman scattering 17
25 Raman Spectroscopy Instrumentation: The laser beam is focused on the sample. Scattered radiation from the same spot on the sample is collected and focused on the monochromator entrance slit. The triple monochromator filters out the elastically scattered light. The spectrum is collected by a liquid nitrogen cooled CCD camera. 18
26 Raman Spectroscopy Applications of Raman spectroscopy include: Vibrational / rotational levels (from peak position). Structural characterization (from peak position, width and integrated area). Defects and Structural disorder. Non crystalline solids structure Stress analysis. Dopant levels. Fingerprinting (from peak position and width). Micro Raman. Grain analysis. Crystal zoning. Precipitates / liquid-solid interfaces / Inclusions. Both, Raman spectroscopy and FTIR measure the vibrational spectra of materials, but the physical processes behind each of them are very different, and different selection rules apply. The two techniques are complementary, rather than equivalent. 19
27 Raman Spectroscopy Surface enhanced Raman scattering (SERS) On this example SERS is used to determine the mechanism of oxygen electroreduction on a roughened gold surface. Peak 1 is associated to the O-O stretch mode of superoxide (O 2- ), demonstrating that it is one of the main intermediates during electroreduction of O 2. 20
28 Raman Spectroscopy -C Using Raman spectroscopy we were able to observe structural changes as a function of carbon incorporation, which allowed us to determine C preferred incorporation sites on cubic GaN +C 21
29 Raman Spectroscopy Strengths: Very little sample preparation. Very powerful technique for structural characterization. Non destructive technique. Complementary to FTIR. Requirements and limitations: Overlapping of signal from different regions of the sample. Expensive apparatus (for high resolution). Weak signal, compared to fluorescence. Laser heating or damage may occur to certain samples. Complementary techniques: FTIR, EELS, Mass spectroscopy, EXAFS, XPS, AES, SIMS, XRD, SFG. 22
30 What is measured? Photoluminescence The emission spectra of materials due to radiative recombination following photo-excitation. Basic principle: The impinging light promote electrons from the less energetic levels to excited levels, forming electron-hole pairs. As the electrons and holes recombine, they may release some of the energy as photons. The emitted light is called luminescence. Conduction band Conduction band Valence band Valence band 23 direct band gap indirect band gap
31 Photoluminescence Instrumentation: The laser beam is focused on the sample. Radiation emitted from the sample is collected and focused on the monochromator entrance slit. The emission spectrum is collected by a photomultiplier, a solid state detector, or a liquid nitrogen cooled CCD camera. A liquid He bath cryostat can keep the sample at temperatures between 2 and 300 K. sample Cryostat Detector Laser 24
32 Photoluminescence Applications of PL include: Electronic structure and defect levels (from peak position). Impurity and exciton binding energy (from peak position). Impurity species (from peak position and width). Compound identification (from peak position and width). Alloy composition (from peak position band gap determination). Quantum well width and quality (from peak position width and area). Structural quality / crystallinity (mainly from peak width). Carrier and doping concentration (from peak position and area). Internal strain (from peak width and area). Excited state life-time (from time-resolved experiments). 25
33 Photoluminescence GaAs Conduction band D (D +,X) FE (D o,x) Valence band A (A o,x) 26

34 Photoluminescence Example of the use of PL to determine the width and quality of InGaAsN/GaAs quantum wells. 27
35 Photoluminescence Strengths: Very little sample preparation. Non destructive technique. Very informative spectrum. Requirements and limitations: Overlapping of signal from different regions of the sample. Expensive apparatus. Often requires low temperature. Laser heating or damage may occur to certain samples. Some applications require complex apparatus. Data analysis may be complex. Many materials do not luminesce. Complementary techniques: Ellipsometry, Modulation spectroscopies. 28

36 Ellipsometry What is measured? The changes in the polarization state of light upon reflection from a mirror like surface. In particular, the phase difference and the intensity ratio between the reflected light with p and s polarizations. 29
37 Ellipsometry Basic principle: The components of the reflected light in p and s polarizations are generally different in phase and amplitude. Thus the reflected light emerges from the surface elliptically polarized. ρ = ~ R iδ p e ~ Rs tan( Ψ) = ~ R ~ R p s = n~ n~ 2 2 cosφ cosφ + cosφ = cosφ + n~ n~ 2 2 n~ n~ 2 2 sin sin sin sin 2 2 φ φ 2 2 φ φ 30
38 Ellipsometry Applications of ellipsometry include: (All characteristics below enter as parameters to a physical model of the measured structure that is used to fit the ellipsometric data). Thicknesses of heterostructure layers and thin films. Dielectric function of thin films and bulk materials. Surface and interfacial roughness. Composition. Anisotropy. Crystallinity. Uniformity. In-situ monitoring of thin film growth (by monitoring one or more of the above parameters). 31
39 Ellipsometry SiO 2 Si SiO 2 thickness χ 2 = Å 2.19 ± 0.04 nm Ψ (degrees) Model fit Experiment Ψ Δ Wavelength (nm) Δ (degrees) 32
 SiO 2 Si ε = 1+ E 2 1 A E")


40 Ellipsometry DLC (Lorentz w/ 2 oscillators) SiO 2 Si ε = 1+ E 2 1 A E 1 2 ib 1 + E 2 2 A2 E DLC thickness ± 0.04 nm A ev 2 B ev E ev A ev 2 E ev χ 2 = Å 530 Å 2 33
41 Ellipsometry Stregths: Fast. Measures a ratio of two intensity values and a phase. Highly accurate and reproducible (even in low light levels). No reference sample necessary. Not as susceptible to scatter, lamp or purge fluctuations. Increased sensitivity, especially to ultrathin films (<10nm). Variable Angle Spectroscopic Ellipsometry. More experimental data to constrain the model fit. Data at wavelengths of interest. Optimize sensitivity by choosing the appropriate angle of incidence. Can be used in-situ. Requirements and limitations: Flat and parallel surface and interfaces with measurable reflectivity A realistic physical model of the sample is usually required to obtain useful information. Complementary techniques: PL, Modulation spectroscopies, XPS, SIMS, XRD. 34
42 Sum Frequency Generation 35 What is measured? Sum frequency generation (SFG) is a second order process involving two input laser fields, which induce the generation of a third field, coherently irradiated with the sum frequency of the original fields. This third beam is measured as a function of the wavelength. Basic principle: Second-order non-linear processes are forbidden in the bulk with inversion symmetry At the surface and interfaces the symmetry is broken, and SFG is allowed. SFG is strongly dependent on the surface state. SFG signal is resonantly enhanced when the energy of the IR beam matches a vibrational energy on the surface/interface. ħω v ħω ir ħω ir ħω v e ħω sfg g ħω sfg

43 Sum Frequency Generation Instrumentation: In a three wave mixing process like SFG, the signal is proportional to the pulse width δt. Thus short and ultra-short systems are preferred. The system in the CMM Laser Facility produces pulses of 10 ps in 100 pulses trains with a repetition rate of 25 Hz. Its range is from 4 to 20 μm. Applications of SFG include: Vibrational spectroscopy of surfaces and interfaces. Surface and interface chemistry / electro-chemistry. 36 Appl. Phys. Lett., Vol. 79, 1945 (2001).

44 Sum Frequency Generation pzc 37
45 Sum Frequency Generation Strengths: SFG is a second order process. Mostly insensitive to bulk signal. Can be used to probe surface and optically accessible interfaces. Very sensitive to surface state. Can detect less than a monolayer of molecules adsorbed to a surface. Sensitive to molecular arrangement on the surface. Requirements and limitations: Careful alignment of beams to coincide on the sample surface. Interfaces to be studied need to be accessible by all beams, the IR, the visible, and the SFG. May require a long acquisition time to get data. Expensive and complex apparatus. SFG is a coherent optical process. The SFG beam is highly directional. SFG is compatible with in-situ monitoring. Complementary techniques: FTIR, Raman spectroscopy. 38
46 Time-domain thermoreflectance (TDTR) What is measured? Modulation spectroscopy is an experimental method for taking the derivative of an optical spectrum (reflectance or transmittance), by modifying the measurement conditions through external stimulation. In the case of thermoreflectance, the temperature of the sample is modulated by the pump beam, and its reflectance is measured by a weaker probe beam. In timedomain thermoreflectance, we measure this reflectance with time resolution. Basic principle: The dielectric function of a material, and thus its reflectance, is a function of temperature. By modulating the material s temperature, we can measure the variation in its reflectivity, caused by that modulation. With time resolved measurements, we can calculate the thermal conductivity of the sample. hν0 hν0 39
47 Time-domain thermoreflectance (TDTR) Instrumentation: Ultra-fast fs Ti:Sapphire laser operating in the range nm, with 80 MHz repetition rate. A variable delay line in the pump beam path for time resolution. Scanning sample stages for spatially resolved measurements and mapping of thermal properties. Applications of TDTR include: Spatially resolved thermal and elastic properties of materials: J. Appl. Phys., Vol. 93, 793 (2003). Thermal effusivity (ΛC) and conductivity. Mechanical properties (by determination of the speed of sound). 40
48 Time-domain thermoreflectance (TDTR) Time domain thermoreflectance was used to measure the thermal conductivity of WSe 2 films as a function of temperature, and film thickness. Thermal conductivities 6 times lower than the minimum predicted conductivity for single crystalline WSe 2. The lowest thermal conductivity obtained (50 mwm -1 K -1 ) is the lowest so far observed for a fully dense solid. The low conductivity is produced by random stacking of crystalline WSe 2 sheets. 41

49 Time-domain thermoreflectance (TDTR) 38
50 Time-domain thermoreflectance (TDTR) Strengths: No sample preparation. Non destructive technique. Spatial and temporal resolution. Measurements can be made over a large range of temperatures. Fast. Requirements and limitations: Careful alignment of beams to coincide on the sample surface. Complex and expensive apparatus. Complementary techniques: Raman spectroscopy, Nanoindentation. 43


51 Optical microscopy Near-field scanning optical microscopy (NSOM). 44
52 Near-field Scanning Optical Microscopy Background Based on the Airy discs formation Abbé derived a theoretical limit to the optical microscope resolution. Arch. Microskop. Anat. 9, 413 (1873) He defined the resolving power of the microscope as the distance between two point sources for which the center of one Airy disk coincides with the first zero of the other: d 0.61λ NA Rayleigh criterion 45

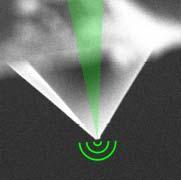
53 Near-field Scanning Optical Microscopy Near-field microscopy: resolution beyond the diffraction limit! The near field microscope resolves objects much smaller than the wavelength of light by measuring at very short distances from the sample surface, through sub-wavelength apertures. Basic principle: The principle of operation of the NSOM was devised by Synge in The sample is kept in the near-field regime of a sub-wavelength source. Resolution quickly degrades with sample source separation distance. If z<<λ, the resolution is determined by the aperture, not wavelength. The image is constructed by scanning the aperture across the sample and recording the optical response. Philos.Mag. 6, 356 (1928). 46
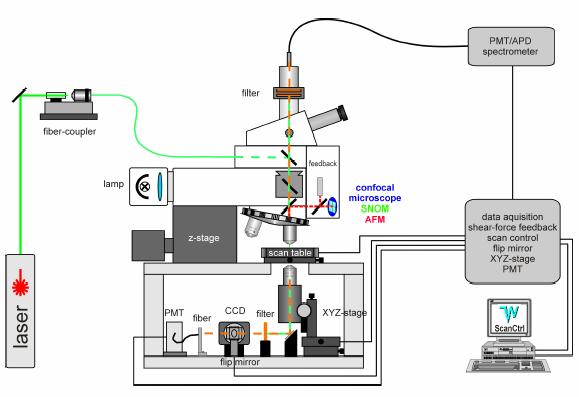
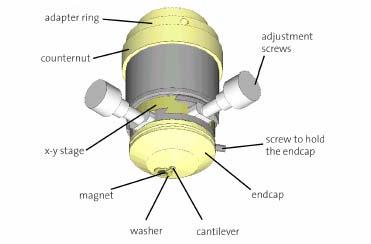
54 Near-field Scanning Optical Microscopy Instrumentation: 48

55 Near-field Scanning Optical Microscopy 49
56 Near-field Scanning Optical Microscopy Strengths: No sample preparation. Non destructive technique. Sub diffraction limit resolution (50 nm). Requirements and limitations: Careful alignment required. Interaction between tip and sample may make analysis difficult. Very low throughput. Slow data acquisition. Limited to fairly flat samples (20 μm). Complementary techniques: AFM, SEM,TEM, Confocal microscopy. 50


57 Acknowledgements Sponsors: Frederick Seitz Materials Research Laboratory is supported by the U.S. Department of Energy under grants DEFG02-07-ER46453 and DEFG02-07-ER46471
Vibrational Spectroscopies. C-874 University of Delaware
 Vibrational Spectroscopies C-874 University of Delaware Vibrational Spectroscopies..everything that living things do can be understood in terms of the jigglings and wigglings of atoms.. R. P. Feymann Vibrational
Lecture 20 Optical Characterization 2
 Lecture 20 Optical Characterization 2 Schroder: Chapters 2, 7, 10 1/68 Announcements Homework 5/6: Is online now. Due Wednesday May 30th at 10:00am. I will return it the following Wednesday (6 th June).
Model Answer (Paper code: AR-7112) M. Sc. (Physics) IV Semester Paper I: Laser Physics and Spectroscopy
 M. Sc. (Physics) IV Semester Paper I: Laser Physics and Spectroscopy") Model Answer (Paper code: AR-7112) M. Sc. (Physics) IV Semester Paper I: Laser Physics and Spectroscopy Section I Q1. Answer (i) (b) (ii) (d) (iii) (c) (iv) (c) (v) (a) (vi) (b) (vii) (b) (viii) (a) (ix)
Model Answer (Paper code: AR-7112) M. Sc. (Physics) IV Semester Paper I: Laser Physics and Spectroscopy Section I Q1. Answer (i) (b) (ii) (d) (iii) (c) (iv) (c) (v) (a) (vi) (b) (vii) (b) (viii) (a) (ix)
Characterisation of vibrational modes of adsorbed species
 17.7.5 Characterisation of vibrational modes of adsorbed species Infrared spectroscopy (IR) See Ch.10. Infrared vibrational spectra originate in transitions between discrete vibrational energy levels of
CHEM*3440. Photon Energy Units. Spectrum of Electromagnetic Radiation. Chemical Instrumentation. Spectroscopic Experimental Concept.
 Spectrum of Electromagnetic Radiation Electromagnetic radiation is light. Different energy light interacts with different motions in molecules. CHEM*344 Chemical Instrumentation Topic 7 Spectrometry Radiofrequency
Optics and Spectroscopy
 Introduction to Optics and Spectroscopy beyond the diffraction limit Chi Chen 陳祺 Research Center for Applied Science, Academia Sinica 2015Apr09 1 Light and Optics 2 Light as Wave Application 3 Electromagnetic
Introduction to FT-IR Spectroscopy
 Introduction to FT-IR Spectroscopy An FT-IR Spectrometer is an instrument which acquires broadband NIR to FIR spectra. Unlike a dispersive instrument, i.e. grating monochromator or spectrograph, an FT-IR
Spectroscopy. Page 1 of 8 L.Pillay (2012)
") Spectroscopy Electromagnetic radiation is widely used in analytical chemistry. The identification and quantification of samples using electromagnetic radiation (light) is called spectroscopy. Light has
Spectroscopy Electromagnetic radiation is widely used in analytical chemistry. The identification and quantification of samples using electromagnetic radiation (light) is called spectroscopy. Light has
Optical Characterization of Solids
 D. Dragoman M. Dragoman Optical Characterization of Solids With 184 Figures Springer 1. Elementary Excitations in Solids 1 1.1 Energy Band Structure in Crystalline Materials 2 1.2 k p Method 11 1.3 Numerical
AP 5301/8301 Instrumental Methods of Analysis and Laboratory
 1 AP 5301/8301 Instrumental Methods of Analysis and Laboratory Lecture 7 Optical spectroscopies Prof YU Kin Man E-mail: kinmanyu@cityu.edu.hk Tel: 3442-7813 Office: P6422 Lecture 7: outline 2 Introduction
Advanced Spectroscopy Laboratory
 Advanced Spectroscopy Laboratory - Raman Spectroscopy - Emission Spectroscopy - Absorption Spectroscopy - Raman Microscopy - Hyperspectral Imaging Spectroscopy FERGIELAB TM Raman Spectroscopy Absorption
Application of IR Raman Spectroscopy
 Application of IR Raman Spectroscopy 3 IR regions Structure and Functional Group Absorption IR Reflection IR Photoacoustic IR IR Emission Micro 10-1 Mid-IR Mid-IR absorption Samples Placed in cell (salt)
Skoog Chapter 6 Introduction to Spectrometric Methods
 Skoog Chapter 6 Introduction to Spectrometric Methods General Properties of Electromagnetic Radiation (EM) Wave Properties of EM Quantum Mechanical Properties of EM Quantitative Aspects of Spectrochemical
Raman and stimulated Raman spectroscopy of chlorinated hydrocarbons
 Department of Chemistry Physical Chemistry Göteborg University KEN140 Spektroskopi Raman and stimulated Raman spectroscopy of chlorinated hydrocarbons WARNING! The laser gives a pulsed very energetic and
FTIR Spectrometer. Basic Theory of Infrared Spectrometer. FTIR Spectrometer. FTIR Accessories
 FTIR Spectrometer Basic Theory of Infrared Spectrometer FTIR Spectrometer FTIR Accessories What is Infrared? Infrared radiation lies between the visible and microwave portions of the electromagnetic spectrum.
An Introduction to Diffraction and Scattering. School of Chemistry The University of Sydney
 An Introduction to Diffraction and Scattering Brendan J. Kennedy School of Chemistry The University of Sydney 1) Strong forces 2) Weak forces Types of Forces 3) Electromagnetic forces 4) Gravity Types
2001 Spectrometers. Instrument Machinery. Movies from this presentation can be access at
 2001 Spectrometers Instrument Machinery Movies from this presentation can be access at http://www.shsu.edu/~chm_tgc/sounds/sound.html Chp20: 1 Optical Instruments Instrument Components Components of various
Supporting Information s for
 Supporting Information s for # Self-assembling of DNA-templated Au Nanoparticles into Nanowires and their enhanced SERS and Catalytic Applications Subrata Kundu* and M. Jayachandran Electrochemical Materials
Supplementary Materials
 Supplementary Materials Sample characterization The presence of Si-QDs is established by Transmission Electron Microscopy (TEM), by which the average QD diameter of d QD 2.2 ± 0.5 nm has been determined
Chem Homework Set Answers
 Chem 310 th 4 Homework Set Answers 1. Cyclohexanone has a strong infrared absorption peak at a wavelength of 5.86 µm. (a) Convert the wavelength to wavenumber.!6!1 8* = 1/8 = (1/5.86 µm)(1 µm/10 m)(1 m/100
Chemistry Instrumental Analysis Lecture 15. Chem 4631
 Chemistry 4631 Instrumental Analysis Lecture 15 IR Instruments Types of Instrumentation Dispersive Spectrophotometers (gratings) Fourier transform spectrometers (interferometer) Single beam Double beam
Because light behaves like a wave, we can describe it in one of two ways by its wavelength or by its frequency.
 Light We can use different terms to describe light: Color Wavelength Frequency Light is composed of electromagnetic waves that travel through some medium. The properties of the medium determine how light
Highly Efficient and Anomalous Charge Transfer in van der Waals Trilayer Semiconductors
 Highly Efficient and Anomalous Charge Transfer in van der Waals Trilayer Semiconductors Frank Ceballos 1, Ming-Gang Ju 2 Samuel D. Lane 1, Xiao Cheng Zeng 2 & Hui Zhao 1 1 Department of Physics and Astronomy,
IR Spectrography - Absorption. Raman Spectrography - Scattering. n 0 n M - Raman n 0 - Rayleigh
 RAMAN SPECTROSCOPY Scattering Mid-IR and NIR require absorption of radiation from a ground level to an excited state, requires matching of radiation from source with difference in energy states. Raman
Luminescence basics. Slide # 1
 Luminescence basics Types of luminescence Cathodoluminescence: Luminescence due to recombination of EHPs created by energetic electrons. Example: CL mapping system Photoluminescence: Luminescence due to
Optical Spectroscopy of Advanced Materials
 Phys 590B Condensed Matter Physics: Experimental Methods Optical Spectroscopy of Advanced Materials Basic optics, nonlinear and ultrafast optics Jigang Wang Department of Physics, Iowa State University
Vibrational Spectroscopy of Molecules on Surfaces
 Vibrational Spectroscopy of Molecules on Surfaces Edited by John T. Yates, Jr. University of Pittsburgh Pittsburgh, Pennsylvania and Theodore E. Madey National Bureau of Standards Gaithersburg, Maryland
Chem 524 Lecture Notes Raman (Section 17) 2013
 2013") Chem 524 Lecture Notes Raman (Section 17) 2013 For HTML of 2005 notes, click here XIII. Molecular Light Scattering and Raman Spectroscopy (Read Ch. 16) A. Elastic Scattering o = s - basis for Dynamic Light
Chem 524 Lecture Notes Raman (Section 17) 2013 For HTML of 2005 notes, click here XIII. Molecular Light Scattering and Raman Spectroscopy (Read Ch. 16) A. Elastic Scattering o = s - basis for Dynamic Light
Chapter 6 Photoluminescence Spectroscopy
 Chapter 6 Photoluminescence Spectroscopy Course Code: SSCP 4473 Course Name: Spectroscopy & Materials Analysis Sib Krishna Ghoshal (PhD) Advanced Optical Materials Research Group Physics Department, Faculty
Introduction to Fourier Transform Infrared Spectroscopy
 molecular spectroscopy Introduction to Fourier Transform Infrared Spectroscopy Part of Thermo Fisher Scientific Introduction What is FT-IR? FT-IR stands for Fourier Transform InfraRed, the preferred method
Chapter 2 Introduction to Optical Characterization of Materials
 Chapter 2 Introduction to Optical Characterization of Materials Julio A.N.T. Soares 2.1 Introduction The use of light to probe the physical and chemical properties of matter is a concept more natural than
Lecture 5. X-ray Photoemission Spectroscopy (XPS)
") Lecture 5 X-ray Photoemission Spectroscopy (XPS) 5. Photoemission Spectroscopy (XPS) 5. Principles 5.2 Interpretation 5.3 Instrumentation 5.4 XPS vs UV Photoelectron Spectroscopy (UPS) 5.5 Auger Electron
Lecture 5 X-ray Photoemission Spectroscopy (XPS) 5. Photoemission Spectroscopy (XPS) 5. Principles 5.2 Interpretation 5.3 Instrumentation 5.4 XPS vs UV Photoelectron Spectroscopy (UPS) 5.5 Auger Electron
PHYSICS nd TERM Outline Notes (continued)
") PHYSICS 2800 2 nd TERM Outline Notes (continued) Section 6. Optical Properties (see also textbook, chapter 15) This section will be concerned with how electromagnetic radiation (visible light, in particular)
PHYSICS 2800 2 nd TERM Outline Notes (continued) Section 6. Optical Properties (see also textbook, chapter 15) This section will be concerned with how electromagnetic radiation (visible light, in particular)
Supplementary Figure 1
 Supplementary Figure 1 XRD patterns and TEM image of the SrNbO 3 film grown on LaAlO 3(001) substrate. The film was deposited under oxygen partial pressure of 5 10-6 Torr. (a) θ-2θ scan, where * indicates
X-ray Spectroscopy. Interaction of X-rays with matter XANES and EXAFS XANES analysis Pre-edge analysis EXAFS analysis
 X-ray Spectroscopy Interaction of X-rays with matter XANES and EXAFS XANES analysis Pre-edge analysis EXAFS analysis Element specific Sensitive to low concentrations (0.01-0.1 %) Why XAS? Applicable under
Instrumental Analysis: Spectrophotometric Methods
 Instrumental Analysis: Spectrophotometric Methods 2007 By the end of this part of the course, you should be able to: Understand interaction between light and matter (absorbance, excitation, emission, luminescence,fluorescence,
Elastic Constants and Microstructure of Amorphous SiO 2 Thin Films Studied by Brillouin Oscillations
 1st International Symposium on Laser Ultrasonics: Science, Technology and Applications July 16-18 2008, Montreal, Canada Elastic Constants and Microstructure of Amorphous SiO 2 Thin Films Studied by Brillouin
Material Analysis. What do you want to know about your sample? How do you intend to do for obtaining the desired information from your sample?
 Material Analysis What do you want to know about your sample? How do you intend to do for obtaining the desired information from your sample? Why can you acquire the proper information? Symmetrical stretching
Supplementary Information for. Vibrational Spectroscopy at Electrolyte Electrode Interfaces with Graphene Gratings
 Supplementary Information for Vibrational Spectroscopy at Electrolyte Electrode Interfaces with Graphene Gratings Supplementary Figure 1. Simulated from pristine graphene gratings at different Fermi energy
The Electromagnetic Properties of Materials
 The Electromagnetic Properties of Materials Electrical conduction Metals Semiconductors Insulators (dielectrics) Superconductors Magnetic materials Ferromagnetic materials Others Photonic Materials (optical)
requency generation spectroscopy Rahul N
 requency generation spectroscopy Rahul N 2-11-2013 Sum frequency generation spectroscopy Sum frequency generation spectroscopy (SFG) is a technique used to analyze surfaces and interfaces. SFG was first
EE 527 MICROFABRICATION. Lecture 5 Tai-Chang Chen University of Washington
 EE 527 MICROFABRICATION Lecture 5 Tai-Chang Chen University of Washington MICROSCOPY AND VISUALIZATION Electron microscope, transmission electron microscope Resolution: atomic imaging Use: lattice spacing.
Optical Properties of Solid from DFT
 Optical Properties of Solid from DFT 1 Prof.P. Ravindran, Department of Physics, Central University of Tamil Nadu, India & Center for Materials Science and Nanotechnology, University of Oslo, Norway http://folk.uio.no/ravi/cmt15
J. Price, 1,2 Y. Q. An, 1 M. C. Downer 1 1 The university of Texas at Austin, Department of Physics, Austin, TX
 Understanding process-dependent oxygen vacancies in thin HfO 2 /SiO 2 stacked-films on Si (100) via competing electron-hole injection dynamic contributions to second harmonic generation. J. Price, 1,2
Lecture #2 Nanoultrasonic imaging
 Lecture #2 Nanoultrasonic imaging Dr. Ari Salmi www.helsinki.fi/yliopisto 24.1.2014 1 Background Matemaattis-luonnontieteellinen tiedekunta / Henkilön nimi / Esityksen nimi www.helsinki.fi/yliopisto 24.1.2014
Supplementary Figure 1 Comparison of single quantum emitters on two type of substrates:
 Supplementary Figure 1 Comparison of single quantum emitters on two type of substrates: a, Photoluminescence (PL) spectrum of localized excitons in a WSe 2 monolayer, exfoliated onto a SiO 2 /Si substrate
Secondary Ion Mass Spectrometry (SIMS)
") CHEM53200: Lecture 10 Secondary Ion Mass Spectrometry (SIMS) Major reference: Surface Analysis Edited by J. C. Vickerman (1997). 1 Primary particles may be: Secondary particles can be e s, neutral species
CHEM53200: Lecture 10 Secondary Ion Mass Spectrometry (SIMS) Major reference: Surface Analysis Edited by J. C. Vickerman (1997). 1 Primary particles may be: Secondary particles can be e s, neutral species
Methods of surface analysis
 Methods of surface analysis Nanomaterials characterisation I RNDr. Věra Vodičková, PhD. Surface of solid matter: last monoatomic layer + absorbed monolayer physical properties are effected (crystal lattice
Experiment AM3b: Raman scattering in transparent solids and liquids
 Physics 6180: Graduate Physics Laboratory Experiment AM3b: Raman scattering in transparent solids and liquids Objectives: To learn the essentials of inelastic light scattering, particularly Raman scattering
Review of Optical Properties of Materials
 Review of Optical Properties of Materials Review of optics Absorption in semiconductors: qualitative discussion Derivation of Optical Absorption Coefficient in Direct Semiconductors Photons When dealing
Last Lecture. Overview and Introduction. 1. Basic optics and spectroscopy. 2. Lasers. 3. Ultrafast lasers and nonlinear optics
 Last Lecture Overview and Introduction 1. Basic optics and spectroscopy. Lasers 3. Ultrafast lasers and nonlinear optics 4. Time-resolved spectroscopy techniques Jigang Wang, Feb, 009 Today 1. Spectroscopy
PRINCIPLES OF PHYSICAL OPTICS
 PRINCIPLES OF PHYSICAL OPTICS C. A. Bennett University of North Carolina At Asheville WILEY- INTERSCIENCE A JOHN WILEY & SONS, INC., PUBLICATION CONTENTS Preface 1 The Physics of Waves 1 1.1 Introduction
Structure analysis: Electron diffraction LEED TEM RHEED
 Structure analysis: Electron diffraction LEED: Low Energy Electron Diffraction SPA-LEED: Spot Profile Analysis Low Energy Electron diffraction RHEED: Reflection High Energy Electron Diffraction TEM: Transmission
Introduction to Fourier Transform Infrared Spectroscopy
 Introduction to Fourier Transform Infrared Spectroscopy Introduction What is FTIR? FTIR stands for Fourier transform infrared, the preferred method of infrared spectroscopy. In infrared spectroscopy, IR
Chap 4 Optical Measurement
 Chap 4 Optical Measurement 4.1 Light Solid Interaction E-M Wave permittivity, permeability Refractive index, extinction coefficient propagation absorption Refraction Absorption Scattering, Rayleigh Scattering
What happens when light falls on a material? Transmission Reflection Absorption Luminescence. Elastic Scattering Inelastic Scattering
 Raman Spectroscopy What happens when light falls on a material? Transmission Reflection Absorption Luminescence Elastic Scattering Inelastic Scattering Raman, Fluorescence and IR Scattering Absorption
Lecture 8: Polarimetry 2. Polarizers and Retarders. Polarimeters. Scattering Polarization. Zeeman Effect. Outline
 Lecture 8: Polarimetry 2 Outline 1 Polarizers and Retarders 2 Polarimeters 3 Scattering Polarization 4 Zeeman Effect Christoph U. Keller, Utrecht University, C.U.Keller@uu.nl Observational Astrophysics
Multi-cycle THz pulse generation in poled lithium niobate crystals
 Laser Focus World April 2005 issue (pp. 67-72). Multi-cycle THz pulse generation in poled lithium niobate crystals Yun-Shik Lee and Theodore B. Norris Yun-Shik Lee is an assistant professor of physics
Near-Infrared Spectroscopy of Nitride Heterostructures EMILY FINAN ADVISOR: DR. OANA MALIS PURDUE UNIVERSITY REU PROGRAM AUGUST 2, 2012
 Near-Infrared Spectroscopy of Nitride Heterostructures EMILY FINAN ADVISOR: DR. OANA MALIS PURDUE UNIVERSITY REU PROGRAM AUGUST 2, 2012 Introduction Experimental Condensed Matter Research Study of large
Chemistry 524--Final Exam--Keiderling Dec. 12, pm SES
 Chemistry 524--Final Exam--Keiderling Dec. 12, 2002 --4-8 pm -- 238 SES Please answer all questions in the answer book provided. Calculators, rulers, pens and pencils are permitted plus one 8.5 x 11 sheet
Time resolved optical spectroscopy methods for organic photovoltaics. Enrico Da Como. Department of Physics, University of Bath
 Time resolved optical spectroscopy methods for organic photovoltaics Enrico Da Como Department of Physics, University of Bath Outline Introduction Why do we need time resolved spectroscopy in OPV? Short
Spectroscopy: Introduction. Required reading Chapter 18 (pages ) Chapter 20 (pages )
 Chapter 20 (pages )") Spectroscopy: Introduction Required reading Chapter 18 (pages 378-397) Chapter 20 (pages 424-449) Spectrophotometry is any procedure that uses light to measure chemical concentrations Properties of Light
Spectroscopy: Introduction Required reading Chapter 18 (pages 378-397) Chapter 20 (pages 424-449) Spectrophotometry is any procedure that uses light to measure chemical concentrations Properties of Light
Understanding Nanoplasmonics. Greg Sun University of Massachusetts Boston
 Understanding Nanoplasmonics Greg Sun University of Massachusetts Boston Nanoplasmonics Space 100pm 1nm 10nm 100nm 1μm 10μm 100μm 1ns 100ps 10ps Photonics 1ps 100fs 10fs 1fs Time Surface Plasmons Surface
1901 Application of Spectrophotometry
 1901 Application of Spectrophotometry Chemical Analysis Problem: 1 Application of Spectroscopy Organic Compounds Organic compounds with single bonds absorb in the UV region because electrons from single
Optical Properties of Thin Semiconductor Films
 Optical Properties of Thin Semiconductor Films Grolik Benno,KoppJoachim October, 31st 2003 1 Introduction Optical experiments provide a good way of examining the properties of semiconductors. Particulary
Visualization of Xe and Sn Atoms Generated from Laser-Produced Plasma for EUV Light Source
 3rd International EUVL Symposium NOVEMBER 1-4, 2004 Miyazaki, Japan Visualization of Xe and Sn Atoms Generated from Laser-Produced Plasma for EUV Light Source H. Tanaka, A. Matsumoto, K. Akinaga, A. Takahashi
Simple strategy for enhancing terahertz emission from coherent longitudinal optical phonons using undoped GaAs/n-type GaAs epitaxial layer structures
 Presented at ISCS21 June 4, 21 Session # FrP3 Simple strategy for enhancing terahertz emission from coherent longitudinal optical phonons using undoped GaAs/n-type GaAs epitaxial layer structures Hideo
Nanoscale IR spectroscopy of organic contaminants
 The nanoscale spectroscopy company The world leader in nanoscale IR spectroscopy Nanoscale IR spectroscopy of organic contaminants Application note nanoir uniquely and unambiguously identifies organic
Introduction to Spectroscopic methods
 Introduction to Spectroscopic methods Spectroscopy: Study of interaction between light* and matter. Spectrometry: Implies a quantitative measurement of intensity. * More generally speaking electromagnetic
High-Resolution. Transmission. Electron Microscopy
 Part 4 High-Resolution Transmission Electron Microscopy 186 Significance high-resolution transmission electron microscopy (HRTEM): resolve object details smaller than 1nm (10 9 m) image the interior of
Where are the Fringes? (in a real system) Div. of Amplitude - Wedged Plates. Fringe Localisation Double Slit. Fringe Localisation Grating
 Div. of Amplitude - Wedged Plates. Fringe Localisation Double Slit. Fringe Localisation Grating") Where are the Fringes? (in a real system) Fringe Localisation Double Slit spatial modulation transverse fringes? everywhere or well localised? affected by source properties: coherence, extension Plane
Where are the Fringes? (in a real system) Fringe Localisation Double Slit spatial modulation transverse fringes? everywhere or well localised? affected by source properties: coherence, extension Plane
Optical Investigation of the Localization Effect in the Quantum Well Structures
 Department of Physics Shahrood University of Technology Optical Investigation of the Localization Effect in the Quantum Well Structures Hamid Haratizadeh hamid.haratizadeh@gmail.com IPM, SCHOOL OF PHYSICS,
Nanocomposite photonic crystal devices
 Nanocomposite photonic crystal devices Xiaoyong Hu, Cuicui Lu, Yulan Fu, Yu Zhu, Yingbo Zhang, Hong Yang, Qihuang Gong Department of Physics, Peking University, Beijing, P. R. China Contents Motivation
Chemistry 524--Final Exam--Keiderling May 4, :30 -?? pm SES
 Chemistry 524--Final Exam--Keiderling May 4, 2011 3:30 -?? pm -- 4286 SES Please answer all questions in the answer book provided. Calculators, rulers, pens and pencils are permitted. No open books or
Optical materials characterization
 Optical materials characterization Julio Soares Frederick Seitz Materials Research Laboratory University of Illinois at Urbana-Champaign 2014University of Illinois Board of Trustees. All rights reserved.
Ch 313 FINAL EXAM OUTLINE Spring 2010
 Ch 313 FINAL EXAM OUTLINE Spring 2010 NOTE: Use this outline at your own risk sometimes a topic is omitted that you are still responsible for. It is meant to be a study aid and is not meant to be a replacement
Wavelength λ Velocity v. Electric Field Strength Amplitude A. Time t or Distance x time for 1 λ to pass fixed point. # of λ passing per s ν= 1 p
 Introduction to Spectroscopy (Chapter 6) Electromagnetic radiation (wave) description: Wavelength λ Velocity v Electric Field Strength 0 Amplitude A Time t or Distance x Period p Frequency ν time for 1
Supplementary Figure 1 Schematics of an optical pulse in a nonlinear medium. A Gaussian optical pulse propagates along z-axis in a nonlinear medium
 Supplementary Figure 1 Schematics of an optical pulse in a nonlinear medium. A Gaussian optical pulse propagates along z-axis in a nonlinear medium with thickness L. Supplementary Figure Measurement of
Transmission Electron Microscopy
 L. Reimer H. Kohl Transmission Electron Microscopy Physics of Image Formation Fifth Edition el Springer Contents 1 Introduction... 1 1.1 Transmission Electron Microscopy... 1 1.1.1 Conventional Transmission
Optical Fiber Signal Degradation
 Optical Fiber Signal Degradation Effects Pulse Spreading Dispersion (Distortion) Causes the optical pulses to broaden as they travel along a fiber Overlap between neighboring pulses creates errors Resulting
Practical 1P4 Energy Levels and Band Gaps
 Practical 1P4 Energy Levels and Band Gaps What you should learn from this practical Science This practical illustrates some of the points from the lecture course on Elementary Quantum Mechanics and Bonding
Single Emitter Detection with Fluorescence and Extinction Spectroscopy
 Single Emitter Detection with Fluorescence and Extinction Spectroscopy Michael Krall Elements of Nanophotonics Associated Seminar Recent Progress in Nanooptics & Photonics May 07, 2009 Outline Single molecule
CHAPTER 7 SUMMARY OF THE PRESENT WORK AND SUGGESTIONS FOR FUTURE WORK
 161 CHAPTER 7 SUMMARY OF THE PRESENT WORK AND SUGGESTIONS FOR FUTURE WORK 7.1 SUMMARY OF THE PRESENT WORK Nonlinear optical materials are required in a wide range of important applications, such as optical
Lecture 23 X-Ray & UV Techniques
 Lecture 23 X-Ray & UV Techniques Schroder: Chapter 11.3 1/50 Announcements Homework 6/6: Will be online on later today. Due Wednesday June 6th at 10:00am. I will return it at the final exam (14 th June).
Spectroscopy Problem Set February 22, 2018
 Spectroscopy Problem Set February, 018 4 3 5 1 6 7 8 1. In the diagram above which of the following represent vibrational relaxations? 1. Which of the following represent an absorbance? 3. Which of following
Nanoscale Chemical Imaging with Photo-induced Force Microscopy
 OG2 BCP39nm_0062 PiFM (LIA1R)Fwd 500 279.1 µv 375 250 nm 500 375 250 125 0 nm 125 219.0 µv Nanoscale Chemical Imaging with Photo-induced Force Microscopy 0 Thomas R. Albrecht, Derek Nowak, Will Morrison,
10/2/2008. hc λ. νλ =c. proportional to frequency. Energy is inversely proportional to wavelength And is directly proportional to wavenumber
 CH217 Fundamentals of Analytical Chemistry Module Leader: Dr. Alison Willows Electromagnetic spectrum Properties of electromagnetic radiation Many properties of electromagnetic radiation can be described
Light Interaction with Small Structures
 Light Interaction with Small Structures Molecules Light scattering due to harmonically driven dipole oscillator Nanoparticles Insulators Rayleigh Scattering (blue sky) Semiconductors...Resonance absorption
Chapter 6. Fiber Optic Thermometer. Ho Suk Ryou
 Chapter 6. Fiber Optic Thermometer Ho Suk Ryou Properties of Optical Fiber Optical Fiber Composed of rod core surrounded by sheath Core: conducts electromagnetic wave Sheath: contains wave within the core
Reflection = EM strikes a boundary between two media differing in η and bounces back
 Reflection = EM strikes a boundary between two media differing in η and bounces back Incident ray θ 1 θ 2 Reflected ray Medium 1 (air) η = 1.00 Medium 2 (glass) η = 1.50 Specular reflection = situation
Lecture 3: Light absorbance
 Lecture 3: Light absorbance Perturbation Response 1 Light in Chemistry Light Response 0-3 Absorbance spectrum of benzene 2 Absorption Visible Light in Chemistry S 2 S 1 Fluorescence http://www.microscopyu.com
LABORATORY OF ELEMENTARY BIOPHYSICS
 LABORATORY OF ELEMENTARY BIOPHYSICS Experimental exercises for III year of the First cycle studies Field: Applications of physics in biology and medicine Specialization: Molecular Biophysics Fluorescence
Surface Sensitivity & Surface Specificity
 Surface Sensitivity & Surface Specificity The problems of sensitivity and detection limits are common to all forms of spectroscopy. In its simplest form, the question of sensitivity boils down to whether
Practical 1P4 Energy Levels and Band Gaps
 Practical 1P4 Energy Levels and Band Gaps What you should learn from this practical Science This practical illustrates some of the points from the lecture course on Elementary Quantum Mechanics and Bonding
Snowy Range Instruments
 Snowy Range Instruments Cary 81 2000 W Hg Arc JY U-1000 5 W Ar + Laser DL Solution 852 200 mw SnRI CBEx 785 100 mw What is Raman Spectroscopy? Raman spectroscopy is a form of molecular spectroscopy. It
Some Topics in Optics
 Some Topics in Optics The HeNe LASER The index of refraction and dispersion Interference The Michelson Interferometer Diffraction Wavemeter Fabry-Pérot Etalon and Interferometer The Helium Neon LASER A
Nanophysics: Main trends
 Nano-opto-electronics Nanophysics: Main trends Nanomechanics Main issues Light interaction with small structures Molecules Nanoparticles (semiconductor and metallic) Microparticles Photonic crystals Nanoplasmonics
Electronic Supplementary Information
 Electronic Supplementary Material (ESI) for Journal of Materials Chemistry C. This journal is The Royal Society of Chemistry 2017 Electronic Supplementary Information Polymorphism and microcrystal shape
Electron Dynamiχ MPRG Fritz-Haber-Institut der Max-Planck-Gesellschaft
 Electron Dynamiχ MPRG Fritz-Haber-Institut der Max-Planck-Gesellschaft How exciting! 2016 Berlin, 3-6 August laura.foglia@elettra.eu 1 Current research challenges V Light Harvesting Light Emission Energy
Rb, which had been compressed to a density of 1013
 Modern Physics Study Questions for the Spring 2018 Departmental Exam December 3, 2017 1. An electron is initially at rest in a uniform electric field E in the negative y direction and a uniform magnetic