Application of IR Raman Spectroscopy
|
|
|
- Rose Alberta Brooks
- 5 years ago
- Views:
Transcription
1 Application of IR Raman Spectroscopy 3 IR regions Structure and Functional Group Absorption IR Reflection IR Photoacoustic IR IR Emission Micro 10-1
2 Mid-IR Mid-IR absorption Samples Placed in cell (salt) Combined with oil Need cell that does not absorb IR KBr, NaCl * Tends to absorb water Gases Solutions Solvent issues * Dissolution of cell 10-2
3 Can calculate group frequencies C-H, C=O, C=C, O-H Variations of frequencies for group Fingerprint region Compare to standards Absorption of inorganics Sulphate, phosphate, nitrate, carbonate Search spectra against library Analysis 10-3
4 Mid-IR 10-4
5 10-5
6 10-6
7 10-7
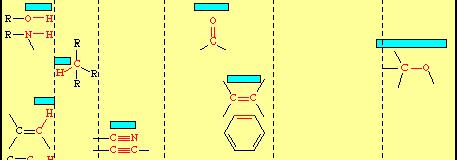
8 Interpretation Alcohols and amines display strong broad O-H and N-H stretching bands in the region cm -1 bands are broadened due to hydrogen bonding and a sharp 'non-bonded' peak can around 3400 cm -1. Alkene and alkyne C-H bonds display sharp stretching absorptions in the region cm -1 bands are of medium intensity often obscured (i.e., OH). Triple bond stretching absorptions occur in the region cm -1 Nitriles are generally of medium intensity and are clearly defined Alkynes absorb weakly unless they are highly asymmetric symmetrical alkynes do not show absorption bands Carbonyl stretching bands occur in the region cm -1 bands are generally very strong and broad Carbonyl compounds (acyl halides, esters) are generally at higher wave number than simple ketones and aldehydes amides are the lowest, absorbing in the region cm -1 Carbon-carbon double bond stretching occurs in the region around cm -1 bands are generally sharp and of medium intensity Aromatic compounds will display a series of sharp bands Carbon-oxygen single bonds display stretching bands in the region cm -1 bands are generally strong and broad 10-8
9 Quantitative IR Difficult to obtain reliable quantitative data based on IR Deviations from Beer s law Narrow Bands and wide slit widths required * Require calibration sources Complex spectra Weak beam Lack of reference cell Need to normalize refraction * Take reference and sample with same cell 10-9
10 Other methods Reflectance IR Measurement of absorbance from reflected IR Surface measurement Photoacoustic IR can use tunable laser Near IR 700 nm to 2500 nm Quantitative analysis of samples * CH, NH, and OH Low absorption Emission IR 10-10
11 Raman Spectroscopy Scattering of light Fraction of scattered light in the visible differs from incident beam Difference based on molecular structure * Based on quantized vibrational changes * Difference between incident and scattered light is in mid-ir region No water interference Can examine aqueous samples Quartz or glass cells can be used Competition with fluorescence 10-11
12 Raman Spectroscopy Theory Instrumentation Application Method Excitation with UV or NIR Measurement of scatter at 90 Measurement 1E-5 of incident beam 10-12

13 Theory 3 types of scattered radiation Stokes Lower energy than Anti- Stokes * Named from fluorescence behavior More intense Used for Raman measurements Anti-Stokes No fluorescence interference Rayleigh Most intense Same as incident radiation Shift patterns independent of incident radiation wavelength 10-13
14 Theory Excitation From ground or 1 st vibrationally excited state Population of excited state from Boltzmann s equation * Molecule populates virtual states with energy from photon * Can be effected by temperature Elastic scattering is Rayleigh Energy scattered=energy incident Energy difference due to ground and 1 st excited state hν E is Stokes scattering Hν+ E is anti-stokes scattering 10-14
15 10-15
16 Theory Variation in polarizability of bond with length Electric field (E) due to excitation frequency with E 0 E = E 0 cos(2πν ext) Dipole moment (m) based on polarizability of bond (α) m For Raman activity α must vary with distance along bond α 0 is polarizability at r eq = α E = αe 0 cos(2πν t) α = α 0 + ( r r eq ex )( α ) r r r eq = r max cos(2πν t) v 10-16
17 m = α E E 2 0 r m 0 0 cos(2πν ex α ( )cos(2π ( ν r t) + ex Theory E 2 0 r m + ν ) t) ν α ( )cos(2π ( ν r ex ν ) t) ν + Equation has Rayleigh, Stokes, and Anti-Stokes component Complementary to IR absorbance Overlap not complete 10-17
18 10-18
19 Instrumentation Laser source Ar (488 nm, nm) Kr (530.9 nm, nm) He/Ne (623 nm) Diode (782 nm or 830 nm) Nd/YAG (1064 nm) Tunable lasers Intensity proportional to ν 4 * Consider energy and chemical effect of absorbing energy 10-19
20 Instrumentation Sample holder Glass Laser focusing allows small sample size Liquid and solid samples can be examined Use of fiber optics 10-20

21 Laser microprobes Use of laser permits small sampling area Resonance Raman Use electronic absorption peak Low concentrations can be examined Lifetimes on 10 fs Surface enhanced Raman Increase of sensitivity by 1000 to 1E6 Applications 10-21
22 10-22
23 10-23
Lecture 11. IR Theory. Next Class: Lecture Problem 4 due Thin-Layer Chromatography
 Lecture 11 IR Theory Next Class: Lecture Problem 4 due Thin-Layer Chromatography This Week In Lab: Ch 6: Procedures 2 & 3 Procedure 4 (outside of lab) Next Week in Lab: Ch 7: PreLab Due Quiz 4 Ch 5 Final
Advanced Pharmaceutical Analysis
 Lecture 2 Advanced Pharmaceutical Analysis IR spectroscopy Dr. Baraa Ramzi Infrared Spectroscopy It is a powerful tool for identifying pure organic and inorganic compounds. Every molecular compound has
Infrared Spectroscopy
 Infrared Spectroscopy Introduction Spectroscopy is an analytical technique which helps determine structure. It destroys little or no sample. The amount of light absorbed by the sample is measured as wavelength
IR Spectrography - Absorption. Raman Spectrography - Scattering. n 0 n M - Raman n 0 - Rayleigh
 RAMAN SPECTROSCOPY Scattering Mid-IR and NIR require absorption of radiation from a ground level to an excited state, requires matching of radiation from source with difference in energy states. Raman
Radiant energy is proportional to its frequency (cycles/s = Hz) as a wave (Amplitude is its height) Different types are classified by frequency or
 as a wave (Amplitude is its height) Different types are classified by frequency or") CHEM 241 UNIT 5: PART B INFRA-RED RED SPECTROSCOPY 1 Spectroscopy of the Electromagnetic Spectrum Radiant energy is proportional to its frequency (cycles/s = Hz) as a wave (Amplitude is its height) Different
CHEM 241 UNIT 5: PART B INFRA-RED RED SPECTROSCOPY 1 Spectroscopy of the Electromagnetic Spectrum Radiant energy is proportional to its frequency (cycles/s = Hz) as a wave (Amplitude is its height) Different
What happens when light falls on a material? Transmission Reflection Absorption Luminescence. Elastic Scattering Inelastic Scattering
 Raman Spectroscopy What happens when light falls on a material? Transmission Reflection Absorption Luminescence Elastic Scattering Inelastic Scattering Raman, Fluorescence and IR Scattering Absorption
Structure Determination. How to determine what compound that you have? One way to determine compound is to get an elemental analysis
 Structure Determination How to determine what compound that you have? ne way to determine compound is to get an elemental analysis -basically burn the compound to determine %C, %H, %, etc. from these percentages
ORGANIC - BROWN 8E CH INFRARED SPECTROSCOPY.
 !! www.clutchprep.com CONCEPT: PURPOSE OF ANALYTICAL TECHNIQUES Classical Methods (Wet Chemistry): Chemists needed to run dozens of chemical reactions to determine the type of molecules in a compound.
Infrared Spectroscopy
 Infrared Spectroscopy IR Spectroscopy Used to identify organic compounds IR spectroscopy provides a 100% identification if the spectrum is matched. If not, IR at least provides information about the types
Introduction. The analysis of the outcome of a reaction requires that we know the full structure of the products as well as the reactants
 Introduction The analysis of the outcome of a reaction requires that we know the full structure of the products as well as the reactants Spectroscopy and the Electromagnetic Spectrum Unlike mass spectrometry,
Vibrational Spectroscopy
 Vibrational Spectroscopy In this part of the course we will look at the kind of spectroscopy which uses light to excite the motion of atoms. The forces required to move atoms are smaller than those required
Chapter 12 Mass Spectrometry and Infrared Spectroscopy
 Organic Chemistry, 6 th Edition L. G. Wade, Jr. Chapter 12 Mass Spectrometry and Infrared Spectroscopy Jo Blackburn Richland College, Dallas, TX Dallas County Community College District 2006, Prentice
Química Orgânica I. Ciências Farmacêuticas Bioquímica Química. IR spectroscopy AFB QO I 2007/08 1 AFB QO I 2007/08 2
 Química Orgânica I Ciências Farmacêuticas Bioquímica Química AFB QO I 2007/08 1 IR spectroscopy AFB QO I 2007/08 2 1 Adaptado de: Organic Chemistry, 6th Edition; L. G. Wade, Jr. Organic Chemistry, William
SPECTROSCOPY MEASURES THE INTERACTION BETWEEN LIGHT AND MATTER
 SPECTROSCOPY MEASURES THE INTERACTION BETWEEN LIGHT AND MATTER c = c: speed of light 3.00 x 10 8 m/s (lamda): wavelength (m) (nu): frequency (Hz) Increasing E (J) Increasing (Hz) E = h h - Planck s constant
1.1. IR is part of electromagnetic spectrum between visible and microwave
 CH2SWK 44/6416 IR Spectroscopy 2013Feb5 1 1. Theory and properties 1.1. IR is part of electromagnetic spectrum between visible and microwave 1.2. 4000 to 400 cm -1 (wave numbers) most interesting to organic
Infrared Spectroscopy An Instrumental Method for Detecting Functional Groups
 Infrared Spectroscopy An Instrumental Method for Detecting Functional Groups 1 The Electromagnetic Spectrum Infrared Spectroscopy I. Physics Review Frequency, υ (nu), is the number of wave cycles that
Infrared Spectroscopy: Identification of Unknown Substances
 Infrared Spectroscopy: Identification of Unknown Substances Suppose a white powder is one of the four following molecules. How can they be differentiated? H N N H H H H Na H H H H H A technique that is
12. Structure Determination: Mass Spectrometry and Infrared Spectroscopy
 12. Structure Determination: Mass Spectrometry and Infrared Spectroscopy Determining the Structure of an Organic Compound The analysis of the outcome of a reaction requires that we know the full structure
How to Interpret an Infrared (IR) Spectrum
 Spectrum") How to Interpret an Infrared (IR) Spectrum Infrared (IR) Spectroscopy allows the identification of particular bonds present within molecules. In this class we have simplified IR analysis by only focusing
How to Interpret an Infrared (IR) Spectrum Infrared (IR) Spectroscopy allows the identification of particular bonds present within molecules. In this class we have simplified IR analysis by only focusing
Infrared Spectroscopy: How to use the 5 zone approach to identify functional groups
 Infrared Spectroscopy: How to use the 5 zone approach to identify functional groups Definition: Infrared Spectroscopy is the study of the Infrared Spectrum. An Infrared Spectrum is the plot of photon energy
Table 8.2 Detailed Table of Characteristic Infrared Absorption Frequencies
 Table 8.2 Detailed Table of Characteristic Infrared Absorption Frequencies The hydrogen stretch region (3600 2500 cm 1 ). Absorption in this region is associated with the stretching vibration of hydrogen
CHEM 3.2 (AS91388) 3 credits. Demonstrate understanding of spectroscopic data in chemistry
 3 credits. Demonstrate understanding of spectroscopic data in chemistry") CHEM 3.2 (AS91388) 3 credits Demonstrate understanding of spectroscopic data in chemistry Spectroscopic data is limited to mass, infrared (IR) and 13 C nuclear magnetic resonance (NMR) spectroscopy. Organic
CHEM 3.2 (AS91388) 3 credits Demonstrate understanding of spectroscopic data in chemistry Spectroscopic data is limited to mass, infrared (IR) and 13 C nuclear magnetic resonance (NMR) spectroscopy. Organic
ORGANIC - BRUICE 8E CH MASS SPECT AND INFRARED SPECTROSCOPY
 !! www.clutchprep.com CONCEPT: PURPOSE OF ANALYTICAL TECHNIQUES Classical Methods (Wet Chemistry): Chemists needed to run dozens of chemical reactions to determine the type of molecules in a compound.
Learning Guide for Chapter 3 - Infrared Spectroscopy
 Learning Guide for hapter 3 - Infrared Spectroscopy I. Introduction to spectroscopy - p 1 II. Molecular vibrations - p 3 III. Identifying functional groups - p 6 IV. Interpreting an IR spectrum - p 12
Spectroscopy. Page 1 of 8 L.Pillay (2012)
") Spectroscopy Electromagnetic radiation is widely used in analytical chemistry. The identification and quantification of samples using electromagnetic radiation (light) is called spectroscopy. Light has
Spectroscopy Electromagnetic radiation is widely used in analytical chemistry. The identification and quantification of samples using electromagnetic radiation (light) is called spectroscopy. Light has
Infrared spectroscopy Basic theory
 Infrared spectroscopy Basic theory Dr. Davide Ferri Paul Scherrer Institut 056 310 27 81 davide.ferri@psi.ch Importance of IR spectroscopy in catalysis IR Raman NMR XAFS UV-Vis EPR 0 200 400 600 800 1000
Ultraviolet-Visible and Infrared Spectrophotometry
 Ultraviolet-Visible and Infrared Spectrophotometry Ahmad Aqel Ifseisi Assistant Professor of Analytical Chemistry College of Science, Department of Chemistry King Saud University P.O. Box 2455 Riyadh 11451
Symmetric Stretch: allows molecule to move through space
 BACKGROUND INFORMATION Infrared Spectroscopy Before introducing the subject of IR spectroscopy, we must first review some aspects of the electromagnetic spectrum. The electromagnetic spectrum is composed
Spectroscopy. Fourier Transform Infrared (FT-IR) Spectroscopy
 Spectroscopy") Fourier Transform Infrared (FT-IR) Spectroscopy Learning objectives Learning outcomes After completing this course, the student will be able to: Recognize the concept and principle of FT-IR Spectroscopy
Fourier Transform Infrared (FT-IR) Spectroscopy Learning objectives Learning outcomes After completing this course, the student will be able to: Recognize the concept and principle of FT-IR Spectroscopy
Infrared Spectroscopy
 Infrared Spectroscopy (Chapter 12) 1 This reaction from Ochem 1 How do we know if it worked? The reactant is cyclohexene; the product is cyclohexanol. How can we tell the difference? Infrared Spectroscopy
EXPT. 7 CHARACTERISATION OF FUNCTIONAL GROUPS USING IR SPECTROSCOPY
 EXPT. 7 CHARACTERISATION OF FUNCTIONAL GROUPS USING IR SPECTROSCOPY Structure 7.1 Introduction Objectives 7.2 Principle 7.3 Requirements 7.4 Strategy for the Interpretation of IR Spectra 7.5 Practice Problems
Types of Molecular Vibrations
 Important concepts in IR spectroscopy Vibrations that result in change of dipole moment give rise to IR absorptions. The oscillating electric field of the radiation couples with the molecular vibration
24/ Rayleigh and Raman scattering. Stokes and anti-stokes lines. Rotational Raman spectroscopy. Polarizability ellipsoid. Selection rules.
 Subject Chemistry Paper No and Title Module No and Title Module Tag 8/ Physical Spectroscopy 24/ Rayleigh and Raman scattering. Stokes and anti-stokes lines. Rotational Raman spectroscopy. Polarizability
Infrared Spectroscopy used to analyze the presence of functional groups (bond types) in organic molecules How IR spectroscopy works:
 in organic molecules How IR spectroscopy works:") Infrared Spectroscopy used to analyze the presence of functional groups (bond types) in organic molecules It is the study of the interaction of infrared energy with organic molecules; the process analyzes
Infrared Spectroscopy used to analyze the presence of functional groups (bond types) in organic molecules It is the study of the interaction of infrared energy with organic molecules; the process analyzes
(2) Read each statement carefully and pick the one that is incorrect in its information.
 Read each statement carefully and pick the one that is incorrect in its information.") Organic Chemistry - Problem Drill 17: IR and Mass Spectra No. 1 of 10 1. Which statement about infrared spectroscopy is incorrect? (A) IR spectroscopy is a method of structure determination based on the
Organic Chemistry - Problem Drill 17: IR and Mass Spectra No. 1 of 10 1. Which statement about infrared spectroscopy is incorrect? (A) IR spectroscopy is a method of structure determination based on the
Model Answer (Paper code: AR-7112) M. Sc. (Physics) IV Semester Paper I: Laser Physics and Spectroscopy
 M. Sc. (Physics) IV Semester Paper I: Laser Physics and Spectroscopy") Model Answer (Paper code: AR-7112) M. Sc. (Physics) IV Semester Paper I: Laser Physics and Spectroscopy Section I Q1. Answer (i) (b) (ii) (d) (iii) (c) (iv) (c) (v) (a) (vi) (b) (vii) (b) (viii) (a) (ix)
Model Answer (Paper code: AR-7112) M. Sc. (Physics) IV Semester Paper I: Laser Physics and Spectroscopy Section I Q1. Answer (i) (b) (ii) (d) (iii) (c) (iv) (c) (v) (a) (vi) (b) (vii) (b) (viii) (a) (ix)
Wavelength λ Velocity v. Electric Field Strength Amplitude A. Time t or Distance x time for 1 λ to pass fixed point. # of λ passing per s ν= 1 p
 Introduction to Spectroscopy (Chapter 6) Electromagnetic radiation (wave) description: Wavelength λ Velocity v Electric Field Strength 0 Amplitude A Time t or Distance x Period p Frequency ν time for 1
i e l d f Energy (E) = Direction visible ultraviolet X-ray gamma infrared
 = Direction visible ultraviolet X-ray gamma infrared") rganic Structure Determination Analytical hemistry Instrument-based methods for determination of structure of organic molecules 1) Infrared Spectroscopy - yields functional groups 2) M Spectroscopy - very
rganic Structure Determination Analytical hemistry Instrument-based methods for determination of structure of organic molecules 1) Infrared Spectroscopy - yields functional groups 2) M Spectroscopy - very
Organic Compound Identification Using Infrared Spectroscopy. Description
 Return to paper Organic Compound Identification Using Infrared Spectroscopy Dr. Walt Volland, Bellevue Community College All rights reserved 1999, Bellevue, Washington Description This exercise is intended
General Infrared Absorption Ranges of Various Functional Groups
 General Infrared Absorption Ranges of Various Functional Groups Frequency Range Bond Type of Compound cm -1 Intensity C Alkanes 2850-2970 Strong 1340-1470 Strong C Alkenes 3010-3095 Medium 675-995 Strong
Skoog Chapter 6 Introduction to Spectrometric Methods
 Skoog Chapter 6 Introduction to Spectrometric Methods General Properties of Electromagnetic Radiation (EM) Wave Properties of EM Quantum Mechanical Properties of EM Quantitative Aspects of Spectrochemical
MASS and INFRA RED SPECTROSCOPY
 MASS and INFRA RED SPECTRSCPY Mass Spectroscopy The mass spectrometer was looked at in Unit 1. It was noted there that compounds produce fragmentation patterns when passes through a mass spectrometer.
Fourier Transform Infrared Spectroscopy of Metal Ligand Complexes *
 OpenStax-CNX module: m34660 1 Fourier Transform Infrared Spectroscopy of Metal Ligand Complexes * Jiebo Li Andrew R. Barron This work is produced by OpenStax-CNX and licensed under the Creative Commons
Welcome to Organic Chemistry II
 Welcome to Organic Chemistry II Erika Bryant, Ph.D. erika.bryant@hccs.edu Class Syllabus 3 CHAPTER 12: STRUCTURE DETERMINATION 4 What is this solution Soda Tea Coffee??? 5 What is this solution Soda Tea
Material Analysis. What do you want to know about your sample? How do you intend to do for obtaining the desired information from your sample?
 Material Analysis What do you want to know about your sample? How do you intend to do for obtaining the desired information from your sample? Why can you acquire the proper information? Symmetrical stretching
Ultraviolet-Visible and Infrared Spectrophotometry
 Ultraviolet-Visible and Infrared Spectrophotometry Ahmad Aqel Ifseisi Assistant Professor of Analytical Chemistry College of Science, Department of Chemistry King Saud University P.O. Box 2455 Riyadh 11451
Lecture 13 Organic Chemistry 1
 EM 232 rganic hemistry I at hicago Lecture 13 rganic hemistry 1 Professor Duncan Wardrop February 23, 2010 1 EM 232 rganic hemistry I at hicago Spectroscopy & Spectrometry hapter 13 2 EM 232 rganic hemistry
Infrared Spectroscopy. Provides information about the vibraions of functional groups in a molecule
 Infrared Spectroscopy Provides information about the vibraions of functional groups in a molecule Therefore, the functional groups present in a molecule can be deduced from an IR spectrum Two important
Snowy Range Instruments
 Snowy Range Instruments Cary 81 2000 W Hg Arc JY U-1000 5 W Ar + Laser DL Solution 852 200 mw SnRI CBEx 785 100 mw What is Raman Spectroscopy? Raman spectroscopy is a form of molecular spectroscopy. It
Spectroscopy in Inorganic Chemistry. Vibration and Rotation Spectroscopy
 Spectroscopy in Inorganic Chemistry Vibrational energy levels in a diatomic molecule f = k r r V = ½kX 2 Force constant r Displacement from equilibrium point 2 X= r=r-r eq V = ½kX 2 Fundamental Vibrational
Organic Spectra Infra Red Spectroscopy H. D. Roth. THEORY and INTERPRETATION of ORGANIC SPECTRA H. D. Roth. Infra Red Spectroscopy
 rganic Spectra Infra Red Spectroscopy. D. Roth TERY and INTERPRETATIN of RGANI SPETRA. D. Roth Infra Red Spectroscopy Infrared spectroscopy (IR) is an analytical technique concerned with molecular vibrations
Learning Guide for Chapter 3 - Infrared Spectroscopy
 Learning Guide for hapter 3 - Infrared Spectroscopy I. Introduction to spectroscopy - p 1 II. Molecular vibrations - p 3 III. Identifying functional groups - p 6 IV. Interpreting an IR spectrum - p 12
Study of Phase Transitions by Means of Raman Scattering
 Study of Phase Transitions by Means of Raman Scattering M. Mahbubur Rahman Department of Physics & Physical Oceanography Memorial University, Canada Outlines Introduction Advantages of Raman spectroscopy?
IR absorption spectroscopy
 IR absorption spectroscopy IR spectroscopy - an analytical technique which helps determine molecules structure When a molecule absorbs IR radiation, the vibrational energy of the molecule increase! The
UV-Vis Spectroscopy. Chem 744 Spring Gregory R. Cook, NDSU Thursday, February 14, 13
 UV-Vis Spectroscopy Chem 744 Spring 2013 UV-Vis Spectroscopy Every organic molecule absorbs UV-visible light Energy of electronic transitions saturated functionality not in region that is easily accessible
Molecular Spectroscopy. H 2 O e -
 Molecular Spectroscopy ν (cm -1 ) λ (cm) 10 6 10 8 10 10 10 12 10 14 10 16 10 18 10 20 10 22 ν (Hz) NMR ESR microwave IR UV/Vis VUV X-Ray Gamma Ray H 2 e - UV/Vis Spectroscopy absorption technique X hν
MOLECULAR REPRESENTATIONS AND INFRARED SPECTROSCOPY
 MOLEULAR REPRESENTATIONS AND INFRARED SPETROSOPY A STUDENT SOULD BE ABLE TO: 1. Given a Lewis (dash or dot), condensed, bond-line, or wedge formula of a compound draw the other representations. 2. Give
two slits and 5 slits
 Electronic Spectroscopy 2015January19 1 1. UV-vis spectrometer 1.1. Grating spectrometer 1.2. Single slit: 1.2.1. I diffracted intensity at relative to un-diffracted beam 1.2.2. I - intensity of light
Advanced Spectroscopy Laboratory
 Advanced Spectroscopy Laboratory - Raman Spectroscopy - Emission Spectroscopy - Absorption Spectroscopy - Raman Microscopy - Hyperspectral Imaging Spectroscopy FERGIELAB TM Raman Spectroscopy Absorption
Chemistry Instrumental Analysis Lecture 3. Chem 4631
 Chemistry 4631 Instrumental Analysis Lecture 3 Quantum Transitions The energy of a photon can also be transferred to an elementary particle by adsorption if the energy of the photon exactly matches the
6. CHARACTERIZATION OF AS (III) IONS BIOSORPTION BY THE LIVE, HEAT AND ALKALINE- TREATED FUNGAL BIOMASS ON THE BASICS OF SURFACE STUDIES
 IONS BIOSORPTION BY THE LIVE, HEAT AND ALKALINE- TREATED FUNGAL BIOMASS ON THE BASICS OF SURFACE STUDIES") 6. CHARACTERIZATION OF AS (III) IONS BIOSORPTION BY THE LIVE, HEAT AND ALKALINE- TREATED FUNGAL BIOMASS ON THE BASICS OF SURFACE STUDIES 6. Introduction Infrared spectroscopy is a technique used to identify
6. CHARACTERIZATION OF AS (III) IONS BIOSORPTION BY THE LIVE, HEAT AND ALKALINE- TREATED FUNGAL BIOMASS ON THE BASICS OF SURFACE STUDIES 6. Introduction Infrared spectroscopy is a technique used to identify
CHE 325 SPECTROSCOPY (A) CHAP 13A ASSIGN CH 2 CH CH 2 CH CHCH 3
 CHAP 13A ASSIGN CH 2 CH CH 2 CH CHCH 3") CE 325 SPECTRSCPY (A) CAP 13A ASSIGN 1. Which compound would have a UV absorption band at longest wavelength? A. I B. II C. III D. IV E. V C CC 3 CC C 2 C CC 3 I II III C 2 C C 2 C CC 3 IV V 2. Select
CE 325 SPECTRSCPY (A) CAP 13A ASSIGN 1. Which compound would have a UV absorption band at longest wavelength? A. I B. II C. III D. IV E. V C CC 3 CC C 2 C CC 3 I II III C 2 C C 2 C CC 3 IV V 2. Select
Raman and stimulated Raman spectroscopy of chlorinated hydrocarbons
 Department of Chemistry Physical Chemistry Göteborg University KEN140 Spektroskopi Raman and stimulated Raman spectroscopy of chlorinated hydrocarbons WARNING! The laser gives a pulsed very energetic and
William H. Brown & Christopher S. Foote
 Requests for permission to make copies of any part of the work should be mailed to:permissions Department, Harcourt Brace & Company, 6277 Sea Harbor Drive, Orlando, Florida 32887-6777 William H. Brown
ORGANIC - CLUTCH CH ANALYTICAL TECHNIQUES: IR, NMR, MASS SPECT
 !! www.clutchprep.com CONCEPT: PURPOSE OF ANALYTICAL TECHNIQUES Classical Methods (Wet Chemistry): Chemists needed to run dozens of chemical reactions to determine the type of molecules in a compound.
C h a p t e r F o u r t e e n: Structure Determination: Mass Spectrometry and Infrared Spectroscopy
 C h a p t e r F o u r t e e n: Structure Determination: Mass Spectrometry and Infrared Spectroscopy Cl OH Cl An electron ionization mass spectrum of 2,5-dichlorophenol CHM 323: Summary of Important Concepts
Vibrations. Matti Hotokka
 Vibrations Matti Hotokka Identify the stuff I ve seen this spectrum before. I know what the stuff is Identify the stuff Let s check the bands Film: Polymer Aromatic C-H Aliphatic C-H Group for monosubstituted
UV / Visible Spectroscopy. Click icon to add picture
 UV / Visible Spectroscopy Click icon to add picture Spectroscopy It is the branch of science that deals with the study of interaction of matter with light. OR It is the branch of science that deals with
Look for absorption bands in decreasing order of importance:
 1. Match the following to their IR spectra (30 points) Look for absorption bands in decreasing order of importance: a e a 2941 1716 d f b 3333 c b 1466 1.the - absorption(s) between 3100 and 2850 cm-1.
More information can be found in Chapter 12 in your textbook for CHEM 3750/ 3770 and on pages in your laboratory manual.
 CHEM 3780 rganic Chemistry II Infrared Spectroscopy and Mass Spectrometry Review More information can be found in Chapter 12 in your textbook for CHEM 3750/ 3770 and on pages 13-28 in your laboratory manual.
Infra Red Spectroscopy
 CH 2252 Instrumental Methods of Analysis Unit I Infra Red Spectroscopy M. Subramanian Assistant Professor Department of Chemical Engineering Sri Sivasubramaniya Nadar College of Engineering Kalavakkam
ORGANIC - CLUTCH CH ANALYTICAL TECHNIQUES: IR, NMR, MASS SPECT
 !! www.clutchprep.com CONCEPT: PURPOSE OF ANALYTICAL TECHNIQUES Classical Methods (Wet Chemistry): Chemists needed to run dozens of chemical reactions to determine the type of molecules in a compound.
A56. Raman Spektroscopy. Jan Publisher: Institute of Physical Chemistry
 Physikalische-Chemisches Praktikum für Anfänger A56 Raman Spektroscopy Jan. 2017 Publisher: Institute of Physical Chemistry 1 Objectives 1. Take the Raman spectra of CO 2 (s), CS 2 (l), C 6 H 6 (l) and
Electronic Spectra of Complexes
 Electronic Spectra of Complexes Interpret electronic spectra of coordination compounds Correlate with bonding Orbital filling and electronic transitions Electron-electron repulsion Application of MO theory
Molecular Geometry: VSEPR model stand for valence-shell electron-pair repulsion and predicts the 3D shape of molecules that are formed in bonding.
 Molecular Geometry: VSEPR model stand for valence-shell electron-pair repulsion and predicts the 3D shape of molecules that are formed in bonding. Sigma and Pi Bonds: All single bonds are sigma(σ), that
A very brief history of the study of light
 1. Sir Isaac Newton 1672: A very brief history of the study of light Showed that the component colors of the visible portion of white light can be separated through a prism, which acts to bend the light
1. Which compound would you expect to have the lowest boiling point? A) NH 2 B) NH 2
 NH 2 B) NH 2") MULTIPLE CICE QUESTINS Topic: Intermolecular forces 1. Which compound would you expect to have the lowest boiling point? A) N 2 B) N 2 C) N D) E) N Ans: : N 2 D Topic: Molecular geometry, dipole moment
MULTIPLE CICE QUESTINS Topic: Intermolecular forces 1. Which compound would you expect to have the lowest boiling point? A) N 2 B) N 2 C) N D) E) N Ans: : N 2 D Topic: Molecular geometry, dipole moment
Infrared Spectroscopy
 x-rays ultraviolet (UV) visible Infrared (I) microwaves radiowaves near I middle I far I λ (cm) 8 x 10⁻⁵ 2.5 x 10⁻⁴ 2.5 x 10⁻³ 2.5 x 10⁻² µ 0.8 2.5 25 250 ν (cm -1 ) 13,000 4,000 400 40 ν (cm -1 1 ) =
ORGANIC - EGE 5E CH UV AND INFRARED MASS SPECTROMETRY
 !! www.clutchprep.com CONCEPT: IR SPECTROSCOPY- FREQUENCIES There are specific absorption frequencies in the functional group region that we should be familiar with EXAMPLE: What are the major IR absorptions
Spectroscopy tools for PAT applications in the Pharmaceutical Industry
 Spectroscopy tools for PAT applications in the Pharmaceutical Industry Claude Didierjean Sr. Technology and Applications Consultant Real Time Analytics Mettler Toledo AutoChem, Inc. claude.didierjean@mt.com
Lecture 10. Lidar Effective Cross-Section vs. Convolution
 Lecture 10. Lidar Effective Cross-Section vs. Convolution q Introduction q Convolution in Lineshape Determination -- Voigt Lineshape (Lorentzian Gaussian) q Effective Cross Section for Single Isotope --
Spectroscopy in Inorganic Chemistry. Vibration and Rotation Spectroscopy
 Spectroscopy in Inorganic Chemistry Symmetry requirement for coupling combination bands and Fermi resonance 2 3 V 3 1505 cm -1 (R, IR) E' stretches v 1 888 cm -1 (R) A 1 ' stretch V 2 718 cm -1 (IR) A
FTIR Spectrometer. Basic Theory of Infrared Spectrometer. FTIR Spectrometer. FTIR Accessories
 FTIR Spectrometer Basic Theory of Infrared Spectrometer FTIR Spectrometer FTIR Accessories What is Infrared? Infrared radiation lies between the visible and microwave portions of the electromagnetic spectrum.
Infra-red Spectroscopy
 Molecular vibrations are associated with the absorption of energy (infrared activity) by the molecule as sets of atoms (molecular moieties) vibrate about the mean center of their chemical bonds. Infra-red
Chemistry 213 Practical Spectroscopy
 Chemistry 213 Practical Spectroscopy Dave Berg djberg@uvic.ca Elliott 314 A course in determining structure by spectroscopic methods Different types of spectroscopy afford different information about molecules
Specialized Raman Techniques. Strictly speaking the radiation-induced dipole moment should be expressed as
 Nonlinear effects Specialized Raman Techniques Strictly speaking the radiation-induced dipole moment should be expressed as M = E + ½E 2 + (1/6)E 3 +... Where and are the first and second hyperpolarizabilities.
E35 SPECTROSCOPIC TECHNIQUES IN ORGANIC CHEMISTRY
 E35 SPECTRSCPIC TECNIQUES IN RGANIC CEMISTRY Introductory Comments. These notes are designed to introduce you to the basic spectroscopic techniques which are used for the determination of the structure
Using NMR and IR Spectroscopy to Determine Structures Dr. Carl Hoeger, UCSD
 Using NMR and IR Spectroscopy to Determine Structures Dr. Carl Hoeger, UCSD The following guidelines should be helpful in assigning a structure from NMR (both PMR and CMR) and IR data. At the end of this
Chapter 4 Ultraviolet and visible spectroscopy Molecular Spectrophotometry
 Chapter 4 Ultraviolet and visible spectroscopy Molecular Spectrophotometry Properties of light Electromagnetic radiation and electromagnetic spectrum Absorption of light Beer s law Limitation of Beer s
Homework Assignment #3
 Chemistry 12600 Spring 2016 Homework Assignment #3 1. Determine whether each of the following statements is true or false. If the statement is false, modify and rewrite it so that it is a true statement.
Spectroscopic techniques: why, when, where,and how Dr. Roberto GIANGIACOMO
 Spectroscopic techniques: why, when, where,and how Dr. Roberto GIANGIACOMO BASIC INFORMATION Spectroscopy uses light to analyze substances or products by describing the energy transfer between light and
Chapter 17: Fundamentals of Spectrophotometry
 Chapter 17: Fundamentals of Spectrophotometry Spectroscopy: the science that deals with interactions of matter with electromagnetic radiation or other forms energy acoustic waves, beams of particles such
Answers to questions on exam in laser-based combustion diagnostics on March 10, 2006
 Answers to questions on exam in laser-based combustion diagnostics on March 10, 2006 1. Examples of advantages and disadvantages with laser-based combustion diagnostic techniques: + Nonintrusive + High
7a. Structure Elucidation: IR and 13 C-NMR Spectroscopies (text , , 12.10)
") 2009, Department of Chemistry, The University of Western Ontario 7a.1 7a. Structure Elucidation: IR and 13 C-NMR Spectroscopies (text 11.1 11.5, 12.1 12.5, 12.10) A. Electromagnetic Radiation Energy is
2009, Department of Chemistry, The University of Western Ontario 7a.1 7a. Structure Elucidation: IR and 13 C-NMR Spectroscopies (text 11.1 11.5, 12.1 12.5, 12.10) A. Electromagnetic Radiation Energy is
Chem HH W11 Notes - Dr. Masato Koreeda Date: January 5, 2011 Topic: _IR Spectroscopy_ page 1 of 3. fingerprint region
 hem 215-216 W11 Notes - Dr. Masato Koreeda Date: January 5, 2011 Topic: _I Spectroscopy_ page 1 of 3. Infra-red (I) Spectroscopy (Ege s book: Section 12.2; hapter 3 of the textbook arwood/laridge) Uses
Chemistry 343- Spring 2008
 Chemistry 343- Spring 2008 27 Chapter 2- Representative Carbon Compounds: Functional Groups, Intermolecular Forces and IR Spectroscopy A. ydrocarbons: Compounds composed of only C and Four Basic Types:
Vibrational Spectroscopies. C-874 University of Delaware
 Vibrational Spectroscopies C-874 University of Delaware Vibrational Spectroscopies..everything that living things do can be understood in terms of the jigglings and wigglings of atoms.. R. P. Feymann Vibrational
CHM 223 Organic Chemistry I Prof. Chad Landrie. Lecture 10: September 20, 2018 Ch. 12: Spectroscopy mass spectrometry infrared spectroscopy
 M 223 Organic hemistry I Prof. had Landrie Lecture 10: September 20, 2018 h. 12: Spectroscopy mass spectrometry infrared spectroscopy i>licker Question onsider a solution that contains 65g R enantiomer
Chem Homework Set Answers
 Chem 310 th 4 Homework Set Answers 1. Cyclohexanone has a strong infrared absorption peak at a wavelength of 5.86 µm. (a) Convert the wavelength to wavenumber.!6!1 8* = 1/8 = (1/5.86 µm)(1 µm/10 m)(1 m/100