Introduction. The analysis of the outcome of a reaction requires that we know the full structure of the products as well as the reactants
|
|
|
- Melissa Knight
- 5 years ago
- Views:
Transcription

1
2 Introduction The analysis of the outcome of a reaction requires that we know the full structure of the products as well as the reactants
 spectroscopies: are nondestructive involve interaction of molecules with electromagnetic energy rather than with high-energy electron")
3 Spectroscopy and the Electromagnetic Spectrum Unlike mass spectrometry, infrared (IR), ultraviolet (UV) and nuclear magnetic resonance (NMR) spectroscopies: are nondestructive involve interaction of molecules with electromagnetic energy rather than with high-energy electron beam
4 The Electromagnetic Spectrum The electromagnetic spectrum is the range of electromagnetic energy, including IR, UV and visible radiation
5 The electromagnetic spectrum covers a continuous range of wavelengths and frequencies, radio waves to g rays High n Low n Low l High l
6 Wavelength, Frequency and Amplitude
7 Wavelength (l) is the distance from one wave maximum to the next Frequency (n) - is the # of waves that pass by a fixed point per unit time (s -1 or Hz) Amplitude - is the height of a wave, measured from midpoint to peak Wavelength x Frequency = Speed l (m) x n (s -1 ) = c l = c n n = c l Speed of light: C vacuum = 3.00 x 10 8 m/s
8 The Planck equation gives: e = hn = hc l where e = Energy of 1 photon (1 quantum) h = Planck s constant (6.62 x10⁻³⁴ J.s) n = Frequency (s -1 ) l = Wavelength (m) c = Speed of light (3.00 x 10 8 m/s) Radiant energy is proportional to its frequency and inversely proportional to its wavelength
 h = Planck s")
9 The Planck equation can be rewritten: N A hc E = N A e = = l 1.20 x 10⁻⁴ kj/mol l where E = Energy of Avogadro s number of photons N A = Avogadro s number e = Energy of 1 photon (1 quantum) h = Planck s constant (6.62 x10⁻³⁴ J.s) c = Speed of light (3.00 x 10 8 m/s) l = Wavelength (m)

10 An absorption spectrum shows the wavelength on the x-axis and the intensity of the various energy absorptions expressed in % transmittance on the y-axis. Ethyl alcohol CH 3 CH 2 OH

11 Infrared Spectroscopy of Organic Molecules The infrared (IR) region is lower in photon energy than visible light Only m to m region is used by organic chemists for structural analysis
12 Absorption Spectrum IR energy in a spectrum is usually measured as wavenumber ~ Wavenumber (n) is the inverse of wavelength is proportional to frequency is expressed in cm -1 Wavenumber (cm -1 ) = 1 l (cm) Specific IR absorbed by organic molecule is related to its structure
13 Infrared Energy Modes Molecules are in constant motion (i.e bond stretching, contracting, bending ) Their energy is quantized
14 Infrared Energy Modes Combinations of atomic movements, such as bending and stretching of bonds between groups of atoms, are called normal modes IR energy absorption corresponds to specific modes
15 Infrared Energy Modes When a molecule is irradiated with electromagnetic radiation, energy is absorbed if the frequency of the radiation matches the frequency of the vibration. Energy absorption increases amplitude for the vibration
16 Infrared Energy Modes IR energy - is characteristic of the atoms in the group and their bonding - corresponds to the amount of energy needed to increase the amplitude of specific molecular vibrations
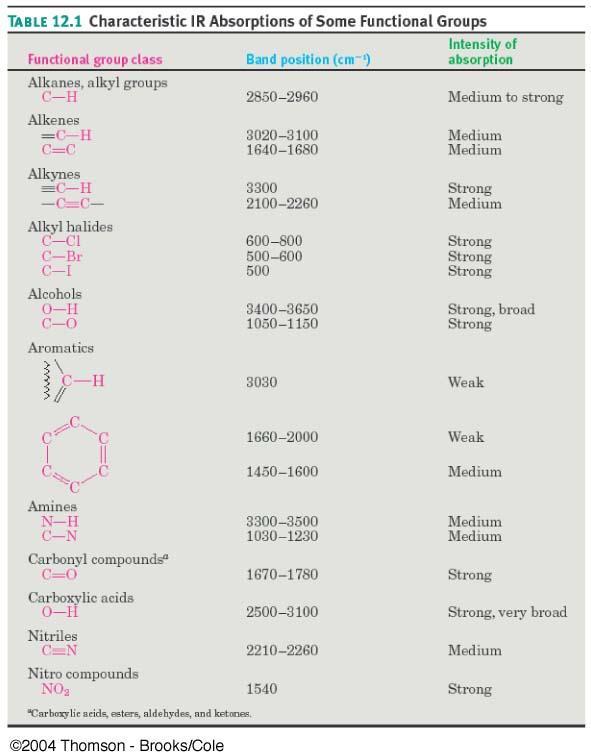
17 Interpreting Infrared Spectra Most functional groups absorb at about the same energy and intensity independent of the molecule in which they are. Characteristic IR absorptions can be used to confirm the presence of a functional group in a molecule are listed in Table 12.1
18
19 Fingerprint Region of Infrared Absorption Spectrum IR spectrum has a lower energy region characteristic of molecule as a whole known as fingerprint region. Its range goes from 1500 cm -1 to 400 cm -1

20 Hexane 1-hexene 1-hexyne
21 Regions of Infrared Absorption Spectrum cm -1 N-H, C-H, O-H (stretching) N-H, O-H 3000 C-H cm -1 C C and C N (stretching)
22 Regions of Infrared Absorption Spectrum cm -1 double bonds C=O, C=C C=N (stretching) C=O C=C cm -1 Below 1500 cm -1 fingerprint region
23 Differences in Infrared Absorptions Molecules vibrate and rotate in normal modes, which are combinations of motions These are related to force constants Bond stretching dominates higher energy (frequency) modes
24 Differences in Infrared Absorptions Light objects connected to heavy objects vibrate fastest (at higher frequencies): C-H, N-H, O-H > C-O, C-N For two heavy atoms, stronger bond requires more energy (higher frequency): C C, C N > C=C, C=O, C=N > C-C, C-O, C-N, C-X
25 8. Infrared Spectra of Hydrocarbons C-H, C-C, C=C, C C have characteristic peaks

26 Example: Hexane
27 Alkenes

28 Example: 1-hexene
29 Alkynes (Terminal alkyne)

30 Example: 1-hexyne
31 Practice Problem: The IR spectrum of phenylacetylene is shown below. What absorption bands can you identify?
32 Infrared Spectra of Some Common Functional Groups Spectroscopic behavior of functional groups is discussed in later chapters Brief summaries are presented here
33 Alcohols Example: Cyclohexanol

34 Amines Example: Cyclohexylamine
35 Aromatic Compounds
36 Example: phenylacetylene Ring bonds cm -1
37 Carbonyl Compounds Strong, sharp C=O peak at 1670 to 1780 cm -1 The exact position of absorption within the range is characteristic of each type of carbonyl compound. It can often be used to identify aldehydes, ketones, and esters.
38 Aldehydes 1730 cm -1 in saturated aldehydes 1705 cm -1 in aldehydes next to double bond or aromatic ring
39 Example: Phenylacetaldehyde C=O 1725 cm -1
40 Ketones 1715 cm -1 in six-membered ring or acyclic ketones 1750 cm -1 in five-membered ring ketones 1690 cm -1 in ketones next to a double bond or an aromatic ring

41 Example: cyclohexanone 1715 cm -1 Ring bonds cm -1
42 Esters 1735 cm -1 in saturated esters 1715 cm -1 in esters next to aromatic ring or a double bond

43 Problem 1: Cyclohexane or Cyclohexene?
44 Problem 2: Propose structure(s) for unknown hydrocarbon
 for unknown")
45 Problem 3: Propose structure(s) for unknown hydrocarbon

46
Radiant energy is proportional to its frequency (cycles/s = Hz) as a wave (Amplitude is its height) Different types are classified by frequency or
 as a wave (Amplitude is its height) Different types are classified by frequency or") CHEM 241 UNIT 5: PART B INFRA-RED RED SPECTROSCOPY 1 Spectroscopy of the Electromagnetic Spectrum Radiant energy is proportional to its frequency (cycles/s = Hz) as a wave (Amplitude is its height) Different
CHEM 241 UNIT 5: PART B INFRA-RED RED SPECTROSCOPY 1 Spectroscopy of the Electromagnetic Spectrum Radiant energy is proportional to its frequency (cycles/s = Hz) as a wave (Amplitude is its height) Different
Welcome to Organic Chemistry II
 Welcome to Organic Chemistry II Erika Bryant, Ph.D. erika.bryant@hccs.edu Class Syllabus 3 CHAPTER 12: STRUCTURE DETERMINATION 4 What is this solution Soda Tea Coffee??? 5 What is this solution Soda Tea
12. Structure Determination: Mass Spectrometry and Infrared Spectroscopy
 12. Structure Determination: Mass Spectrometry and Infrared Spectroscopy Determining the Structure of an Organic Compound The analysis of the outcome of a reaction requires that we know the full structure
Infrared Spectroscopy
 Infrared Spectroscopy Introduction Spectroscopy is an analytical technique which helps determine structure. It destroys little or no sample. The amount of light absorbed by the sample is measured as wavelength
Lecture 11. IR Theory. Next Class: Lecture Problem 4 due Thin-Layer Chromatography
 Lecture 11 IR Theory Next Class: Lecture Problem 4 due Thin-Layer Chromatography This Week In Lab: Ch 6: Procedures 2 & 3 Procedure 4 (outside of lab) Next Week in Lab: Ch 7: PreLab Due Quiz 4 Ch 5 Final
Infrared Spectroscopy: Identification of Unknown Substances
 Infrared Spectroscopy: Identification of Unknown Substances Suppose a white powder is one of the four following molecules. How can they be differentiated? H N N H H H H Na H H H H H A technique that is
Determining the Structure of an Organic Compound
 Chapter 12- Structure Determination: Mass Spectrometry and Infrared Spectroscopy Ashley Piekarski, Ph.D. Determining the Structure of an Organic Compound The analysis of the outcome of a reac=on requires
Chapter 12 Mass Spectrometry and Infrared Spectroscopy
 Organic Chemistry, 6 th Edition L. G. Wade, Jr. Chapter 12 Mass Spectrometry and Infrared Spectroscopy Jo Blackburn Richland College, Dallas, TX Dallas County Community College District 2006, Prentice
ORGANIC - BROWN 8E CH INFRARED SPECTROSCOPY.
 !! www.clutchprep.com CONCEPT: PURPOSE OF ANALYTICAL TECHNIQUES Classical Methods (Wet Chemistry): Chemists needed to run dozens of chemical reactions to determine the type of molecules in a compound.
CHEM 3.2 (AS91388) 3 credits. Demonstrate understanding of spectroscopic data in chemistry
 3 credits. Demonstrate understanding of spectroscopic data in chemistry") CHEM 3.2 (AS91388) 3 credits Demonstrate understanding of spectroscopic data in chemistry Spectroscopic data is limited to mass, infrared (IR) and 13 C nuclear magnetic resonance (NMR) spectroscopy. Organic
CHEM 3.2 (AS91388) 3 credits Demonstrate understanding of spectroscopic data in chemistry Spectroscopic data is limited to mass, infrared (IR) and 13 C nuclear magnetic resonance (NMR) spectroscopy. Organic
Chapter 12 Structure Determination: Mass Spectrometry and Infrared Spectroscopy
 Chapter 12 Structure Determination: Mass Spectrometry and Infrared Spectroscopy Figure 12.1 - The electron-ionization, magneticsector mass spectrometer Representing the Mass Spectrum Base Peak Parent
Infrared Spectroscopy An Instrumental Method for Detecting Functional Groups
 Infrared Spectroscopy An Instrumental Method for Detecting Functional Groups 1 The Electromagnetic Spectrum Infrared Spectroscopy I. Physics Review Frequency, υ (nu), is the number of wave cycles that
7a. Structure Elucidation: IR and 13 C-NMR Spectroscopies (text , , 12.10)
") 2009, Department of Chemistry, The University of Western Ontario 7a.1 7a. Structure Elucidation: IR and 13 C-NMR Spectroscopies (text 11.1 11.5, 12.1 12.5, 12.10) A. Electromagnetic Radiation Energy is
2009, Department of Chemistry, The University of Western Ontario 7a.1 7a. Structure Elucidation: IR and 13 C-NMR Spectroscopies (text 11.1 11.5, 12.1 12.5, 12.10) A. Electromagnetic Radiation Energy is
SPECTROSCOPY MEASURES THE INTERACTION BETWEEN LIGHT AND MATTER
 SPECTROSCOPY MEASURES THE INTERACTION BETWEEN LIGHT AND MATTER c = c: speed of light 3.00 x 10 8 m/s (lamda): wavelength (m) (nu): frequency (Hz) Increasing E (J) Increasing (Hz) E = h h - Planck s constant
Increasing energy. ( 10 4 cm -1 ) ( 10 2 cm -1 )
 ( 10 2 cm -1 )") The branch of science which deals with the interaction of electromagnetic radiation with matter is called spectroscopy The energy absorbed or emitted in each transition corresponds to a definite frequency
The branch of science which deals with the interaction of electromagnetic radiation with matter is called spectroscopy The energy absorbed or emitted in each transition corresponds to a definite frequency
ORGANIC - BRUICE 8E CH MASS SPECT AND INFRARED SPECTROSCOPY
 !! www.clutchprep.com CONCEPT: PURPOSE OF ANALYTICAL TECHNIQUES Classical Methods (Wet Chemistry): Chemists needed to run dozens of chemical reactions to determine the type of molecules in a compound.
Lecture 13 Organic Chemistry 1
 EM 232 rganic hemistry I at hicago Lecture 13 rganic hemistry 1 Professor Duncan Wardrop February 23, 2010 1 EM 232 rganic hemistry I at hicago Spectroscopy & Spectrometry hapter 13 2 EM 232 rganic hemistry
Structure Determination. How to determine what compound that you have? One way to determine compound is to get an elemental analysis
 Structure Determination How to determine what compound that you have? ne way to determine compound is to get an elemental analysis -basically burn the compound to determine %C, %H, %, etc. from these percentages
Infrared Spectroscopy
 Infrared Spectroscopy IR Spectroscopy Used to identify organic compounds IR spectroscopy provides a 100% identification if the spectrum is matched. If not, IR at least provides information about the types
Infrared Spectroscopy
 Infrared Spectroscopy (Chapter 12) 1 This reaction from Ochem 1 How do we know if it worked? The reactant is cyclohexene; the product is cyclohexanol. How can we tell the difference? Infrared Spectroscopy
Chemistry 213 Practical Spectroscopy
 Chemistry 213 Practical Spectroscopy Dave Berg djberg@uvic.ca Elliott 314 A course in determining structure by spectroscopic methods Different types of spectroscopy afford different information about molecules
Learning Guide for Chapter 3 - Infrared Spectroscopy
 Learning Guide for hapter 3 - Infrared Spectroscopy I. Introduction to spectroscopy - p 1 II. Molecular vibrations - p 3 III. Identifying functional groups - p 6 IV. Interpreting an IR spectrum - p 12
Organic Compound Identification Using Infrared Spectroscopy. Description
 Return to paper Organic Compound Identification Using Infrared Spectroscopy Dr. Walt Volland, Bellevue Community College All rights reserved 1999, Bellevue, Washington Description This exercise is intended
Infrared Spectroscopy. Provides information about the vibraions of functional groups in a molecule
 Infrared Spectroscopy Provides information about the vibraions of functional groups in a molecule Therefore, the functional groups present in a molecule can be deduced from an IR spectrum Two important
EXPT. 7 CHARACTERISATION OF FUNCTIONAL GROUPS USING IR SPECTROSCOPY
 EXPT. 7 CHARACTERISATION OF FUNCTIONAL GROUPS USING IR SPECTROSCOPY Structure 7.1 Introduction Objectives 7.2 Principle 7.3 Requirements 7.4 Strategy for the Interpretation of IR Spectra 7.5 Practice Problems
Symmetric Stretch: allows molecule to move through space
 BACKGROUND INFORMATION Infrared Spectroscopy Before introducing the subject of IR spectroscopy, we must first review some aspects of the electromagnetic spectrum. The electromagnetic spectrum is composed
Organic Chemistry: CHEM2322
 Etiquette & Course Overview Organic Chemistry: Structure Determination MS & IR Dr. Christopher J. O Brien 203 CRB, cobrien@uta.edu Classroom etiquette Arrive on time if you are late you must quietly take
CHM 223 Organic Chemistry I Prof. Chad Landrie. Lecture 10: September 20, 2018 Ch. 12: Spectroscopy mass spectrometry infrared spectroscopy
 M 223 Organic hemistry I Prof. had Landrie Lecture 10: September 20, 2018 h. 12: Spectroscopy mass spectrometry infrared spectroscopy i>licker Question onsider a solution that contains 65g R enantiomer
Application of IR Raman Spectroscopy
 Application of IR Raman Spectroscopy 3 IR regions Structure and Functional Group Absorption IR Reflection IR Photoacoustic IR IR Emission Micro 10-1 Mid-IR Mid-IR absorption Samples Placed in cell (salt)
CHE 325 SPECTROSCOPY (A) CHAP 13A ASSIGN CH 2 CH CH 2 CH CHCH 3
 CHAP 13A ASSIGN CH 2 CH CH 2 CH CHCH 3") CE 325 SPECTRSCPY (A) CAP 13A ASSIGN 1. Which compound would have a UV absorption band at longest wavelength? A. I B. II C. III D. IV E. V C CC 3 CC C 2 C CC 3 I II III C 2 C C 2 C CC 3 IV V 2. Select
CE 325 SPECTRSCPY (A) CAP 13A ASSIGN 1. Which compound would have a UV absorption band at longest wavelength? A. I B. II C. III D. IV E. V C CC 3 CC C 2 C CC 3 I II III C 2 C C 2 C CC 3 IV V 2. Select
Química Orgânica I. Ciências Farmacêuticas Bioquímica Química. IR spectroscopy AFB QO I 2007/08 1 AFB QO I 2007/08 2
 Química Orgânica I Ciências Farmacêuticas Bioquímica Química AFB QO I 2007/08 1 IR spectroscopy AFB QO I 2007/08 2 1 Adaptado de: Organic Chemistry, 6th Edition; L. G. Wade, Jr. Organic Chemistry, William
Infrared Spectroscopy
 x-rays ultraviolet (UV) visible Infrared (I) microwaves radiowaves near I middle I far I λ (cm) 8 x 10⁻⁵ 2.5 x 10⁻⁴ 2.5 x 10⁻³ 2.5 x 10⁻² µ 0.8 2.5 25 250 ν (cm -1 ) 13,000 4,000 400 40 ν (cm -1 1 ) =
CHEM 241 UNIT 5: PART A DETERMINATION OF ORGANIC STRUCTURES BY SPECTROSCOPIC METHODS [MASS SPECTROMETRY]
![CHEM 241 UNIT 5: PART A DETERMINATION OF ORGANIC STRUCTURES BY SPECTROSCOPIC METHODS [MASS SPECTROMETRY]](/thumbs/83/88348834.jpg "CHEM 241 UNIT 5: PART A DETERMINATION OF ORGANIC STRUCTURES BY SPECTROSCOPIC METHODS [MASS SPECTROMETRY]") CHEM 241 UNIT 5: PART A DETERMINATION OF ORGANIC STRUCTURES BY SPECTROSCOPIC METHODS [MASS SPECTROMETRY] 1 Introduction Outline Mass spectrometry (MS) 2 INTRODUCTION The analysis of the outcome of a reaction
CHEM 241 UNIT 5: PART A DETERMINATION OF ORGANIC STRUCTURES BY SPECTROSCOPIC METHODS [MASS SPECTROMETRY] 1 Introduction Outline Mass spectrometry (MS) 2 INTRODUCTION The analysis of the outcome of a reaction
C h a p t e r F o u r t e e n: Structure Determination: Mass Spectrometry and Infrared Spectroscopy
 C h a p t e r F o u r t e e n: Structure Determination: Mass Spectrometry and Infrared Spectroscopy Cl OH Cl An electron ionization mass spectrum of 2,5-dichlorophenol CHM 323: Summary of Important Concepts
ORGANIC - EGE 5E CH UV AND INFRARED MASS SPECTROMETRY
 !! www.clutchprep.com CONCEPT: IR SPECTROSCOPY- FREQUENCIES There are specific absorption frequencies in the functional group region that we should be familiar with EXAMPLE: What are the major IR absorptions
Infrared Spectroscopy: How to use the 5 zone approach to identify functional groups
 Infrared Spectroscopy: How to use the 5 zone approach to identify functional groups Definition: Infrared Spectroscopy is the study of the Infrared Spectrum. An Infrared Spectrum is the plot of photon energy
February 8, 2018 Chemistry 328N
 Lecture 7 UV-Vis spectroscopy February 8, 2018 First Midterm Exam When: Wednesday, 2/14 When: 7-9 PM (please do not be late) Where: WEL 2.122 This room!!! What: Covers material through today s lecture
UV / Visible Spectroscopy. Click icon to add picture
 UV / Visible Spectroscopy Click icon to add picture Spectroscopy It is the branch of science that deals with the study of interaction of matter with light. OR It is the branch of science that deals with
CH 3. mirror plane. CH c d
 CAPTER 20 Practice Exercises 20.1 The index of hydrogen deficiency is two. The structural possibilities include two double bonds, a double do 20.3 (a) As this is an alkane, it contains only C and and has
Topic 2.11 ANALYTICAL TECHNIQUES. High Resolution Mass Spectrometry Infra-red Spectroscopy
 Topic 2.11 ANALYTICAL TECHNIQUES High Resolution Mass Spectrometry Infra-red Spectroscopy HIGH RESOLUTION MASS SPECTROMETRY The technique of mass spectrometry was used in Unit 1 to: a) determine the relative
Table 8.2 Detailed Table of Characteristic Infrared Absorption Frequencies
 Table 8.2 Detailed Table of Characteristic Infrared Absorption Frequencies The hydrogen stretch region (3600 2500 cm 1 ). Absorption in this region is associated with the stretching vibration of hydrogen
Learning Guide for Chapter 3 - Infrared Spectroscopy
 Learning Guide for hapter 3 - Infrared Spectroscopy I. Introduction to spectroscopy - p 1 II. Molecular vibrations - p 3 III. Identifying functional groups - p 6 IV. Interpreting an IR spectrum - p 12
ORGANIC - CLUTCH CH ANALYTICAL TECHNIQUES: IR, NMR, MASS SPECT
 !! www.clutchprep.com CONCEPT: PURPOSE OF ANALYTICAL TECHNIQUES Classical Methods (Wet Chemistry): Chemists needed to run dozens of chemical reactions to determine the type of molecules in a compound.
Chapter 14 Spectroscopy
 hapter 14 Spectroscopy There are four major analytical techniques used for identifying the structure of organic molecules 1. Nuclear Magnetic Resonance or NMR is the single most important technique for
ORGANIC - CLUTCH CH ANALYTICAL TECHNIQUES: IR, NMR, MASS SPECT
 !! www.clutchprep.com CONCEPT: PURPOSE OF ANALYTICAL TECHNIQUES Classical Methods (Wet Chemistry): Chemists needed to run dozens of chemical reactions to determine the type of molecules in a compound.
(2) Read each statement carefully and pick the one that is incorrect in its information.
 Read each statement carefully and pick the one that is incorrect in its information.") Organic Chemistry - Problem Drill 17: IR and Mass Spectra No. 1 of 10 1. Which statement about infrared spectroscopy is incorrect? (A) IR spectroscopy is a method of structure determination based on the
Organic Chemistry - Problem Drill 17: IR and Mass Spectra No. 1 of 10 1. Which statement about infrared spectroscopy is incorrect? (A) IR spectroscopy is a method of structure determination based on the
William H. Brown & Christopher S. Foote
 Requests for permission to make copies of any part of the work should be mailed to:permissions Department, Harcourt Brace & Company, 6277 Sea Harbor Drive, Orlando, Florida 32887-6777 William H. Brown
Infrared Spectroscopy used to analyze the presence of functional groups (bond types) in organic molecules How IR spectroscopy works:
 in organic molecules How IR spectroscopy works:") Infrared Spectroscopy used to analyze the presence of functional groups (bond types) in organic molecules It is the study of the interaction of infrared energy with organic molecules; the process analyzes
Infrared Spectroscopy used to analyze the presence of functional groups (bond types) in organic molecules It is the study of the interaction of infrared energy with organic molecules; the process analyzes
More information can be found in Chapter 12 in your textbook for CHEM 3750/ 3770 and on pages in your laboratory manual.
 CHEM 3780 rganic Chemistry II Infrared Spectroscopy and Mass Spectrometry Review More information can be found in Chapter 12 in your textbook for CHEM 3750/ 3770 and on pages 13-28 in your laboratory manual.
Advanced Pharmaceutical Analysis
 Lecture 2 Advanced Pharmaceutical Analysis IR spectroscopy Dr. Baraa Ramzi Infrared Spectroscopy It is a powerful tool for identifying pure organic and inorganic compounds. Every molecular compound has
1.1 Is the following molecule aromatic or not aromatic? Give reasons for your answer.
 Page 1 QUESTION ONE 1.1 Is the following molecule aromatic or not aromatic? Give reasons for your answer. 1.2 List four criteria which compounds must meet in order to be considered aromatic. Page 2 QUESTION
Objective 4. Determine (characterize) the structure of a compound using IR, NMR, MS.
 the structure of a compound using IR, NMR, MS.") Objective 4. Determine (characterize) the structure of a compound using IR, NMR, MS. Skills: Draw structure IR: match bond type to IR peak NMR: ID number of non-equivalent H s, relate peak splitting to
Objective 4. Determine (characterize) the structure of a compound using IR, NMR, MS. Skills: Draw structure IR: match bond type to IR peak NMR: ID number of non-equivalent H s, relate peak splitting to
Spectroscopy. Fourier Transform Infrared (FT-IR) Spectroscopy
 Spectroscopy") Fourier Transform Infrared (FT-IR) Spectroscopy Learning objectives Learning outcomes After completing this course, the student will be able to: Recognize the concept and principle of FT-IR Spectroscopy
Fourier Transform Infrared (FT-IR) Spectroscopy Learning objectives Learning outcomes After completing this course, the student will be able to: Recognize the concept and principle of FT-IR Spectroscopy
E35 SPECTROSCOPIC TECHNIQUES IN ORGANIC CHEMISTRY
 E35 SPECTRSCPIC TECNIQUES IN RGANIC CEMISTRY Introductory Comments. These notes are designed to introduce you to the basic spectroscopic techniques which are used for the determination of the structure
Effect of mass attached to the spring: 1. Replace the small stopper with the large stopper. Repeat steps 3-9 for each spring set.
 EXERCISE 1: Representing molecular vibrations with spring oscillations A spring is a common model for covalent chemical bonds. One of the interesting interpretations of quantum mechanics is that bonds
Chemistry Instrumental Analysis Lecture 3. Chem 4631
 Chemistry 4631 Instrumental Analysis Lecture 3 Quantum Transitions The energy of a photon can also be transferred to an elementary particle by adsorption if the energy of the photon exactly matches the
Structure Determination: Mass Spectrometry and Infrared Spectroscopy. What is the size and formula? Infrared spectroscopy
 Revs checked MR Structure Determination: Mass Spectrometry and Infrared Spectroscopy 12 12-1 Mass Spectrometry of Small Molecules: MagneticSector Instruments 12-2 Interpreting Mass Spectra 12-3 Mass Spectrometry
Chapter 13 Spectroscopy
 hapter 13 Spectroscopy Infrared spectroscopy Ultraviolet-Visible spectroscopy Nuclear magnetic resonance spectroscopy Mass Spectrometry 13.1 Principles of Molecular Spectroscopy: Electromagnetic Radiation
Structure Determination
 There are more than 5 million organic compounds, the great majority of which are colourless liquids or white solids. Identifying or at least characterising determining some of its properties and features
Probing Bonding Using Infrared Spectroscopy Chem
 Probing Bonding Using Infrared Spectroscopy Chem 112-2011 INTRODUCTION First, watch the short video on how to record an infrared spectrum using an infrared spectrometer, linked at: http://employees.oneonta.edu/viningwj/chem112/labs/ir_video/ir_video_controller.swf
Introduction to Organic Spectroscopy
 Introduction to rganic Spectroscopy Chem 8361/4361: Interpretation of rganic Spectra 2009 2013 Andrew Harned & Regents of the University of Minnesota What is spectroscopy?? From Wikipedia Spectroscopy:
Infrared Spectroscopy
 Reminder: These notes are meant to supplement, not replace, the laboratory manual. Infrared Spectroscopy History and Application: Infrared (IR) radiation is simply one segment of the electromagnetic spectrum
2. Infrared spectroscopy
 2. Infrared spectroscopy 2-1Theoretical principles An important tool of the organic chemist is Infrared Spectroscopy, or IR. IR spectra are acquired on a special instrument, called an IR spectrometer.
Ultraviolet-Visible and Infrared Spectrophotometry
 Ultraviolet-Visible and Infrared Spectrophotometry Ahmad Aqel Ifseisi Assistant Professor of Analytical Chemistry College of Science, Department of Chemistry King Saud University P.O. Box 2455 Riyadh 11451
Infrared spectroscopy Basic theory
 Infrared spectroscopy Basic theory Dr. Davide Ferri Paul Scherrer Institut 056 310 27 81 davide.ferri@psi.ch Importance of IR spectroscopy in catalysis IR Raman NMR XAFS UV-Vis EPR 0 200 400 600 800 1000
General Infrared Absorption Ranges of Various Functional Groups
 General Infrared Absorption Ranges of Various Functional Groups Frequency Range Bond Type of Compound cm -1 Intensity C Alkanes 2850-2970 Strong 1340-1470 Strong C Alkenes 3010-3095 Medium 675-995 Strong
How to Interpret an Infrared (IR) Spectrum
 Spectrum") How to Interpret an Infrared (IR) Spectrum Infrared (IR) Spectroscopy allows the identification of particular bonds present within molecules. In this class we have simplified IR analysis by only focusing
How to Interpret an Infrared (IR) Spectrum Infrared (IR) Spectroscopy allows the identification of particular bonds present within molecules. In this class we have simplified IR analysis by only focusing
Chemistry Instrumental Analysis Lecture 2. Chem 4631
 Chemistry 4631 Instrumental Analysis Lecture 2 Electromagnetic Radiation Can be described by means of a classical sinusoidal wave model. Oscillating electric and magnetic field. (Wave model) wavelength,
6. CHARACTERIZATION OF AS (III) IONS BIOSORPTION BY THE LIVE, HEAT AND ALKALINE- TREATED FUNGAL BIOMASS ON THE BASICS OF SURFACE STUDIES
 IONS BIOSORPTION BY THE LIVE, HEAT AND ALKALINE- TREATED FUNGAL BIOMASS ON THE BASICS OF SURFACE STUDIES") 6. CHARACTERIZATION OF AS (III) IONS BIOSORPTION BY THE LIVE, HEAT AND ALKALINE- TREATED FUNGAL BIOMASS ON THE BASICS OF SURFACE STUDIES 6. Introduction Infrared spectroscopy is a technique used to identify
6. CHARACTERIZATION OF AS (III) IONS BIOSORPTION BY THE LIVE, HEAT AND ALKALINE- TREATED FUNGAL BIOMASS ON THE BASICS OF SURFACE STUDIES 6. Introduction Infrared spectroscopy is a technique used to identify
Chapter 13. R.F.----µ-wave----I.R. (Heat)------Visible------U.V X-Ray------γ-Ray SPECTROSCOPY. Definition: Types to Be Covered:
------Visible------U.V X-Ray------γ-Ray SPECTROSCOPY. Definition: Types to Be Covered:") hamras Glendale ommunity ollege rganic hemistry 105 Exam 4 Materials hapter 13 SPETRSPY Definition: Types to Be overed: A) Infrared Spectroscopy (IR) B) Nuclear Magnetic Resonance Spectroscopy (NMR) )
hamras Glendale ommunity ollege rganic hemistry 105 Exam 4 Materials hapter 13 SPETRSPY Definition: Types to Be overed: A) Infrared Spectroscopy (IR) B) Nuclear Magnetic Resonance Spectroscopy (NMR) )
Ultraviolet-Visible and Infrared Spectrophotometry
 Ultraviolet-Visible and Infrared Spectrophotometry Ahmad Aqel Ifseisi Assistant Professor of Analytical Chemistry College of Science, Department of Chemistry King Saud University P.O. Box 2455 Riyadh 11451
MASS and INFRA RED SPECTROSCOPY
 MASS and INFRA RED SPECTRSCPY Mass Spectroscopy The mass spectrometer was looked at in Unit 1. It was noted there that compounds produce fragmentation patterns when passes through a mass spectrometer.
Lecture 2 nmr Spectroscopy
 Lecture 2 nmr Spectroscopy Pages 427 430 and Chapter 13 Molecular Spectroscopy Molecular spectroscopy: the study of the frequencies of electromagnetic radiation that are absorbed or emitted by substances
CHEM 3760 Orgo I, S12, Exp 5 (Lab #6) (TECH 710: IR Unknown)
 (TECH 710: IR Unknown)") CHEM 3760 rgo I, S12, Exp 5 (Lab #6) (TECH 710: IR Unknown) LAB REPRT ISTRUCTIS Identifying an Unknown Compound by Infrared Spectroscopy (IR) Carefully read all instructions and complete Section I on page
CHEM 3760 rgo I, S12, Exp 5 (Lab #6) (TECH 710: IR Unknown) LAB REPRT ISTRUCTIS Identifying an Unknown Compound by Infrared Spectroscopy (IR) Carefully read all instructions and complete Section I on page
i e l d f Energy (E) = Direction visible ultraviolet X-ray gamma infrared
 = Direction visible ultraviolet X-ray gamma infrared") rganic Structure Determination Analytical hemistry Instrument-based methods for determination of structure of organic molecules 1) Infrared Spectroscopy - yields functional groups 2) M Spectroscopy - very
rganic Structure Determination Analytical hemistry Instrument-based methods for determination of structure of organic molecules 1) Infrared Spectroscopy - yields functional groups 2) M Spectroscopy - very
Spectroscopy. Empirical Formula: Chemical Formula: Index of Hydrogen Deficiency (IHD)
") Spectroscopy Empirical Formula: Chemical Formula: Index of Hydrogen Deficiency (IHD) A)From a structure: B)From a molecular formula, C c H h N n O o X x, Formula for saturated hydrocarbons: Subtract the
Spectroscopy Empirical Formula: Chemical Formula: Index of Hydrogen Deficiency (IHD) A)From a structure: B)From a molecular formula, C c H h N n O o X x, Formula for saturated hydrocarbons: Subtract the
Chapter Two mass spectra are shown. One corresponds to 2-methyl-2-pentene; the other, to 2-hexene. Which is which? Explain.
 hapter 12 12.1 Write as many molecular formulas as you can for compounds that have the following molecular ions in their mass spectra. Assume that all the compounds contain and and that may or may not
Calculate a rate given a species concentration change.
 Kinetics Define a rate for a given process. Change in concentration of a reagent with time. A rate is always positive, and is usually referred to with only magnitude (i.e. no sign) Reaction rates can be
高等食品分析 (Advanced Food Analysis) I. SPECTROSCOPIC METHODS *Instrumental methods: 1. Spectroscopic methods (spectroscopy): a) Electromagnetic radiation
 I. SPECTROSCOPIC METHODS *Instrumental methods: 1. Spectroscopic methods (spectroscopy): a) Electromagnetic radiation") *Instrumental methods: 1. Spectroscopic methods (spectroscopy): a) Electromagnetic radiation (EMR): γ-ray emission X-Ray absorption, emission, fluorescence and diffraction Vacuum ultraviolet (UV) absorption
*Instrumental methods: 1. Spectroscopic methods (spectroscopy): a) Electromagnetic radiation (EMR): γ-ray emission X-Ray absorption, emission, fluorescence and diffraction Vacuum ultraviolet (UV) absorption
Wavelength λ Velocity v. Electric Field Strength Amplitude A. Time t or Distance x time for 1 λ to pass fixed point. # of λ passing per s ν= 1 p
 Introduction to Spectroscopy (Chapter 6) Electromagnetic radiation (wave) description: Wavelength λ Velocity v Electric Field Strength 0 Amplitude A Time t or Distance x Period p Frequency ν time for 1
13.24: Mass Spectrometry: molecular weight of the sample
 hapter 13: Spectroscopy Methods of structure determination Nuclear Magnetic Resonances (NMR) Spectroscopy (Sections 13.3-13.19) Infrared (IR) Spectroscopy (Sections 13.20-13.22) Ultraviolet-visible (UV-Vis)
1.1. IR is part of electromagnetic spectrum between visible and microwave
 CH2SWK 44/6416 IR Spectroscopy 2013Feb5 1 1. Theory and properties 1.1. IR is part of electromagnetic spectrum between visible and microwave 1.2. 4000 to 400 cm -1 (wave numbers) most interesting to organic
CHEM Chapter 12 Infrared and Mass Spec (homework). Stafford. S18
. Stafford. S18") Exhibit 12-4 The following question(s) refer to the mass spectrum shown below. 1. Refer to Exhibit 12-4. This compound contains C, H, and one other atom. Identify the other atom from the mass spectrum
Exhibit 12-4 The following question(s) refer to the mass spectrum shown below. 1. Refer to Exhibit 12-4. This compound contains C, H, and one other atom. Identify the other atom from the mass spectrum
Page 2. Q1.Consider the five cyclic compounds, A, B, C, D and E. The infrared spectra of compounds A, B, C and D are shown below.
 Q1.Consider the five cyclic compounds, A, B, C, D and E. (a) The infrared spectra of compounds A, B, C and D are shown below. Write the correct letter, A, B, C or D, in the box next to each spectrum. You
1 Which of the following cannot be used to detect alcohol in a breathalyser test? Fractional distillation. Fuel cell. Infrared spectroscopy
 1 Which of the following cannot be used to detect alcohol in a breathalyser test? Fractional distillation Fuel cell Infrared spectroscopy Reduction of dichromate(vi) ions 2 Propanal, H 3 H 2 HO, and propanone,
Vibrational Spectroscopy
 Vibrational Spectroscopy In this part of the course we will look at the kind of spectroscopy which uses light to excite the motion of atoms. The forces required to move atoms are smaller than those required
HWeb27 ( ; )
") HWeb27 (9.1-9.2; 9.12-9.18) 28.1. Which of the following cannot be determined about a compound by mass spectrometry? [a]. boiling point [b]. molecular formula [c]. presence of heavy isotopes (e.g., 2 H,
HWeb27 (9.1-9.2; 9.12-9.18) 28.1. Which of the following cannot be determined about a compound by mass spectrometry? [a]. boiling point [b]. molecular formula [c]. presence of heavy isotopes (e.g., 2 H,
Lab 6. Use of VSEPR to Predict Molecular Structure and IR Spectroscopy to Identify an Unknown
 Lab 6. Use of VSEPR to Predict Molecular Structure and IR Spectroscopy to Identify an Unknown Prelab Assignment Before coming to lab: In addition to reading introduction of this lab handout, read and understand
C h a p t e r S i x t e e n: Nuclear Magnetic Resonance Spectroscopy. An 1 H NMR FID of ethanol
 0.2 0.4 0.6 0.8 1.0 1.2 1.4 1.6 1.8 2.0 2.2 2.4 2.6 2.8 3.0 3.2 3.4 3.6 C h a p t e r S i x t e e n: Nuclear Magnetic Resonance Spectroscopy An 1 NMR FID of ethanol Note: Problems with italicized numbers
Classification of spectroscopic methods
 Introduction Spectroscopy is the study of the interaction between the electromagnetic radiation and the matter. Spectrophotometry is the measurement of these interactions i.e. the measurement of the intensity
CHEM 3760 Orgo I, F14 (Lab #11) (TECH 710)
 (TECH 710)") CHEM 3760 Orgo I, F14 (Lab #11) (TECH 710) Identification of an Unknown by IR PRELAB (PreLab is due before entering the lab.) Every student has to prepare for each experiment by answering the Pre-Laboratory
CHEM 3760 Orgo I, F14 (Lab #11) (TECH 710) Identification of an Unknown by IR PRELAB (PreLab is due before entering the lab.) Every student has to prepare for each experiment by answering the Pre-Laboratory
MOLECULAR REPRESENTATIONS AND INFRARED SPECTROSCOPY
 MOLEULAR REPRESENTATIONS AND INFRARED SPETROSOPY A STUDENT SOULD BE ABLE TO: 1. Given a Lewis (dash or dot), condensed, bond-line, or wedge formula of a compound draw the other representations. 2. Give
NUCLEAR MAGNETIC RESONANCE AND INTRODUCTION TO MASS SPECTROMETRY
 NUCLEAR MAGNETIC RESONANCE AND INTRODUCTION TO MASS SPECTROMETRY A STUDENT SHOULD BE ABLE TO: 1. Identify and explain the processes involved in proton ( 1 H) and carbon-13 ( 13 C) nuclear magnetic resonance
Chapter 4 Ultraviolet and visible spectroscopy Molecular Spectrophotometry
 Chapter 4 Ultraviolet and visible spectroscopy Molecular Spectrophotometry Properties of light Electromagnetic radiation and electromagnetic spectrum Absorption of light Beer s law Limitation of Beer s
William H. Brown & Christopher S. Foote
 Requests for permission to make copies of any part of the work should be mailed to:permissions Department, Harcourt Brace & Company, 6277 Sea Harbor Drive, Orlando, Florida 32887-6777 William H. Brown
CHEMISTRY 341. Final Exam Tuesday, December 16, Problem 1 15 pts Problem 9 8 pts. Problem 2 5 pts Problem pts
 CEMISTRY 341 Final Exam Tuesday, December 16, 1997 Name NAID Problem 1 15 pts Problem 9 8 pts Problem 2 5 pts Problem 10 21 pts Problem 3 26 pts Problem 11 15 pts Problem 4 10 pts Problem 12 6 pts Problem
Chemistry 343- Spring 2008
 Chemistry 343- Spring 2008 27 Chapter 2- Representative Carbon Compounds: Functional Groups, Intermolecular Forces and IR Spectroscopy A. ydrocarbons: Compounds composed of only C and Four Basic Types:
Principles of Molecular Spectroscopy: Electromagnetic Radiation and Molecular structure. Nuclear Magnetic Resonance (NMR)
") Principles of Molecular Spectroscopy: Electromagnetic Radiation and Molecular structure Nuclear Magnetic Resonance (NMR) !E = h" Electromagnetic radiation is absorbed when the energy of photon corresponds
Principles of Molecular Spectroscopy: Electromagnetic Radiation and Molecular structure Nuclear Magnetic Resonance (NMR) !E = h" Electromagnetic radiation is absorbed when the energy of photon corresponds
Organic Chemistry II (CHE ) Examination I February 11, Name (Print legibly): Key. Student ID#:
 Examination I February 11, Name (Print legibly): Key. Student ID#:") rganic hemistry II (HE 232-001) Examination I February 11, 2009 Name (Print legibly): Key (last) (first) Student ID#: PLEASE observe the following: You are allowed to have scratch paper (provided by me),
rganic hemistry II (HE 232-001) Examination I February 11, 2009 Name (Print legibly): Key (last) (first) Student ID#: PLEASE observe the following: You are allowed to have scratch paper (provided by me),