Infrared Spectroscopy
|
|
|
- Brendan Simpson
- 6 years ago
- Views:
Transcription
1 x-rays ultraviolet (UV) visible Infrared (I) microwaves radiowaves near I middle I far I λ (cm) 8 x x x x 10-2 µ ν (cm -1 ) 13,000 4, ν (cm -1 1 ) = λ (cm) µ = micron (older unit) E = 1-10 kcal/mol bond vibrations O C H C H stretching bending ν (cm -1 ) = 1 λ (µm) x 10,000 stretching & - changes in bond lengths bending - changes in bond angles
2 Only vibrations that produce a change in dipole moment are observed in the I ' δ + δ - C C C C ' C O ' ~1640 cm -1 ~2100 cm -1 ~1730 cm -1 ALWAYS a dipole so always seen in spectrum if present H 3 C CH 3 C C H 3 C CH 3 H 3 C C C CH 3 I "invisible" if molecule is symmetric weak band if similar groups
3 Fundamental Stretching & Bending Vibrations O C H C H stretching bending
4 Hooke s Law Can approximate position (wavenumber) of spectral band using Hooke s Law m 1 m 2 K µ and µ = m 1 m 2 m 1 + m 2 K so: m 1 m 2 m 1 + m 2 m = mass of atom K = force constant of bond c = velocity of light (3x10 10 cm/sec)
5 Hooke s Law m 1 m 2 m 1 + m 2 Can thus derive some qualitative relationships: à stronger bonds absorb at higher frequencies (higher K = higher n ) C C C C C C ν (cm -1 ) ~2159 ~1650 ~1200 Bond Strength (kcal/mol) à as mass of atom increases, frequency decreases C H C C C O C Br C I ν (cm -1 ) increasing atomic mass
6 Other Vibrations Spectra include a number of other peaks. In addition to fundamental stretching and bending absorptions. Overtones: lower intensity vibration at an integral times the fundamental frequency ν overtone = n x ν fundamental Combination bands: the sum of two interacting vibrational frequencies, but only certain combinations are allowed ν combination = ν + ν 2 Difference bands: similar to combination bands, but the difference of two interacting vibrations ν difference = ν - ν 2 Fermi resonance: when a fundamental absorption couples with an overtone or combination band, most often observed for C=O
7 Overtones 1st overtone usually at twice normal ν à typically weak C O ~1720 cm -1 1st overtone ~3440 cm -1 near OH, 2 NH, terminal alkyne
8 Fermi esonance Overtone falls close to a fundamental band à intensity is greatly enhanced usually results in doubling of that band
9 The Infrared Spectrometer Dispersive Infrared Spectrophotometer measures one frequency of light at a time scan speed is relatively slow
10 The Infrared Spectrometer Fourier Transform Infrared Spectrophotometer (FT-I) measures all frequencies of light at a time each scan requires less time; lower resolution than dispersive I collect lots of scans & average à higher resolution overall faster acquisition, higher resolution than dispersive instrument overall


 directly to spectrometer salt plate")
11 Sample Handling solution cell sample can be gas, liquid or solid samples can be taken in solution - subtract out solvent by taking background/reference spectrum liquids/oils samples often taken neat samples typically applied to polished NaCl plate (I inactive) adventitious water can be problematic à lead to false signals - false ID of OH, CO 2 H, 2 NH solids more problematic - solids can be deposited as thin film on NaCl plate dissolve, drop on plate, then evaporate some solvent solvents: CCl 4, CHCl 3 & CH 2 Cl 2 - sample can be mixed with Nujol (petroleum oil, high boiling) obscures aliphatic region (less useful) - sample can pressed into KBr pellet may take some practice - AT: apply solid (or liquid) directly to spectrometer salt plate KBr pellet
12 The I Spectrum (w) (m) (s) functional group region fingerprint region


13 Troubleshooting neat: wet sample; sloping to high energy water bands solid film: film too thick (or solvent evaporated between salt plates)


14 Troubleshooting mull: too much sample applied KBr or solid film: too little sample applied

15 General Absorbance anges in the I X=C=Y (C, O, N, S) N 3 stretching vibrations fingerprint region bending vibrations
16 Correlation Chart (Adapted from Pavia Table 2.3) complete table can be found on class web site etc.
17 The I Spectrum (w) (m) (s) functional group region fingerprint region (s) (m) (w) strong medium weak
18 Alkanes Simple spectra with few peaks C-H stretch most prominent (around 3000 cm -1 ) - sp 3 C-H stretch between cm -1 saturated, unstrained hydrocarbons typically to the right of 3000 cm -1 C-H stretch on vinyl or aromatic carbon to left of 3000 cm -1 - CH 2 /CH 3 bending vibrations between cm -1 CH 2 bend around 1465 cm -1 CH 3 bend around 1375 cm -1 - long chain (four or more CH 2 groups in long chain may see a band at 720 cm -1 weak, often obscured in more complex molecules C-C stretch not interpretively useful

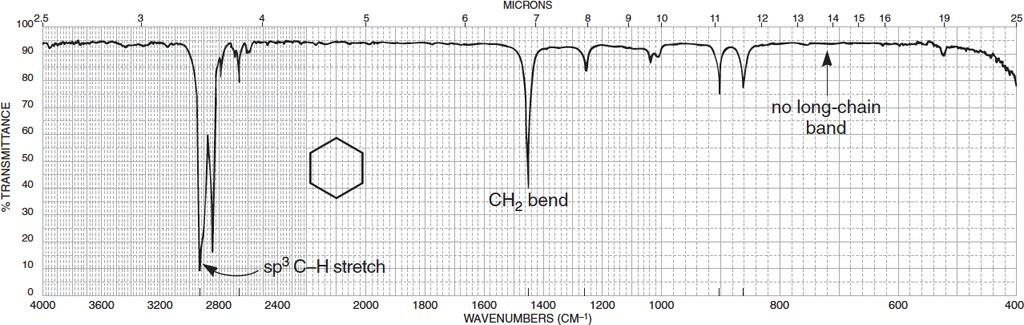
19 Alkanes decane cyclohexane
20 Alkanes (bromomethyl)cyclopropane Br cyclopropane C-H ca cm -1
21 Alkenes Spectra more complex than alkanes =C-H stretch to left of 3000 cm -1 - sp 2 C-H stretch between cm -1 =C-H out of plane bending vibrations between cm -1 - can sometimes be used to determine degree of alkene substitution - may be obscured in complex systems C=C stretch occurs between cm -1 - intensity varies with dipole - conjugation shifts absorbance to lower frequencies; increases intensity

22 Alkenes 1-hexene
23 Alkenes cis-2-pentene H H H 3 C CH 3 C=C sp 2 C-H
24 Alkenes trans-2-pentene C=C (very weak) H 3 C H H CH 3 sp 2 C-H
25 Alkenes Conjugation Effects Conjugation moves C=C stretch to lower frequencies (~15-20 cm -1 ) O 1643 cm cm cm cm cm -1 Conjugation increases amount of s-character; weakens bond, lowers force constant May see multiple absorbances if alkene is conjugated to another double bond
26 Alkenes trans-1,3-pentadiene H 3 C H H H CH 2 sp 2 C-H C=C
27 Alkenes C=C stretch: effect of ring strain in endocyclic alkenes 1650 cm cm cm cm cm -1 decreasing absorption frequency 1646 cm -1 ~1611 cm -1
28 Alkenes C=C stretch: substituent effects in endocyclic alkenes 1656 cm cm cm cm cm cm cm cm cm cm cm cm -1 increasing absorption frequency
29 Alkenes C=C stretch: effect of ring strain in exocyclic alkenes 1940 cm cm cm cm cm cm -1 increasing absorption frequency more s character more p character
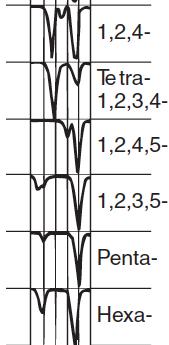
30 Alkenes C=C stretch in acyclic alkenes * * vinyl vinylidene H ~1645 cm -1 H ~1655 cm -1 H H H cis H H ~1660 cm -1 * trans H H ~ cm -1 trisubstituted tetrasubstituted H ~ cm -1 ~ cm -1 vinyl ether O ~ cm -1 (usually strong) * =C-H bending absorbance may supplement assignment
31 Alkenes Out of Plane Bending and Alkene Substitution! approx frequency 990, 910 cm cm cm cm cm -1 none BEWAE! Fingerprint egion
32 Alkynes C-H stretch usually near 3300 cm -1 - sp C-H stretch between cm -1 C C stretch vibrations between cm -1 - conjugation shifts absorbance to lower frequencies; - absorbances for symmetrically substituted alkynes may be weak or absent

33 Alkynes 1-hexyne

34 Alkynes 4-octyne

35 Alkynes allyl 2-butynoate sp 2 C-H O O C=C C C C=O
36 Aromatic Ings =C-H stretch to left of 3000 cm -1 - sp 2 C-H stretch between cm -1 =C-H out of plane bending vibrations between cm -1 - can often be used to determine ring substitution pattern C=C stretch between cm -1 - two to three peaks; often occur in pairs at 1660 and 1475 cm -1 Overtone/Combination bands appear between cm -1 - can sometimes be used to assign ring substitution pattern
37 Aromatic ings toluene
38 Aromatic ings Out of Plane Bending mono: ortho: meta: para cm -1 (strong) cm -1 (strong)* cm -1 (strong) cm -1 (strong) 780 cm -1 (strong) cm -1 (moderate)* cm -1 (strong) * may be absent

39 Aromatic ings overtones
 730 770 cm -1")
40 Aromatic ings toluene cm -1 (strong) cm -1 (strong)*

41 Aromatic ings o-diethylbenzene cm -1 (strong)
 780 cm -1 (strong) 810-880 cm -1")
42 Aromatic ings m-diethylbenzene cm -1 (strong) 780 cm -1 (strong) cm -1 (moderate)*

43 Aromatic ings p-diethylbenzene cm -1 (strong)
44 Alcohols & Phenols O-H stretch occurs between cm -1 - position and shape vary depending on amount of hydrogen bonding free O-H: sharp peak between cm -1 H-bonded O-H: broad peak between cm -1 C-O-H bending vibrations between cm -1 - not diagnostic C-O stretch between cm -1 - can sometimes provide information about alcohol structure


45 Alcohols & Phenols 2-butanol p-cresol
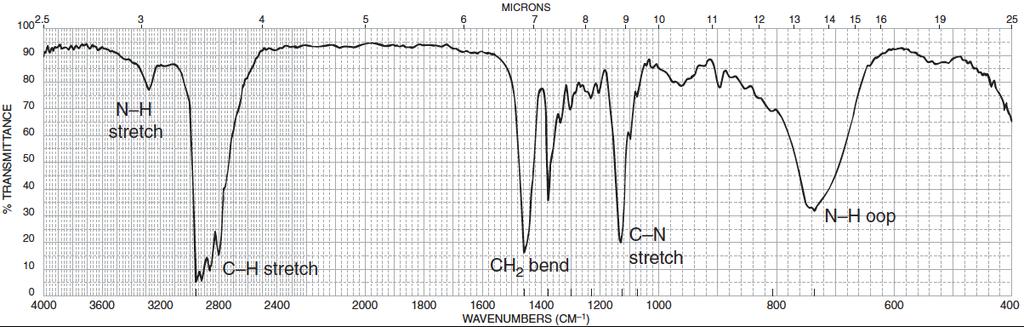
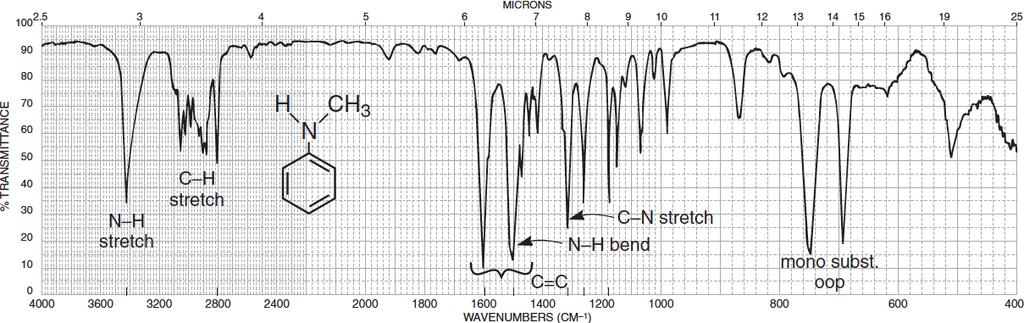
 free and")
46 Alcohols & Phenols OH Stretch: Hydrogen Bonding vs. Free OH hydrogen bonded OH free and hydrogen bonded OH (dilute solution) free and hydrogen bonded OH (very dilute solution)
47 Alcohols & Phenols cyclohexanol OH neat 3331 cm -1 C-O-H bend OH solution in CCl cm -1
48 Alcohols & Phenols OH 3322 cm -1 methyl salicylate OCH 3 O O H neat 3190 cm -1 OCH 3 O O H solution in CCl cm -1
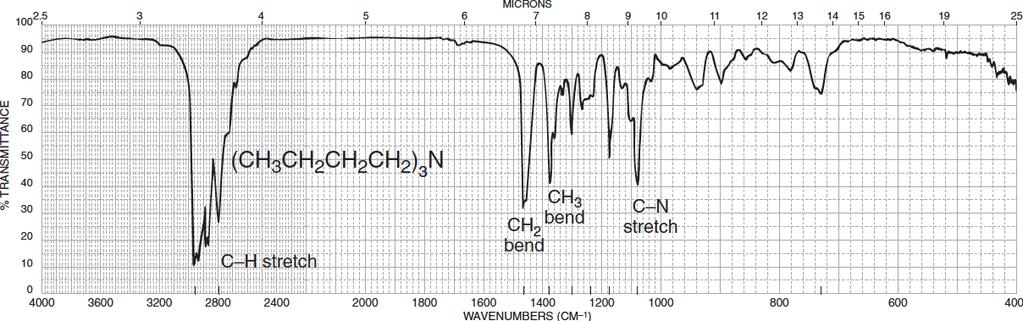
49 Alcohols & Phenols C-O stretch and structure phenol 3 alcohol 2 alcohol 1 alcohol C-O stretch 1220 cm cm cm cm -1 decreasing frequency OH OH OH OH 1237 cm cm cm cm -1
50 Alcohols & Phenols effect of unsaturation on C-O stretch 3 alcohol 2 alcohol 1 alcohol C-O stretch 1150 cm cm cm -1 secondary alcohols OH OH OH 1070 cm -1 (Δ 70 cm -1 ) 1070 cm -1 (Δ 70 cm -1 ) 1060 cm -1 (Δ 60 cm -1 ) primary alcohols OH OH 1017 cm -1 (Δ 33 cm -1 ) 1030 cm -1 (Δ 20 cm -1 )
51 Alcohols & Phenols free OH stretch and structure phenol 3 alcohol 2 alcohol 1 alcohol free O-H stretch 3610 cm cm cm cm -1 increasing frequency OH OH OH OH 3614 cm cm cm cm -1
52 Ethers Difficult to identify by I C-O stretch most prominent feature ( cm -1 ) - aliphatic ethers show one strong band (~1120 cm -1 ) - phenyl/vinyl alkyl ethers show two strong bands (~1250 and 1140 cm -1 ) Many other FG show C-O stretch - may distinguish ether from alkane - can distinguish from alcohol (no OH stretch) - can distinguish from carbonyl derivative (no C=O stretch)


53 Ethers dibutyl ether 1023 cm -1 decane
54 O O Ethers ethoxybenzene O C-O-C 1250 cm cm -1 ethyl vinyl ether O C-O-C 1207 cm cm -1
55 Ethers ethoxybenzene O deformation bands 1,3-dioxolane O O
56 Amines N-H stretch occurs between cm -1 - signal varies with amine structure 1 amines show two bands 2 amines have one band 3 amines have no absorbance in this region N-H bend vibrations between cm -1-1 amines: amines: ~1500 cm -1 not diagnostic C-N stretch between cm -1 H N H H N N 1 2 3
57 Amines cyclohexylamine NH 2 N-H stretch N-H bend
58 Amines dibutylamine H N
59 Amines N-methylaniline
60 Amines tributylamine
SPECTROSCOPY MEASURES THE INTERACTION BETWEEN LIGHT AND MATTER
 SPECTROSCOPY MEASURES THE INTERACTION BETWEEN LIGHT AND MATTER c = c: speed of light 3.00 x 10 8 m/s (lamda): wavelength (m) (nu): frequency (Hz) Increasing E (J) Increasing (Hz) E = h h - Planck s constant
Infrared Spectroscopy
 Infrared Spectroscopy IR Spectroscopy Used to identify organic compounds IR spectroscopy provides a 100% identification if the spectrum is matched. If not, IR at least provides information about the types
Advanced Pharmaceutical Analysis
 Lecture 2 Advanced Pharmaceutical Analysis IR spectroscopy Dr. Baraa Ramzi Infrared Spectroscopy It is a powerful tool for identifying pure organic and inorganic compounds. Every molecular compound has
Infrared Spectroscopy
 Infrared Spectroscopy Introduction Spectroscopy is an analytical technique which helps determine structure. It destroys little or no sample. The amount of light absorbed by the sample is measured as wavelength
Table 8.2 Detailed Table of Characteristic Infrared Absorption Frequencies
 Table 8.2 Detailed Table of Characteristic Infrared Absorption Frequencies The hydrogen stretch region (3600 2500 cm 1 ). Absorption in this region is associated with the stretching vibration of hydrogen
Introduction. The analysis of the outcome of a reaction requires that we know the full structure of the products as well as the reactants
 Introduction The analysis of the outcome of a reaction requires that we know the full structure of the products as well as the reactants Spectroscopy and the Electromagnetic Spectrum Unlike mass spectrometry,
General Infrared Absorption Ranges of Various Functional Groups
 General Infrared Absorption Ranges of Various Functional Groups Frequency Range Bond Type of Compound cm -1 Intensity C Alkanes 2850-2970 Strong 1340-1470 Strong C Alkenes 3010-3095 Medium 675-995 Strong
Learning Guide for Chapter 3 - Infrared Spectroscopy
 Learning Guide for hapter 3 - Infrared Spectroscopy I. Introduction to spectroscopy - p 1 II. Molecular vibrations - p 3 III. Identifying functional groups - p 6 IV. Interpreting an IR spectrum - p 12
Química Orgânica I. Ciências Farmacêuticas Bioquímica Química. IR spectroscopy AFB QO I 2007/08 1 AFB QO I 2007/08 2
 Química Orgânica I Ciências Farmacêuticas Bioquímica Química AFB QO I 2007/08 1 IR spectroscopy AFB QO I 2007/08 2 1 Adaptado de: Organic Chemistry, 6th Edition; L. G. Wade, Jr. Organic Chemistry, William
Infrared Spectroscopy used to analyze the presence of functional groups (bond types) in organic molecules How IR spectroscopy works:
 in organic molecules How IR spectroscopy works:") Infrared Spectroscopy used to analyze the presence of functional groups (bond types) in organic molecules It is the study of the interaction of infrared energy with organic molecules; the process analyzes
Infrared Spectroscopy used to analyze the presence of functional groups (bond types) in organic molecules It is the study of the interaction of infrared energy with organic molecules; the process analyzes
1.1. IR is part of electromagnetic spectrum between visible and microwave
 CH2SWK 44/6416 IR Spectroscopy 2013Feb5 1 1. Theory and properties 1.1. IR is part of electromagnetic spectrum between visible and microwave 1.2. 4000 to 400 cm -1 (wave numbers) most interesting to organic
Vibrations. Matti Hotokka
 Vibrations Matti Hotokka Identify the stuff I ve seen this spectrum before. I know what the stuff is Identify the stuff Let s check the bands Film: Polymer Aromatic C-H Aliphatic C-H Group for monosubstituted
Radiant energy is proportional to its frequency (cycles/s = Hz) as a wave (Amplitude is its height) Different types are classified by frequency or
 as a wave (Amplitude is its height) Different types are classified by frequency or") CHEM 241 UNIT 5: PART B INFRA-RED RED SPECTROSCOPY 1 Spectroscopy of the Electromagnetic Spectrum Radiant energy is proportional to its frequency (cycles/s = Hz) as a wave (Amplitude is its height) Different
CHEM 241 UNIT 5: PART B INFRA-RED RED SPECTROSCOPY 1 Spectroscopy of the Electromagnetic Spectrum Radiant energy is proportional to its frequency (cycles/s = Hz) as a wave (Amplitude is its height) Different
Chapter 12 Mass Spectrometry and Infrared Spectroscopy
 Organic Chemistry, 6 th Edition L. G. Wade, Jr. Chapter 12 Mass Spectrometry and Infrared Spectroscopy Jo Blackburn Richland College, Dallas, TX Dallas County Community College District 2006, Prentice
Types of Molecular Vibrations
 Important concepts in IR spectroscopy Vibrations that result in change of dipole moment give rise to IR absorptions. The oscillating electric field of the radiation couples with the molecular vibration
Infrared spectroscopy. Siriphorn Laomanacharoen Bureau of Drug and Narcotic Department of Medical Sciences 2 March 2012
 Siriphorn Laomanacharoen Bureau of Drug and Narcotic Department of Medical Sciences 2 March 2012 1 Infrared region 2 Infrared region below red in the visible region at wavelengths between 2.5-25 µm more
Structure Determination. How to determine what compound that you have? One way to determine compound is to get an elemental analysis
 Structure Determination How to determine what compound that you have? ne way to determine compound is to get an elemental analysis -basically burn the compound to determine %C, %H, %, etc. from these percentages
CHEM 3760 Orgo I, S12, Exp 5 (Lab #6) (TECH 710: IR Unknown)
 (TECH 710: IR Unknown)") CHEM 3760 rgo I, S12, Exp 5 (Lab #6) (TECH 710: IR Unknown) LAB REPRT ISTRUCTIS Identifying an Unknown Compound by Infrared Spectroscopy (IR) Carefully read all instructions and complete Section I on page
CHEM 3760 rgo I, S12, Exp 5 (Lab #6) (TECH 710: IR Unknown) LAB REPRT ISTRUCTIS Identifying an Unknown Compound by Infrared Spectroscopy (IR) Carefully read all instructions and complete Section I on page
EXPT. 7 CHARACTERISATION OF FUNCTIONAL GROUPS USING IR SPECTROSCOPY
 EXPT. 7 CHARACTERISATION OF FUNCTIONAL GROUPS USING IR SPECTROSCOPY Structure 7.1 Introduction Objectives 7.2 Principle 7.3 Requirements 7.4 Strategy for the Interpretation of IR Spectra 7.5 Practice Problems
Infra-red Spectroscopy
 Molecular vibrations are associated with the absorption of energy (infrared activity) by the molecule as sets of atoms (molecular moieties) vibrate about the mean center of their chemical bonds. Infra-red
Infrared Spectroscopy
 Infrared Spectroscopy (Chapter 12) 1 This reaction from Ochem 1 How do we know if it worked? The reactant is cyclohexene; the product is cyclohexanol. How can we tell the difference? Infrared Spectroscopy
12. Structure Determination: Mass Spectrometry and Infrared Spectroscopy
 12. Structure Determination: Mass Spectrometry and Infrared Spectroscopy Determining the Structure of an Organic Compound The analysis of the outcome of a reaction requires that we know the full structure
Infrared Spectral Interpretation
 Infrared Spectral Interpretation i Wherever you see this symbol, it is important to access the on-line course as there is interactive material that cannot be fully shown in this reference manual. 1 Contents
ORGANIC - BROWN 8E CH INFRARED SPECTROSCOPY.
 !! www.clutchprep.com CONCEPT: PURPOSE OF ANALYTICAL TECHNIQUES Classical Methods (Wet Chemistry): Chemists needed to run dozens of chemical reactions to determine the type of molecules in a compound.
Lecture 11. IR Theory. Next Class: Lecture Problem 4 due Thin-Layer Chromatography
 Lecture 11 IR Theory Next Class: Lecture Problem 4 due Thin-Layer Chromatography This Week In Lab: Ch 6: Procedures 2 & 3 Procedure 4 (outside of lab) Next Week in Lab: Ch 7: PreLab Due Quiz 4 Ch 5 Final
CH 3. mirror plane. CH c d
 CAPTER 20 Practice Exercises 20.1 The index of hydrogen deficiency is two. The structural possibilities include two double bonds, a double do 20.3 (a) As this is an alkane, it contains only C and and has
CHEM 3760 Orgo I, F14 (Lab #11) (TECH 710)
 (TECH 710)") CHEM 3760 Orgo I, F14 (Lab #11) (TECH 710) Identification of an Unknown by IR PRELAB (PreLab is due before entering the lab.) Every student has to prepare for each experiment by answering the Pre-Laboratory
CHEM 3760 Orgo I, F14 (Lab #11) (TECH 710) Identification of an Unknown by IR PRELAB (PreLab is due before entering the lab.) Every student has to prepare for each experiment by answering the Pre-Laboratory
Infrared Spectroscopy: Identification of Unknown Substances
 Infrared Spectroscopy: Identification of Unknown Substances Suppose a white powder is one of the four following molecules. How can they be differentiated? H N N H H H H Na H H H H H A technique that is
Infrared Spectroscopy An Instrumental Method for Detecting Functional Groups
 Infrared Spectroscopy An Instrumental Method for Detecting Functional Groups 1 The Electromagnetic Spectrum Infrared Spectroscopy I. Physics Review Frequency, υ (nu), is the number of wave cycles that
Infrared Spectroscopy
 Reminder: These notes are meant to supplement, not replace, the laboratory manual. Infrared Spectroscopy History and Application: Infrared (IR) radiation is simply one segment of the electromagnetic spectrum
Lecture 13 Organic Chemistry 1
 EM 232 rganic hemistry I at hicago Lecture 13 rganic hemistry 1 Professor Duncan Wardrop February 23, 2010 1 EM 232 rganic hemistry I at hicago Spectroscopy & Spectrometry hapter 13 2 EM 232 rganic hemistry
IR absorption spectroscopy
 IR absorption spectroscopy IR spectroscopy - an analytical technique which helps determine molecules structure When a molecule absorbs IR radiation, the vibrational energy of the molecule increase! The
C h a p t e r F o u r t e e n: Structure Determination: Mass Spectrometry and Infrared Spectroscopy
 C h a p t e r F o u r t e e n: Structure Determination: Mass Spectrometry and Infrared Spectroscopy Cl OH Cl An electron ionization mass spectrum of 2,5-dichlorophenol CHM 323: Summary of Important Concepts
1. Which compound would you expect to have the lowest boiling point? A) NH 2 B) NH 2
 NH 2 B) NH 2") MULTIPLE CICE QUESTINS Topic: Intermolecular forces 1. Which compound would you expect to have the lowest boiling point? A) N 2 B) N 2 C) N D) E) N Ans: : N 2 D Topic: Molecular geometry, dipole moment
MULTIPLE CICE QUESTINS Topic: Intermolecular forces 1. Which compound would you expect to have the lowest boiling point? A) N 2 B) N 2 C) N D) E) N Ans: : N 2 D Topic: Molecular geometry, dipole moment
CHEM 51LB: EXPERIMENT 7 SPECTROSCOPIC METHODS: INFRARED SPECTROSCOPY (IDENTIFICATION OF FUNCTIONAL GROUPS)
") REACTIONS: None TECHNIQUES: IR CHEM 51LB: EXPERIMENT 7 SPECTROSCOPIC METHODS: INFRARED SPECTROSCOPY (IDENTIFICATION OF FUNCTIONAL GROUPS) After a reaction is completed, the identity of the product must
REACTIONS: None TECHNIQUES: IR CHEM 51LB: EXPERIMENT 7 SPECTROSCOPIC METHODS: INFRARED SPECTROSCOPY (IDENTIFICATION OF FUNCTIONAL GROUPS) After a reaction is completed, the identity of the product must
More information can be found in Chapter 12 in your textbook for CHEM 3750/ 3770 and on pages in your laboratory manual.
 CHEM 3780 rganic Chemistry II Infrared Spectroscopy and Mass Spectrometry Review More information can be found in Chapter 12 in your textbook for CHEM 3750/ 3770 and on pages 13-28 in your laboratory manual.
7a. Structure Elucidation: IR and 13 C-NMR Spectroscopies (text , , 12.10)
") 2009, Department of Chemistry, The University of Western Ontario 7a.1 7a. Structure Elucidation: IR and 13 C-NMR Spectroscopies (text 11.1 11.5, 12.1 12.5, 12.10) A. Electromagnetic Radiation Energy is
2009, Department of Chemistry, The University of Western Ontario 7a.1 7a. Structure Elucidation: IR and 13 C-NMR Spectroscopies (text 11.1 11.5, 12.1 12.5, 12.10) A. Electromagnetic Radiation Energy is
Objective 4. Determine (characterize) the structure of a compound using IR, NMR, MS.
 the structure of a compound using IR, NMR, MS.") Objective 4. Determine (characterize) the structure of a compound using IR, NMR, MS. Skills: Draw structure IR: match bond type to IR peak NMR: ID number of non-equivalent H s, relate peak splitting to
Objective 4. Determine (characterize) the structure of a compound using IR, NMR, MS. Skills: Draw structure IR: match bond type to IR peak NMR: ID number of non-equivalent H s, relate peak splitting to
Chapter 12 Structure Determination: Mass Spectrometry and Infrared Spectroscopy
 Chapter 12 Structure Determination: Mass Spectrometry and Infrared Spectroscopy Figure 12.1 - The electron-ionization, magneticsector mass spectrometer Representing the Mass Spectrum Base Peak Parent
Organic Spectra Infra Red Spectroscopy H. D. Roth. THEORY and INTERPRETATION of ORGANIC SPECTRA H. D. Roth. Infra Red Spectroscopy
 rganic Spectra Infra Red Spectroscopy. D. Roth TERY and INTERPRETATIN of RGANI SPETRA. D. Roth Infra Red Spectroscopy Infrared spectroscopy (IR) is an analytical technique concerned with molecular vibrations
Group 2 compounds: C, H hydrocarbons = alkanyl (=R), alkenyl, alkynyl and aromatic. Answer similarly.
, alkenyl, alkynyl and aromatic. Answer similarly.") Simulated I spectra Group 1 compounds: Functional group patterns are listed below. Match each structure with one of the 4 simulated I spectra that follow. The wave numbers listed in each spectrum are intended
Simulated I spectra Group 1 compounds: Functional group patterns are listed below. Match each structure with one of the 4 simulated I spectra that follow. The wave numbers listed in each spectrum are intended
ORGANIC - BRUICE 8E CH MASS SPECT AND INFRARED SPECTROSCOPY
 !! www.clutchprep.com CONCEPT: PURPOSE OF ANALYTICAL TECHNIQUES Classical Methods (Wet Chemistry): Chemists needed to run dozens of chemical reactions to determine the type of molecules in a compound.
Application of IR Raman Spectroscopy
 Application of IR Raman Spectroscopy 3 IR regions Structure and Functional Group Absorption IR Reflection IR Photoacoustic IR IR Emission Micro 10-1 Mid-IR Mid-IR absorption Samples Placed in cell (salt)
Chemistry 343- Spring 2008
 Chemistry 343- Spring 2008 27 Chapter 2- Representative Carbon Compounds: Functional Groups, Intermolecular Forces and IR Spectroscopy A. ydrocarbons: Compounds composed of only C and Four Basic Types:
CHM 223 Organic Chemistry I Prof. Chad Landrie. Lecture 10: September 20, 2018 Ch. 12: Spectroscopy mass spectrometry infrared spectroscopy
 M 223 Organic hemistry I Prof. had Landrie Lecture 10: September 20, 2018 h. 12: Spectroscopy mass spectrometry infrared spectroscopy i>licker Question onsider a solution that contains 65g R enantiomer
Symmetric Stretch: allows molecule to move through space
 BACKGROUND INFORMATION Infrared Spectroscopy Before introducing the subject of IR spectroscopy, we must first review some aspects of the electromagnetic spectrum. The electromagnetic spectrum is composed
WEBSITE DATA FOR CHAPTER 6
 66 WEBSITE DATA FOR CHAPTER 6 Spectroscopic Identification of Organic Compounds by Infared Spectroscopy I. INTRODUCTION NOTE. It should be pointed out that a reciprocal centimeter is not a unit of frequency.
Terms used in UV / Visible Spectroscopy
 Terms used in UV / Visible Spectroscopy Chromophore The part of a molecule responsible for imparting color, are called as chromospheres. OR The functional groups containing multiple bonds capable of absorbing
(2) Read each statement carefully and pick the one that is incorrect in its information.
 Read each statement carefully and pick the one that is incorrect in its information.") Organic Chemistry - Problem Drill 17: IR and Mass Spectra No. 1 of 10 1. Which statement about infrared spectroscopy is incorrect? (A) IR spectroscopy is a method of structure determination based on the
Organic Chemistry - Problem Drill 17: IR and Mass Spectra No. 1 of 10 1. Which statement about infrared spectroscopy is incorrect? (A) IR spectroscopy is a method of structure determination based on the
William H. Brown & Christopher S. Foote
 Requests for permission to make copies of any part of the work should be mailed to:permissions Department, Harcourt Brace & Company, 6277 Sea Harbor Drive, Orlando, Florida 32887-6777 William H. Brown
Learning Guide for Chapter 3 - Infrared Spectroscopy
 Learning Guide for hapter 3 - Infrared Spectroscopy I. Introduction to spectroscopy - p 1 II. Molecular vibrations - p 3 III. Identifying functional groups - p 6 IV. Interpreting an IR spectrum - p 12
Instrumental Chemical Analysis
 L11 page 1 Instrumental Chemical Analysis Infrared Spectroscopy Dr. Ahmad Najjar Philadelphia University Faculty of Pharmacy Department of Pharmaceutical Sciences 2 nd semester, 2016/2017 Infrared Spectroscopy
E35 SPECTROSCOPIC TECHNIQUES IN ORGANIC CHEMISTRY
 E35 SPECTRSCPIC TECNIQUES IN RGANIC CEMISTRY Introductory Comments. These notes are designed to introduce you to the basic spectroscopic techniques which are used for the determination of the structure
STRUCTURE ELUCIDATION BY INTEGRATED SPECTROSCOPIC METHODS
 Miscellaneous Methods UNIT 14 STRUCTURE ELUCIDATION BY INTEGRATED SPECTROSCOPIC METHODS Structure 14.1 Introduction Objectives 14.2 Molecular Formula and Index of Hydrogen Deficiency 14.3 Structural Information
February 8, 2018 Chemistry 328N
 Lecture 7 UV-Vis spectroscopy February 8, 2018 First Midterm Exam When: Wednesday, 2/14 When: 7-9 PM (please do not be late) Where: WEL 2.122 This room!!! What: Covers material through today s lecture
8. Spectrum continued
 I. The ν(x-h) region alcohols H-bonding in alcohols Figs. 2.30,2.32,2.59,2.61,2.45 w 3400-3200 ν(o-h) amines s neat carboxylic acids increasing dilution 3600 free ν(o-h) w HN(C 4 H 9 ) 2 -NHbroad m-s 3500-3100
3. What number would be used to indicate the double bond position in the IUPAC name for CH 3 CH 2 CH=CH CH 3 a. 1 b. 2 c. 3 d.
 Chapter 2 Unsaturated Hydrocarbons MULTIPLE CHOICE 1. Name a difference between a saturated and an unsaturated hydrocarbon. a. Saturated hydrocarbons are composed of only carbon and hydrogen, and unsaturated
Spectroscopy. Fourier Transform Infrared (FT-IR) Spectroscopy
 Spectroscopy") Fourier Transform Infrared (FT-IR) Spectroscopy Learning objectives Learning outcomes After completing this course, the student will be able to: Recognize the concept and principle of FT-IR Spectroscopy
Fourier Transform Infrared (FT-IR) Spectroscopy Learning objectives Learning outcomes After completing this course, the student will be able to: Recognize the concept and principle of FT-IR Spectroscopy
Infrared Spectroscopy: How to use the 5 zone approach to identify functional groups
 Infrared Spectroscopy: How to use the 5 zone approach to identify functional groups Definition: Infrared Spectroscopy is the study of the Infrared Spectrum. An Infrared Spectrum is the plot of photon energy
6. CHARACTERIZATION OF AS (III) IONS BIOSORPTION BY THE LIVE, HEAT AND ALKALINE- TREATED FUNGAL BIOMASS ON THE BASICS OF SURFACE STUDIES
 IONS BIOSORPTION BY THE LIVE, HEAT AND ALKALINE- TREATED FUNGAL BIOMASS ON THE BASICS OF SURFACE STUDIES") 6. CHARACTERIZATION OF AS (III) IONS BIOSORPTION BY THE LIVE, HEAT AND ALKALINE- TREATED FUNGAL BIOMASS ON THE BASICS OF SURFACE STUDIES 6. Introduction Infrared spectroscopy is a technique used to identify
6. CHARACTERIZATION OF AS (III) IONS BIOSORPTION BY THE LIVE, HEAT AND ALKALINE- TREATED FUNGAL BIOMASS ON THE BASICS OF SURFACE STUDIES 6. Introduction Infrared spectroscopy is a technique used to identify
Alkanes, Alkenes and Alkynes
 Alkanes, Alkenes and Alkynes Hydrocarbons Hydrocarbons generally fall into 2 general groupings, aliphatic hydrocarbons and aromatic hydrocarbons. Aliphatic hydrocarbons contain chains and rings of hydrocarbons,
Paper 12: Organic Spectroscopy
 Subject Chemistry Paper No and Title Module No and Title Module Tag Paper 12: Organic Spectroscopy 31: Combined problem on UV, IR, 1 H NMR, 13 C NMR and Mass - Part III CHE_P12_M31 TABLE OF CONTENTS 1.
Increasing energy. ( 10 4 cm -1 ) ( 10 2 cm -1 )
 ( 10 2 cm -1 )") The branch of science which deals with the interaction of electromagnetic radiation with matter is called spectroscopy The energy absorbed or emitted in each transition corresponds to a definite frequency
The branch of science which deals with the interaction of electromagnetic radiation with matter is called spectroscopy The energy absorbed or emitted in each transition corresponds to a definite frequency
Welcome to Organic Chemistry II
 Welcome to Organic Chemistry II Erika Bryant, Ph.D. erika.bryant@hccs.edu Class Syllabus 3 CHAPTER 12: STRUCTURE DETERMINATION 4 What is this solution Soda Tea Coffee??? 5 What is this solution Soda Tea
Homework Assignment #3
 Chemistry 12600 Spring 2016 Homework Assignment #3 1. Determine whether each of the following statements is true or false. If the statement is false, modify and rewrite it so that it is a true statement.
Chapter 9. Nuclear Magnetic Resonance. Ch. 9-1
 Chapter 9 Nuclear Magnetic Resonance Ch. 9-1 1. Introduction Classic methods for organic structure determination Boiling point Refractive index Solubility tests Functional group tests Derivative preparation
ORGANIC SPECTROSCOPY NOTES
 - 1 - ORGANIC SPECTROSCOPY NOTES Basics of Spectroscopy UV/vis, IR and NMR are all types of Absorption Spectroscopy, where EM radiation corresponding to exactly the energy of specific excitations in molecules
i e l d f Energy (E) = Direction visible ultraviolet X-ray gamma infrared
 = Direction visible ultraviolet X-ray gamma infrared") rganic Structure Determination Analytical hemistry Instrument-based methods for determination of structure of organic molecules 1) Infrared Spectroscopy - yields functional groups 2) M Spectroscopy - very
rganic Structure Determination Analytical hemistry Instrument-based methods for determination of structure of organic molecules 1) Infrared Spectroscopy - yields functional groups 2) M Spectroscopy - very
Infrared spectroscopy Basic theory
 Infrared spectroscopy Basic theory Dr. Davide Ferri Paul Scherrer Institut 056 310 27 81 davide.ferri@psi.ch Importance of IR spectroscopy in catalysis IR Raman NMR XAFS UV-Vis EPR 0 200 400 600 800 1000
Alkanes and Cycloalkanes
 Alkanes and Cycloalkanes Families of Organic Compounds Organic compounds can be grouped into families by their common structural features We shall survey the nature of the compounds in a tour of the families
Downloaded from
 1 Class XI Chemistry Ch 13: Hydrocarbons TOP Concepts: 1. Alkanes: General formula: C n H 2n+2 2. Preparation of alkanes: 3. Kolbe s electrolytic method: Alkali metal salts of carboxylic acids undergo
Infrared Spectroscopy. Provides information about the vibraions of functional groups in a molecule
 Infrared Spectroscopy Provides information about the vibraions of functional groups in a molecule Therefore, the functional groups present in a molecule can be deduced from an IR spectrum Two important
AP Chemistry Chapter 22 - Organic and Biological Molecules
 AP Chemistry Chapter - Organic and Biological Molecules.1 Alkanes: Saturated Hydrocarbons A. Straight-chain Hydrocarbons 1. Straight-chain alkanes have the formula C n H n+. Carbons are sp hybridized The
Organic Chemistry Worksheets
 Highlight the single longest, continuous carbon-carbon chain. Note the alkyl branches that are connected to the root chain. Count the carbons in the root chain, starting from the end closest to the alkyl
How to Interpret an Infrared (IR) Spectrum
 Spectrum") How to Interpret an Infrared (IR) Spectrum Infrared (IR) Spectroscopy allows the identification of particular bonds present within molecules. In this class we have simplified IR analysis by only focusing
How to Interpret an Infrared (IR) Spectrum Infrared (IR) Spectroscopy allows the identification of particular bonds present within molecules. In this class we have simplified IR analysis by only focusing
 1 TOP Concepts: Class XI Chemistry Ch 13: Hydrocarbons 1. Alkanes: General formula: C n H 2n+2 2. Preparation of alkanes: 3. Kolbe s electrolytic method: Alkali metal salts of carboxylic acids undergo
Molecular Spectroscopy. H 2 O e -
 Molecular Spectroscopy ν (cm -1 ) λ (cm) 10 6 10 8 10 10 10 12 10 14 10 16 10 18 10 20 10 22 ν (Hz) NMR ESR microwave IR UV/Vis VUV X-Ray Gamma Ray H 2 e - UV/Vis Spectroscopy absorption technique X hν
Alkanes and Cycloalkanes
 Chapter 3 Alkanes and Cycloalkanes Two types Saturated hydrocarbons Unsaturated hydrocarbons 3.1 Alkanes Also referred as aliphatic hydrocarbons General formula: CnH2n+2 (straight chain) and CnH2n (cyclic)
William H. Brown & Christopher S. Foote
 Requests for permission to make copies of any part of the work should be mailed to:permissions Department, Harcourt Brace & Company, 6277 Sea Harbor Drive, Orlando, Florida 32887-6777 William H. Brown
Infra Red Spectroscopy
 CH 2252 Instrumental Methods of Analysis Unit I Infra Red Spectroscopy M. Subramanian Assistant Professor Department of Chemical Engineering Sri Sivasubramaniya Nadar College of Engineering Kalavakkam
CHE 325 SPECTROSCOPY (A) CHAP 13A ASSIGN CH 2 CH CH 2 CH CHCH 3
 CHAP 13A ASSIGN CH 2 CH CH 2 CH CHCH 3") CE 325 SPECTRSCPY (A) CAP 13A ASSIGN 1. Which compound would have a UV absorption band at longest wavelength? A. I B. II C. III D. IV E. V C CC 3 CC C 2 C CC 3 I II III C 2 C C 2 C CC 3 IV V 2. Select
CE 325 SPECTRSCPY (A) CAP 13A ASSIGN 1. Which compound would have a UV absorption band at longest wavelength? A. I B. II C. III D. IV E. V C CC 3 CC C 2 C CC 3 I II III C 2 C C 2 C CC 3 IV V 2. Select
Chapter 22. Organic and Biological Molecules
 Chapter 22 Organic and Biological Molecules The Bonding of Carbon Organic chemistry is the chemistry of compounds containing carbon. Because carbon can form single, double, and triple bonds, the following
Vibrational Spectroscopy
 Vibrational Spectroscopy In this part of the course we will look at the kind of spectroscopy which uses light to excite the motion of atoms. The forces required to move atoms are smaller than those required
MASS SPECTROMETRY: BASIC EXPERIMENT
 http://science.widener.edu/svb/massspec/ei.html relative abundance Pavia 8.1-8.5 MASS SPECTROMETRY: BASIC EXPERIMENT scienceaid.co.uk -e Molecule Molecule +. + 2e base peak [Fragments] +. fragment peaks
Answers to Assignment #5
 Answers to Assignment #5 A. 9 8 l 2 5 DBE (benzene + 1 DBE) ( 9 2(9)+2-9 8+1+1 = 10 ˆ 5 DBE) nmr pattern of two doublets of equal integration at δ7.4 and 7.9 ppm means the group (the δ7.9 shift) IR band
MOLECULAR REPRESENTATIONS AND INFRARED SPECTROSCOPY
 MOLEULAR REPRESENTATIONS AND INFRARED SPETROSOPY A STUDENT SOULD BE ABLE TO: 1. Given a Lewis (dash or dot), condensed, bond-line, or wedge formula of a compound draw the other representations. 2. Give
EXPT. 9 DETERMINATION OF THE STRUCTURE OF AN ORGANIC COMPOUND USING UV, IR, NMR AND MASS SPECTRA
 EXPT. 9 DETERMINATION OF THE STRUCTURE OF AN ORGANIC COMPOUND USING UV, IR, NMR AND MASS SPECTRA Structure 9.1 Introduction Objectives 9.2 Principle 9.3 Requirements 9.4 Strategy for the Structure Elucidation
Reading Skill Practice
 system. This process is explained on page 698. create a flowchart that describes the steps for naming branched-chain alkanes using the IUPAC A flowchart can help you to remember the order in which events
PAPER No. 12: ORGANIC SPECTROSCOPY MODULE No. 4: Basic principles and Instrumentation for IR spectroscopy
 Subject Chemistry Paper No and Title Module No and Title Module Tag Paper 12: Organic Spectroscopy Module 4: Basic principles and Instrumentation for IR spectroscopy CHE_P12_M4_e-Text TABLE OF CONTENTS
Unit 2, Review for Quiz #1: Hydrocarbons
 Unit 2, Review for Quiz #1: Hydrocarbons 1. What is the simplest organic molecule? a) CH 4 c) HCN b) CO 2 d) HC CH 2. Which of the following molecules would be classified as organic? I) CaCO 3 II) C 2
Chapter 25 Organic and Biological Chemistry
 Chapter 25 Organic and Biological Chemistry Organic Chemistry The chemistry of carbon compounds. Carbon has the ability to form long chains. Without this property, large biomolecules such as proteins,
Chemistry 11. Unit 10 Organic Chemistry Part III Unsaturated and aromatic hydrocarbons
 Chemistry 11 Unit 10 Organic Chemistry Part III Unsaturated and aromatic hydrocarbons 2 1. Unsaturated hydrocarbons So far, we have studied the hydrocarbons in which atoms are connected exclusively by
Chapter 25: The Chemistry of Life: Organic and Biological Chemistry
 Chemistry: The Central Science Chapter 25: The Chemistry of Life: Organic and Biological Chemistry The study of carbon compounds constitutes a separate branch of chemistry known as organic chemistry The
Experiment 11: NUCLEAR MAGNETIC RESONANCE SPECTROSCOPY
 Experiment 11: NUCLEAR MAGNETIC RESONANCE SPECTROSCOPY Purpose: This is an exercise to introduce the use of nuclear magnetic resonance spectroscopy, in conjunction with infrared spectroscopy, to determine
Chapter 2: An Introduction to Organic Compounds
 Chapter : An Introduction to Organic Compounds I. FUNCTIONAL GROUPS: Functional groups with similar structure/reactivity may be "grouped" together. A. Functional Groups With Carbon-Carbon Multiple Bonds.
Chapter 13 Alkenes and Alkynes & Aromatic Compounds
 Chapter 13 Alkenes and Alkynes & Aromatic Compounds Chapter Outline 13.1 Alkenes and Alkynes 13.2 Nomenclature of Alkenes and Alkynes 13.3 Cis Trans Isomers 13.4 Alkenes in Food and Medicine 13.6 Reactions
Organic Compound Identification Using Infrared Spectroscopy. Description
 Return to paper Organic Compound Identification Using Infrared Spectroscopy Dr. Walt Volland, Bellevue Community College All rights reserved 1999, Bellevue, Washington Description This exercise is intended
Chapter 12: Unsaturated Hydrocarbons
 Chapter 12: Unsaturated Hydrocarbons UNSATURATED HYDROCARBONS contain carbon-carbon multiple bonds. Alkenes C=C double bonds Alkynes triple bonds Aromatics benzene rings 1 2 NAMING ALKENES Step 1: Name
3. Organic Compounds: Alkanes and Cycloalkanes
 3. Organic Compounds: Alkanes and Cycloalkanes Based on McMurry s Organic Chemistry, 6 th edition, Chapter 3 2003 Ronald Kluger Department of Chemistry University of Toronto 1 Families of Organic Compounds!