Spectroscopic techniques: why, when, where,and how Dr. Roberto GIANGIACOMO
|
|
|
- Candice Green
- 5 years ago
- Views:
Transcription
1 Spectroscopic techniques: why, when, where,and how Dr. Roberto GIANGIACOMO
2 BASIC INFORMATION Spectroscopy uses light to analyze substances or products by describing the energy transfer between light and matter. The energy of a photon is defined as:
3 A spectrum is the fingerprint or the image of a sample, exhibiting absorption peaks corresponding to the frequencies of the vibrations among the bonds of the atoms constituting the matter under investigation.
4 The frequency of an absorption band is dependent to a first approximation upon the masses of the atoms involved and the force constant of the interatomic bond in accordance with the classical equation for a harmonic oscillator κ= 4π 2 ν 2 µ where κ is the force constant, ν the frequency, and µ the reduced mass of atoms involved in the vibration µ = m 1 m 2 /(m 1 +m 2 ) where m 1 and m 2 are the masses of the atoms involved
5 The force constants holding these diatomic groups vary not only with the mass of atoms but also with the type of chemical bond. The frequency of absorption is determined largely by the force constant, κ.
6 These molecular vibrations can be described using the model of the harmonic diatomic oscillator.
7 The potential energy V of the harmonic oscillator is a quadratic function of the displacement of the vibrating atoms. Precondition for the absorption of a light photon is that the frequency of the light photon equals the energy difference between two vibrational states of the bond.
8 The interaction of infrared radiation with a vibrating molecule only occurs when the vibration is accompanied by a change of the dipole moment. In this case the energy is succesfully transferred to the molecule.
9
10
11 Types of bands
12
13
14 The deviations from simple harmonic motion of molecular groups (degree of anharmonicity) increases with the amplitude of the oscillation, becoming very large as the amplitude approaches that required for dissociation of the group. The amplitude of molecular motion is not determined by the intensity of the radiation falling upon the sample but is a function of the masses and force constants of the atoms involved.
15 Symmetrical stretching
16 Asymmetric stretching
17 Rocking
18 Scissoring
19 Twisting
20 Wagging
21 The absorption of photons in one of the spectral regions determines which region is the most useful to describe a molecule or an atomic transition. Vibrational spectroscopic techniques are used to assess molecular motions and firgerprint types.
22 1.3 MIR 1 spectrum Abs Numeri d onda[cm-1] Wavenumbers [cm -1 ] FUNCTIONAL GROUPS FINGERPRINT AREA ( FREQUENCIES ( >1500 cm-1) cm-1) identification of organic functional identification of simple bonds groups variable values invariable values characteristic ofeachsingle identical for molecules containing the molecule same functional group
23 FINGERPRINT AREA Most simple bonds absorb in this area and due to their similar energy, strong interactions with neighboring bonds occur. Absorption bands arising from these interactions and related to the global molecule structure are generated. Due to its complexity it s not possible an exact spectral interpretation ; conversely, this complexity makes this area unique and useful for an exact spectral identification
24 NIR, MIR and Raman comparison RAMAN M m MID-INFRARED INFRARED NEAR-INFRARED V V V Stokes Anti-Stokes q SCATTERING TECHNIQUE q ABSORPTION TECHNIQUES q SOURCE MONOCHROMATIC RADIATION (LASER VIS-NIR) SOURCES (DISPERSED) POLYCHROMATIC RADIATION (GLOBAR TUNGSTEN) INFORMATION CONTAINED IN SCATTERED RADIATION I Raman 10-8 I Source INFORMATION CONTAINED IN ABSORBED RADIATION 24
25 Quantitative Vibrational Spectroscopy RAMAN MIR / NIR I Raman c however, a reference intensity is required for the compensation of fluctuations in the scattering efficiency I log 0 I = A = a b c (BEER S LAW) A = absorbance a = absorptivity (cm 2 mol - 1 ) b = sample thickness (cm) c = sample concentration (mol cm - 3 ) Raman and MIR spectra can frequently be evaluated by isolated signals or absorption bands univariate method In NIR this is rarely the case and the information has to be extracted from larger spectral regions multivariate methods 25
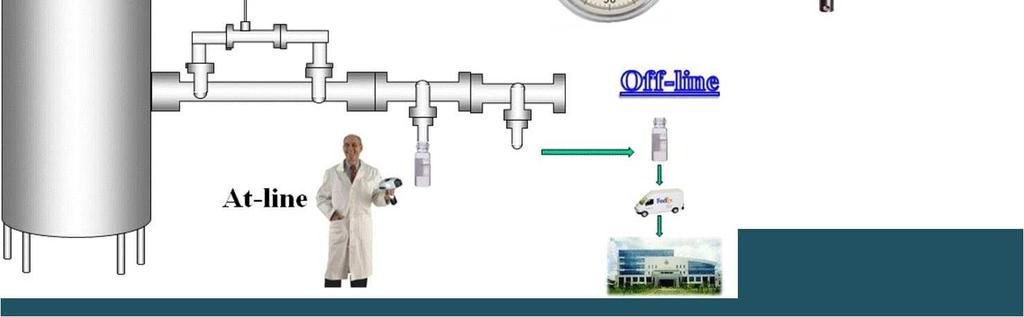
26 Sample Preparation RAMAN MID-INFRAREDINFRARED NEAR-INFRARED NO SAMPLE PREPARATION NO SAMPLE PREPARATION ONLY VIA ATR NO SAMPLE PREPARATION 26
27 Process monitoring : Raman, MIR, NIR comparison RAMAN MID-INFRARED/ATRINFRARED/ATR NEAR-INFRARED SMALL SAMPLE VOLUME (µl) OR SAMPLE THICKNESS (µm) LARGE SAMPLE THICKNESS (UP TO cm) LIGHT-FIBER OPTICS (> 100m) LIMITED LIGHT-FIBER OPTICS (> 100m) AT-LINE / IN-LINE PROBES ATR-PROBES TRANSMISSION TRANSFLECTION DIFFUSE-REFLECTION PROBES 27
28 NIR & MIR For quantitative determinations the use of NIR instruments that detect the NIR predominates over MIR apparatus because fewer precautions are needed (moisture problems in the MIR). Conversely, MIR may be useful when it s necessary to define precise λ ranges in NIR region for quantitave analyses, taking advantage of higher MIR interpretative power.
29
30 WHY Spectroscopic techniques: do not require the use of solvents or carrier require little or no sample preparation are very fast and offer an immediate response lend themselves to image acquisition can be used for multiple applications have become portable
31 WHEN Identification of components or constituents for qualitative determinations/discriminations Quantitative measurements, on the basis of calibration (single or multiple components), for product composition/process monitoring
32 QUANTITATIVE ANALYSIS Calibration: High number of samples (NOT replicates) > 50 Samples must be selected following specific rules
33 WHERE Off-line: at the laboratory In-line: directly along the process At-line: close to the sampling point On-line: directly inside the process line/pipe
34 At lab
35 In field
36 On farm equipments
37 On drones

38
39 HOW

40 NIR measurements Trasmittance Reflectance Transflectance

41
42

43

44


45
46
. Scan range: 60 μm x 60 μm x 30 μm.")
47 D confocal Raman image of a fluid inclusion in garnet (Red: Garnet, Blue: Water, Green: Calcite, Turquoise: Mica). Scan range: 60 μm x 60 μm x 30 μm.

48

49 Raman depth-profiling (x-z direction) of a multilayered polymer coating. 50 μm x 100 μm scan range, 200 x 200 pixels, spectra, acquisition time per spectra: 50 ms.
What happens when light falls on a material? Transmission Reflection Absorption Luminescence. Elastic Scattering Inelastic Scattering
 Raman Spectroscopy What happens when light falls on a material? Transmission Reflection Absorption Luminescence Elastic Scattering Inelastic Scattering Raman, Fluorescence and IR Scattering Absorption
Spectroscopy tools for PAT applications in the Pharmaceutical Industry
 Spectroscopy tools for PAT applications in the Pharmaceutical Industry Claude Didierjean Sr. Technology and Applications Consultant Real Time Analytics Mettler Toledo AutoChem, Inc. claude.didierjean@mt.com
Chemistry 2. Assumed knowledge
 Chemistry 2 Lecture 8 IR Spectroscopy of Polyatomic Molecles Assumed knowledge There are 3N 6 vibrations in a non linear molecule and 3N 5 vibrations in a linear molecule. Only modes that lead to a change
Lecture 8. Assumed knowledge
 Chemistry 2 Lecture 8 IR Spectroscopy of Polyatomic Molecles Assumed knowledge There are 3N 6 vibrations in a non linear molecule and 3N 5 vibrations in a linear molecule. Only modes that lead to a change
Infrared spectroscopy Basic theory
 Infrared spectroscopy Basic theory Dr. Davide Ferri Paul Scherrer Institut 056 310 27 81 davide.ferri@psi.ch Importance of IR spectroscopy in catalysis IR Raman NMR XAFS UV-Vis EPR 0 200 400 600 800 1000
Application of IR Raman Spectroscopy
 Application of IR Raman Spectroscopy 3 IR regions Structure and Functional Group Absorption IR Reflection IR Photoacoustic IR IR Emission Micro 10-1 Mid-IR Mid-IR absorption Samples Placed in cell (salt)
Lambert Beer s law. where, K=Molar Absorption Coefficient C=Concentration of the Solution & I=Intensity of light. di = dx
 Lambert Beer s law When the beam of monochromatic radiations is passed through a homogeneous absorbing solution, the rate of decrease of intensity,with thickness of absorbing medium is proportional to
IR Spectrography - Absorption. Raman Spectrography - Scattering. n 0 n M - Raman n 0 - Rayleigh
 RAMAN SPECTROSCOPY Scattering Mid-IR and NIR require absorption of radiation from a ground level to an excited state, requires matching of radiation from source with difference in energy states. Raman
Vibrational Spectroscopies. C-874 University of Delaware
 Vibrational Spectroscopies C-874 University of Delaware Vibrational Spectroscopies..everything that living things do can be understood in terms of the jigglings and wigglings of atoms.. R. P. Feymann Vibrational
van Quantum tot Molecuul
 10 HC10: Molecular and vibrational spectroscopy van Quantum tot Molecuul Dr Juan Rojo VU Amsterdam and Nikhef Theory Group http://www.juanrojo.com/ j.rojo@vu.nl Molecular and Vibrational Spectroscopy Based
Advanced Spectroscopy Laboratory
 Advanced Spectroscopy Laboratory - Raman Spectroscopy - Emission Spectroscopy - Absorption Spectroscopy - Raman Microscopy - Hyperspectral Imaging Spectroscopy FERGIELAB TM Raman Spectroscopy Absorption
THEORY OF MOLECULE. A molecule consists of two or more atoms with certain distances between them
 THEORY OF MOLECULE A molecule consists of two or more atoms with certain distances between them through interaction of outer electrons. Distances are determined by sum of all forces between the atoms.
Putting Near-Infrared Spectroscopy (NIR) in the spotlight. 13. May 2006
 in the spotlight. 13. May 2006") Putting Near-Infrared Spectroscopy (NIR) in the spotlight 13. May 2006 0 Outline What is NIR good for? A bit of history and basic theory Applications in Pharmaceutical industry Development Quantitative
Putting Near-Infrared Spectroscopy (NIR) in the spotlight 13. May 2006 0 Outline What is NIR good for? A bit of history and basic theory Applications in Pharmaceutical industry Development Quantitative
2. Infrared spectroscopy
 2. Infrared spectroscopy 2-1Theoretical principles An important tool of the organic chemist is Infrared Spectroscopy, or IR. IR spectra are acquired on a special instrument, called an IR spectrometer.
VIBRATION-ROTATION SPECTRUM OF CO
 Rice University Physics 332 VIBRATION-ROTATION SPECTRUM OF CO I. INTRODUCTION...2 II. THEORETICAL CONSIDERATIONS...3 III. MEASUREMENTS...8 IV. ANALYSIS...9 April 2011 I. Introduction Optical spectroscopy
6.2 Polyatomic Molecules
 6.2 Polyatomic Molecules 6.2.1 Group Vibrations An N-atom molecule has 3N - 5 normal modes of vibrations if it is linear and 3N 6 if it is non-linear. Lissajous motion A polyatomic molecule undergoes a
24/ Rayleigh and Raman scattering. Stokes and anti-stokes lines. Rotational Raman spectroscopy. Polarizability ellipsoid. Selection rules.
 Subject Chemistry Paper No and Title Module No and Title Module Tag 8/ Physical Spectroscopy 24/ Rayleigh and Raman scattering. Stokes and anti-stokes lines. Rotational Raman spectroscopy. Polarizability
Introduction to Vibrational Spectroscopy
 Introduction to Vibrational Spectroscopy Harmonic oscillators The classical harmonic oscillator The uantum mechanical harmonic oscillator Harmonic approximations in molecular vibrations Vibrational spectroscopy
16.1 Molecular Vibrations
 16.1 Molecular Vibrations molecular degrees of freedom are used to predict the number of vibrational modes vibrations occur as coordinated movement among many nuclei the harmonic oscillator approximation
Radiant energy is proportional to its frequency (cycles/s = Hz) as a wave (Amplitude is its height) Different types are classified by frequency or
 as a wave (Amplitude is its height) Different types are classified by frequency or") CHEM 241 UNIT 5: PART B INFRA-RED RED SPECTROSCOPY 1 Spectroscopy of the Electromagnetic Spectrum Radiant energy is proportional to its frequency (cycles/s = Hz) as a wave (Amplitude is its height) Different
CHEM 241 UNIT 5: PART B INFRA-RED RED SPECTROSCOPY 1 Spectroscopy of the Electromagnetic Spectrum Radiant energy is proportional to its frequency (cycles/s = Hz) as a wave (Amplitude is its height) Different
m m lighter 'atom' dominates 2 INFRARED SPECTROSCOPY All modes of vibrations are not IR active.
 INFRARED SPECTROSCOPY Infrared spectroscopy probes the interaction of infrared radiation with covalent bonds in molecules. Absorption of IR radiation results in the transitions between vibrational energy
DOWNLOAD OR READ : INFRARED AND RAMAN SPECTROSCOPY CONCEPTS AND APPLICATIONS PDF EBOOK EPUB MOBI
 DOWNLOAD OR READ : INFRARED AND RAMAN SPECTROSCOPY CONCEPTS AND APPLICATIONS PDF EBOOK EPUB MOBI Page 1 Page 2 infrared and raman spectroscopy concepts and applications infrared and raman spectroscopy
V( x) = V( 0) + dv. V( x) = 1 2
 = V( 0) + dv. V( x) = 1 2") Spectroscopy 1: rotational and vibrational spectra The vibrations of diatomic molecules Molecular vibrations Consider a typical potential energy curve for a diatomic molecule. In regions close to R e (at
Spectroscopy 1: rotational and vibrational spectra The vibrations of diatomic molecules Molecular vibrations Consider a typical potential energy curve for a diatomic molecule. In regions close to R e (at
Vibrational Spectroscopy of Molecules on Surfaces
 Vibrational Spectroscopy of Molecules on Surfaces Edited by John T. Yates, Jr. University of Pittsburgh Pittsburgh, Pennsylvania and Theodore E. Madey National Bureau of Standards Gaithersburg, Maryland
Organic Spectra Infra Red Spectroscopy H. D. Roth. THEORY and INTERPRETATION of ORGANIC SPECTRA H. D. Roth. Infra Red Spectroscopy
 rganic Spectra Infra Red Spectroscopy. D. Roth TERY and INTERPRETATIN of RGANI SPETRA. D. Roth Infra Red Spectroscopy Infrared spectroscopy (IR) is an analytical technique concerned with molecular vibrations
Spectroscopy in Inorganic Chemistry. Vibration and Rotation Spectroscopy
 Spectroscopy in Inorganic Chemistry Symmetry requirement for coupling combination bands and Fermi resonance 2 3 V 3 1505 cm -1 (R, IR) E' stretches v 1 888 cm -1 (R) A 1 ' stretch V 2 718 cm -1 (IR) A
Molecular spectroscopy
 Molecular spectroscopy Origin of spectral lines = absorption, emission and scattering of a photon when the energy of a molecule changes: rad( ) M M * rad( ' ) ' v' 0 0 absorption( ) emission ( ) scattering
PAPER No. 12: ORGANIC SPECTROSCOPY MODULE No. 7: Instrumentation for IR spectroscopy
 KNOW MORE Web links https://en.wikipedia.org/wiki/infrared_ http://hiq.lindegas.com/en/analytical_methods/infrared_/non_dispersive_infrared.html http://blamp.sites.truman.edu/files/2012/11/322-ir-and-ftir.pdf
Spectroscopy in Inorganic Chemistry. Vibration and Rotation Spectroscopy
 Spectroscopy in Inorganic Chemistry Vibrational energy levels in a diatomic molecule f = k r r V = ½kX 2 Force constant r Displacement from equilibrium point 2 X= r=r-r eq V = ½kX 2 Fundamental Vibrational
Infrared Spectroscopy: Identification of Unknown Substances
 Infrared Spectroscopy: Identification of Unknown Substances Suppose a white powder is one of the four following molecules. How can they be differentiated? H N N H H H H Na H H H H H A technique that is
Module 4 : Third order nonlinear optical processes. Lecture 28 : Inelastic Scattering Processes. Objectives
 Module 4 : Third order nonlinear optical processes Lecture 28 : Inelastic Scattering Processes Objectives In this lecture you will learn the following Light scattering- elastic and inelastic-processes,
Advanced Pharmaceutical Analysis
 Lecture 2 Advanced Pharmaceutical Analysis IR spectroscopy Dr. Baraa Ramzi Infrared Spectroscopy It is a powerful tool for identifying pure organic and inorganic compounds. Every molecular compound has
Session #1: Theoretical background and computer simulations of molecular vibrations.
 Raman Spectroscopy Session #1: Theoretical background and computer simulations of molecular vibrations. Goals: Understand the origin of the Raman effect. Understand the vibrational normal modes of molecules.
Chemistry Instrumental Analysis Lecture 15. Chem 4631
 Chemistry 4631 Instrumental Analysis Lecture 15 IR Instruments Types of Instrumentation Dispersive Spectrophotometers (gratings) Fourier transform spectrometers (interferometer) Single beam Double beam
Infrared spectroscopy. Siriphorn Laomanacharoen Bureau of Drug and Narcotic Department of Medical Sciences 2 March 2012
 Siriphorn Laomanacharoen Bureau of Drug and Narcotic Department of Medical Sciences 2 March 2012 1 Infrared region 2 Infrared region below red in the visible region at wavelengths between 2.5-25 µm more
5.3 Rotational Raman Spectroscopy General Introduction
 5.3 Rotational Raman Spectroscopy 5.3.1 General Introduction When EM radiation falls on atoms or molecules, it may be absorbed or scattered. If λis unchanged, the process is referred as Rayleigh scattering.
Types of Molecular Vibrations
 Important concepts in IR spectroscopy Vibrations that result in change of dipole moment give rise to IR absorptions. The oscillating electric field of the radiation couples with the molecular vibration
A56. Raman Spektroscopy. Jan Publisher: Institute of Physical Chemistry
 Physikalische-Chemisches Praktikum für Anfänger A56 Raman Spektroscopy Jan. 2017 Publisher: Institute of Physical Chemistry 1 Objectives 1. Take the Raman spectra of CO 2 (s), CS 2 (l), C 6 H 6 (l) and
Chem 442 Review of Spectroscopy
 Chem 44 Review of Spectroscopy General spectroscopy Wavelength (nm), frequency (s -1 ), wavenumber (cm -1 ) Frequency (s -1 ): n= c l Wavenumbers (cm -1 ): n =1 l Chart of photon energies and spectroscopies
Reflection = EM strikes a boundary between two media differing in η and bounces back
 Reflection = EM strikes a boundary between two media differing in η and bounces back Incident ray θ 1 θ 2 Reflected ray Medium 1 (air) η = 1.00 Medium 2 (glass) η = 1.50 Specular reflection = situation
Molecular energy levels and spectroscopy
 Molecular energy levels and spectroscopy 1. Translational energy levels The translational energy levels of a molecule are usually taken to be those of a particle in a three-dimensional box: n x E(n x,n
Application of Raman Spectroscopy for Noninvasive Detection of Target Compounds. Kyung-Min Lee
 Application of Raman Spectroscopy for Noninvasive Detection of Target Compounds Kyung-Min Lee Office of the Texas State Chemist, Texas AgriLife Research January 24, 2012 OTSC Seminar OFFICE OF THE TEXAS
Characterisation of vibrational modes of adsorbed species
 17.7.5 Characterisation of vibrational modes of adsorbed species Infrared spectroscopy (IR) See Ch.10. Infrared vibrational spectra originate in transitions between discrete vibrational energy levels of
General Considerations 1
 General Considerations 1 Absorption or emission of electromagnetic radiation results in a permanent energy transfer from the emitting object or to the absorbing medium. This permanent energy transfer can
Chemistry Instrumental Analysis Lecture 3. Chem 4631
 Chemistry 4631 Instrumental Analysis Lecture 3 Quantum Transitions The energy of a photon can also be transferred to an elementary particle by adsorption if the energy of the photon exactly matches the
Fourier transform infrared spectroscopy (FTIR) is a method used to obtain an infrared
 is a method used to obtain an infrared") Fourier Transform Infrared Spectroscopy: Low Density Polyethylene, High Density Polyethylene, Polypropylene and Polystyrene Eman Mousa Alhajji North Carolina State University Department of Materials Science
Fourier Transform Infrared Spectroscopy: Low Density Polyethylene, High Density Polyethylene, Polypropylene and Polystyrene Eman Mousa Alhajji North Carolina State University Department of Materials Science
What is spectroscopy?
 Absorption Spectrum What is spectroscopy? Studying the properties of matter through its interaction with different frequency components of the electromagnetic spectrum. With light, you aren t looking directly
Material Analysis. What do you want to know about your sample? How do you intend to do for obtaining the desired information from your sample?
 Material Analysis What do you want to know about your sample? How do you intend to do for obtaining the desired information from your sample? Why can you acquire the proper information? Symmetrical stretching
THE VIBRATIONAL SPECTRUM OF A POLYATOMIC MOLECULE (Revised 4/7/2004)
") INTRODUCTION THE VIBRATIONAL SPECTRUM OF A POLYATOMIC MOLECULE (Revised 4/7/2004) The vibrational motion of a molecule is quantized and the resulting energy level spacings give rise to transitions in the
INTRODUCTION THE VIBRATIONAL SPECTRUM OF A POLYATOMIC MOLECULE (Revised 4/7/2004) The vibrational motion of a molecule is quantized and the resulting energy level spacings give rise to transitions in the
( )( s 1
( s 1") Chemistry 362 Dr Jean M Standard Homework Problem Set 6 Solutions l Calculate the reduced mass in kg for the OH radical The reduced mass for OH is m O m H m O + m H To properly calculate the reduced mass
Chemistry 362 Dr Jean M Standard Homework Problem Set 6 Solutions l Calculate the reduced mass in kg for the OH radical The reduced mass for OH is m O m H m O + m H To properly calculate the reduced mass
Design and Development of a Smartphone Based Visible Spectrophotometer for Analytical Applications
 Design and Development of a Smartphone Based Visible Spectrophotometer for Analytical Applications Bedanta Kr. Deka, D. Thakuria, H. Bora and S. Banerjee # Department of Physicis, B. Borooah College, Ulubari,
Study of Phase Transitions by Means of Raman Scattering
 Study of Phase Transitions by Means of Raman Scattering M. Mahbubur Rahman Department of Physics & Physical Oceanography Memorial University, Canada Outlines Introduction Advantages of Raman spectroscopy?
THE VIBRATIONAL SPECTRA OF A POLYATOMIC MOLECULE (Revised 3/27/2006)
") THE VIBRATIONAL SPECTRA OF A POLYATOMIC MOLECULE (Revised 3/27/2006) 1) INTRODUCTION The vibrational motion of a molecule is quantized and the resulting energy level spacings give rise to transitions in
THE VIBRATIONAL SPECTRA OF A POLYATOMIC MOLECULE (Revised 3/27/2006) 1) INTRODUCTION The vibrational motion of a molecule is quantized and the resulting energy level spacings give rise to transitions in
Gestão e Produção Sustentável. Durability Electromagnetic radiation. ENG K49 Materiais de origem vegetal aplicados na construção
 Gestão e Produção Sustentável Durability Electromagnetic radiation ENG K49 Materiais de origem vegetal aplicados na construção Ricardo Fernandes Carvalho Electromagnetic radiation spectral band Microwaves
PC Laboratory Raman Spectroscopy
 PC Laboratory Raman Spectroscopy Schedule: Week of September 5-9: Student presentations Week of September 19-23:Student experiments Learning goals: (1) Hands-on experience with setting up a spectrometer.
Spectroscopic Selection Rules
 E 0 v = 0 v = 1 v = 2 v = 4 v = 3 For a vibrational fundamental (Δv = ±1), the transition will have nonzero intensity in either the infrared or Raman spectrum if the appropriate transition moment is nonzero.
Chem Homework Set Answers
 Chem 310 th 4 Homework Set Answers 1. Cyclohexanone has a strong infrared absorption peak at a wavelength of 5.86 µm. (a) Convert the wavelength to wavenumber.!6!1 8* = 1/8 = (1/5.86 µm)(1 µm/10 m)(1 m/100
Chapter 6 Vibrational Spectroscopy
 Chapter 6 Vibrational Spectroscopy As with other applications of symmetry and group theory, these techniques reach their greatest utility when applied to the analysis of relatively small molecules in either
Chapter4: Quantum Optical Control
 Chapter4: Quantum Optical Control Laser cooling v A P3/ B P / C S / Figure : Figure A shows how an atom is hit with light with momentum k and slows down. Figure B shows atom will absorb light if frequency
Rotational Raman Spectroscopy
 Rotational Raman Spectroscopy If EM radiation falls upon an atom or molecule, it may be absorbed if the energy of the radiation corresponds to the separation of two energy levels of the atoms or molecules.
Fourier Transform IR Spectroscopy
 Fourier Transform IR Spectroscopy Absorption peaks in an infrared absorption spectrum arise from molecular vibrations Absorbed energy causes molecular motions which create a net change in the dipole moment.
Infrared Spectroscopy An Instrumental Method for Detecting Functional Groups
 Infrared Spectroscopy An Instrumental Method for Detecting Functional Groups 1 The Electromagnetic Spectrum Infrared Spectroscopy I. Physics Review Frequency, υ (nu), is the number of wave cycles that
Monitoring the Aggregation of Particles through Raman Spectroscopy
 Monitoring the Aggregation of Particles through Raman Spectroscopy Name: Yanxiao Ma Advisor: Dr. Andrew Callender Submission Date: 19 Oct. 2012 Introduction Raman spectroscopy is a spectroscopic technique
Vibrational Spectroscopy
 Vibrational Spectroscopy In this part of the course we will look at the kind of spectroscopy which uses light to excite the motion of atoms. The forces required to move atoms are smaller than those required
Lecture 11. IR Theory. Next Class: Lecture Problem 4 due Thin-Layer Chromatography
 Lecture 11 IR Theory Next Class: Lecture Problem 4 due Thin-Layer Chromatography This Week In Lab: Ch 6: Procedures 2 & 3 Procedure 4 (outside of lab) Next Week in Lab: Ch 7: PreLab Due Quiz 4 Ch 5 Final
Organic Compound Identification Using Infrared Spectroscopy. Description
 Return to paper Organic Compound Identification Using Infrared Spectroscopy Dr. Walt Volland, Bellevue Community College All rights reserved 1999, Bellevue, Washington Description This exercise is intended
Classification of spectroscopic methods
 Introduction Spectroscopy is the study of the interaction between the electromagnetic radiation and the matter. Spectrophotometry is the measurement of these interactions i.e. the measurement of the intensity
Abstract. The vibrational properties of pentane, neopentane, polyethylene and polyvinylchloride are
 Computational Infrared Spectroscopy: Pentane, Neopentane, Polyethylene and Polyvinylchloride Eman Mousa Alhajji North Carolina State University Department of Materials Science and Engineering MSE 255 Lab
Lowest Energy Vibrational Modes of Nine Naphthalene Derivatives; Experiment and Theory
 Lowest Energy Vibrational Modes of Nine Naphthalene Derivatives; Experiment and Theory Marie-Aline Martin-Drumel*, O. Pirali, Y. Loquais, C. Falvo, P. Parneix & Ph. Bréchignac ISMO, CNRS, University of
R O Y G B V. Spin States. Outer Shell Electrons. Molecular Rotations. Inner Shell Electrons. Molecular Vibrations. Nuclear Transitions
 Spin States Molecular Rotations Molecular Vibrations Outer Shell Electrons Inner Shell Electrons Nuclear Transitions NMR EPR Microwave Absorption Spectroscopy Infrared Absorption Spectroscopy UV-vis Absorption,
Infra Red Spectroscopy
 CH 2252 Instrumental Methods of Analysis Unit I Infra Red Spectroscopy M. Subramanian Assistant Professor Department of Chemical Engineering Sri Sivasubramaniya Nadar College of Engineering Kalavakkam
CHEM*3440. Photon Energy Units. Spectrum of Electromagnetic Radiation. Chemical Instrumentation. Spectroscopic Experimental Concept.
 Spectrum of Electromagnetic Radiation Electromagnetic radiation is light. Different energy light interacts with different motions in molecules. CHEM*344 Chemical Instrumentation Topic 7 Spectrometry Radiofrequency
PAPER No. 12: ORGANIC SPECTROSCOPY MODULE No. 4: Basic principles and Instrumentation for IR spectroscopy
 Subject Chemistry Paper No and Title Module No and Title Module Tag Paper 12: Organic Spectroscopy Module 4: Basic principles and Instrumentation for IR spectroscopy CHE_P12_M4_e-Text TABLE OF CONTENTS
FTIR Spectrometer. Basic Theory of Infrared Spectrometer. FTIR Spectrometer. FTIR Accessories
 FTIR Spectrometer Basic Theory of Infrared Spectrometer FTIR Spectrometer FTIR Accessories What is Infrared? Infrared radiation lies between the visible and microwave portions of the electromagnetic spectrum.
4. Molecular spectroscopy. Basel, 2008
 4. Molecular spectroscopy Basel, 008 4.4.5 Fluorescence radiation The excited molecule: - is subject to collisions with the surrounding molecules and gives up energy by decreasing the vibrational levels
Ultraviolet-Visible and Infrared Spectrophotometry
 Ultraviolet-Visible and Infrared Spectrophotometry Ahmad Aqel Ifseisi Assistant Professor of Analytical Chemistry College of Science, Department of Chemistry King Saud University P.O. Box 2455 Riyadh 11451
Ultraviolet-Visible and Infrared Spectrophotometry
 Ultraviolet-Visible and Infrared Spectrophotometry Ahmad Aqel Ifseisi Assistant Professor of Analytical Chemistry College of Science, Department of Chemistry King Saud University P.O. Box 2455 Riyadh 11451
6.05 Computational Raman Spectroscopy
 2nd/3rd year Physical Chemistry Practical Course, Oxford University 6.05 Computational Raman Spectroscopy (5 points) Raman spectra are obtained by irradiating a sample with very intense monochromatic radiation,
Infrared And Raman Spectra Of Inorganic And Coordination Compounds Applications In Coordination Or
 Infrared And Raman Spectra Of Inorganic And Coordination Compounds Applications In Coordination Or We have made it easy for you to find a PDF Ebooks without any digging. And by having access to our ebooks
Spectral Resolution. Spectral resolution is a measure of the ability to separate nearby features in wavelength space.
 Spectral Resolution Spectral resolution is a measure of the ability to separate nearby features in wavelength space. R, minimum wavelength separation of two resolved features. Delta lambda often set to
Spectroscopy in Transmission
 Spectroscopy in Transmission + Reflectance UV/VIS - NIR Absorption spectra of solids and liquids can be measured with the desktop spectrograph Lambda 9. Extinctions up to in a wavelength range from UV
All measurement has a limit of precision and accuracy, and this must be taken into account when evaluating experimental results.
 Chapter 11: Measurement and data processing and analysis 11.1 Uncertainty and error in measurement and results All measurement has a limit of precision and accuracy, and this must be taken into account
Abstract... I. Acknowledgements... III. Table of Content... V. List of Tables... VIII. List of Figures... IX
 Abstract... I Acknowledgements... III Table of Content... V List of Tables... VIII List of Figures... IX Chapter One IR-VUV Photoionization Spectroscopy 1.1 Introduction... 1 1.2 Vacuum-Ultraviolet-Ionization
PAPER No. : 8 (PHYSICAL SPECTROSCOPY) MODULE No. : 5 (TRANSITION PROBABILITIES AND TRANSITION DIPOLE MOMENT. OVERVIEW OF SELECTION RULES)
 MODULE No. : 5 (TRANSITION PROBABILITIES AND TRANSITION DIPOLE MOMENT. OVERVIEW OF SELECTION RULES)") Subject Chemistry Paper No and Title Module No and Title Module Tag 8 and Physical Spectroscopy 5 and Transition probabilities and transition dipole moment, Overview of selection rules CHE_P8_M5 TABLE
Subject Chemistry Paper No and Title Module No and Title Module Tag 8 and Physical Spectroscopy 5 and Transition probabilities and transition dipole moment, Overview of selection rules CHE_P8_M5 TABLE
Supplementary Information for. Vibrational Spectroscopy at Electrolyte Electrode Interfaces with Graphene Gratings
 Supplementary Information for Vibrational Spectroscopy at Electrolyte Electrode Interfaces with Graphene Gratings Supplementary Figure 1. Simulated from pristine graphene gratings at different Fermi energy
Vibrational states of molecules. Diatomic molecules Polyatomic molecules
 Vibrational states of molecules Diatomic molecules Polyatomic molecules Diatomic molecules V v 1 v 0 Re Q Birge-Sponer plot The solution of the Schrödinger equation can be solved analytically for the
CHM Physical Chemistry II Chapter 12 - Supplementary Material. 1. Einstein A and B coefficients
 CHM 3411 - Physical Chemistry II Chapter 12 - Supplementary Material 1. Einstein A and B coefficients Consider two singly degenerate states in an atom, molecule, or ion, with wavefunctions 1 (for the lower
Absorption and scattering
 Absorption and scattering When a beam of radiation goes through the atmosphere, it encounters gas molecules, aerosols, cloud droplets, and ice crystals. These objects perturb the radiation field. Part
Analytical Chemistry II
 Analytical Chemistry II L4: Signal processing (selected slides) Computers in analytical chemistry Data acquisition Printing final results Data processing Data storage Graphical display https://www.creativecontrast.com/formal-revolution-of-computer.html
Lecture 3: Light absorbance
 Lecture 3: Light absorbance Perturbation Response 1 Light in Chemistry Light Response 0-3 Absorbance spectrum of benzene 2 Absorption Visible Light in Chemistry S 2 S 1 Fluorescence http://www.microscopyu.com
Vibrations. Matti Hotokka
 Vibrations Matti Hotokka Identify the stuff I ve seen this spectrum before. I know what the stuff is Identify the stuff Let s check the bands Film: Polymer Aromatic C-H Aliphatic C-H Group for monosubstituted
24 Introduction to Spectrochemical Methods
 24 Introduction to Spectrochemical Methods Spectroscopic method: based on measurement of the electromagnetic radiation produced or absorbed by analytes. electromagnetic radiation: include γ-ray, X-ray,
Physical Chemistry Laboratory II (CHEM 337) EXPT 9 3: Vibronic Spectrum of Iodine (I2)
 EXPT 9 3: Vibronic Spectrum of Iodine (I2)") Physical Chemistry Laboratory II (CHEM 337) EXPT 9 3: Vibronic Spectrum of Iodine (I2) Obtaining fundamental information about the nature of molecular structure is one of the interesting aspects of molecular
Physical Chemistry Laboratory II (CHEM 337) EXPT 9 3: Vibronic Spectrum of Iodine (I2) Obtaining fundamental information about the nature of molecular structure is one of the interesting aspects of molecular
1 Which of the following cannot be used to detect alcohol in a breathalyser test? Fractional distillation. Fuel cell. Infrared spectroscopy
 1 Which of the following cannot be used to detect alcohol in a breathalyser test? Fractional distillation Fuel cell Infrared spectroscopy Reduction of dichromate(vi) ions 2 Propanal, H 3 H 2 HO, and propanone,
Chapter 4 Ultraviolet and visible spectroscopy Molecular Spectrophotometry
 Chapter 4 Ultraviolet and visible spectroscopy Molecular Spectrophotometry Properties of light Electromagnetic radiation and electromagnetic spectrum Absorption of light Beer s law Limitation of Beer s
Physical Chemistry II Exam 2 Solutions
 Chemistry 362 Spring 2017 Dr Jean M Standard March 10, 2017 Name KEY Physical Chemistry II Exam 2 Solutions 1) (14 points) Use the potential energy and momentum operators for the harmonic oscillator to
Spectroscopy. Page 1 of 8 L.Pillay (2012)
") Spectroscopy Electromagnetic radiation is widely used in analytical chemistry. The identification and quantification of samples using electromagnetic radiation (light) is called spectroscopy. Light has
Spectroscopy Electromagnetic radiation is widely used in analytical chemistry. The identification and quantification of samples using electromagnetic radiation (light) is called spectroscopy. Light has
Infrared Spectroscopy
 Infrared Spectroscopy The Interaction of Light with Matter Electric fields apply forces to charges, according to F = qe In an electric field, a positive charge will experience a force, but a negative charge
BioMolecular Optical Spectroscopy:
 BioMolecular Optical Spectroscopy: Part 1: Infrared and Raman Vibrational Spectra Background Special Lectures for Chem 344 Fall, 2007 im Keiderling University of Illinois at Chicago tak@uic.edu Vibrational
Introduction to Molecular Vibrations and Infrared Spectroscopy
 hemistry 362 Spring 2017 Dr. Jean M. Standard February 15, 2017 Introduction to Molecular Vibrations and Infrared Spectroscopy Vibrational Modes For a molecule with N atoms, the number of vibrational modes