Putting Near-Infrared Spectroscopy (NIR) in the spotlight. 13. May 2006
|
|
|
- Damian Terry
- 6 years ago
- Views:
Transcription
 in the spotlight 13.")
1 Putting Near-Infrared Spectroscopy (NIR) in the spotlight 13. May
2 Outline What is NIR good for? A bit of history and basic theory Applications in Pharmaceutical industry Development Quantitative prediction models 1


3 What is NIR good for? Agriculture / Food Pharmaceutical industry Paper industry Medical devices NIR Oil / Petrochemicals 2
4 Attributes of NIR Spectroscopy Fast Results (quantitative, qualitative) immediately available No sample preparation required Non-destructive Measurements possible direct through glass Fibre optic cables can be used Good signal to noise ratio is achieved 3
 Temperature highest above the visible red light 4")
5 History / Theory The Herschel experiment Sir Frederick William Herschel with his prism (Science Museum London) Temperature highest above the visible red light 4

6 The Electromagnetic Spectrum Radio waves Microwaves Far IR Mid IR Vacuum UV X-Rays Gamma Rays Near-IR Visible UV nm nm nm 5

7 NIR sources and detectors! Emission of a tungsten light bulb 6
8 Basics of Vibrational Spectroscopy Continuous bending / stretching Frequency depends on the mass of molecules position in molecule strength of the bond Organic molecules show absorption in NIR 7
9 Basics of Vibrational Spectroscopy Incoming photon H amplitude H amplitude C C When a photon with a certain energy hits a bond, it is absorbed, and the size (amplitude) of the motion increases. 8

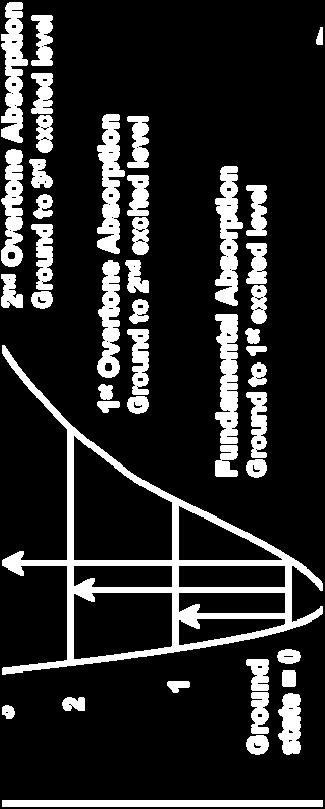
10 Anharmonic Oscillator C H \/\/\/\/\/\/\/\/\/\/\/\/\/\/\/\/\ 9


11 Relative Intensities of Infrared Bands NIR intensity weaker then IR No dilution required 10
12 NIR absorptions The bond must have charge separation (dipole moment) The intensity of absorption depends on the degree of anharmonicity Hydrogen is the lightest atom and will vibrate with the largest amplitude in stretching Strong absorption where hydrogen is bonded to another atom: C-H N-H O-H Absorbance Units Wavenumber cm
13 When Light Interacts with Solid Matter Absorption Specular Transmittance Reflectance Diffuse Reflectance 12

14 Example of NIR spectrometer 13
15 NIR Methods of Tablet Analysis Reflectance Surface Measurement Small Portion of Sample Analysed Sensitive to physical properties E.g. Powders, tablet coating Transmission large portion of sample analysed Good for tablet content analysis 14
16 Effect of Particle Size Long pathlength Short pathlength Absorbance Coarse particle size Fine particle size Wavelength 15


17 Standard Normal Variate (SNV) Contains physical and chemical information Particle size and density difference will be seen as baseline offsets. The effects of physical properties can be removed Effect of normalisation on physical differences 16
18 Case studies Tablet content determination Dissolution prediction Blend monitoring Mapping / Imaging 17
19 Tablet Content determination Tablets with % label claim manufactured 5 batches of 150 mg tablets used Tablets measured in transmission over 10 days All tablets analysed by HPLC for Content Uniformity Absorbance U nits % %

20 PLS result: comparison of HPLC vs. NIR 19

21 Dissolution testing by NIR Release profile of formulation dependant on coat thickness Samples with different coat thickness scanned by NIR and then analysed by conventional dissolution test. (Note that 1 dissolution run takes 18 hours) 20

22 On-line blend monitoring Blending process NIR attached 1 spectra per revolution Typical rapid improvements in blend homogeneity Blending generally complete at about the same time but well before the end of the nominal blend time! 21

23 Chemical Imaging: NIR spectroscopy NIR map of tablet 2 x 2 mm 2 API Excipient 1 Excipient 2 22
24 Conclusions NIR is a very versatile analytical tool fast, non-destructive suitable for on-line control applications Potential for real-time release 23
25 Acknowledgements Simon Maris Rachel Brody Slobodan Sasic Ian Clegg Elanor Wood 24
26 Backup slides How to develop a quantitative NIR calibration method NIR calibration model different from other analytical techniques Not a primary measurement system Requires training with results from primary measurement method (e.g. HPLC, KF) Requires chemometrics to extract information Prework required (for a feasibility study) Scan ingredients of matrix if available Scan small number of samples of product (e.g. 10) Spike samples if possible to check linearity Determine analytical wavelengths Optimise sample presentation

27 Choice of Samples Good choice of samples is essential for a robust calibration model Badly chosen sample sets will produce non-robust calibrations Samples in the calibration set should represent all the normal and expected variations in the product. The range of constituents must be uniformly distributed 26
28 Variability / number of calibration samples The number of calibration samples should be based on the complexity of the matrix to be analysed. For complex matrices a minimum of 50 samples is recommended These variations should be included in the calibration set (these are very important otherwise the method will not be robust): Range and distribution of constituent values Origin/composition of the samples Sample preparation/texture Presentation of the sample to the instrument 27
29 Reference Analysis Based on good laboratory practice and a proven methodology NIR calibrations will inherit the error of the reference method The NIR method cannot have a smaller standard error than the reference method 28
30 Chemometrics - Partial Least Squares Partial Least Squares is a multivariate correlation technique The reference value is assigned to the NIR spectra Spectra containing higher constituent concentrations are weighted more heavily than those with low concentrations Because the entire spectrum (or spectral blocks) are used, a large number of wavelengths are averaged into the calibrations. Thus PLS models matrix effects as well as changes in concentration of the constituents of interest 29
31 Partial Least Squares In all cases, choice of wavelength regions should be justified based upon scientific knowledge of the sample matrix and examination of the sample spectra Included regions must be specific to the analyte The primary reasons for exclusion are typically noise or regions sensitive to moisture changes. The general rule is to use a minimum number of Factors 30
32 Chemometrics: Principal Component Analysis Spectrum consists of e.g wavelengths (variables) Chemometrics such as Principal component analysis required to reduce the important information to a few scores and loadings One spectra becomes one data point in a multi dimensional space 8000 W avenumber cm
33 Principal component analysis of NIR data PC2 Grouping of material with similar properties Scores Lactose LactoseSV003 SV LactoseSV003 LactoseSV LactoseSV Lactose Lactose SV008 LactoseSV003 SV LactoseSV003 Lactose LactoseSV003 SV008 SV008 LactoseSV Respitose ML005 SV Respitose ML005 Lactohale Respitose ML005 Lactose SV008 Respitose ML005 Lactohale Lactohale Lactohale Lactohale Respitose ML005 Lactohale Lactose SV008 Respitose ML005 Lactose SV003 Lactose SV003 Lactose SV003 Lactose Lactose SV003 SV003 Lactose SV003 Lactose SV003 Granulac 70 Granulac 70 Granulac 70 Granulac Granulac Granulac 70 Granulac Granulac RESULT2, X-expl: 98%,2% PC1 32
Spectroscopic techniques: why, when, where,and how Dr. Roberto GIANGIACOMO
 Spectroscopic techniques: why, when, where,and how Dr. Roberto GIANGIACOMO BASIC INFORMATION Spectroscopy uses light to analyze substances or products by describing the energy transfer between light and
Infrared Spectroscopy
 Infrared Spectroscopy Introduction Spectroscopy is an analytical technique which helps determine structure. It destroys little or no sample. The amount of light absorbed by the sample is measured as wavelength
What happens when light falls on a material? Transmission Reflection Absorption Luminescence. Elastic Scattering Inelastic Scattering
 Raman Spectroscopy What happens when light falls on a material? Transmission Reflection Absorption Luminescence Elastic Scattering Inelastic Scattering Raman, Fluorescence and IR Scattering Absorption
PTG-NIR Powder Characterisation System (not yet released for selling to end users)
") Powder Characterisation System - PTG-NIR PTG-NIR Powder Characterisation System (not yet released for selling to end users) The PTG-NIR automatic powder and granule inspection system with integrated NIR
Powder Characterisation System - PTG-NIR PTG-NIR Powder Characterisation System (not yet released for selling to end users) The PTG-NIR automatic powder and granule inspection system with integrated NIR
FTIR Spectrometer. Basic Theory of Infrared Spectrometer. FTIR Spectrometer. FTIR Accessories
 FTIR Spectrometer Basic Theory of Infrared Spectrometer FTIR Spectrometer FTIR Accessories What is Infrared? Infrared radiation lies between the visible and microwave portions of the electromagnetic spectrum.
Molecular Spectroscopy In The Study of Wood & Biomass
 Molecular Spectroscopy In The Study of Wood & Biomass Society of Wood Science and Technology 50th Annual Convention Knoxville, Tennessee June 10, 2007 Timothy G. Rials Forest Products Center The University
Skoog Chapter 6 Introduction to Spectrometric Methods
 Skoog Chapter 6 Introduction to Spectrometric Methods General Properties of Electromagnetic Radiation (EM) Wave Properties of EM Quantum Mechanical Properties of EM Quantitative Aspects of Spectrochemical
2.01 INFRARED ANALYZER
 NIR INFORMATION PAGE 1 OF 5 What does it do? First, it allows for better control and knowledge of incoming ingredients. If the ability exists to analyze a truck or rail car immediately upon arrival, the
Spectroscopy in Inorganic Chemistry. Vibration and Rotation Spectroscopy
 Spectroscopy in Inorganic Chemistry Symmetry requirement for coupling combination bands and Fermi resonance 2 3 V 3 1505 cm -1 (R, IR) E' stretches v 1 888 cm -1 (R) A 1 ' stretch V 2 718 cm -1 (IR) A
INTERNATIONAL JOURNAL OF PURE AND APPLIED RESEARCH IN ENGINEERING AND TECHNOLOGY
 INTERNATIONAL JOURNAL OF PURE AND APPLIED RESEARCH IN ENGINEERING AND TECHNOLOGY A PATH FOR HORIZING YOUR INNOVATIVE WORK SOIL NITROGEN DETECTION USING NEAR INFRARED SPECTROSCOPY SNEHA J. BANSOD Department
Analysis of Cocoa Butter Using the SpectraStar 2400 NIR Spectrometer
 Application Note: F04 Analysis of Cocoa Butter Using the SpectraStar 2400 NIR Spectrometer Introduction Near-infrared (NIR) technology has been used in the food, feed, and agriculture industries for over
Spectroscopy in Transmission
 Spectroscopy in Transmission + Reflectance UV/VIS - NIR Absorption spectra of solids and liquids can be measured with the desktop spectrograph Lambda 9. Extinctions up to in a wavelength range from UV
To Hy-Ternity and beyond. Boris Larchevêque, INDATECH
 To Hy-Ternity and beyond Boris Larchevêque, INDATECH Hello! Are you still thinking that a lonely spectrum can make you see how beautiful we are? A 25 minutes talk Introduction to SRS Industrial point of
Application of Raman Spectroscopy for Noninvasive Detection of Target Compounds. Kyung-Min Lee
 Application of Raman Spectroscopy for Noninvasive Detection of Target Compounds Kyung-Min Lee Office of the Texas State Chemist, Texas AgriLife Research January 24, 2012 OTSC Seminar OFFICE OF THE TEXAS
NIRS Getting started. US Dairy Forage Research Center 2004 Consortium Annual Meeting
 NIRS Getting started US Dairy Forage Research Center 2004 Consortium Annual Meeting Terminology NIR = Near Infrared or NIR = Near Infrared Reflectance NIT = Near Infrared Transmittance History 1800 The
Analysis of NIR spectroscopy data for blend uniformity using semi-nonnegative Matrix Factorization
 Analysis of NIR spectroscopy data for blend uniformity using seminonnegative Matrix Factorization Nicolas Sauwen 1, Adriaan Blommaert 1, Tatsiana Khamiakova 2, Michel Thiel 2, Jan Dijkmans 2, Ana Tavares
Introduction to Electromagnetic Radiation and Radiative Transfer
 Introduction to Electromagnetic Radiation and Radiative Transfer Temperature Dice Results Visible light, infrared (IR), ultraviolet (UV), X-rays, γ-rays, microwaves, and radio are all forms of electromagnetic
Whole Tablet Measurements Using the Frontier Tablet Autosampler System
 a p p l i c a t i o n N O T E Whole Tablet Measurements Using the Frontier Tablet Autosampler System FT-NIR Spectroscopy Introduction Recent advances in NIR technology have changed the ways in which both
Chapter 12 Mass Spectrometry and Infrared Spectroscopy
 Organic Chemistry, 6 th Edition L. G. Wade, Jr. Chapter 12 Mass Spectrometry and Infrared Spectroscopy Jo Blackburn Richland College, Dallas, TX Dallas County Community College District 2006, Prentice
Because light behaves like a wave, we can describe it in one of two ways by its wavelength or by its frequency.
 Light We can use different terms to describe light: Color Wavelength Frequency Light is composed of electromagnetic waves that travel through some medium. The properties of the medium determine how light
CHEM6416 Theory of Molecular Spectroscopy 2013Jan Spectroscopy frequency dependence of the interaction of light with matter
 CHEM6416 Theory of Molecular Spectroscopy 2013Jan22 1 1. Spectroscopy frequency dependence of the interaction of light with matter 1.1. Absorption (excitation), emission, diffraction, scattering, refraction
Absorption photometry
 The light Absorption photometry Szilvia Barkó University of Pécs, Faculty of Medicines, Dept. Biophysics February 2011 Transversal wave E Electromagnetic wave electric gradient vector wavelength The dual
SPECTROSCOPY Basic concepts part 1
 SPECTROSCOPY Basic concepts part 1 Spectroscopy is the science of spectra, i.e. it involves a measurement of a property that is a function of the frequency of the light Umeå 2006-04-10 Bo Karlberg Light
Lecture 0. NC State University
 Chemistry 736 Lecture 0 Overview NC State University Overview of Spectroscopy Electronic states and energies Transitions between states Absorption and emission Electronic spectroscopy Instrumentation Concepts
Fourier Transform IR Spectroscopy
 Fourier Transform IR Spectroscopy Absorption peaks in an infrared absorption spectrum arise from molecular vibrations Absorbed energy causes molecular motions which create a net change in the dipole moment.
Whole Tablet Measurements Using the Spectrum One NTS Tablet Autosampler System
 Whole Tablet Measurements Using the Spectrum One NTS Tablet Autosampler System A P P L I C A T I O N N O T E Introduction Recent advances in NIR technology have changed the ways in which both the pharmaceutical
Infrared Spectroscopy: Identification of Unknown Substances
 Infrared Spectroscopy: Identification of Unknown Substances Suppose a white powder is one of the four following molecules. How can they be differentiated? H N N H H H H Na H H H H H A technique that is
Detection of trace contamination on metal surfaces using the handheld Agilent 4100 ExoScan FTIR
 Detection of trace contamination on metal surfaces using the handheld Agilent 4100 ExoScan FTIR Ensuring ultimate cleanliness for maximum adhesion Application Note Author John Seelenbinder Agilent Technologies,
Applications of Terahertz Radiation (T-ray) Yao-Chang Lee, National Synchrotron Research Radiation Center
 Yao-Chang Lee, National Synchrotron Research Radiation Center") Applications of Terahertz Radiation (T-ray) Yao-Chang Lee, yclee@nsrrc.org.tw National Synchrotron Research Radiation Center Outline Terahertz radiation (THz) or T-ray The Interaction between T-ray and
Applications of Terahertz Radiation (T-ray) Yao-Chang Lee, yclee@nsrrc.org.tw National Synchrotron Research Radiation Center Outline Terahertz radiation (THz) or T-ray The Interaction between T-ray and
Chemistry 213 Practical Spectroscopy
 Chemistry 213 Practical Spectroscopy Dave Berg djberg@uvic.ca Elliott 314 A course in determining structure by spectroscopic methods Different types of spectroscopy afford different information about molecules
Introduction. The analysis of the outcome of a reaction requires that we know the full structure of the products as well as the reactants
 Introduction The analysis of the outcome of a reaction requires that we know the full structure of the products as well as the reactants Spectroscopy and the Electromagnetic Spectrum Unlike mass spectrometry,
2. Infrared spectroscopy
 2. Infrared spectroscopy 2-1Theoretical principles An important tool of the organic chemist is Infrared Spectroscopy, or IR. IR spectra are acquired on a special instrument, called an IR spectrometer.
The Electromagnetic Spectrum
 The Electromagnetic Spectrum 1 of 19 Boardworks Ltd 2016 The Electromagnetic Spectrum 2 of 19 Boardworks Ltd 2016 Detecting waves beyond the visible spectrum 3 of 19 Boardworks Ltd 2016 Invisible light
Reflection = EM strikes a boundary between two media differing in η and bounces back
 Reflection = EM strikes a boundary between two media differing in η and bounces back Incident ray θ 1 θ 2 Reflected ray Medium 1 (air) η = 1.00 Medium 2 (glass) η = 1.50 Specular reflection = situation
Homework Due by 5PM September 20 (next class) Does everyone have a topic that has been approved by the faculty?
 Does everyone have a topic that has been approved by the faculty?") Howdy Folks. Homework Due by 5PM September 20 (next class) 5-Problems Every Week due 1 week later. Does everyone have a topic that has been approved by the faculty? Practice your presentation as I will
Howdy Folks. Homework Due by 5PM September 20 (next class) 5-Problems Every Week due 1 week later. Does everyone have a topic that has been approved by the faculty? Practice your presentation as I will
Advanced Spectroscopy Laboratory
 Advanced Spectroscopy Laboratory - Raman Spectroscopy - Emission Spectroscopy - Absorption Spectroscopy - Raman Microscopy - Hyperspectral Imaging Spectroscopy FERGIELAB TM Raman Spectroscopy Absorption
Vibrational Spectroscopies. C-874 University of Delaware
 Vibrational Spectroscopies C-874 University of Delaware Vibrational Spectroscopies..everything that living things do can be understood in terms of the jigglings and wigglings of atoms.. R. P. Feymann Vibrational
CHE 325 SPECTROSCOPY (A) CHAP 13A ASSIGN CH 2 CH CH 2 CH CHCH 3
 CHAP 13A ASSIGN CH 2 CH CH 2 CH CHCH 3") CE 325 SPECTRSCPY (A) CAP 13A ASSIGN 1. Which compound would have a UV absorption band at longest wavelength? A. I B. II C. III D. IV E. V C CC 3 CC C 2 C CC 3 I II III C 2 C C 2 C CC 3 IV V 2. Select
CE 325 SPECTRSCPY (A) CAP 13A ASSIGN 1. Which compound would have a UV absorption band at longest wavelength? A. I B. II C. III D. IV E. V C CC 3 CC C 2 C CC 3 I II III C 2 C C 2 C CC 3 IV V 2. Select
The Fundamentals of Spectroscopy: Theory BUILDING BETTER SCIENCE AGILENT AND YOU
 The Fundamentals of Spectroscopy: Theory BUILDING BETTER SCIENCE AGILENT AND YOU 1 Agilent is committed to the educational community and is willing to provide access to company-owned material. This slide
23 Near-infrared spectroscopy
 23 Near-infrared spectroscopy R D Jee Introduction The near-infrared (NIR) region of the electromagnetic spectrum extends from about 780 to 2500 nm (or 12800 to 4000 cm 71 ). It is therefore the part of
Modern Techniques in Applied Molecular Spectroscopy
 Modern Techniques in Applied Molecular Spectroscopy Edited by FRANCIS M. MIRABELLA Equistar Chemicals, LP A Wiley-Interscience Publication JOHN WILEY & SONS, INC. New York Chichester Weinheim Brisbane
1 WHAT IS SPECTROSCOPY?
 1 WHAT IS SPECTROSCOPY? 1.1 The Nature Of Electromagnetic Radiation Anyone who has been sunburnt will know that light packs a punch: in scientific terms, it contains considerable amounts of energy. All
Chem 321 Lecture 18 - Spectrophotometry 10/31/13
 Student Learning Objectives Chem 321 Lecture 18 - Spectrophotometry 10/31/13 In the lab you will use spectrophotometric techniques to determine the amount of iron, calcium and magnesium in unknowns. Although
VIBRATION-ROTATION SPECTRUM OF CO
 Rice University Physics 332 VIBRATION-ROTATION SPECTRUM OF CO I. INTRODUCTION...2 II. THEORETICAL CONSIDERATIONS...3 III. MEASUREMENTS...8 IV. ANALYSIS...9 April 2011 I. Introduction Optical spectroscopy
Chemistry 2. Assumed knowledge
 Chemistry 2 Lecture 8 IR Spectroscopy of Polyatomic Molecles Assumed knowledge There are 3N 6 vibrations in a non linear molecule and 3N 5 vibrations in a linear molecule. Only modes that lead to a change
Frequency: the number of complete waves that pass a point in a given time. It has the symbol f. 1) SI Units: Hertz (Hz) Wavelength: The length from
 SI Units: Hertz (Hz) Wavelength: The length from") Frequency: the number of complete waves that pass a point in a given time. It has the symbol f. 1) SI Units: Hertz (Hz) Wavelength: The length from the one crest of a wave to the next. I. Electromagnetic
Frequency: the number of complete waves that pass a point in a given time. It has the symbol f. 1) SI Units: Hertz (Hz) Wavelength: The length from the one crest of a wave to the next. I. Electromagnetic
Demonstrating the Value of Data Fusion
 Demonstrating the Value of Data Fusion Thomas I. Dearing 1 Wesley Thompson and Brian Marquardt 1 Carl Rechsteiner Jr. 2 1. Applied Physics Labs, University of Washington 2. Chevron Energy Technology, Richmond
Background: The Electromagnetic Spectrum
 Background: The Electromagnetic Spectrum Wavelength (λ) in meters wavelength decreasing 10 4 10 2 10 0 10-2 10-4 10-6 10-8 10-10 10-12 10-14 microwaves ultraviolet Gamma rays Radio waves AM 10 4 Shortwave
The Nature of Light. We have a dual model
 Light and Atoms Properties of Light We can come to understand the composition of distant bodies by analyzing the light they emit This analysis can tell us about the composition as well as the temperature
Ultraviolet-Visible and Infrared Spectrophotometry
 Ultraviolet-Visible and Infrared Spectrophotometry Ahmad Aqel Ifseisi Assistant Professor of Analytical Chemistry College of Science, Department of Chemistry King Saud University P.O. Box 2455 Riyadh 11451
Spectroscopy. Page 1 of 8 L.Pillay (2012)
") Spectroscopy Electromagnetic radiation is widely used in analytical chemistry. The identification and quantification of samples using electromagnetic radiation (light) is called spectroscopy. Light has
Spectroscopy Electromagnetic radiation is widely used in analytical chemistry. The identification and quantification of samples using electromagnetic radiation (light) is called spectroscopy. Light has
Ultraviolet-Visible and Infrared Spectrophotometry
 Ultraviolet-Visible and Infrared Spectrophotometry Ahmad Aqel Ifseisi Assistant Professor of Analytical Chemistry College of Science, Department of Chemistry King Saud University P.O. Box 2455 Riyadh 11451
Verification of Pharmaceutical Raw Materials Using the Spectrum Two N FT-NIR Spectrometer
 APPLICATION NOTE FT-NIR Spectroscopy Authors: Ian Robertson Jerry Sellors PerkinElmer, Inc. Seer Green, UK Verification of Pharmaceutical Raw Materials Using the Spectrum Two N FT-NIR Spectrometer Introduction
Application of IR Raman Spectroscopy
 Application of IR Raman Spectroscopy 3 IR regions Structure and Functional Group Absorption IR Reflection IR Photoacoustic IR IR Emission Micro 10-1 Mid-IR Mid-IR absorption Samples Placed in cell (salt)
Taking fingerprints of stars, galaxies, and interstellar gas clouds
 - - Taking fingerprints of stars, galaxies, and interstellar gas clouds Absorption and emission from atoms, ions, and molecules Periodic Table of Elements The universe is mostly hydrogen H and helium He
Reference Standards Page 156 For calibrating your spectrometer. PIKECalc Page 159 For FTIR sampling computations
 Standards, Software, Databases We strive to provide you with useful sampling tools for spectroscopy and offer these additional products and information to serve your laboratory requirements. If you have
高等食品分析 (Advanced Food Analysis) I. SPECTROSCOPIC METHODS *Instrumental methods: 1. Spectroscopic methods (spectroscopy): a) Electromagnetic radiation
 I. SPECTROSCOPIC METHODS *Instrumental methods: 1. Spectroscopic methods (spectroscopy): a) Electromagnetic radiation") *Instrumental methods: 1. Spectroscopic methods (spectroscopy): a) Electromagnetic radiation (EMR): γ-ray emission X-Ray absorption, emission, fluorescence and diffraction Vacuum ultraviolet (UV) absorption
*Instrumental methods: 1. Spectroscopic methods (spectroscopy): a) Electromagnetic radiation (EMR): γ-ray emission X-Ray absorption, emission, fluorescence and diffraction Vacuum ultraviolet (UV) absorption
Questions on Instrumental Methods of Analysis
 Questions on Instrumental Methods of Analysis 1. Which one of the following techniques can be used for the detection in a liquid chromatograph? a. Ultraviolet absorbance or refractive index measurement.
Preface to the Second Edition. Preface to the First Edition
 Contents Preface to the Second Edition Preface to the First Edition iii v 1 Introduction 1 1.1 Relevance for Climate and Weather........... 1 1.1.1 Solar Radiation.................. 2 1.1.2 Thermal Infrared
Properties of Electromagnetic Radiation Chapter 5. What is light? What is a wave? Radiation carries information
 Concepts: Properties of Electromagnetic Radiation Chapter 5 Electromagnetic waves Types of spectra Temperature Blackbody radiation Dual nature of radiation Atomic structure Interaction of light and matter
Taking Fingerprints of Stars, Galaxies, and Other Stuff. The Bohr Atom. The Bohr Atom Model of Hydrogen atom. Bohr Atom. Bohr Atom
 Periodic Table of Elements Taking Fingerprints of Stars, Galaxies, and Other Stuff Absorption and Emission from Atoms, Ions, and Molecules Universe is mostly (97%) Hydrogen and Helium (H and He) The ONLY
SPECTROPHOTOMETRY AND SPECTROMETRY - CONCEPT AND APPLICATIONS
 SPECTROPHOTOMETRY AND SPECTROMETRY - CONCEPT AND APPLICATIONS Renjini A 1, Dani Dileep 2 1 Assistant Professor, Department of ECE, Rajadhani Institute of Engineering and Technology, Kerala, India 2 PG
Taking fingerprints of stars, galaxies, and interstellar gas clouds. Absorption and emission from atoms, ions, and molecules
 Taking fingerprints of stars, galaxies, and interstellar gas clouds Absorption and emission from atoms, ions, and molecules 1 Periodic Table of Elements The universe is mostly hydrogen H and helium He
Water in Food 3 rd International Workshop. Water Analysis of Food Products with at-line and on-line FT-NIR Spectroscopy. Dr.
 Water in Food 3 rd International Workshop Water Analysis of Food Products with at-line and on-line FT-NIR Spectroscopy Dr. Andreas Niemöller Lausanne 29th 30th March 2004 Bruker Group Company Technology
PAPER No. 12: ORGANIC SPECTROSCOPY MODULE No. 7: Instrumentation for IR spectroscopy
 KNOW MORE Web links https://en.wikipedia.org/wiki/infrared_ http://hiq.lindegas.com/en/analytical_methods/infrared_/non_dispersive_infrared.html http://blamp.sites.truman.edu/files/2012/11/322-ir-and-ftir.pdf
Lecture 8. Assumed knowledge
 Chemistry 2 Lecture 8 IR Spectroscopy of Polyatomic Molecles Assumed knowledge There are 3N 6 vibrations in a non linear molecule and 3N 5 vibrations in a linear molecule. Only modes that lead to a change
Ch 7 Quantum Theory of the Atom (light and atomic structure)
") Ch 7 Quantum Theory of the Atom (light and atomic structure) Electromagnetic Radiation - Electromagnetic radiation consists of oscillations in electric and magnetic fields. The oscillations can be described
Ch 7 Quantum Theory of the Atom (light and atomic structure) Electromagnetic Radiation - Electromagnetic radiation consists of oscillations in electric and magnetic fields. The oscillations can be described
Infrared spectroscopy Basic theory
 Infrared spectroscopy Basic theory Dr. Davide Ferri Paul Scherrer Institut 056 310 27 81 davide.ferri@psi.ch Importance of IR spectroscopy in catalysis IR Raman NMR XAFS UV-Vis EPR 0 200 400 600 800 1000
The Structure of the Atom
 CHAPTER 5 The Structure of the Atom 5.4 Light and Spectroscopy 460 370 BC 1808 1870 1897 1910 1925 Today Democritus Atomism Dalton Modern atomic theory Crookes Cathode rays Thomson Discovery of the electron
Spectroscopy. Fourier Transform Infrared (FT-IR) Spectroscopy
 Spectroscopy") Fourier Transform Infrared (FT-IR) Spectroscopy Learning objectives Learning outcomes After completing this course, the student will be able to: Recognize the concept and principle of FT-IR Spectroscopy
Fourier Transform Infrared (FT-IR) Spectroscopy Learning objectives Learning outcomes After completing this course, the student will be able to: Recognize the concept and principle of FT-IR Spectroscopy
R O Y G B V. Spin States. Outer Shell Electrons. Molecular Rotations. Inner Shell Electrons. Molecular Vibrations. Nuclear Transitions
 Spin States Molecular Rotations Molecular Vibrations Outer Shell Electrons Inner Shell Electrons Nuclear Transitions NMR EPR Microwave Absorption Spectroscopy Infrared Absorption Spectroscopy UV-vis Absorption,
Absorption spectrometry summary
 Absorption spectrometry summary Rehearsal: Properties of light (electromagnetic radiation), dual nature light matter interactions (reflection, transmission, absorption, scattering) Absorption phenomena,
Lecture 3: Light absorbance
 Lecture 3: Light absorbance Perturbation Response 1 Light in Chemistry Light Response 0-3 Absorbance spectrum of benzene 2 Absorption Visible Light in Chemistry S 2 S 1 Fluorescence http://www.microscopyu.com
William H. Brown & Christopher S. Foote
 Requests for permission to make copies of any part of the work should be mailed to:permissions Department, Harcourt Brace & Company, 6277 Sea Harbor Drive, Orlando, Florida 32887-6777 William H. Brown
Infrared spectroscopy. Siriphorn Laomanacharoen Bureau of Drug and Narcotic Department of Medical Sciences 2 March 2012
 Siriphorn Laomanacharoen Bureau of Drug and Narcotic Department of Medical Sciences 2 March 2012 1 Infrared region 2 Infrared region below red in the visible region at wavelengths between 2.5-25 µm more
Multivariate calibration
 Multivariate calibration What is calibration? Problems with traditional calibration - selectivity - precision 35 - diagnosis Multivariate calibration - many signals - multivariate space How to do it? observed
NPTEL/IITM. Molecular Spectroscopy Lectures 1 & 2. Prof.K. Mangala Sunder Page 1 of 15. Topics. Part I : Introductory concepts Topics
 Molecular Spectroscopy Lectures 1 & 2 Part I : Introductory concepts Topics Why spectroscopy? Introduction to electromagnetic radiation Interaction of radiation with matter What are spectra? Beer-Lambert
Information in Radio Waves
 Summative Assessment: Natural Sources of Radio Performance expectation: Develop and use a model of two objects interacting through electric or magnetic fields to illustrate the forces between objects and
Infrared Spectroscopy
 Reminder: These notes are meant to supplement, not replace, the laboratory manual. Infrared Spectroscopy History and Application: Infrared (IR) radiation is simply one segment of the electromagnetic spectrum
Unit title: Atomic and Nuclear Physics for Spectroscopic Applications
 Unit title: Atomic and Nuclear Physics for Spectroscopic Applications Unit code: Y/601/0417 QCF level: 4 Credit value: 15 Aim This unit provides an understanding of the underlying atomic and nuclear physics
van Quantum tot Molecuul
 10 HC10: Molecular and vibrational spectroscopy van Quantum tot Molecuul Dr Juan Rojo VU Amsterdam and Nikhef Theory Group http://www.juanrojo.com/ j.rojo@vu.nl Molecular and Vibrational Spectroscopy Based
Overview and comparison of portable spectroscopy techniques: FTIR, NIR and Raman
 Overview and comparison of portable spectroscopy techniques: FTIR, NIR and Raman By Dr Heather Murray, Analytik Keywords: vibrational spectroscopy, portable spectrometers, Mid-IR, FTIR, NIR, Raman Walk
CHM Physical Chemistry II Chapter 12 - Supplementary Material. 1. Einstein A and B coefficients
 CHM 3411 - Physical Chemistry II Chapter 12 - Supplementary Material 1. Einstein A and B coefficients Consider two singly degenerate states in an atom, molecule, or ion, with wavefunctions 1 (for the lower
Design and Development of a Smartphone Based Visible Spectrophotometer for Analytical Applications
 Design and Development of a Smartphone Based Visible Spectrophotometer for Analytical Applications Bedanta Kr. Deka, D. Thakuria, H. Bora and S. Banerjee # Department of Physicis, B. Borooah College, Ulubari,
Glossary. Analyte - the molecule of interest when performing a quantitative analysis.
 Glossary This glossary contains definitions of many important FTIR terms. Many of the terms listed here appeared in italics in the body of the book. Words that appear in italics in the glossary are defined
A56. Raman Spektroscopy. Jan Publisher: Institute of Physical Chemistry
 Physikalische-Chemisches Praktikum für Anfänger A56 Raman Spektroscopy Jan. 2017 Publisher: Institute of Physical Chemistry 1 Objectives 1. Take the Raman spectra of CO 2 (s), CS 2 (l), C 6 H 6 (l) and
IR Spectrography - Absorption. Raman Spectrography - Scattering. n 0 n M - Raman n 0 - Rayleigh
 RAMAN SPECTROSCOPY Scattering Mid-IR and NIR require absorption of radiation from a ground level to an excited state, requires matching of radiation from source with difference in energy states. Raman
Spectroscopy Primer. for ultraviolet and visible absorbance spectroscopy. by Stephanie Myers Summer 2015
 Spectroscopy Primer for ultraviolet and visible absorbance spectroscopy by Stephanie Myers Summer 2015 Abstract: An overview of uv vis absorbance spectroscopy including Beer s Law, calibration curves,
Infrared Spectroscopy An Instrumental Method for Detecting Functional Groups
 Infrared Spectroscopy An Instrumental Method for Detecting Functional Groups 1 The Electromagnetic Spectrum Infrared Spectroscopy I. Physics Review Frequency, υ (nu), is the number of wave cycles that
Radiant energy is proportional to its frequency (cycles/s = Hz) as a wave (Amplitude is its height) Different types are classified by frequency or
 as a wave (Amplitude is its height) Different types are classified by frequency or") CHEM 241 UNIT 5: PART B INFRA-RED RED SPECTROSCOPY 1 Spectroscopy of the Electromagnetic Spectrum Radiant energy is proportional to its frequency (cycles/s = Hz) as a wave (Amplitude is its height) Different
CHEM 241 UNIT 5: PART B INFRA-RED RED SPECTROSCOPY 1 Spectroscopy of the Electromagnetic Spectrum Radiant energy is proportional to its frequency (cycles/s = Hz) as a wave (Amplitude is its height) Different
Introduction to Fourier Transform Infrared Spectroscopy
 molecular spectroscopy Introduction to Fourier Transform Infrared Spectroscopy Part of Thermo Fisher Scientific Introduction What is FT-IR? FT-IR stands for Fourier Transform InfraRed, the preferred method
PC Laboratory Raman Spectroscopy
 PC Laboratory Raman Spectroscopy Schedule: Week of September 5-9: Student presentations Week of September 19-23:Student experiments Learning goals: (1) Hands-on experience with setting up a spectrometer.
7a. Structure Elucidation: IR and 13 C-NMR Spectroscopies (text , , 12.10)
") 2009, Department of Chemistry, The University of Western Ontario 7a.1 7a. Structure Elucidation: IR and 13 C-NMR Spectroscopies (text 11.1 11.5, 12.1 12.5, 12.10) A. Electromagnetic Radiation Energy is
2009, Department of Chemistry, The University of Western Ontario 7a.1 7a. Structure Elucidation: IR and 13 C-NMR Spectroscopies (text 11.1 11.5, 12.1 12.5, 12.10) A. Electromagnetic Radiation Energy is
A very brief history of the study of light
 1. Sir Isaac Newton 1672: A very brief history of the study of light Showed that the component colors of the visible portion of white light can be separated through a prism, which acts to bend the light
TECHNICAL DESCRIPTION SPECTRAFLOW ON LINE ANALYZER for BELT CONVEYOR APPLICATION
 TECHNICAL DESCRIPTION SPECTRAFLOW ON LINE ANALYZER for BELT CONVEYOR APPLICATION TECHNICAL SPECIFICATION SPECTRAFLOW ON LINE ANALYZER FOR BELT CONVEYOR CONTENTS 1. SpectraFlow Technical Description...
Chemistry Instrumental Analysis Lecture 15. Chem 4631
 Chemistry 4631 Instrumental Analysis Lecture 15 IR Instruments Types of Instrumentation Dispersive Spectrophotometers (gratings) Fourier transform spectrometers (interferometer) Single beam Double beam
Advanced Pharmaceutical Analysis
 Lecture 2 Advanced Pharmaceutical Analysis IR spectroscopy Dr. Baraa Ramzi Infrared Spectroscopy It is a powerful tool for identifying pure organic and inorganic compounds. Every molecular compound has
What is spectroscopy?
 Absorption Spectrum What is spectroscopy? Studying the properties of matter through its interaction with different frequency components of the electromagnetic spectrum. With light, you aren t looking directly
NIR Chemical Imaging as a Process Analytical Tool
 Manufacturing NIR Chemical Imaging as a Process Analytical Tool NIR chemical imaging greatly extends the capability of NIR spectroscopy, and is the only PAT-applicable blend monitoring technique that gives
CHEM Atomic and Molecular Spectroscopy
 CHEM 21112 Atomic and Molecular Spectroscopy References: 1. Fundamentals of Molecular Spectroscopy by C.N. Banwell 2. Physical Chemistry by P.W. Atkins Dr. Sujeewa De Silva Sub topics Light and matter