SPECTROSCOPY MEASURES THE INTERACTION BETWEEN LIGHT AND MATTER
|
|
|
- Constance Hensley
- 6 years ago
- Views:
Transcription
: wavelength (m) (nu): frequency (Hz) Increasing E (J) Increasing (Hz) E = h h - Planck s constant 6.")
 - need")

1 SPECTROSCOPY MEASURES THE INTERACTION BETWEEN LIGHT AND MATTER c = c: speed of light 3.00 x 10 8 m/s (lamda): wavelength (m) (nu): frequency (Hz) Increasing E (J) Increasing (Hz) E = h h - Planck s constant 6.62 x Js Increasing λ (m) Electronic transitions Ionization Bonds vibrate molecules rotate Nuclear spin Sample Preparation - in solution - must subtract the background (peaks arising from the solvent) - need matching sample (sample + solvent) and standard (solvent) cells - a thin film on NaCl plates Evaporate a drop of solution to give Liquid between two plates a solid film - in a mull a mixture of a solid in an oil must ignore the peaks of the oil (e.g., Nujol = a hydrocarbon) - in a KBr pellet - ATR ( Attenuated Total Reflection ) solid sample


2 Fourier transform IR IR source sample reference detector Free induction decay (FID) Spectrum 4000 wavenumber / cm Reference beam Wet sample: H O str. of H 2 O CO 2 and H 2 O in atmosphere not cancelled out by reference beam:
3 TO OBSERVE A BOND VIBRATION BY IR SPECTROSCOPY THERE MUST BE A CHANGE IN DIPOLE MOMENT UPON VIBRATION Nonpolar Bonds Polar Bonds + Nonpolar bonds in a symmetrical molecule absorb weakly or not at all e.g., R C C R Polar bonds are usually IR-active and show stronger peaks e.g., C=O Frequency of Fundamental Vibrations Hooke s Law: K: force constant U: reduced mass 4.12 Units for IR Electromagnetic Radiation for molecular vibrations Frequency, n = 1.25 x to 1.25 x Hz Wavelength, = 25 to 2.5 mm In order to correlate the wavelength with energy Define wavenumber, n = 1/ (in cm) = 400 to 4000 cm -1 where high numbers are a high energy and low numbers are low energy

4 Transmittance (%) 100 C C C N C=C C=N C=O C C C N C O 50 0 H C H N H O Wavenumber (cm -1 ) Fingerprint region Other vibrations Spectra include a number of other peaks. In addition to fundamental stretching and bending absorptions. Overtones: lower intensity vibration at an integral times the fundamental frequency n overtone = n n fundamental Combination bands: the sum of two interacting vibrational frequencies, but only certain combinations are allowed n combination = n 1 + n 2 Difference bands: similar to combination bands, but the difference of two interacting vibrations n difference = n 1 n 2 Fermi resonance: when a fundamental absorption couples with an overtone or combination band, most often observed for C=O

5 Selected infrared absorptions for bond stretches Functional Group Range cm -1 Intensity and shape Pavia sp 3 C H medium to strong; sharp sp 2 C H medium to strong; sharp spc H about 3300 medium to strong; sharp C C weak to medium; sharp C C weak to medium; sharp N H medium; broad O H (very dilute) about 3600 medium; sharp O H (H-bonded) strong; broad O H (carboxylic acid) medium; very broad C O medium to strong; sharp C O ~1700 very strong; sharp (see later) C N medium; sharp Pavia Appendix 1

6 Lecture organization C-H and C-C bonds O-H and N-H bonds C-O bonds C=O bonds C-N, C=N, C N bonds Textbook organization Hydrocarbons Pavia 2.10 Arenes Pavia 2.11 Alcohols and Phenols Pavia 2.12 Ethers Pavia 2.13 Carbonyl compounds Pavia 2.14 Amines Pavia 2.15 Nitriles Pavia 2.16 more. Pavia C-H and C-C bonds alkanes alkenes alkynes arenes
7 Pavia 2.10, pg 36 ~3300 cm -1 ~3100 cm -1 ~2900 cm -1 Wavenumber (cm -1 ) ~2150 cm -1 ~1630 cm -1 Weak fingerprint region Wavenumber (cm -1 )
 Polyatomic bond vibrations CH 2 Stretches asymmetric stretch ~2929 cm -1 symmetric stretch ~2853 cm -1")
8 Transmittance (%) Spectral Database for Organic Compounds (SDBS) Alkanes Pavia 2.10 hexane Wavenumber (cm -1 ) Polyatomic bond vibrations CH 2 Stretches asymmetric stretch ~2929 cm -1 symmetric stretch ~2853 cm -1 CH 2 Bends scissoring ~1450 cm -1 twisting rocking wagging ~1250 cm cm -1 ~1250 cm -1
9 CH 3 C H bend long chain band CH 2 C H bend hexane C H str. cyclohexane Branched alkanes Pavia 2.10, pg. 38
10 1-hexene trans-3-hexene cis-3-hexene
11 Characteristic C-H oop bending peaks for alkenes Pavia Table 2.22 Pavia 2.10, pgs
12 Increasing the number of substituents, increases v ~1670 cm -1 trans ~1670 cm -1 cis ~1658 cm -1 ~1650 cm -1 ~1640 cm -1 Wavenumber (cm -1 ) What does this imply about bond strength? Relating this effect to something you have seen before heats of hydrogenation + H 2 DH o = -127 kj/mol C 4 H 8 + H 2 Pt or Pd C 4 H 10 DH o < 0 + H 2 + H 2 DH o = -120 kj/mol DH o = -115 kj/mol Increasing the number of substituents, increases C=C bond strength, and therefore increases v +H 2 +H 2 Pavia 2.10, pgs H 2 DH Relative Stability Most stable Least Stable
13 Hyperconjugation accounts for the enhanced stability of cations, radicals and alkenes with higher degrees of substitution. C C H H H C C H H H C C C H H H carbocation radical alkene Relative more sub. > less sub more sub. > less sub. Stability 3 > 2 > 1 > Me trans > cis Stability mass spectra C=C bond explains fragmentation patterns stretching frequency


14 1-octyne 4-octyne Resonance hybrids
15 Effect of Resonance on C=C stretching of alkenes ~1640 cm -1 ~1600 cm -1 - Electron donating groups δ δ - Electron withdrawing groups δ δ Aromatic Molecules Pavia 2.11 benzene 1-hexene

16 toluene p-xylene Identify the substitution pattern for three isomers of C 10 H 14 Overtones Pavia pgs C-H out-of-plane bending

17 O-H and N-H bonds alcohols phenols carboxylic acids amines amides O-H and N-H bonds: Alcohols, Carboxylic Acids, Amines and Amides Pavia hexanol
18 Spectral Database for Organic Compounds (SDBS)C Transmittance (%) Spectral Database for Organic Compounds (SDBS) Pavia 2.14D 1-hexanoic acid Wavenumber (cm -1 ) Carboxylic acid are present as H-bonded dimers when neat or in concentrated solution Primary and Secondary Amines hexylamine Pavia 2.15 N-ethylbutylamine N,N-dimethylbutylamine cm -1
19 Spectral Database for Organic Compounds (SDBS) Primary, Secondary and Tertiary Amides propionamide N-methylpropionamide N,N-dimethylpriopionamide cm -1 Summary: O H, N H stretches O H of alcohols and N H of amine both have stretching vibrations at ~3300 cm Alcohol O-H stretching peaks are broad with rounded tip - Secondary amines (R 2 NH) are often broad with a sharp spike. - Primary amine (RNH 2 ) are broad with two sharp spikes - H-bonding important to appearance The O H of carboxylic acids appears as a very broad peak, between 3800 and 2600 cm -1, often with a W-shape. O-H COO-H N-H (1 ) N-H (2 )

20 Spectral Database for Organic Compounds (SDBS) C-O bonds alcohols carboxylic acids esters C O bonds: Alcohols and Ethers Pavia Pg. 50 butyl methyl ether 1-hexanol O H C 6 H 13 OH cm -1
21 Spectral Database for Organic Compounds (SDBS) Effect of Resonance on C O str. ~1120 cm -1 ~1220 cm -1 C O bonds: Esters and Carboxylic Acids hexanoic acid O H methyl propionate cm -1
 C-N, C=N, C N bonds C=O Bonds: Aldehydes and Ketones Pavia 2.")
22 C=O bonds Aldehydes Ketones Carboxylic acids Carboxylic acid derivatives (anyhydrides, acyl chlorides, esters, amides) C-N, C=N, C N bonds C=O Bonds: Aldehydes and Ketones Pavia 2.14B-C 2-hexanone C=O ~1715 cm -1 hexanal C=O ~1725 cm -1
23 Resonance Review
24 Effect of conjugation in aldehydes and ketones Pavia 2.14A 1718 cm cm cm -1 C=O Bonds: Carboxylic Acids and Derivatives Pavia 2.14D-H hexanoic acid O H Carboxylic acid are present as H-bonded dimers when neat or in concentrated solution methyl propionate
25 Transmittance (%) Spectral Database for Organic Compounds (SDBS) propionic anhydride Wavenumber (cm -1 ) C=O str. frequencies of acid derivatives Based on these frequencies, which of the following has the strongest bond? Why? Pavia 2.14G Pavia 2.14F cm cm cm cm -1
26 C=O str.: Effect of resonance of C=O of esters conjugation with C=O Pavia 2.14E 1748 cm cm cm -1 conjugation with O 1765 cm cm cm -1
27 C=O str.: Effect of resonance and ring size on C=O str. frequency of lactones 1760 cm cm cm cm cm cm -1 Summary of C=O str. The C=O str. Is often the strongest peak in the IR spectrum. Aldehydes and ketones can be distinguished by the presence of a C(=O) H str. (aldehydes) and a R C(=O) R bend (ketones). Conjugation of C=O of lowers the stretching frequency (corresponding to a weaker bond.) C=O str. frequencies of carboxylic acid derivatives can be rationalized in terms of the electronic effects of the substituent.
28 % Transmittance Spectral Database for Organic Compounds (SDBS)C % Transmittance Isocyanates and Nitriles Pavia 2.16 Imines C=C str. C=N str. C=O str.
29 Nitro compounds Pavia 2.17 Carbon Nitrogen Stretching Vibrations C N absorbs around 1200 cm -1. Pavia 2.24F, 15, 16 C=N absorbs around 1660 cm -1 and is much stronger than the C=C absorption in the same region. C N absorbs strongly just above 2200 cm -1. The alkyne C C signal is much weaker and is just below 2200 cm -1.
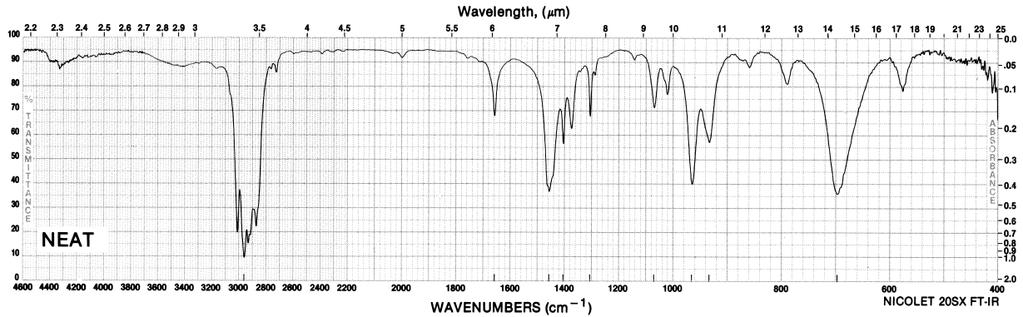
30 Reporting IR Spectra in Papers and Progress Reports A B C D IR (neat): 3100 (aromatic C H str.), 2218 (C C str.), 1725 (C=O str.) cm -1. A B C D Form of the sample (e.g., neat, nujol mull, CCl 4 solution) or method used (e.g., ATIR). Only list peaks that can be assigned to bonds in the structure you are describing. You do not need to list all the other peaks that might be present in the compound Assign the peaks to specific bonds, and mode of vibration. Units!
31 A B C D
32 A B C D
33 E A B
34 C D A B
35 C D E
Infrared Spectroscopy
 Infrared Spectroscopy Introduction Spectroscopy is an analytical technique which helps determine structure. It destroys little or no sample. The amount of light absorbed by the sample is measured as wavelength
Advanced Pharmaceutical Analysis
 Lecture 2 Advanced Pharmaceutical Analysis IR spectroscopy Dr. Baraa Ramzi Infrared Spectroscopy It is a powerful tool for identifying pure organic and inorganic compounds. Every molecular compound has
Lecture 11. IR Theory. Next Class: Lecture Problem 4 due Thin-Layer Chromatography
 Lecture 11 IR Theory Next Class: Lecture Problem 4 due Thin-Layer Chromatography This Week In Lab: Ch 6: Procedures 2 & 3 Procedure 4 (outside of lab) Next Week in Lab: Ch 7: PreLab Due Quiz 4 Ch 5 Final
Infrared Spectroscopy An Instrumental Method for Detecting Functional Groups
 Infrared Spectroscopy An Instrumental Method for Detecting Functional Groups 1 The Electromagnetic Spectrum Infrared Spectroscopy I. Physics Review Frequency, υ (nu), is the number of wave cycles that
Infrared Spectroscopy
 Infrared Spectroscopy IR Spectroscopy Used to identify organic compounds IR spectroscopy provides a 100% identification if the spectrum is matched. If not, IR at least provides information about the types
Chapter 12 Mass Spectrometry and Infrared Spectroscopy
 Organic Chemistry, 6 th Edition L. G. Wade, Jr. Chapter 12 Mass Spectrometry and Infrared Spectroscopy Jo Blackburn Richland College, Dallas, TX Dallas County Community College District 2006, Prentice
Infrared Spectroscopy
 x-rays ultraviolet (UV) visible Infrared (I) microwaves radiowaves near I middle I far I λ (cm) 8 x 10⁻⁵ 2.5 x 10⁻⁴ 2.5 x 10⁻³ 2.5 x 10⁻² µ 0.8 2.5 25 250 ν (cm -1 ) 13,000 4,000 400 40 ν (cm -1 1 ) =
ORGANIC - BROWN 8E CH INFRARED SPECTROSCOPY.
 !! www.clutchprep.com CONCEPT: PURPOSE OF ANALYTICAL TECHNIQUES Classical Methods (Wet Chemistry): Chemists needed to run dozens of chemical reactions to determine the type of molecules in a compound.
Learning Guide for Chapter 3 - Infrared Spectroscopy
 Learning Guide for hapter 3 - Infrared Spectroscopy I. Introduction to spectroscopy - p 1 II. Molecular vibrations - p 3 III. Identifying functional groups - p 6 IV. Interpreting an IR spectrum - p 12
Introduction. The analysis of the outcome of a reaction requires that we know the full structure of the products as well as the reactants
 Introduction The analysis of the outcome of a reaction requires that we know the full structure of the products as well as the reactants Spectroscopy and the Electromagnetic Spectrum Unlike mass spectrometry,
1.1. IR is part of electromagnetic spectrum between visible and microwave
 CH2SWK 44/6416 IR Spectroscopy 2013Feb5 1 1. Theory and properties 1.1. IR is part of electromagnetic spectrum between visible and microwave 1.2. 4000 to 400 cm -1 (wave numbers) most interesting to organic
Radiant energy is proportional to its frequency (cycles/s = Hz) as a wave (Amplitude is its height) Different types are classified by frequency or
 as a wave (Amplitude is its height) Different types are classified by frequency or") CHEM 241 UNIT 5: PART B INFRA-RED RED SPECTROSCOPY 1 Spectroscopy of the Electromagnetic Spectrum Radiant energy is proportional to its frequency (cycles/s = Hz) as a wave (Amplitude is its height) Different
CHEM 241 UNIT 5: PART B INFRA-RED RED SPECTROSCOPY 1 Spectroscopy of the Electromagnetic Spectrum Radiant energy is proportional to its frequency (cycles/s = Hz) as a wave (Amplitude is its height) Different
12. Structure Determination: Mass Spectrometry and Infrared Spectroscopy
 12. Structure Determination: Mass Spectrometry and Infrared Spectroscopy Determining the Structure of an Organic Compound The analysis of the outcome of a reaction requires that we know the full structure
ORGANIC - BRUICE 8E CH MASS SPECT AND INFRARED SPECTROSCOPY
 !! www.clutchprep.com CONCEPT: PURPOSE OF ANALYTICAL TECHNIQUES Classical Methods (Wet Chemistry): Chemists needed to run dozens of chemical reactions to determine the type of molecules in a compound.
General Infrared Absorption Ranges of Various Functional Groups
 General Infrared Absorption Ranges of Various Functional Groups Frequency Range Bond Type of Compound cm -1 Intensity C Alkanes 2850-2970 Strong 1340-1470 Strong C Alkenes 3010-3095 Medium 675-995 Strong
Table 8.2 Detailed Table of Characteristic Infrared Absorption Frequencies
 Table 8.2 Detailed Table of Characteristic Infrared Absorption Frequencies The hydrogen stretch region (3600 2500 cm 1 ). Absorption in this region is associated with the stretching vibration of hydrogen
Infrared Spectroscopy
 Infrared Spectroscopy (Chapter 12) 1 This reaction from Ochem 1 How do we know if it worked? The reactant is cyclohexene; the product is cyclohexanol. How can we tell the difference? Infrared Spectroscopy
Structure Determination. How to determine what compound that you have? One way to determine compound is to get an elemental analysis
 Structure Determination How to determine what compound that you have? ne way to determine compound is to get an elemental analysis -basically burn the compound to determine %C, %H, %, etc. from these percentages
Química Orgânica I. Ciências Farmacêuticas Bioquímica Química. IR spectroscopy AFB QO I 2007/08 1 AFB QO I 2007/08 2
 Química Orgânica I Ciências Farmacêuticas Bioquímica Química AFB QO I 2007/08 1 IR spectroscopy AFB QO I 2007/08 2 1 Adaptado de: Organic Chemistry, 6th Edition; L. G. Wade, Jr. Organic Chemistry, William
Learning Guide for Chapter 3 - Infrared Spectroscopy
 Learning Guide for hapter 3 - Infrared Spectroscopy I. Introduction to spectroscopy - p 1 II. Molecular vibrations - p 3 III. Identifying functional groups - p 6 IV. Interpreting an IR spectrum - p 12
More information can be found in Chapter 12 in your textbook for CHEM 3750/ 3770 and on pages in your laboratory manual.
 CHEM 3780 rganic Chemistry II Infrared Spectroscopy and Mass Spectrometry Review More information can be found in Chapter 12 in your textbook for CHEM 3750/ 3770 and on pages 13-28 in your laboratory manual.
IR absorption spectroscopy
 IR absorption spectroscopy IR spectroscopy - an analytical technique which helps determine molecules structure When a molecule absorbs IR radiation, the vibrational energy of the molecule increase! The
Infra-red Spectroscopy
 Molecular vibrations are associated with the absorption of energy (infrared activity) by the molecule as sets of atoms (molecular moieties) vibrate about the mean center of their chemical bonds. Infra-red
Vibrations. Matti Hotokka
 Vibrations Matti Hotokka Identify the stuff I ve seen this spectrum before. I know what the stuff is Identify the stuff Let s check the bands Film: Polymer Aromatic C-H Aliphatic C-H Group for monosubstituted
C h a p t e r F o u r t e e n: Structure Determination: Mass Spectrometry and Infrared Spectroscopy
 C h a p t e r F o u r t e e n: Structure Determination: Mass Spectrometry and Infrared Spectroscopy Cl OH Cl An electron ionization mass spectrum of 2,5-dichlorophenol CHM 323: Summary of Important Concepts
CHM 223 Organic Chemistry I Prof. Chad Landrie. Lecture 10: September 20, 2018 Ch. 12: Spectroscopy mass spectrometry infrared spectroscopy
 M 223 Organic hemistry I Prof. had Landrie Lecture 10: September 20, 2018 h. 12: Spectroscopy mass spectrometry infrared spectroscopy i>licker Question onsider a solution that contains 65g R enantiomer
How to Interpret an Infrared (IR) Spectrum
 Spectrum") How to Interpret an Infrared (IR) Spectrum Infrared (IR) Spectroscopy allows the identification of particular bonds present within molecules. In this class we have simplified IR analysis by only focusing
How to Interpret an Infrared (IR) Spectrum Infrared (IR) Spectroscopy allows the identification of particular bonds present within molecules. In this class we have simplified IR analysis by only focusing
EXPT. 7 CHARACTERISATION OF FUNCTIONAL GROUPS USING IR SPECTROSCOPY
 EXPT. 7 CHARACTERISATION OF FUNCTIONAL GROUPS USING IR SPECTROSCOPY Structure 7.1 Introduction Objectives 7.2 Principle 7.3 Requirements 7.4 Strategy for the Interpretation of IR Spectra 7.5 Practice Problems
Infrared Spectral Interpretation
 Infrared Spectral Interpretation i Wherever you see this symbol, it is important to access the on-line course as there is interactive material that cannot be fully shown in this reference manual. 1 Contents
(2) Read each statement carefully and pick the one that is incorrect in its information.
 Read each statement carefully and pick the one that is incorrect in its information.") Organic Chemistry - Problem Drill 17: IR and Mass Spectra No. 1 of 10 1. Which statement about infrared spectroscopy is incorrect? (A) IR spectroscopy is a method of structure determination based on the
Organic Chemistry - Problem Drill 17: IR and Mass Spectra No. 1 of 10 1. Which statement about infrared spectroscopy is incorrect? (A) IR spectroscopy is a method of structure determination based on the
Lecture 13 Organic Chemistry 1
 EM 232 rganic hemistry I at hicago Lecture 13 rganic hemistry 1 Professor Duncan Wardrop February 23, 2010 1 EM 232 rganic hemistry I at hicago Spectroscopy & Spectrometry hapter 13 2 EM 232 rganic hemistry
Infrared Spectroscopy. Provides information about the vibraions of functional groups in a molecule
 Infrared Spectroscopy Provides information about the vibraions of functional groups in a molecule Therefore, the functional groups present in a molecule can be deduced from an IR spectrum Two important
1. Which compound would you expect to have the lowest boiling point? A) NH 2 B) NH 2
 NH 2 B) NH 2") MULTIPLE CICE QUESTINS Topic: Intermolecular forces 1. Which compound would you expect to have the lowest boiling point? A) N 2 B) N 2 C) N D) E) N Ans: : N 2 D Topic: Molecular geometry, dipole moment
MULTIPLE CICE QUESTINS Topic: Intermolecular forces 1. Which compound would you expect to have the lowest boiling point? A) N 2 B) N 2 C) N D) E) N Ans: : N 2 D Topic: Molecular geometry, dipole moment
Infrared Spectroscopy used to analyze the presence of functional groups (bond types) in organic molecules How IR spectroscopy works:
 in organic molecules How IR spectroscopy works:") Infrared Spectroscopy used to analyze the presence of functional groups (bond types) in organic molecules It is the study of the interaction of infrared energy with organic molecules; the process analyzes
Infrared Spectroscopy used to analyze the presence of functional groups (bond types) in organic molecules It is the study of the interaction of infrared energy with organic molecules; the process analyzes
Organic Spectra Infra Red Spectroscopy H. D. Roth. THEORY and INTERPRETATION of ORGANIC SPECTRA H. D. Roth. Infra Red Spectroscopy
 rganic Spectra Infra Red Spectroscopy. D. Roth TERY and INTERPRETATIN of RGANI SPETRA. D. Roth Infra Red Spectroscopy Infrared spectroscopy (IR) is an analytical technique concerned with molecular vibrations
Symmetric Stretch: allows molecule to move through space
 BACKGROUND INFORMATION Infrared Spectroscopy Before introducing the subject of IR spectroscopy, we must first review some aspects of the electromagnetic spectrum. The electromagnetic spectrum is composed
Chemistry 343- Spring 2008
 Chemistry 343- Spring 2008 27 Chapter 2- Representative Carbon Compounds: Functional Groups, Intermolecular Forces and IR Spectroscopy A. ydrocarbons: Compounds composed of only C and Four Basic Types:
Application of IR Raman Spectroscopy
 Application of IR Raman Spectroscopy 3 IR regions Structure and Functional Group Absorption IR Reflection IR Photoacoustic IR IR Emission Micro 10-1 Mid-IR Mid-IR absorption Samples Placed in cell (salt)
Welcome to Organic Chemistry II
 Welcome to Organic Chemistry II Erika Bryant, Ph.D. erika.bryant@hccs.edu Class Syllabus 3 CHAPTER 12: STRUCTURE DETERMINATION 4 What is this solution Soda Tea Coffee??? 5 What is this solution Soda Tea
ORGANIC - CLUTCH CH ANALYTICAL TECHNIQUES: IR, NMR, MASS SPECT
 !! www.clutchprep.com CONCEPT: PURPOSE OF ANALYTICAL TECHNIQUES Classical Methods (Wet Chemistry): Chemists needed to run dozens of chemical reactions to determine the type of molecules in a compound.
MOLECULAR REPRESENTATIONS AND INFRARED SPECTROSCOPY
 MOLEULAR REPRESENTATIONS AND INFRARED SPETROSOPY A STUDENT SOULD BE ABLE TO: 1. Given a Lewis (dash or dot), condensed, bond-line, or wedge formula of a compound draw the other representations. 2. Give
ORGANIC - CLUTCH CH ANALYTICAL TECHNIQUES: IR, NMR, MASS SPECT
 !! www.clutchprep.com CONCEPT: PURPOSE OF ANALYTICAL TECHNIQUES Classical Methods (Wet Chemistry): Chemists needed to run dozens of chemical reactions to determine the type of molecules in a compound.
CHE 325 SPECTROSCOPY (A) CHAP 13A ASSIGN CH 2 CH CH 2 CH CHCH 3
 CHAP 13A ASSIGN CH 2 CH CH 2 CH CHCH 3") CE 325 SPECTRSCPY (A) CAP 13A ASSIGN 1. Which compound would have a UV absorption band at longest wavelength? A. I B. II C. III D. IV E. V C CC 3 CC C 2 C CC 3 I II III C 2 C C 2 C CC 3 IV V 2. Select
CE 325 SPECTRSCPY (A) CAP 13A ASSIGN 1. Which compound would have a UV absorption band at longest wavelength? A. I B. II C. III D. IV E. V C CC 3 CC C 2 C CC 3 I II III C 2 C C 2 C CC 3 IV V 2. Select
Infrared Spectroscopy: Identification of Unknown Substances
 Infrared Spectroscopy: Identification of Unknown Substances Suppose a white powder is one of the four following molecules. How can they be differentiated? H N N H H H H Na H H H H H A technique that is
8. Spectrum continued
 I. The ν(x-h) region alcohols H-bonding in alcohols Figs. 2.30,2.32,2.59,2.61,2.45 w 3400-3200 ν(o-h) amines s neat carboxylic acids increasing dilution 3600 free ν(o-h) w HN(C 4 H 9 ) 2 -NHbroad m-s 3500-3100
CHEM 3.2 (AS91388) 3 credits. Demonstrate understanding of spectroscopic data in chemistry
 3 credits. Demonstrate understanding of spectroscopic data in chemistry") CHEM 3.2 (AS91388) 3 credits Demonstrate understanding of spectroscopic data in chemistry Spectroscopic data is limited to mass, infrared (IR) and 13 C nuclear magnetic resonance (NMR) spectroscopy. Organic
CHEM 3.2 (AS91388) 3 credits Demonstrate understanding of spectroscopic data in chemistry Spectroscopic data is limited to mass, infrared (IR) and 13 C nuclear magnetic resonance (NMR) spectroscopy. Organic
Infrared Spectroscopy: How to use the 5 zone approach to identify functional groups
 Infrared Spectroscopy: How to use the 5 zone approach to identify functional groups Definition: Infrared Spectroscopy is the study of the Infrared Spectrum. An Infrared Spectrum is the plot of photon energy
Organic Compound Identification Using Infrared Spectroscopy. Description
 Return to paper Organic Compound Identification Using Infrared Spectroscopy Dr. Walt Volland, Bellevue Community College All rights reserved 1999, Bellevue, Washington Description This exercise is intended
MASS SPECTROMETRY: BASIC EXPERIMENT
 http://science.widener.edu/svb/massspec/ei.html relative abundance Pavia 8.1-8.5 MASS SPECTROMETRY: BASIC EXPERIMENT scienceaid.co.uk -e Molecule Molecule +. + 2e base peak [Fragments] +. fragment peaks
Chem HH W11 Notes - Dr. Masato Koreeda Date: January 5, 2011 Topic: _IR Spectroscopy_ page 1 of 3. fingerprint region
 hem 215-216 W11 Notes - Dr. Masato Koreeda Date: January 5, 2011 Topic: _I Spectroscopy_ page 1 of 3. Infra-red (I) Spectroscopy (Ege s book: Section 12.2; hapter 3 of the textbook arwood/laridge) Uses
CHEM 3760 Orgo I, F14 (Lab #11) (TECH 710)
 (TECH 710)") CHEM 3760 Orgo I, F14 (Lab #11) (TECH 710) Identification of an Unknown by IR PRELAB (PreLab is due before entering the lab.) Every student has to prepare for each experiment by answering the Pre-Laboratory
CHEM 3760 Orgo I, F14 (Lab #11) (TECH 710) Identification of an Unknown by IR PRELAB (PreLab is due before entering the lab.) Every student has to prepare for each experiment by answering the Pre-Laboratory
Types of Molecular Vibrations
 Important concepts in IR spectroscopy Vibrations that result in change of dipole moment give rise to IR absorptions. The oscillating electric field of the radiation couples with the molecular vibration
Look for absorption bands in decreasing order of importance:
 1. Match the following to their IR spectra (30 points) Look for absorption bands in decreasing order of importance: a e a 2941 1716 d f b 3333 c b 1466 1.the - absorption(s) between 3100 and 2850 cm-1.
ORGANIC - EGE 5E CH. 2 - COVALENT BONDING AND CHEMICAL REACTIVITY
 !! www.clutchprep.com CONCEPT: HYBRID ORBITAL THEORY The Aufbau Principle states that electrons fill orbitals in order of increasing energy. If carbon has only two unfilled orbitals, why does it like to
Infrared Spectroscopy
 Reminder: These notes are meant to supplement, not replace, the laboratory manual. Infrared Spectroscopy History and Application: Infrared (IR) radiation is simply one segment of the electromagnetic spectrum
ORGANIC - EGE 5E CH UV AND INFRARED MASS SPECTROMETRY
 !! www.clutchprep.com CONCEPT: IR SPECTROSCOPY- FREQUENCIES There are specific absorption frequencies in the functional group region that we should be familiar with EXAMPLE: What are the major IR absorptions
6. CHARACTERIZATION OF AS (III) IONS BIOSORPTION BY THE LIVE, HEAT AND ALKALINE- TREATED FUNGAL BIOMASS ON THE BASICS OF SURFACE STUDIES
 IONS BIOSORPTION BY THE LIVE, HEAT AND ALKALINE- TREATED FUNGAL BIOMASS ON THE BASICS OF SURFACE STUDIES") 6. CHARACTERIZATION OF AS (III) IONS BIOSORPTION BY THE LIVE, HEAT AND ALKALINE- TREATED FUNGAL BIOMASS ON THE BASICS OF SURFACE STUDIES 6. Introduction Infrared spectroscopy is a technique used to identify
6. CHARACTERIZATION OF AS (III) IONS BIOSORPTION BY THE LIVE, HEAT AND ALKALINE- TREATED FUNGAL BIOMASS ON THE BASICS OF SURFACE STUDIES 6. Introduction Infrared spectroscopy is a technique used to identify
Carbon Compounds. Chemical Bonding Part 2
 Carbon Compounds Chemical Bonding Part 2 Introduction to Functional Groups: Alkanes! Alkanes Compounds that contain only carbons and hydrogens, with no double or triple bonds.! Alkyl Groups A part of a
Objective 4. Determine (characterize) the structure of a compound using IR, NMR, MS.
 the structure of a compound using IR, NMR, MS.") Objective 4. Determine (characterize) the structure of a compound using IR, NMR, MS. Skills: Draw structure IR: match bond type to IR peak NMR: ID number of non-equivalent H s, relate peak splitting to
Objective 4. Determine (characterize) the structure of a compound using IR, NMR, MS. Skills: Draw structure IR: match bond type to IR peak NMR: ID number of non-equivalent H s, relate peak splitting to
E35 SPECTROSCOPIC TECHNIQUES IN ORGANIC CHEMISTRY
 E35 SPECTRSCPIC TECNIQUES IN RGANIC CEMISTRY Introductory Comments. These notes are designed to introduce you to the basic spectroscopic techniques which are used for the determination of the structure
CHEM 51LB: EXPERIMENT 7 SPECTROSCOPIC METHODS: INFRARED SPECTROSCOPY (IDENTIFICATION OF FUNCTIONAL GROUPS)
") REACTIONS: None TECHNIQUES: IR CHEM 51LB: EXPERIMENT 7 SPECTROSCOPIC METHODS: INFRARED SPECTROSCOPY (IDENTIFICATION OF FUNCTIONAL GROUPS) After a reaction is completed, the identity of the product must
REACTIONS: None TECHNIQUES: IR CHEM 51LB: EXPERIMENT 7 SPECTROSCOPIC METHODS: INFRARED SPECTROSCOPY (IDENTIFICATION OF FUNCTIONAL GROUPS) After a reaction is completed, the identity of the product must
Infrared spectroscopy Basic theory
 Infrared spectroscopy Basic theory Dr. Davide Ferri Paul Scherrer Institut 056 310 27 81 davide.ferri@psi.ch Importance of IR spectroscopy in catalysis IR Raman NMR XAFS UV-Vis EPR 0 200 400 600 800 1000
CHEM 3760 Orgo I, S12, Exp 5 (Lab #6) (TECH 710: IR Unknown)
 (TECH 710: IR Unknown)") CHEM 3760 rgo I, S12, Exp 5 (Lab #6) (TECH 710: IR Unknown) LAB REPRT ISTRUCTIS Identifying an Unknown Compound by Infrared Spectroscopy (IR) Carefully read all instructions and complete Section I on page
CHEM 3760 rgo I, S12, Exp 5 (Lab #6) (TECH 710: IR Unknown) LAB REPRT ISTRUCTIS Identifying an Unknown Compound by Infrared Spectroscopy (IR) Carefully read all instructions and complete Section I on page
Chapter 24. Amines. Based on McMurry s Organic Chemistry, 7 th edition
 Chapter 24. Amines Based on McMurry s Organic Chemistry, 7 th edition Amines Organic Nitrogen Compounds Organic derivatives of ammonia, NH 3, Nitrogen atom with a lone pair of electrons, making amines
CHEM 261 HOME WORK Lecture Topics: MODULE 1: The Basics: Bonding and Molecular Structure Text Sections (N0 1.9, 9-11) Homework: Chapter 1:
 Homework: Chapter 1:") CHEM 261 HOME WORK Lecture Topics: MODULE 1: The Basics: Bonding and Molecular Structure Atomic Structure - Valence Electrons Chemical Bonds: The Octet Rule - Ionic bond - Covalent bond How to write Lewis
CHEM 261 HOME WORK Lecture Topics: MODULE 1: The Basics: Bonding and Molecular Structure Atomic Structure - Valence Electrons Chemical Bonds: The Octet Rule - Ionic bond - Covalent bond How to write Lewis
i e l d f Energy (E) = Direction visible ultraviolet X-ray gamma infrared
 = Direction visible ultraviolet X-ray gamma infrared") rganic Structure Determination Analytical hemistry Instrument-based methods for determination of structure of organic molecules 1) Infrared Spectroscopy - yields functional groups 2) M Spectroscopy - very
rganic Structure Determination Analytical hemistry Instrument-based methods for determination of structure of organic molecules 1) Infrared Spectroscopy - yields functional groups 2) M Spectroscopy - very
CHEMISTRY 341. Final Exam Tuesday, December 16, Problem 1 15 pts Problem 9 8 pts. Problem 2 5 pts Problem pts
 CEMISTRY 341 Final Exam Tuesday, December 16, 1997 Name NAID Problem 1 15 pts Problem 9 8 pts Problem 2 5 pts Problem 10 21 pts Problem 3 26 pts Problem 11 15 pts Problem 4 10 pts Problem 12 6 pts Problem
Spectroscopy. Fourier Transform Infrared (FT-IR) Spectroscopy
 Spectroscopy") Fourier Transform Infrared (FT-IR) Spectroscopy Learning objectives Learning outcomes After completing this course, the student will be able to: Recognize the concept and principle of FT-IR Spectroscopy
Fourier Transform Infrared (FT-IR) Spectroscopy Learning objectives Learning outcomes After completing this course, the student will be able to: Recognize the concept and principle of FT-IR Spectroscopy
EXPT. 9 DETERMINATION OF THE STRUCTURE OF AN ORGANIC COMPOUND USING UV, IR, NMR AND MASS SPECTRA
 EXPT. 9 DETERMINATION OF THE STRUCTURE OF AN ORGANIC COMPOUND USING UV, IR, NMR AND MASS SPECTRA Structure 9.1 Introduction Objectives 9.2 Principle 9.3 Requirements 9.4 Strategy for the Structure Elucidation
CHEM3331: Fundamentals of Organic Chemistry I Prof. Ognjen Š. Miljanić December 11, 2012
 HEM3331: Fundamentals of rganic hemistry I Final Exam Prof. gnjen Š. Miljanić December 11, 2012 Name: Last First Student ID Number: ead all directions very carefully, think about your answer, and then
Keynotes in Organic Chemistry
 Keynotes in Organic Chemistry Second Edition ANDREW F. PARSONS Department of Chemistry, University of York, UK Wiley Contents Preface xi 1 Structure and bonding 1 1.1 Ionic versus covalent bonds 1 1.2
Structure Determination
 There are more than 5 million organic compounds, the great majority of which are colourless liquids or white solids. Identifying or at least characterising determining some of its properties and features
Instrumental Chemical Analysis
 L11 page 1 Instrumental Chemical Analysis Infrared Spectroscopy Dr. Ahmad Najjar Philadelphia University Faculty of Pharmacy Department of Pharmaceutical Sciences 2 nd semester, 2016/2017 Infrared Spectroscopy
UNIVERSITY OF CALGARY FACULTY OF SCIENCE MIDTERM EXAMINATION CHEMISTRY 353 READ ALL THE INSTRUCTIONS CAREFULLY
 WEDNESDAY MARCH 9th, 2016 UNIVERSITY OF CALGARY FACULTY OF SCIENCE MIDTERM EXAMINATION CHEMISTRY 353 Version 1 Time: 2 Hours READ ALL THE INSTRUCTIONS CAREFULLY PLEASE WRITE YOUR NAME, STUDENT I.D. NUMBER
2FAMILIES OF CARBON COMPOUNDS:
 P1: PBU/VY P2: PBU/VY Q: PBU/VY T1: PBU Printer: Bind Rite JWL338-02 JWL338-Solomons-v1 April 23, 2010 21:49 2AMILIES ARB MPUDS: UTIAL GRUPS, ITERMLEULAR RES, AD IRARED (IR) SPETRSPY SLUTIS T PRBLEMS 2.1
Amines Reading Study Problems Key Concepts and Skills Lecture Topics: Amines: structure and nomenclature
 Amines Reading: Wade chapter 19, sections 19-1-19-19 Study Problems: 19-37, 19-39, 19-40, 19-41, 19-44, 19-46, 19-47, 19-48, 19-51, 19-54 Key Concepts and Skills: Explain how the basicity of amines varies
CHEM 203. Midterm Exam 1 October 31, 2008 ANSWERS. This a closed-notes, closed-book exam. You may use your set of molecular models
 CEM 203 Midterm Exam 1 ctober 31, 2008 Your name: ANSWERS This a closed-notes, closed-book exam You may use your set of molecular models This exam contains 8 pages Time: 1h 30 min 1. / 15 2. / 16 3. /
Answers to Assignment #5
 Answers to Assignment #5 A. 9 8 l 2 5 DBE (benzene + 1 DBE) ( 9 2(9)+2-9 8+1+1 = 10 ˆ 5 DBE) nmr pattern of two doublets of equal integration at δ7.4 and 7.9 ppm means the group (the δ7.9 shift) IR band
CH 3. mirror plane. CH c d
 CAPTER 20 Practice Exercises 20.1 The index of hydrogen deficiency is two. The structural possibilities include two double bonds, a double do 20.3 (a) As this is an alkane, it contains only C and and has
MASS and INFRA RED SPECTROSCOPY
 MASS and INFRA RED SPECTRSCPY Mass Spectroscopy The mass spectrometer was looked at in Unit 1. It was noted there that compounds produce fragmentation patterns when passes through a mass spectrometer.
Unit 7 ~ Learning Guide Name:
 Unit 7 ~ Learning Guide : Instructions: Using a pencil, complete the following notes as you work through the related lessons. Show ALL work as is explained in the lessons. You are required to have this
Molecular Spectroscopy. H 2 O e -
 Molecular Spectroscopy ν (cm -1 ) λ (cm) 10 6 10 8 10 10 10 12 10 14 10 16 10 18 10 20 10 22 ν (Hz) NMR ESR microwave IR UV/Vis VUV X-Ray Gamma Ray H 2 e - UV/Vis Spectroscopy absorption technique X hν
Infrared spectroscopy. Siriphorn Laomanacharoen Bureau of Drug and Narcotic Department of Medical Sciences 2 March 2012
 Siriphorn Laomanacharoen Bureau of Drug and Narcotic Department of Medical Sciences 2 March 2012 1 Infrared region 2 Infrared region below red in the visible region at wavelengths between 2.5-25 µm more
Homework Assignment #3
 Chemistry 12600 Spring 2016 Homework Assignment #3 1. Determine whether each of the following statements is true or false. If the statement is false, modify and rewrite it so that it is a true statement.
12.1 The Nature of Organic molecules
 12.1 The Nature of Organic molecules Organic chemistry: : The chemistry of carbon compounds. Carbon is tetravalent; it always form four bonds. Prentice Hall 2003 Chapter One 2 Organic molecules have covalent
STRUCTURE ELUCIDATION BY INTEGRATED SPECTROSCOPIC METHODS
 Miscellaneous Methods UNIT 14 STRUCTURE ELUCIDATION BY INTEGRATED SPECTROSCOPIC METHODS Structure 14.1 Introduction Objectives 14.2 Molecular Formula and Index of Hydrogen Deficiency 14.3 Structural Information
CHEMISTRY 263 HOME WORK
 Lecture Topics: CHEMISTRY 263 HOME WORK Module7: Hydrogenation of Alkenes Hydrogenation - syn and anti- addition - hydrogenation of alkynes - synthesis of cis-alkenes -synthesis of trans-alkenes Text sections:
Chapter 12 Structure Determination: Mass Spectrometry and Infrared Spectroscopy
 Chapter 12 Structure Determination: Mass Spectrometry and Infrared Spectroscopy Figure 12.1 - The electron-ionization, magneticsector mass spectrometer Representing the Mass Spectrum Base Peak Parent
TOK: The relationship between a reaction mechanism and the experimental evidence to support it could be discussed. See
 Option G: Further organic chemistry (15/22 hours) SL students study the core of these options and HL students study the whole option (the core and the extension material). TOK: The relationship between
Chem 213 Final 2012 Detailed Solution Key for Structures A H
 Chem 213 Final 2012 Detailed Solution Key for Structures A H COMPOUND A on Exam Version A (B on Exam Version B) C 8 H 6 Cl 2 O 2 DBE = 5 (aromatic + 1) IR: 1808 cm 1 suggests an acid chloride since we
Electronegativity Scale F > O > Cl, N > Br > C, H
 Organic Chem Chapter 12 Alkanes Organic chemistry is the study of carbon compounds. Carbon has several properties that are worth discussing: Tetravalent Always forms 4 bonds Can form multiple bonds (double
2. Separate the ions based on their mass to charge (m/e) ratio. 3. Measure the relative abundance of the ions that are produced
 ratio. 3. Measure the relative abundance of the ions that are produced") I. Mass spectrometry: capable of providing both quantitative and qualitative information about samples as small as 100 pg (!) and with molar masses in the 10 4-10 5 kdalton range A. The mass spectrometer
I. Mass spectrometry: capable of providing both quantitative and qualitative information about samples as small as 100 pg (!) and with molar masses in the 10 4-10 5 kdalton range A. The mass spectrometer
Vibrational Spectroscopy
 Vibrational Spectroscopy In this part of the course we will look at the kind of spectroscopy which uses light to excite the motion of atoms. The forces required to move atoms are smaller than those required
Chapter 14 Spectroscopy
 hapter 14 Spectroscopy There are four major analytical techniques used for identifying the structure of organic molecules 1. Nuclear Magnetic Resonance or NMR is the single most important technique for
WEBSITE DATA FOR CHAPTER 6
 66 WEBSITE DATA FOR CHAPTER 6 Spectroscopic Identification of Organic Compounds by Infared Spectroscopy I. INTRODUCTION NOTE. It should be pointed out that a reciprocal centimeter is not a unit of frequency.
Fourier Transform Infrared Spectroscopy of Metal Ligand Complexes *
 OpenStax-CNX module: m34660 1 Fourier Transform Infrared Spectroscopy of Metal Ligand Complexes * Jiebo Li Andrew R. Barron This work is produced by OpenStax-CNX and licensed under the Creative Commons
PAPER No. 12: ORGANIC SPECTROSCOPY MODULE No. 4: Basic principles and Instrumentation for IR spectroscopy
 Subject Chemistry Paper No and Title Module No and Title Module Tag Paper 12: Organic Spectroscopy Module 4: Basic principles and Instrumentation for IR spectroscopy CHE_P12_M4_e-Text TABLE OF CONTENTS
Alkanes and Cycloalkanes
 Alkanes and Cycloalkanes Families of Organic Compounds Organic compounds can be grouped into families by their common structural features We shall survey the nature of the compounds in a tour of the families
ORGANIC SPECTROSCOPY NOTES
 - 1 - ORGANIC SPECTROSCOPY NOTES Basics of Spectroscopy UV/vis, IR and NMR are all types of Absorption Spectroscopy, where EM radiation corresponding to exactly the energy of specific excitations in molecules