IR absorption spectroscopy
|
|
|
- Irma Nelson
- 6 years ago
- Views:
Transcription
1 IR absorption spectroscopy IR spectroscopy - an analytical technique which helps determine molecules structure When a molecule absorbs IR radiation, the vibrational energy of the molecule increase! The amount of light absorbed by the sample depend on the incident radiation wavelength (wavenumber). IR spectroscopy measures the bond vibration frequencies in a molecule and is used to determine the functional groups from the molecule. The frequency of the absorbed radiation matches the vibration frequency of the bond or group. (Molecules absorb only those frequencies that are characteristic to their structure). A vibrational mode in a molecule is "IR active," only it is associated with changes of the dipole moment.
2 The IR domain Just above red in the visible region (wavelength > 800 nm). Near IR: μm Medium IR: μm Far IR: μm More common units are cm -1 (wavenumbers): the reciprocal of the wavelength in centimeters. Near IR: cm -1 Medium IR: cm -1 Far IR: cm -1 Wavenumbers are proportional to frequency and energy! For analysis of organic compounds radiation from medium IR range is used: Wavelemgth: nm nm; Wavenumbers: 4000 cm cm -1 ; Frequencies: Hz
3 IR absorption Only certain value for the molecule energie levels are allowed (the energy are quantified) Energy of vibrational levels: Ev (v )hc0 xe(v ) hc0 2 2 At room temperature, most molecules are in the lower vibrational level (ground state vibrational level) characterized by a vibrational quantum number v = 0: E hc0 xe hc 0 A molecule that absorbs IR radiation chage its vibrational state, therefore a change in the vibrational energy appears. Only radiation with certain energies will excite molecular vibrations (the energy radiation must match the difference between levels).
!")
4 Vibrational frequencies for stretching bonds in molecules are related to the strength of the chemical bonds and the masses of the atoms c k - reduce mass The interaction between molecule and electric field of IR radiation appear only then the induce vibration of molecule involve the oscillation of the dipole moment ()! The amount of IR radiation absorbed is proportional to the square of the rate of change of the dipole during the vibration. There must be a change in the dipole moment of the molecule as a result of a molecular vibration. The symmetry of the molecule will also determine whether the IR radiation can be absorbed. Symmetric vibrations (from symmetric molecules) do not absorb IR radiation since there is no change in dipole moment.
5 i q µ - dipole moment, q i electric charge, r i -coordinate i r i IR absorption = change in dipol moment! Taylor series: 3N 6 0 Qk... k1 Qk 0 μ total dipole moment of vibrating molecule μ 0 equilibrum dipole moment, Q k normal coordinate W μ E0 0 Qk 0 0 W - interaction energy, E 0 - electric field of incident radiation The interaction energy is non zero when at least for one vibration there is a variation of the molecular dipol moment. The molecule will absorb electromagnetic radiation with k frequency only if there is a change of dipole moment during vibration (with k frequency ).
6 * Quantum mechanic: d 0 t final init in order to have interaction! Ψ final, Ψ init - initial and final wave functions Selection rule: harmonic oscilator: Δv v final v init 1 v - vibrational quantum number anharmonic oscilator: Δv v final v init 1, 2,... For a real molecule there are two types of transitions: E v=4 v=3 v=2 v=1 v=0 Fundamental transitions: caused by the selection rule of Δv = 1 (strictly valid only for harmonic potentials) Overtones transitions: caused by the selection rule Δv = 2, 3,.. (because of the anharmonicity) Q K
7 IR spectrum: fundamental bands overtone bands v 1 Δv 2, 3,... combination bands: more vibrational quantum number change simultaneous with one or more units only for polyatomic molecules v k 1 k = 2,3, The intensity of the overtone bands are typically only 1-5 % of the fundamental! The intensity of the combination band are usually very small (< 1%). E v=4 v=3 v=2 v=1 v=0 Q K
8 Vibrational energy level of a polyatomic molecule with k different normal modes are characterized by k quantum numbers cm cm cm cm cm -1 Ex.: H 2 C 2 (linear) (3N-5 = 7 normal modes) Vibrational energy level of H 2 C 2 (5 different normal modes) are characterized by 5 quantum numbers (one for each normal mode): Vibrational ground state (zero point vibrational energy): (00000) ( all v i = 0) (i = 1,2,3,4,5) Vibrational excited levels: (10000,01000,00100, 00010, 00001) ( one v i = 1) Vibrational overtones levels : (20000, 03000, 00020,...) (one v i > 1) Vibrational combination levels: (00011, 10100, ) (more than one v i 0)

9 combination Combination bands involve changes in vibrational quantum numbers of more than one normal mode. Theoretically these transitions are forbidden by harmonic oscillator selection rules, but are observed in vibrational spectra of real molecules due to anharmonic couplings of normal modes. Combination bands typically have weak spectral intensities, but can become quite intense in cases where the anharmonicity of the vibrational potential is large. There are two types of combination bands, due to: difference bands and sum bands
10 Difference bands lecture A difference band, occurs when both initial and final states are excited vibrational states. (two frequencies couple such that ν 3 = ν 1 - ν 2 ) Example : ~ (ν 1 - ν 2 ) In this case (one quantum transfer), the frequency of the difference band is approximately equal to the difference between the fundamental frequencies. The difference is not exact because there is anharmonicity in both vibrations. The term "difference band" also applies to cases where more than one quantum is transferred, such as ~( ν 1-2ν 2 ) Difference bands are seldom observed in conventional vibrational spectra, because they are forbidden transitions according to harmonic selection rules, and because populations of vibrationally excited states tend to be quite low.
11 Sum bands A band, occurs when two or more vibrational excited states are excited simultaneously. (two vibrational frequencies may couple to produce a new frequency ν 3 = ν 1 - ν 2 ) Example: ~(ν 1 + ν 3 ); ~ (ν 2 + ν 3 ) The frequency of a sum band is slightly less than the sum of the frequencies of the fundamentals, again due to anharmonic shifts in both vibrations. Sum bands are harmonic-forbidden, and thus typically have low intensities relative to fundamental bands. Sum bands are more commonly observed than difference bands in vibrational spectra
12 Difference transitions: ~ (ν 1 - ν 2 ) ~ (ν 1-2ν 2 ) Sum transition: ~ (ν 1 + ν 3 ) ~ (ν 2 + ν 3 ) ν 1 ν 2 ν 3
 2.")
13 Vibrational coupling The energy of a vibration, (the position of its absorption peak) may be influenced by (or coupled with) other vibrators in the molecule. A number of factors influence the extent of such coupling. 1. Coupling between two stretching vibrations occurs only when there is an atom common to the vibrating groups. (Coupling is strong!) 2. Coupling between two bending vibrations requires a common bond between the vibrating groups. 3. Coupling between a stretching and a bending vibrations can occur if the stretching bond form one side of the angle that varies in the bending vibration. 4. Interaction is greatest when the coupled groups have individual energies that are approximately equal. 5. Little or no interaction is observed between groups separated by two or more bonds. 6. Coupling requires that the vibrations be of the same symmetry species.


14 Rules of vibrational coupling: Coupling of different vibrations shifts frequencies Energy of a vibration is influenced by coupling Coupling likely when common atom in stretching modes common bond in bending modes similar vibrational frequencies common bond in bending+stretching modes Coupling not likely when atoms separated by two or more bonds symmetry inappropriate
15 Ex: The C=O=C assimetrical stretching vibration due to coupling is at ' = 2330 cm -1 The C=O stretching vibration (no coupling occurs) is at ' = 1700 cm -1 Interaction is greatest when the coupled groups have individual energies that are approximately equal The position of an absorption peak corresponding to a given organic functional group varies due to coupling: H H H H H H H H C O H H C C O H H C C C C H H H H H H OH H 1034 cm cm cm -1 These variations result from a coupling of the C - O stretching with adjacent C - C stretching or C - H vibrations.
16 Diatomic molecule (linear!) : N = 2 3N - 5 = 1 one normal mode (1 stretching) Symmetric molecules are IR inactive the dipole moment does not change during vibration k 4 2 c 2 1 k 2c m1m 2 m m Molecule H 2 D 2 HF HCl HI CO NO F 2 Cl 2 Br 2 I 2 O 2 N 2 Li 2 Na 2 NaCl KCl Wavenumber [cm -1 ] Force constant [N/cm] Active Raman Raman IR IR IR IR IR Raman Raman Raman Raman Raman Raman Raman Raman IR IR
17 Each peak (fundamental band) in a vibrational spectrum corresponds to a normal mode. Linear molecules with N atoms: 3N-5 normal modes: N-1 stretching modes 2N-4 bending modes Nonlinear molecules with N atoms (non-cyclic): 3N-6 normal modes: N-1 stretching modes 2N-5 bending modes Diatomic molecules (linear) - 1 normal mode (1 stretching; no bending) N = 2 3N - 5 = 1 Linear tri-atomic molecules (CO 2, COS) N = 3 3N - 5 = 4-4 normal modes (2 stretching and 2 bending) Nonlinear tri-atomic molecules - 3 normal modes (2 stretching and 1 bending) (H 2 O) N = 3 3N - 6 = 3
18 Transmisia CO 2 molecule: linear and symmetric: N = 3 3N - 5 = 4 normal modes (2 stretchings) Symmetric stretching is not IR active (because there isn't a dipole moment variation). Asymmetric stretching is IR active (determine the change of the dipol moment) Bending vibration is IR active (determine the change of the dipol moment) Bending vibration is double degenerate (same energy is necessary to oscilate in the two perpendicular planes to the molecular axis) O C O 3 - asymmetric stretching (2349 cm -1 ) O C O 1 - symmetric Stretching (1330 cm -1 ) O C O 2 -symmetric bending (667,3 cm -1 ) O C O 3000 Convention rule: Vibrations are note descending, firstly symmetric vibrations, then asymmetric vibrations cm


19 CO 2 vibrations The CO 2 vibrational modes, are responsible for the "greenhouse" effect in which heat radiated from the earth is absorbed (trapped) by CO 2 molecules in the atmosphere. The arrows indicate the directions of motion. (A ) symmetric stretching (B) asymmetric stretching (C), (D) - bending modes
20 - linear, - asymmetric N = 3 3N - 6 = 3 vibrations (2 stretchings) All three vibrations determine the change of the dipol moment, therefore all are IR active.
21 Transmisia O O O H 2 O molecule: nonlinear, rotation axis, permanent dipol moment N = 3 3N - 6 = 3 vibrations (2 stretchings) H υ 3 - asymmetric (3755,8cm -1 ) H H H υ 1 -symmetric (3651,7cm -1 ) H H υ 2 - symmetric (1595cm -1 ) Vibrations: cm symmetric stretching 3 - asymmetric stretching 2 - bending (symmetric) O H Rotation axis H
22 Hot bands A hot transition is a fundamental transition with Δv = 1 that start from an excited level! (v initial 0) (a transition between two states of a single normal mode of vibration, neither of which is the overall ground state). In IR or Raman spectroscopy "hot transitions" are known as hot bands, and specifically refer to those transitions for a particular vibrational mode which arise from a state containing thermal population of another vibrational mode. Example (for a molecule with 3 normal modes): The transition is a hot band (the initial state has one quantum of vibrational excitation in the ν 3 mode)
23 At room temperature mostly molecules are in the ground state. At high temperature ( o C) we can not neglect the molecule population from lowers vibrational levels (< 800 cm -1 ). The population of vibrational levels respect the Boltzmann distribution: N v N e 0 Ev kt N e 0 hν kt N 0 e hcν kt
24 In the harmonic approximation all vibrational quantum levels are equally spaced, so hot bands would not be distinguishable from so-called "fundamental" transitions arising from the overall vibrational ground state. E v hc(v 1 ) 2 E E E E hc Vibrations of real molecules always have some anharmonicity, and the energy levels are not equally spaced, so hot bands could be observed in vibrational spectra. hc E v (v 1 )hcν 2 0 x e (v 1 ) 2 2 hcν Transition from an excited level (termal populated) (v = 1 v = 2) 0(1 4xe) 12 Transition from fundamental level (v = 0 v = 1) 0(1 2xe) 01 Hot bands appear at lower frequencies (exhibit red shifts) than the corresponding fundamental transitions. The magnitude of the observed shift is correlated to the degree of anharmonicity in the corresponding normal modes. Hot band fundamental band v=3 v=2 overtone bands v=1 v=0
25 Hot band frequencies is lower than fundamental corresponding band xe Hot band: a little asymmetry to lower wavenumbers of fundamental bands: Hot band identification: when temperature rises, the hot band intensity increases due to increasing of the thermal population of excited level (v = 1). Both cm -1 and cm -1 are due to the stretching vibration of C-H group cm -1 fundamental band cm -1 hot band (shoulder)
26 Fermi Resonance If a fundamental vibration and an overtone (or a combination of other vibrations) in a molecule are comparable in frequency, they interact by the anharmonic part of the Hamiltonian when allowed by symmetry. The results are frequency shifts and mixings of the wavefunctions with corresponding changes in the IR and Raman activities. Fermi resonance can occur when the frequency of one of the fundamental vibrations in a molecule is close to the frequency of overtone of other vibration of the molecule (oscillations are mechanically coupled each other). Fermi resonance most often occurs between normal and overtone modes, which are often nearly coincidental in energy. Fermi resonance determines two effects. - the high energy mode shifts to higher energy and the low energy mode shifts to still lower energy. - the weaker band gains intensity (becomes more allowed) and the more intense band decreases in intensity.

27 The interaction between between a fundamental and an overtone vibrations (Fermi Resonance) appear only if the symmetries of the involved vibrations are the same. Usually Fermi Resonance interactions go unnoticed, but occasionally they produce unexpected doubling of important functional group bands. In order for Fermi Resonance to occur it requires that the fundamental band producing the overtone be relatively intense, and to be at a frequency approximately half that of the fundamental with which the overtone interacts In interpreting IR spectra it is useful to be aware of the possibility of Fermi Resonance. If you see a band that is unexpectedly two peaks you might look to see if there is a strong adsorption at about one half the frequency.
28 Ex.: CO 2 The symmetric stretching vibration (1330 cm -1 ) of CO 2 appears as a doublet. This splitting is caused by the first overtone of the deformation frequency (2 x 667 cm -1 = 1334 cm -1 ). As a result, the spectrum has two bands at 1286 cm -1 and 1389 cm -1. Cl-CN Cyanogen chloride Cl-CN has a fundamental frequency of 378 cm -1 that generates the first overtone at 2 x 378 cm-1 = 756 cm -1. Anharmonicity leads to a slight drop in energy so that the true value is 756 cm -1. This value is in Fermi resonance with the C-Cl stretching frequency of 744 cm -1. As a result, this frequency is split into two bands at 784 cm cm -1. Fermi resonance would seem to have the potential to make IR and Raman spectra very complicated. Fortunately, this is not the case because only frequencies of the same symmetry can interact. Fermi resonance is commonly observed for Aldehydes!
29 The look of Fermi doublet is changing with the solvent polarity. In the case of polar solvent one of the band could disappeared. diphenilformamide HCON(C 6 H 5 ) 2 C=O stretching vibration In cyclohexane the Fermi resonance is almost perfect The position and intensity of the Fermi bands allow the determination of fundamental transition wavenumber υ 0 0 1I 1 1 2I 2 2 I 1, I 2 intensities polar solvent
30 The IR of benzoyl chloride is a good example: CO The is at 1774 cm -1 The Fermi Resonance band at 1730 cm -1 arises from coupling with the band at 872 cm -1 (this band has been variably assigned as a =C-C=, and sometimes a =C-Cl
31 Fermi Resonance does not always occur in acid chlorides; it is absent in hexanoyl chloride:
32 Fermi Resonance is present in isobutyryl chloride:
33 Harmonic approximation: two close but different vibrational level E i 0 and E k 0 with i 0 and k 0 corresponding wave functions (independent!) can not explain Fermi Resonance. Schrodinger equations are: H 0 i0 =E i0 i 0 and H 0 k0 =E k0 k 0 Anharmonic approximation: anharmonicity involve an perturbation Hamiltonian H': total Hamiltonians is: H = H 0 + H' (H 0 = equilibrium Hamiltonian). The perturbation wavefunction depend to unperturbed wavefunctions = c i 0 I + c k 0 k c 2 i + c 2 k = 1 (coefficients obey the normalization condition) The energy difference between the two vibrational level is: = E i 0 - E k 0 We can choose the energy origin between the two vibrational level, so: The energies and wavefunctions of coupled levels are: E, Δ 4H' ik ψ aψi bψk H' ik ψi H'ψkdτ 0 0 ψ aψi bψk E Δ a 2 2E E Δ b 2 2E Fermi Resonance is manifest when 0. In this case E +,- =H ik and a = b = 1 2. In the spectrum will appear two bands of slightly different intensity (Fermi doublet). An important contribution to one vibration from the other one could appear (because the perturbated wavefunctions + and - depend on initially wavefunctions 0 i and k0 ) Δ E 0 i, k 2
34 The IR Spectrum Each stretching and bending vibration occurs with a characteristic frequency as the atoms and charges involved are different for different bonds The y-axis on an IR spectrum is in units of % transmittance In regions where no osc. bond is interacting with IR light, transmittance nears 100% In regions where the EM field of an oscilating bond interacts with IR light of the same transmittance is low (light is absorbed)
35 In general: Lighter atoms will allow the oscillation to be faster higher energy C-H > N-H > O-H Stronger bonds will have higher energy oscillations Triple bonds > double bonds > single bonds in energy Energy/ of oscillation The intensity of an IR band is affected by two primary factors: Vibration type (stretching or bending) Electronegativity difference of the atoms involved in the bond For both effects, the greater the change in dipole moment in a given vibration, the larger the peak. The greater the difference in electronegativity between the atoms involved in bonding, the larger the dipole moment Typically, stretching will change dipole moment more than bending
36 It is important to make note of peak intensities to show the effect of these factors: Strong (s) peak is tall, transmittance is low (0-35 %) Medium (m) peak is mid-height (75-35%) Weak (w) peak is short, transmittance is high (90-75%) Exact transmittance values are rarely recorded All organic functional groups are made of multiple bonds and therefore show up as multiple IR bands (peaks) Since most types of bonds in covalent molecules have roughly the same energy, i.e., C=C and C=O bonds, C-H and N-H bonds they show up in similar regions of the IR spectrum The primary use of the IR is to detect functional groups
37 Interpretation of IR spectra Because the IR spectrum of each molecule is unique, it can serve as a signature or fingerprint to identify the molecule. Areas in which IR spectroscopy is used extensively include pharmaceutical analysis, quality control in industrial processes, environmental chemistry, geology and astronomy. One difficulty is that the infrared (IR) spectra of molecules with more than a few atoms can be very complicated. How do we know to assign the vibrations to the absorption bands from the IR spectrum? There are really three possible answers. 1. It is possible to perform elaborate chemical calculations that allow us to develop pictures of each vibrational mode. How accurate these calculations are depends on the method used. As with all modeling, these calculations are subject to a variety of errors, and so the quality of the results varies widely with the method and the complexity of the molecule being studied.
38 2. In many cases, it is not important to know the exact nature of each vibration. Rather, we might just want to find if certain functional groups (e.g. -COOH, -NH 2, etc.) are present in the molecule. It turns out that the some molecular vibrations can be approximately described just in terms of the motions of a few of the atoms, while the other atoms move only slightly or not at all. This approximation is called "functional group analysis". It is particularly useful as a tool for qualitative analysis of organic molecules, and for monitoring the progress of organic reactions. 3. In other cases, we may not even care what the modes are! We may just want to obtain a spectrum of our sample, and compare it to a library of spectra of known compounds, in order to identify our sample. This procedure is common in environmental and forensic analyses.
39 Infrared Functional Group Analysis Looking for presence/absence of different functional groups Simple stretching: cm -1 functional groups region Complex vibrations: cm -1, fingerprint region A polar bond is usually IR-active! A nonpolar bond in a symmetrical molecule will absorb weakly or not at all! The stronger the bond, the more energy will be required to excite the stretching vibration: C C > C=C > C-C C N > C=N > C-N The heavier an atom, the lower the wavenumbers for vibrations that involve that atom c k
40 The four primary regions of the IR spectrum Bonds to H Triple bonds Double bonds Single Bonds Fingerprint Region O-H C C C=O C-C N-H C N C=N C-N C-H C=C C-O 4000 cm cm cm cm cm -1
41 IR functional group analysis IR is absorbed when frequency of IR radiation is equal with frequency of molecule vibrations Covalent bonds vibrate at only certain allowable frequencies (associated with the nature of the bonds and the mass of vibrating atoms) 0 1 2c k Stretching vibrations appear at higher wavenumbers than bending vibrations! Asymmetric vibrations are strongest vibration from the IR spectrum. No two molecules will give exactly the same IR spectrum (except enantiomers) Baseline Absorbance/ Peak
42 Alkanes sp 3 Combination of C-C and C-H bonds C-C stretches and bends cm -1 CH 2 -CH 2 bond cm -1 CH 2 -CH 3 bond cm -1 sp 3 C-H between cm -1 Octane (w s) (m)
 occurs at 3000-3100 cm -1 sp 2 sp 3 The")

43 Alkenes Addition of the C=C and vinyl C-H bonds C=C stretch at cm -1 weaker as substitution increases vinyl C-H stretch (sp 2 ) occurs at cm -1 sp 2 sp 3 The difference between alkane, alkene or alkyne C-H is important! If the band is slightly above 3000 it is vinyl sp 2 C-H or alkynyl sp C-H If the band is below 3000 it is alkyl sp 3 C-H 1-Octene (w m) (w m)


44 Alkynes Addition of the C C and vinyl C-H bonds C C stretch cm -1 ; strength depends on asymmetry of bond, strongest for terminal alkynes, weakest for symmetrical internal alkynes C-H for terminal alkynes occurs at cm -1 sp sp 3 1-Octyne (w-m) (m s) sp 3

45 Internal alkynes ( R-C C-R ) would not have C C band! sp 3
 C-H")
46 Aromatics Ethyl benzene Due to the delocalization of e - in the ring, C-C bond order is 1.5, the stretching frequency for these bonds is slightly lower in energy than normal C=C These show up as a pair of sharp bands, 1500 & 1600 cm -1, (lower frequency band is stronger) C-H bonds off the ring show up similar to vinyl C-H at cm -1 overtone of bending region (w m) (w m)
 a weak grouping of peaks is observed for aromatic systems Analysis of this region, called the")
 1,2 disubstituted (meta or m-) 1,4 disubstituted")
47 Aromatics If the region between cm -1 (w) is free of interference (C=O stretching frequency is in this region) a weak grouping of peaks is observed for aromatic systems Analysis of this region, called the overtone of bending region, can lead to a determination of the substitution pattern on the aromatic ring G Monosubstituted G G G G G 1,2 disubstituted (ortho or o-) 1,2 disubstituted (meta or m-) 1,4 disubstituted (para or p-) G
48 Unsaturated Systems substitution patterns The substitution of aromatics and alkenes can also be discerned through the outof-plane bending vibration region However, other peaks often are apparent in this region. These peaks should only be used for reinforcement of what is known or for hypothesizing as to the functional pattern. R C H CH 2 cm R cm R C H H C R R R R C H R C R R C H CH R R R R R C R R C H


49 Ethers addition of the C-O-C asymmetric band and vinyl C-H bonds Show a strong band for the antisymmetric C-O-C stretch at cm -1 Otherwise, dominated by the hydrocarbon component of the rest of the molecule Diisopropyl ether (s)


50 Alcohols Strong, broad with rounded tip O-H stretch from cm -1 The shape is due to the presence of hydrogen bonding C-O stretch from cm -1 (like ethers) Band position changes depending on the alcohols substitution: ; ; ; phenol ) (m s) br (s)

 NH 2 deformation band: 1590-1650 cm -1")
51 Primary amine (R-NH 2 ): The N-H stretching band for NH 2 occur between cm -1 Broad band with two sharp spikes (dublet: symmetric and anti-symmetric modes) NH 2 deformation band: cm -1 2-aminopentane (w) (w)


52 Tertiary amines (R 3 N) have no N-H bond and will not have a band in this region Secondary amine (R 2 -NH): The N-H stretching band occurs at cm -1 as a single sharp peak weaker than O-H band Both O-H and N-H stretching bands occur around 3300 cm -1, but they look different! pyrrolidine (w m)
53 H region review Inspect the bonds to H region ( cm -1 ) Peaks from are simply sp 3 C-H in most organic molecules Above 3000 cm -1 Learn shapes, not wavenumbers!: Broad U-shape peak -O H bond V-shape peak -N H bond for 2 o amine (R 2 N H) W-shape peak -N H bond for 1 o amine (RNH 2 ) Sharp spike -C C H bond Small peak shouldered just above 3000 cm -1 C=C H or Ph H 3000 cm -1
54 Carbon-Carbon Bond Stretching Stronger bonds absorb at higher frequencies (ν ~ k!): C-C 1200 cm -1 C=C 1660 cm -1 CC 2200 cm -1 (weak or absent if internal) Conjugation lowers the frequency: isolated C=C cm -1 conjugated C=C cm -1 aromatic C=C approx cm -1 Carbon-Hydrogen Stretching Bonds with more s character absorb at a higher frequency: sp 3 C-H, just below 3000 cm -1 (CH 3 ) sp 2 C-H, just above 3000 cm -1 (CH 2 ) sp C-H, at 3300 cm -1 (CH)
55 Carbonyl Stretching (C=O) The C=O bond of simple ketones, aldehydes, and carboxylic acids absorb around 1710 cm -1 Usually, it s the strongest IR signal. Aldehydes have two C-H signals around 2700 and 2800 cm -1 Carboxylic acids will have O-H also.

56 Aldehydes C=O stretch from cm -1 Band is sensitive to conjugation, as are all carbonyls (upcoming slide) A highly unique sp 2 C-H stretch appears as a doublet, 2720 & 2820 cm -1 called a Fermi doublet Cyclohexyl carboxaldehyde (w-m) (s)


57 Ketones C=O stretch occurs at cm -1 Simplest of the carbonyl compounds as far as IR spectrum carbonyl only 3-methyl-2-pentanone (s)
")
58 Esters C=O stretch at cm -1 Strong band for C-O at a higher frequency than ethers or alcohols at cm -1 Ethyl pivalate (s) (s)


59 Carboxylic Acids: Gives the messiest of IR spectra C=O band occurs between cm -1 The highly dissociated O-H bond has a broad band from cm -1 covering up to half the IR spectrum in some cases 4-phenylbutyric acid This O-H absorbs broadly due to strong hydrogen bonding (w m) br (s) (s)


60 Acid anhydrides Coupling of the anhydride though the ether oxygen splits the carbonyl band into two with a separation of 70 cm -1 Bands are at cm-1 and cm -1 Mixed mode C-O stretch at cm -1 Propionic anhydride O O O (s) (s)
")

61 Acid halides Clefted band at cm -1 for C=O Bonds to halogens, due to their size (see Hooke s Law derivation) occur at low frequencies, only Cl is light enough to have a band on IR, C-Cl is at cm -1 Propionyl chloride O Cl (s) (s)
 the N-H stretch occurs")

62 Amides Display features of amines and carbonyl compounds C=O stretch at cm -1 If the amide is primary (-NH 2 ) the N-H stretch occurs from cm -1 as a doublet If the amide is secondary (-NHR) the N-H stretch occurs at cm -1 as a sharp singlet pivalamide O NH 2 (m s) (s)
 at 1300-1380 cm -1 and 1500-1570 cm -1 This group is a strong resonance")
63 Nitro group (-NO 2 ) Proper Lewis structure gives a bond order of 1.5 from nitrogen to each oxygen Two bands are seen (symmetric and asymmetric) at cm -1 and cm -1 This group is a strong resonance withdrawing group and is itself vulnerable to resonance effects 2-nitropropane O N O (s) (s)


64 Nitriles (the cyano- or C N group) Principle group is the carbon nitrogen triple bond at cm -1 This peak is usually much more intense than that of the alkyne due to the electronegativity difference between carbon and nitrogen N C propionitrile (s)
 absorb at an even higher frequency Carbon - Nitrogen Stretching C - N absorbs around 1200 cm -1 C")
65 Variations in C=O Absorption Conjugation of C=O with C=C lowers the stretching frequency to ~1680 cm -1 The C=O group of an amide absorbs at an even lower frequency, cm -1 The C=O of an ester absorbs at a higher frequency, ~ cm -1 Carbonyl groups in small rings (5 C s or less) absorb at an even higher frequency Carbon - Nitrogen Stretching C - N absorbs around 1200 cm -1 C = N absorbs around 1660 cm -1 and is much stronger than the C = C absorption in the same region C N absorbs strongly just above 2200 cm -1. The alkyne C C signal is much weaker and is just below 2200 cm - 1
66 Effects on IR bands 1. Conjugation by resonance, conjugation lowers the energy of a double or triple bond. The effect of this is readily observed in the IR spectrum: O O 1684 cm cm -1 C=O C=O Conjugation will lower the observed IR band for a carbonyl from cm -1 provided conjugation gives a strong resonance contributor O C H 3 C X X = NH 2 CH 3 Cl NO cm -1 O H 2 N C CH 3 vs. O O N O C CH 3 Strong resonance contributor Poor resonance contributor (cannot resonate with C=O) Inductive effects are usually small, unless coupled with a resonance contributor (note CH 3 and Cl above)
67 Effects on IR bands 2. Steric effects usually not important in IR spectroscopy, unless they reduce the strength of a bond (usually p) by interfering with proper orbital overlap: O O C=O: 1686 cm -1 CH 3 C=O: 1693 cm -1 Here the methyl group in the structure at the right causes the carbonyl group to be slightly out of plane, interfering with resonance 3. Strain effects changes in bond angle forced by the constraints of a ring will cause a slight change in hybridization, and therefore, bond strength O O O O O 1815 cm cm cm cm cm -1 As bond angle decreases, carbon becomes more electronegative, as well as less sp 2 hybridized (bond angle < 120 )


68 Effects on IR bands 4. Hydrogen bonding Hydrogen bonding causes a broadening in the band due to the creation of a continuum of bond energies associated with it In the solution phase these effects are readily apparent; in the gas phase where these effects disappear or in lieu of steric effects, the band appears as sharp as all other IR bands: Gas phase spectrum of 1-butanol Steric hindrance to H-bonding in a di-tert-butylphenol OH H-bonding can interact with other functional groups to lower frequencies O H O C=O; 1701 cm -1


69 Summary of IR Absorptions Strengths and Limitations IR alone cannot determine a structure Some signals may be ambiguous The presence of a functional group is usually indicated by a signal in IR spectrum The absence of a signal is definite proof that the functional group is absent Correspondence with a known sample s IR spectrum confirms the identity of the compound
70 Procedure: START 1. are there absorptions above 2700 cm -1 --YES: very broad and intense? --YES: probably -OH --NO: go to #2 --NO: go to #5 2. is there a weak absorption from cm -1? --YES: could be aromatic ring hydrogen or alkene hydrogen stretch --NO: go to #3 3. is there a sharp absorption from cm -1? --YES: could be simple alkane hydrogen stretch --NO: go to #4 4. is there a medium, sharp absorption from cm -1? --YES: NH (if singlet) or NH2 (if doublet) stretch --NO: go to #5 5. are there absorptions between 2000 and 1500 cm -1? --YES: intense, from cm-1? --YES: probably C=O --NO: go to #6 --NO: C=O, aromatic and secondary amine probably absent; go to #8 6. is there a sharp, medium absorption close to 1500 or 1600 cm -1? --YES: could be aromatic or secondary amine --NO: go to #7
71 7. is there a sharp, medium absorption from cm -1? --YES: probably an alkene --NO: go to #8 8. are there absorptions between cm -1? --YES: intense between cm-1? --YES: could be C-C, C-O, or C-N stretches --NO: go to #11 --NO: C-O, C-N, CH 2, CH 3 probably absent; go to #11 9. is there a medium, sharp absorption at 1375 cm -1? --YES: could be -CH 3 --NO: go to # is there a medium, sharp absorption at 1450 cm -1? --YES: could be -CH 2 - or -CH 3 --NO: go to # are there strong absorptions below 900 cm -1? --YES: sharp at 720 cm-1 could be -CH OTHERS: aromatic*, alkene or monochloro C-Cl possible END * aromatic substitution patterns (may not show): mono cm cm-1 1,2-di cm-1 1,3-di cm cm-1 1,4-di cm-1
 1479 C=C (stretch) 1036 =C-H (bending in ring plane)")
 2930, 2850 CH 2 (sp 3, stretch) 1067")
72 Exercises: Alkene - Pentene Frequency in cm -1 Assignment 3035, 3060, 3090 C-H (sp 2, aromatic) 1479 C=C (stretch) 1036 =C-H (bending in ring plane) 673 =C-H (oop bending) Alcohols - Cyclohexanol Frequency in cm -1 Assignment O-H (stretch) 2930, 2850 CH 2 (sp 3, stretch) 1067 C-O (stretch)
 2932 C-H (sp 3, stretch) 1711 C=O (stretch) Primary")

73 Carboxylic Acid - Hexanoic Acid Frequency in cm -1 Assignment O-H (stretch, O-H bridges) 2932 C-H (sp 3, stretch) 1711 C=O (stretch) Primary Amine - Propylamine Frequency in cm -1 Assignment 3367, 3280 N-H (stretch, two peaks!) 2958 C-H (sp 3, stretch) 1607 N-H (broad, scissoring) 816 N-H (broad, oop bending)
 2964 C-H (sp 3, stretch) 1452 CH 3 (bend) 1378 CH 2, CH 3 (bend)")
 1801 C=O (stretch) 753 C-Cl")
74 Secondary Amine - Diethylamine Frequency in cm -1 Assignment 3280 N-H (stretch, one peak only) 2964 C-H (sp 3, stretch) 1452 CH 3 (bend) 1378 CH 2, CH 3 (bend) 776 N-H (oop bending) Carboxylic Acid Chloride Frequency in cm -1 Assignment 3560 overtone from C=O peak 2963 C-H (sp 3, stretch) 1801 C=O (stretch) 753 C-Cl (stretch)
 1819 C=O (asym. stretch) 1751 C=O (sym.")
 1743 C=O (stretch) 1243, 1031")
75 Carboxylic Acid Anhydrides Frequency in cm -1 Assignment 2987 C-H (sp 3, stretch) 1819 C=O (asym. stretch) 1751 C=O (sym. stretch) 1094 C-O (stretch) Ester - Butyl acetate Frequency in cm -1 Assignment 2962 C-H (sp3, stretch) 1743 C=O (stretch) 1243, 1031 C-O-C (stretch)
 1554 NO")
 Propionamide Frequency in cm -1")
 2920 C-H (sp 3,")
76 1-Nitropropane Frequency in cm -1 Assignment 2978 C-H (sp 3, stretch) 1554 NO 2 (asym. stretch) 1387 NO 2 (sym. stretch) Propionamide Frequency in cm -1 Assignment 3362, 3200 N-H (stretch, two peaks for a primary amide) 2920 C-H (sp 3, stretch) 1661 C=O (stretch)
77 Which of the following substances correspond to given IR spectra? Indicate at least two IR bands related to functional groups from chosen substance: O O O H 3 C N CH 3 OCH 2 CH 3 O O O H H 3 C A B C D E O O 1 2
78 3 4 5
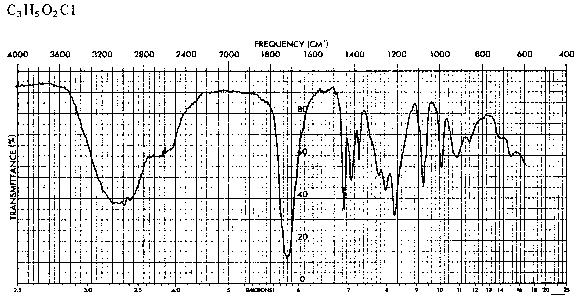
79 The three next infrared spectra are from compounds whose elemental composition is given at the upper left hand corner of each plot (C 3 H 3 Br, C 4 H 4 O 3, C 3 H 5 O 2 Cl). From the spectra and the summary tables of characteristic vibrational frequencies, deduce the structure of each compound, explaining your reasoning throughout.
80
81
Infrared Spectroscopy
 Infrared Spectroscopy Introduction Spectroscopy is an analytical technique which helps determine structure. It destroys little or no sample. The amount of light absorbed by the sample is measured as wavelength
SPECTROSCOPY MEASURES THE INTERACTION BETWEEN LIGHT AND MATTER
 SPECTROSCOPY MEASURES THE INTERACTION BETWEEN LIGHT AND MATTER c = c: speed of light 3.00 x 10 8 m/s (lamda): wavelength (m) (nu): frequency (Hz) Increasing E (J) Increasing (Hz) E = h h - Planck s constant
Infrared Spectroscopy An Instrumental Method for Detecting Functional Groups
 Infrared Spectroscopy An Instrumental Method for Detecting Functional Groups 1 The Electromagnetic Spectrum Infrared Spectroscopy I. Physics Review Frequency, υ (nu), is the number of wave cycles that
Structure Determination. How to determine what compound that you have? One way to determine compound is to get an elemental analysis
 Structure Determination How to determine what compound that you have? ne way to determine compound is to get an elemental analysis -basically burn the compound to determine %C, %H, %, etc. from these percentages
Infrared Spectroscopy used to analyze the presence of functional groups (bond types) in organic molecules How IR spectroscopy works:
 in organic molecules How IR spectroscopy works:") Infrared Spectroscopy used to analyze the presence of functional groups (bond types) in organic molecules It is the study of the interaction of infrared energy with organic molecules; the process analyzes
Infrared Spectroscopy used to analyze the presence of functional groups (bond types) in organic molecules It is the study of the interaction of infrared energy with organic molecules; the process analyzes
Table 8.2 Detailed Table of Characteristic Infrared Absorption Frequencies
 Table 8.2 Detailed Table of Characteristic Infrared Absorption Frequencies The hydrogen stretch region (3600 2500 cm 1 ). Absorption in this region is associated with the stretching vibration of hydrogen
Infrared Spectroscopy
 Infrared Spectroscopy IR Spectroscopy Used to identify organic compounds IR spectroscopy provides a 100% identification if the spectrum is matched. If not, IR at least provides information about the types
Chapter 12 Mass Spectrometry and Infrared Spectroscopy
 Organic Chemistry, 6 th Edition L. G. Wade, Jr. Chapter 12 Mass Spectrometry and Infrared Spectroscopy Jo Blackburn Richland College, Dallas, TX Dallas County Community College District 2006, Prentice
Lecture 11. IR Theory. Next Class: Lecture Problem 4 due Thin-Layer Chromatography
 Lecture 11 IR Theory Next Class: Lecture Problem 4 due Thin-Layer Chromatography This Week In Lab: Ch 6: Procedures 2 & 3 Procedure 4 (outside of lab) Next Week in Lab: Ch 7: PreLab Due Quiz 4 Ch 5 Final
1.1. IR is part of electromagnetic spectrum between visible and microwave
 CH2SWK 44/6416 IR Spectroscopy 2013Feb5 1 1. Theory and properties 1.1. IR is part of electromagnetic spectrum between visible and microwave 1.2. 4000 to 400 cm -1 (wave numbers) most interesting to organic
Química Orgânica I. Ciências Farmacêuticas Bioquímica Química. IR spectroscopy AFB QO I 2007/08 1 AFB QO I 2007/08 2
 Química Orgânica I Ciências Farmacêuticas Bioquímica Química AFB QO I 2007/08 1 IR spectroscopy AFB QO I 2007/08 2 1 Adaptado de: Organic Chemistry, 6th Edition; L. G. Wade, Jr. Organic Chemistry, William
Infra-red Spectroscopy
 Molecular vibrations are associated with the absorption of energy (infrared activity) by the molecule as sets of atoms (molecular moieties) vibrate about the mean center of their chemical bonds. Infra-red
General Infrared Absorption Ranges of Various Functional Groups
 General Infrared Absorption Ranges of Various Functional Groups Frequency Range Bond Type of Compound cm -1 Intensity C Alkanes 2850-2970 Strong 1340-1470 Strong C Alkenes 3010-3095 Medium 675-995 Strong
Symmetric Stretch: allows molecule to move through space
 BACKGROUND INFORMATION Infrared Spectroscopy Before introducing the subject of IR spectroscopy, we must first review some aspects of the electromagnetic spectrum. The electromagnetic spectrum is composed
Vibrations. Matti Hotokka
 Vibrations Matti Hotokka Identify the stuff I ve seen this spectrum before. I know what the stuff is Identify the stuff Let s check the bands Film: Polymer Aromatic C-H Aliphatic C-H Group for monosubstituted
Infrared Spectroscopy: Identification of Unknown Substances
 Infrared Spectroscopy: Identification of Unknown Substances Suppose a white powder is one of the four following molecules. How can they be differentiated? H N N H H H H Na H H H H H A technique that is
Infrared Spectroscopy
 x-rays ultraviolet (UV) visible Infrared (I) microwaves radiowaves near I middle I far I λ (cm) 8 x 10⁻⁵ 2.5 x 10⁻⁴ 2.5 x 10⁻³ 2.5 x 10⁻² µ 0.8 2.5 25 250 ν (cm -1 ) 13,000 4,000 400 40 ν (cm -1 1 ) =
Radiant energy is proportional to its frequency (cycles/s = Hz) as a wave (Amplitude is its height) Different types are classified by frequency or
 as a wave (Amplitude is its height) Different types are classified by frequency or") CHEM 241 UNIT 5: PART B INFRA-RED RED SPECTROSCOPY 1 Spectroscopy of the Electromagnetic Spectrum Radiant energy is proportional to its frequency (cycles/s = Hz) as a wave (Amplitude is its height) Different
CHEM 241 UNIT 5: PART B INFRA-RED RED SPECTROSCOPY 1 Spectroscopy of the Electromagnetic Spectrum Radiant energy is proportional to its frequency (cycles/s = Hz) as a wave (Amplitude is its height) Different
Advanced Pharmaceutical Analysis
 Lecture 2 Advanced Pharmaceutical Analysis IR spectroscopy Dr. Baraa Ramzi Infrared Spectroscopy It is a powerful tool for identifying pure organic and inorganic compounds. Every molecular compound has
Application of IR Raman Spectroscopy
 Application of IR Raman Spectroscopy 3 IR regions Structure and Functional Group Absorption IR Reflection IR Photoacoustic IR IR Emission Micro 10-1 Mid-IR Mid-IR absorption Samples Placed in cell (salt)
CH 3. mirror plane. CH c d
 CAPTER 20 Practice Exercises 20.1 The index of hydrogen deficiency is two. The structural possibilities include two double bonds, a double do 20.3 (a) As this is an alkane, it contains only C and and has
How to Interpret an Infrared (IR) Spectrum
 Spectrum") How to Interpret an Infrared (IR) Spectrum Infrared (IR) Spectroscopy allows the identification of particular bonds present within molecules. In this class we have simplified IR analysis by only focusing
How to Interpret an Infrared (IR) Spectrum Infrared (IR) Spectroscopy allows the identification of particular bonds present within molecules. In this class we have simplified IR analysis by only focusing
WEBSITE DATA FOR CHAPTER 6
 66 WEBSITE DATA FOR CHAPTER 6 Spectroscopic Identification of Organic Compounds by Infared Spectroscopy I. INTRODUCTION NOTE. It should be pointed out that a reciprocal centimeter is not a unit of frequency.
Infrared Spectroscopy
 Infrared Spectroscopy (Chapter 12) 1 This reaction from Ochem 1 How do we know if it worked? The reactant is cyclohexene; the product is cyclohexanol. How can we tell the difference? Infrared Spectroscopy
Vibrational Spectroscopy
 Vibrational Spectroscopy In this part of the course we will look at the kind of spectroscopy which uses light to excite the motion of atoms. The forces required to move atoms are smaller than those required
More information can be found in Chapter 12 in your textbook for CHEM 3750/ 3770 and on pages in your laboratory manual.
 CHEM 3780 rganic Chemistry II Infrared Spectroscopy and Mass Spectrometry Review More information can be found in Chapter 12 in your textbook for CHEM 3750/ 3770 and on pages 13-28 in your laboratory manual.
12. Structure Determination: Mass Spectrometry and Infrared Spectroscopy
 12. Structure Determination: Mass Spectrometry and Infrared Spectroscopy Determining the Structure of an Organic Compound The analysis of the outcome of a reaction requires that we know the full structure
Lecture 13 Organic Chemistry 1
 EM 232 rganic hemistry I at hicago Lecture 13 rganic hemistry 1 Professor Duncan Wardrop February 23, 2010 1 EM 232 rganic hemistry I at hicago Spectroscopy & Spectrometry hapter 13 2 EM 232 rganic hemistry
Infrared Spectroscopy. Provides information about the vibraions of functional groups in a molecule
 Infrared Spectroscopy Provides information about the vibraions of functional groups in a molecule Therefore, the functional groups present in a molecule can be deduced from an IR spectrum Two important
EXPT. 7 CHARACTERISATION OF FUNCTIONAL GROUPS USING IR SPECTROSCOPY
 EXPT. 7 CHARACTERISATION OF FUNCTIONAL GROUPS USING IR SPECTROSCOPY Structure 7.1 Introduction Objectives 7.2 Principle 7.3 Requirements 7.4 Strategy for the Interpretation of IR Spectra 7.5 Practice Problems
ORGANIC - BROWN 8E CH INFRARED SPECTROSCOPY.
 !! www.clutchprep.com CONCEPT: PURPOSE OF ANALYTICAL TECHNIQUES Classical Methods (Wet Chemistry): Chemists needed to run dozens of chemical reactions to determine the type of molecules in a compound.
Spectroscopy in Inorganic Chemistry. Vibration and Rotation Spectroscopy
 Spectroscopy in Inorganic Chemistry Vibrational energy levels in a diatomic molecule f = k r r V = ½kX 2 Force constant r Displacement from equilibrium point 2 X= r=r-r eq V = ½kX 2 Fundamental Vibrational
Organic Compound Identification Using Infrared Spectroscopy. Description
 Return to paper Organic Compound Identification Using Infrared Spectroscopy Dr. Walt Volland, Bellevue Community College All rights reserved 1999, Bellevue, Washington Description This exercise is intended
Learning Guide for Chapter 3 - Infrared Spectroscopy
 Learning Guide for hapter 3 - Infrared Spectroscopy I. Introduction to spectroscopy - p 1 II. Molecular vibrations - p 3 III. Identifying functional groups - p 6 IV. Interpreting an IR spectrum - p 12
CHM 223 Organic Chemistry I Prof. Chad Landrie. Lecture 10: September 20, 2018 Ch. 12: Spectroscopy mass spectrometry infrared spectroscopy
 M 223 Organic hemistry I Prof. had Landrie Lecture 10: September 20, 2018 h. 12: Spectroscopy mass spectrometry infrared spectroscopy i>licker Question onsider a solution that contains 65g R enantiomer
Introduction. The analysis of the outcome of a reaction requires that we know the full structure of the products as well as the reactants
 Introduction The analysis of the outcome of a reaction requires that we know the full structure of the products as well as the reactants Spectroscopy and the Electromagnetic Spectrum Unlike mass spectrometry,
2. Infrared spectroscopy
 2. Infrared spectroscopy 2-1Theoretical principles An important tool of the organic chemist is Infrared Spectroscopy, or IR. IR spectra are acquired on a special instrument, called an IR spectrometer.
Learning Guide for Chapter 3 - Infrared Spectroscopy
 Learning Guide for hapter 3 - Infrared Spectroscopy I. Introduction to spectroscopy - p 1 II. Molecular vibrations - p 3 III. Identifying functional groups - p 6 IV. Interpreting an IR spectrum - p 12
MOLECULAR REPRESENTATIONS AND INFRARED SPECTROSCOPY
 MOLEULAR REPRESENTATIONS AND INFRARED SPETROSOPY A STUDENT SOULD BE ABLE TO: 1. Given a Lewis (dash or dot), condensed, bond-line, or wedge formula of a compound draw the other representations. 2. Give
1. Which compound would you expect to have the lowest boiling point? A) NH 2 B) NH 2
 NH 2 B) NH 2") MULTIPLE CICE QUESTINS Topic: Intermolecular forces 1. Which compound would you expect to have the lowest boiling point? A) N 2 B) N 2 C) N D) E) N Ans: : N 2 D Topic: Molecular geometry, dipole moment
MULTIPLE CICE QUESTINS Topic: Intermolecular forces 1. Which compound would you expect to have the lowest boiling point? A) N 2 B) N 2 C) N D) E) N Ans: : N 2 D Topic: Molecular geometry, dipole moment
Answers to Assignment #5
 Answers to Assignment #5 A. 9 8 l 2 5 DBE (benzene + 1 DBE) ( 9 2(9)+2-9 8+1+1 = 10 ˆ 5 DBE) nmr pattern of two doublets of equal integration at δ7.4 and 7.9 ppm means the group (the δ7.9 shift) IR band
Infrared Spectroscopy: How to use the 5 zone approach to identify functional groups
 Infrared Spectroscopy: How to use the 5 zone approach to identify functional groups Definition: Infrared Spectroscopy is the study of the Infrared Spectrum. An Infrared Spectrum is the plot of photon energy
i e l d f Energy (E) = Direction visible ultraviolet X-ray gamma infrared
 = Direction visible ultraviolet X-ray gamma infrared") rganic Structure Determination Analytical hemistry Instrument-based methods for determination of structure of organic molecules 1) Infrared Spectroscopy - yields functional groups 2) M Spectroscopy - very
rganic Structure Determination Analytical hemistry Instrument-based methods for determination of structure of organic molecules 1) Infrared Spectroscopy - yields functional groups 2) M Spectroscopy - very
Infrared Spectral Interpretation
 Infrared Spectral Interpretation i Wherever you see this symbol, it is important to access the on-line course as there is interactive material that cannot be fully shown in this reference manual. 1 Contents
ORGANIC - BRUICE 8E CH MASS SPECT AND INFRARED SPECTROSCOPY
 !! www.clutchprep.com CONCEPT: PURPOSE OF ANALYTICAL TECHNIQUES Classical Methods (Wet Chemistry): Chemists needed to run dozens of chemical reactions to determine the type of molecules in a compound.
CHM Physical Chemistry II Chapter 12 - Supplementary Material. 1. Einstein A and B coefficients
 CHM 3411 - Physical Chemistry II Chapter 12 - Supplementary Material 1. Einstein A and B coefficients Consider two singly degenerate states in an atom, molecule, or ion, with wavefunctions 1 (for the lower
C h a p t e r F o u r t e e n: Structure Determination: Mass Spectrometry and Infrared Spectroscopy
 C h a p t e r F o u r t e e n: Structure Determination: Mass Spectrometry and Infrared Spectroscopy Cl OH Cl An electron ionization mass spectrum of 2,5-dichlorophenol CHM 323: Summary of Important Concepts
Fourier Transform Infrared Spectroscopy of Metal Ligand Complexes *
 OpenStax-CNX module: m34660 1 Fourier Transform Infrared Spectroscopy of Metal Ligand Complexes * Jiebo Li Andrew R. Barron This work is produced by OpenStax-CNX and licensed under the Creative Commons
Chemistry 343- Spring 2008
 Chemistry 343- Spring 2008 27 Chapter 2- Representative Carbon Compounds: Functional Groups, Intermolecular Forces and IR Spectroscopy A. ydrocarbons: Compounds composed of only C and Four Basic Types:
ORGANIC - CLUTCH CH ANALYTICAL TECHNIQUES: IR, NMR, MASS SPECT
 !! www.clutchprep.com CONCEPT: PURPOSE OF ANALYTICAL TECHNIQUES Classical Methods (Wet Chemistry): Chemists needed to run dozens of chemical reactions to determine the type of molecules in a compound.
Chapter 14 Spectroscopy
 hapter 14 Spectroscopy There are four major analytical techniques used for identifying the structure of organic molecules 1. Nuclear Magnetic Resonance or NMR is the single most important technique for
Chem 1075 Chapter 19 Organic Chemistry Lecture Outline
 Chem 1075 Chapter 19 Organic Chemistry Lecture Outline Slide 2 Introduction Organic chemistry is the study of and its compounds. The major sources of carbon are the fossil fuels: petroleum, natural gas,
ORGANIC - CLUTCH CH ANALYTICAL TECHNIQUES: IR, NMR, MASS SPECT
 !! www.clutchprep.com CONCEPT: PURPOSE OF ANALYTICAL TECHNIQUES Classical Methods (Wet Chemistry): Chemists needed to run dozens of chemical reactions to determine the type of molecules in a compound.
V( x) = V( 0) + dv. V( x) = 1 2
 = V( 0) + dv. V( x) = 1 2") Spectroscopy 1: rotational and vibrational spectra The vibrations of diatomic molecules Molecular vibrations Consider a typical potential energy curve for a diatomic molecule. In regions close to R e (at
Spectroscopy 1: rotational and vibrational spectra The vibrations of diatomic molecules Molecular vibrations Consider a typical potential energy curve for a diatomic molecule. In regions close to R e (at
8. Spectrum continued
 I. The ν(x-h) region alcohols H-bonding in alcohols Figs. 2.30,2.32,2.59,2.61,2.45 w 3400-3200 ν(o-h) amines s neat carboxylic acids increasing dilution 3600 free ν(o-h) w HN(C 4 H 9 ) 2 -NHbroad m-s 3500-3100
CHEM 3.2 (AS91388) 3 credits. Demonstrate understanding of spectroscopic data in chemistry
 3 credits. Demonstrate understanding of spectroscopic data in chemistry") CHEM 3.2 (AS91388) 3 credits Demonstrate understanding of spectroscopic data in chemistry Spectroscopic data is limited to mass, infrared (IR) and 13 C nuclear magnetic resonance (NMR) spectroscopy. Organic
CHEM 3.2 (AS91388) 3 credits Demonstrate understanding of spectroscopic data in chemistry Spectroscopic data is limited to mass, infrared (IR) and 13 C nuclear magnetic resonance (NMR) spectroscopy. Organic
Carbon Compounds. Chemical Bonding Part 2
 Carbon Compounds Chemical Bonding Part 2 Introduction to Functional Groups: Alkanes! Alkanes Compounds that contain only carbons and hydrogens, with no double or triple bonds.! Alkyl Groups A part of a
Infrared spectroscopy Basic theory
 Infrared spectroscopy Basic theory Dr. Davide Ferri Paul Scherrer Institut 056 310 27 81 davide.ferri@psi.ch Importance of IR spectroscopy in catalysis IR Raman NMR XAFS UV-Vis EPR 0 200 400 600 800 1000
75. A This is a Markovnikov addition reaction. In these reactions, the pielectrons in the alkene act as a nucleophile. The strongest electrophile will
 71. B SN2 stands for substitution nucleophilic bimolecular. This means that there is a bimolecular rate-determining step. Therefore, the reaction will follow second-order kinetics based on the collision
Using NMR and IR Spectroscopy to Determine Structures Dr. Carl Hoeger, UCSD
 Using NMR and IR Spectroscopy to Determine Structures Dr. Carl Hoeger, UCSD The following guidelines should be helpful in assigning a structure from NMR (both PMR and CMR) and IR data. At the end of this
Organic Spectra Infra Red Spectroscopy H. D. Roth. THEORY and INTERPRETATION of ORGANIC SPECTRA H. D. Roth. Infra Red Spectroscopy
 rganic Spectra Infra Red Spectroscopy. D. Roth TERY and INTERPRETATIN of RGANI SPETRA. D. Roth Infra Red Spectroscopy Infrared spectroscopy (IR) is an analytical technique concerned with molecular vibrations
Chapter 5. Infrared Spectrophotometry
 Chapter 5 Infrared Spectrophotometry n = wavenumbers (cm -1 ) n = The units used on IR spectrum WAVENUMBERS ( n ) 1 l (cm) n = frequency = nc or l = wavelength (cm) c = speed of light c = 3 x 10 10 cm/sec
Look for absorption bands in decreasing order of importance:
 1. Match the following to their IR spectra (30 points) Look for absorption bands in decreasing order of importance: a e a 2941 1716 d f b 3333 c b 1466 1.the - absorption(s) between 3100 and 2850 cm-1.
6. CHARACTERIZATION OF AS (III) IONS BIOSORPTION BY THE LIVE, HEAT AND ALKALINE- TREATED FUNGAL BIOMASS ON THE BASICS OF SURFACE STUDIES
 IONS BIOSORPTION BY THE LIVE, HEAT AND ALKALINE- TREATED FUNGAL BIOMASS ON THE BASICS OF SURFACE STUDIES") 6. CHARACTERIZATION OF AS (III) IONS BIOSORPTION BY THE LIVE, HEAT AND ALKALINE- TREATED FUNGAL BIOMASS ON THE BASICS OF SURFACE STUDIES 6. Introduction Infrared spectroscopy is a technique used to identify
6. CHARACTERIZATION OF AS (III) IONS BIOSORPTION BY THE LIVE, HEAT AND ALKALINE- TREATED FUNGAL BIOMASS ON THE BASICS OF SURFACE STUDIES 6. Introduction Infrared spectroscopy is a technique used to identify
7a. Structure Elucidation: IR and 13 C-NMR Spectroscopies (text , , 12.10)
") 2009, Department of Chemistry, The University of Western Ontario 7a.1 7a. Structure Elucidation: IR and 13 C-NMR Spectroscopies (text 11.1 11.5, 12.1 12.5, 12.10) A. Electromagnetic Radiation Energy is
2009, Department of Chemistry, The University of Western Ontario 7a.1 7a. Structure Elucidation: IR and 13 C-NMR Spectroscopies (text 11.1 11.5, 12.1 12.5, 12.10) A. Electromagnetic Radiation Energy is
2FAMILIES OF CARBON COMPOUNDS:
 P1: PBU/VY P2: PBU/VY Q: PBU/VY T1: PBU Printer: Bind Rite JWL338-02 JWL338-Solomons-v1 April 23, 2010 21:49 2AMILIES ARB MPUDS: UTIAL GRUPS, ITERMLEULAR RES, AD IRARED (IR) SPETRSPY SLUTIS T PRBLEMS 2.1
Electronegativity Scale F > O > Cl, N > Br > C, H
 Organic Chem Chapter 12 Alkanes Organic chemistry is the study of carbon compounds. Carbon has several properties that are worth discussing: Tetravalent Always forms 4 bonds Can form multiple bonds (double
(2) Read each statement carefully and pick the one that is incorrect in its information.
 Read each statement carefully and pick the one that is incorrect in its information.") Organic Chemistry - Problem Drill 17: IR and Mass Spectra No. 1 of 10 1. Which statement about infrared spectroscopy is incorrect? (A) IR spectroscopy is a method of structure determination based on the
Organic Chemistry - Problem Drill 17: IR and Mass Spectra No. 1 of 10 1. Which statement about infrared spectroscopy is incorrect? (A) IR spectroscopy is a method of structure determination based on the
Carboxylic Acids and Nitriles
 Carboxylic Acids and Nitriles Why this Chapter? Carboxylic acids present in many industrial processes and most biological processes They are the starting materials from which other acyl derivatives are
STRUCTURE ELUCIDATION BY INTEGRATED SPECTROSCOPIC METHODS
 Miscellaneous Methods UNIT 14 STRUCTURE ELUCIDATION BY INTEGRATED SPECTROSCOPIC METHODS Structure 14.1 Introduction Objectives 14.2 Molecular Formula and Index of Hydrogen Deficiency 14.3 Structural Information
Types of Molecular Vibrations
 Important concepts in IR spectroscopy Vibrations that result in change of dipole moment give rise to IR absorptions. The oscillating electric field of the radiation couples with the molecular vibration
ORGANIC - EGE 5E CH UV AND INFRARED MASS SPECTROMETRY
 !! www.clutchprep.com CONCEPT: IR SPECTROSCOPY- FREQUENCIES There are specific absorption frequencies in the functional group region that we should be familiar with EXAMPLE: What are the major IR absorptions
EXPT. 9 DETERMINATION OF THE STRUCTURE OF AN ORGANIC COMPOUND USING UV, IR, NMR AND MASS SPECTRA
 EXPT. 9 DETERMINATION OF THE STRUCTURE OF AN ORGANIC COMPOUND USING UV, IR, NMR AND MASS SPECTRA Structure 9.1 Introduction Objectives 9.2 Principle 9.3 Requirements 9.4 Strategy for the Structure Elucidation
Key ideas: In EAS, pi bond is Nu and undergoes addition.
 Objective 7. Apply addition and elimination concepts to predict electrophilic aromatic substitution reactions (EAS) of benzene and monosubstituted benzenes. Skills: Draw structure ID structural features
ORGANIC - EGE 5E CH. 2 - COVALENT BONDING AND CHEMICAL REACTIVITY
 !! www.clutchprep.com CONCEPT: HYBRID ORBITAL THEORY The Aufbau Principle states that electrons fill orbitals in order of increasing energy. If carbon has only two unfilled orbitals, why does it like to
Welcome to Organic Chemistry II
 Welcome to Organic Chemistry II Erika Bryant, Ph.D. erika.bryant@hccs.edu Class Syllabus 3 CHAPTER 12: STRUCTURE DETERMINATION 4 What is this solution Soda Tea Coffee??? 5 What is this solution Soda Tea
Experiment 11: NUCLEAR MAGNETIC RESONANCE SPECTROSCOPY
 Experiment 11: NUCLEAR MAGNETIC RESONANCE SPECTROSCOPY Purpose: This is an exercise to introduce the use of nuclear magnetic resonance spectroscopy, in conjunction with infrared spectroscopy, to determine
Molecular Geometry: VSEPR model stand for valence-shell electron-pair repulsion and predicts the 3D shape of molecules that are formed in bonding.
 Molecular Geometry: VSEPR model stand for valence-shell electron-pair repulsion and predicts the 3D shape of molecules that are formed in bonding. Sigma and Pi Bonds: All single bonds are sigma(σ), that
William H. Brown & Christopher S. Foote
 Requests for permission to make copies of any part of the work should be mailed to:permissions Department, Harcourt Brace & Company, 6277 Sea Harbor Drive, Orlando, Florida 32887-6777 William H. Brown
Chapter 24. Amines. Based on McMurry s Organic Chemistry, 7 th edition
 Chapter 24. Amines Based on McMurry s Organic Chemistry, 7 th edition Amines Organic Nitrogen Compounds Organic derivatives of ammonia, NH 3, Nitrogen atom with a lone pair of electrons, making amines
Objective 4. Determine (characterize) the structure of a compound using IR, NMR, MS.
 the structure of a compound using IR, NMR, MS.") Objective 4. Determine (characterize) the structure of a compound using IR, NMR, MS. Skills: Draw structure IR: match bond type to IR peak NMR: ID number of non-equivalent H s, relate peak splitting to
Objective 4. Determine (characterize) the structure of a compound using IR, NMR, MS. Skills: Draw structure IR: match bond type to IR peak NMR: ID number of non-equivalent H s, relate peak splitting to
Spectroscopy. Fourier Transform Infrared (FT-IR) Spectroscopy
 Spectroscopy") Fourier Transform Infrared (FT-IR) Spectroscopy Learning objectives Learning outcomes After completing this course, the student will be able to: Recognize the concept and principle of FT-IR Spectroscopy
Fourier Transform Infrared (FT-IR) Spectroscopy Learning objectives Learning outcomes After completing this course, the student will be able to: Recognize the concept and principle of FT-IR Spectroscopy
Chapter 20: Carboxylic Acids and Nitriles شیمی آلی 2
 Chapter 20: Carboxylic Acids and Nitriles شیمی آلی 2 Dr M. Mehrdad University of Guilan, Department of Chemistry, Rasht, Iran m-mehrdad@guilan.ac.ir Based on McMurry s Organic Chemistry, 7 th edition The
Learning Organic Chemistry
 Objective 1 Represent organic molecules with chemical formulas, expanded formulas, Lewis structures, skeletal structures. Determine shape (VSEPR), bond polarity, and molecule polarity. Identify functional
2016 Pearson Education, Inc. Isolated and Conjugated Dienes
 2016 Pearson Education, Inc. Isolated and Conjugated Dienes 2016 Pearson Education, Inc. Reactions of Isolated Dienes 2016 Pearson Education, Inc. The Mechanism Double Bonds can have Different Reactivities
Alkanes, Alkenes and Alkynes
 Alkanes, Alkenes and Alkynes Hydrocarbons Hydrocarbons generally fall into 2 general groupings, aliphatic hydrocarbons and aromatic hydrocarbons. Aliphatic hydrocarbons contain chains and rings of hydrocarbons,
E35 SPECTROSCOPIC TECHNIQUES IN ORGANIC CHEMISTRY
 E35 SPECTRSCPIC TECNIQUES IN RGANIC CEMISTRY Introductory Comments. These notes are designed to introduce you to the basic spectroscopic techniques which are used for the determination of the structure
CHEM 3760 Orgo I, F14 (Lab #11) (TECH 710)
 (TECH 710)") CHEM 3760 Orgo I, F14 (Lab #11) (TECH 710) Identification of an Unknown by IR PRELAB (PreLab is due before entering the lab.) Every student has to prepare for each experiment by answering the Pre-Laboratory
CHEM 3760 Orgo I, F14 (Lab #11) (TECH 710) Identification of an Unknown by IR PRELAB (PreLab is due before entering the lab.) Every student has to prepare for each experiment by answering the Pre-Laboratory
Chapter 25: The Chemistry of Life: Organic and Biological Chemistry
 Chemistry: The Central Science Chapter 25: The Chemistry of Life: Organic and Biological Chemistry The study of carbon compounds constitutes a separate branch of chemistry known as organic chemistry The
CHAPTER 2: Structure and Properties of Organic Molecules
 1 HAPTER 2: Structure and Properties of Organic Molecules Atomic Orbitals A. What are atomic orbitals? Atomic orbitals are defined by special mathematical functions called wavefunctions-- (x, y, z). Wavefunction,
Chemistry 2. Assumed knowledge
 Chemistry 2 Lecture 8 IR Spectroscopy of Polyatomic Molecles Assumed knowledge There are 3N 6 vibrations in a non linear molecule and 3N 5 vibrations in a linear molecule. Only modes that lead to a change
Chapter 13 Conjugated Unsaturated Systems
 Chapter 13 Conjugated Unsaturated Systems Introduction Conjugated unsaturated systems have a p orbital on a carbon adjacent to a double bond The p orbital can come from another double or triple bond The
Homework Assignment #3
 Chemistry 12600 Spring 2016 Homework Assignment #3 1. Determine whether each of the following statements is true or false. If the statement is false, modify and rewrite it so that it is a true statement.
Chapter 1 Reactions of Organic Compounds. Reactions Involving Hydrocarbons
 Chapter 1 Reactions of Organic Compounds Reactions Involving Hydrocarbons Reactions of Alkanes Single bonds (C-C) are strong and very hard to break, therefore these compounds are relatively unreactive
Lab 6. Use of VSEPR to Predict Molecular Structure and IR Spectroscopy to Identify an Unknown
 Lab 6. Use of VSEPR to Predict Molecular Structure and IR Spectroscopy to Identify an Unknown Prelab Assignment Before coming to lab: In addition to reading introduction of this lab handout, read and understand
Detailed Course Content
 Detailed Course Content Chapter 1: Carbon Compounds and Chemical Bonds The Structural Theory of Organic Chemistry 4 Chemical Bonds: The Octet Rule 6 Lewis Structures 8 Formal Charge 11 Resonance 14 Quantum
UV / Visible Spectroscopy. Click icon to add picture
 UV / Visible Spectroscopy Click icon to add picture Spectroscopy It is the branch of science that deals with the study of interaction of matter with light. OR It is the branch of science that deals with
Structure Determination
 There are more than 5 million organic compounds, the great majority of which are colourless liquids or white solids. Identifying or at least characterising determining some of its properties and features
MASS and INFRA RED SPECTROSCOPY
 MASS and INFRA RED SPECTRSCPY Mass Spectroscopy The mass spectrometer was looked at in Unit 1. It was noted there that compounds produce fragmentation patterns when passes through a mass spectrometer.