Spectroscopy: Introduction. Required reading Chapter 18 (pages ) Chapter 20 (pages )
|
|
|
- Bertha Golden
- 5 years ago
- Views:
Transcription
1 Spectroscopy: Introduction Required reading Chapter 18 (pages ) Chapter 20 (pages )
2 Spectrophotometry is any procedure that uses light to measure chemical concentrations Properties of Light
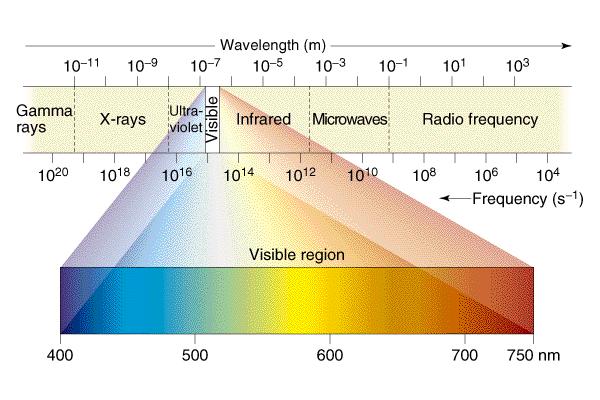
3 electromagnetic radiation energy that moves by means of oscillating, perpendicular electric and magnetic fields. "Visible Light" is one small part of electromagnetic radiation. Wavelength (λ) distance between successive crests of a wave Frequency (ν) number of wave crests passing a point in space per unit time (second) one hertz is one cycle per second (1/s) The wavelength and frequency of light are related: λ x ν = c (c = speed of light in vacuum = x 10 8 m/s)
4 Regions of the Electromagnetic Spectrum Frequency Wavelength Energy Name Uses to Nuclear Gamma Rays Cancer treatment to Electronic X rays imaging to Electronic Ultraviolet Black Lights to Electronic Visible Illumination to Vibrational Infrared Heating 10 9 to Rotational Microwave Cooking 10 5 to Radio Signal Transmission
5
6 photon individual bundles of energy; each photon has an energy that is directly proportional to the frequency: E photon = hn photon (h = x J s) Often, we like to express the frequency in terms of inverse wavelength, E = h n = h c/l = h c s where σ is called the wavenumber. We will use this in infrared spectrometry.
7 Light of various wavelengths or energies does different things with matter: The absorption of light by a molecule causes an increase in the energy of the molecule. This may be in terms of an increase in vibrational, rotational, electronic or other types of molecular energy states. Typically, in the UV-Vis region, we will disturb electronic states by the absorption of light in the range of nm.
8 Excited State Ground State Absorption at l If a molecule absorbs energy from a photon, then an electron can be promoted to a higher energy level in that molecule. That electron originally "resided" in a molecular orbital of the molecule which is at a relatively low energy, we call that the GROUND STATE. The new place of residence for the excited electron is a higher energy molecular orbital. The excited energy level of the molecule has not only an electronic energy level associated with it, but also vibrational and rotational energy levels.
9 Basically, we have to dissipate the quantized energy in the different vibrational, rotational and electronic states of the molecule. Absorption at l } Vibrational States Excited Electronic State Relaxation Vibrational States Vibrational States } Ground Electronic State Time 1 Time 2 Vibrational States
10 So, the absorbed energy can be dissipated in a lot of different ways, as shown in the JABLONSKI DIAGRAM below:
11 Fluorescence occurs on a timescale of about 10-6 sec. Phosphorescence is much slower, about 1 to 10-6 sec. This is because the electron has undergone spin inversion. Remember the Pauli Exclusion Principle.
12 What if we have a sample holder known as a cuvette in the path of Electromagnetic radiation of some energy: l l l l l Lamp l Wavelength Selector Detector
13 If the incident light has an incident power, P o, and the exiting light has intensity, P, then the transmittance through the path length b (cm) of the sample is: T = P/P o (Range of 0 to 1) The absorbance at that wavelength is: A(λ) = -log(p/po) = -log(t)
14 If we do some calculus, we come up with the Beer-Lambert Law: A(l) = e l b C (dimensionless) Beer's Law will deviate at high concentrations of analyte. Solvent is chemically affected by high concentrations of analyte, thus impacting e The distribution of analyte components as a result of equilibria events is drastically affected by high analyte concentrations An absorption spectrum is a graph showing how A varies with λ. λ max Absorption Spectrum
15 Note: Any substance that absorbs visible light will appear colored when white light is transmitted through it or reflected from it. The substance absorbs certain wavelengths of the white light, and our eyes detect the wavelengths that are not absorbed. The observed color is called the complement of the absorbed color.
16 The Absorption Spectrophotometer Light from a continuous source is passed through a monochromator. This monochromatic light travels through a sample of pathlength b, and the radiant power of the emergent light is measured. Visible light generated from a quartz halogen lamp. UV light generated from a deuterium arc lamp. cuvette sample cell that has flat quartz faces. Quartz transmits both UV and visible light plastic or glass only transmits visible light.
17 Single-beam Spectrophotometer First measure Po for a reference cuvette containing pure solvent. Then replace reference cuvette (containing the blank) with cuvette containing sample to measure P. Block Diagram of Single-beam Spectrophotometer P 0 P Light source Monochromator Sample cell Detector Read out Inconvenient, somewhat inaccurate, poorly suited to continuous measurements
18 Double-beam Spectrophotometer Light passes alternately through the reference and sample cuvettes. A chopper is a mirror that rotates in and out of the light path diverting the light between the reference and sample cuvettes. Routine procedure is to first record a baseline spectrum with two reference cuvettes. The absorbance of the reference is then subtracted from the absorbance of the sample to obtain the "true" absorbance at each wavelength.
19 Double-beam Spectrophotometer
20 Precautions Most spectrophotometers operate best at values for A If absorbance too high, intensity is hard to measure. If absorbance too low, hard to distinguish between reference and sample Slight mismatches between reference and sample cuvettes leads to systematic error Samples must be dust free. Cuvettes must be wiped clean before use.
21 Light Sources Any object that is heated emits radiation. Emission from real objects such as a tungsten filament light bulb emulate blackbody radiation (the emission is a continuous spectral distribution). Visible and infrared lamps as light sources approach blackbody radiators. The radiation from an object's surface expressed as power per unit area is the exitance (emittance), M. M = s T 4 Where s is the Stefan-Boltzmann constant ~ 5.7 X 10⁻⁸ W/(m 2 K 4 ) T = Temperature (K)

22 Spectral Distribution of Blackbody Radiation
23 Lamps for Absorption Spectrometers Lamps are broad-band, polychromatic light sources. Typically they are inexpensive and stable. i) Visible and Near Infrared: Tungsten Lamp ii) Ultraviolet and Visible: Quartz Halogen Lamp iii) Ultraviolet: Deuterium Arc Lamp iv) Infrared: nichrome wire
24 Spectral Distribution of Different Light Sources
 Polarized (only one electric field vector) Coherent (electric/magnetic fields in phase) expensive high maintenance")
25 Lasers Lasers provide ~ single l Very bright sources for spectroscopy Properties of Lasers: Monochromatic (only one wavelength) Collimated (emit in one direction) Polarized (only one electric field vector) Coherent (electric/magnetic fields in phase) expensive high maintenance
26 Laser Operation Principles
27 Operation of a Laser Population Inversion: A higher energy state has a greater population of electrons than a lower energy state Lifetimes of electrons in various energy levels: E2 >> E3 or E1 Two popular lasers: helium-neon laser ~ red light Laser diode ~ solid state, p-n junction ~ red, or near IR

28 Wavelength Selection Devices Prisms were used in older instruments, Quartz or salt crystals. Monochromators separate wavelengths of light; they consist of both entrance & exit slits, mirrors, and diffraction grating or refraction lens/prisms, and filters.
29 Grating Monochromators Polychromatic light is collimated (focused) into a beam of parallel rays by a concave mirror (monochromatic-one wavelength; polychromaticmany wavelengths). Rays strike the reflection grating (see next figure) and different wavelengths are diffracted (separated) at different angles. Diffracted light is focussed by a second concave mirror so that only one wavelength passes through the exit slit at a time.
30 Grating Equation: nλ= d(sinθ-sinφ) n = diffraction order (1 n) d = groove spacing = angle of reflection = angle of incidence

31 Components of a Grating 1) diffraction grating Spectrophotometer
32 A diffraction grating is ruled with a series of closely spaced parallel grooves separated by distance d. These are often constructed from aluminum metal and coated with a non oxidative coating applied. When light is reflected from the grating, each groove behaves as a source of light. When adjacent rays are in phase, they reinforce each other. When adjacent rays are out of phase, the partially or completely cancel each other. Thus can be aligned to allow only certain wavelengths to pass through.
33 2) Slits Slits are constructed by machining a sharp edge onto two metal pieces. These lie in a plane and the spacing between them, the slit width, can be adjusted. The smaller the slit width, the better the spectral resolution. 3) Filters: Filters are used to pass on only desired wavelengths of light. A filter could be colored glass. Most likely they are also based on constructive or destructive interference of light waves.
34 4) Interferometers - alternative wavelength selection process
35 Interferometers allows all wavelengths to simultaneously reach the detector Radiation from source reaches beam splitter, where half of the radiation hits the moving mirror and half hits the fixed mirror. The beams reflect and re-combine, the emerging radiation for a wavelength exhibits constructive or destructive interference.
36 Interferometers With constant mirror velocity, the wavelength modulates in a regular sinusoidal manner. Both the sampling rate of radiation reaching the detector and the mirror velocity is modulated by a helium-neon laser. The resulting detector signal typically is stored as a time domain spectrum (interferogram). Converted to a spectrum in the frequency domain using the mathematical process of Fourier Transform.
37 Fourier Transform: 1) allows for signal averaging 2) allows all wavelengths to be monitored simultaneously 3) mathematical process that converts data obtained in the time domain to be converted into the frequency domain.
38 Fourier Transform FT is used quite extensively in IR (infrared), mass spectroscopy and in NMR (nuclear magnetic resonance) applications. In addition to IR spectroscopy, the use of Fourier transform has become quite common in certain spectroscopic methods due to the affordability of PCs.
39 Types of Detectors A detector produces an electric signal when struck by photons. Phototube detector
40 Phototube Detector The phototube is used frequently as a detector in UV-Vis spectrometers. The cathode consists of a photo-emissive surface. Electrons are ejected from the cathode proportional to the radiant power (photons) striking its surface. The emitted electrons are attracted to the anode. The accompanying voltage is fed to an amplifier and converted to a signal.

41 Photomultiplier Tubes The Photo Multiplier Tube, (PMT) is similar to the photo tube, but is a vast improvement.
42 Photomultiplier Tubes In addition to the cathode and anode, the PMT has dynodes, which produce a cascade effect on the electron emission production. Each photon causes a ~ 10 7 additional electrons to be produced. The PMT possesses high sensitivity, good S/N ratio, and excellent dynamic range. PMTs are highly sensitive to visible and UV excitations at extremely low power conditions, (very low concentrations of analyte). Intense light sources (such as daylight or stray light) can destroy and damage PMTs.

43 PHOTO DIODE ARRAY: silicon diode a) Schematic cross-sectional view of photodiode array b) Picture of array with 1024 elements, each 25 µm wide and 2.5 mm high. The central black rectangle is the photosensitive area. The entire chip is 5 cm in length.
44 PHOTO DIODE ARRAY Silicon diode detectors, such as those used in a photo diode arrays (PDA), are composed of reverse-biased p-n junctions formed on a silicon chip. The doping of different elements in the silicon can produce electron rich and electron poor domains. As seen in (a) holes and electrons are randomly distributed. The addition of an outside power source (b) causes a depletion layer where conductance is zero. When a photon of light strikes the junction (c), holes and electrons form which provide the completion of the circuit. The current is proportional to the radiant power.
45 Photodiode Arrays PDAs are a series of silicon photo diodes, with each having a storage capacitor, and a switch that are combined in a integrated circuit on a silicon chip. The number of sensors (silicon photodiodes) in a PDA range from 64 to 4096.
46 Photodiode Arrays The slit width of the instrument allows the radiation to be dispersed over the entire array, allowing the spectral information to be accumulated simultaneously. PDAs are not as sensitive nor have the same S/N ratio as the PMT, but one gains the advantage of gathering multichannel information (all of spectrum collected simultaneously). Advantage of the PDA is recording the entire spectrum in a fraction of the time required for a conventional scanning spectrometer to scan one wavelength at a time. An example of PDA use is in atomic emission spectroscopy (AES), UV-vis spectrophotometry, fluorescence spectrometry, Raman spectrometry.
47 Errors in Spectrophotometry Choice of the Wavelength and Bandwidth
48 For Quantitative Analysis Absorbance should not be too large or small(~ units) Absorbance should be measured at the lambda max providing no interference from other species at this lambda. Monochromator bandwidth should be as large as possible but small compared to the spectral bandwidth. Slit width to small allows less light to reach the analyte, smaller S/N ratio and precision. Too wide a monochromator band width (slit width) distorts the peak shapes of the spectrum.
49 As shown in the previous figure; the instrumental setting with the band width at 0.1 nm and the choice of 609 nm for l max would be desirable for the spectra shown. At the 2.0 nm setting there is no fine structure shown in this spectrum.
50 Stray Light, Electrical Noise, Cell Positioning Stray light arises from two major sources: 1) Misdirected rays coming from the monochromator. 2) Light coming from outside the instrument such as the sample compartment lid not closed properly.
51 Other concerns; the correct choice of the sample cell (does it require glass or quartz?) the alignment of the sample cell (and/or the sample cell holder) dust & fingerprints on the cell
52 Obtaining Quantitative Information from UVvis Absorption Spectrophotometry Beer's Law (aka Beer-Lambert Law) A = e X b X C where c is the concentration (M), b is the path length (cm), and e is the molar absorptivity (M 1 cm 1). e is wavelength dependent. Beer's Law works for dilute (~ 0.01 M) solutions in which the absorbing species is not participating in a concentration-dependent equilibrium.
Reference literature. (See: CHEM 2470 notes, Module 8 Textbook 6th ed., Chapters )
") September 17, 2018 Reference literature (See: CHEM 2470 notes, Module 8 Textbook 6th ed., Chapters 13-14 ) Reference.: https://slideplayer.com/slide/8354408/ Spectroscopy Usual Wavelength Type of Quantum
September 17, 2018 Reference literature (See: CHEM 2470 notes, Module 8 Textbook 6th ed., Chapters 13-14 ) Reference.: https://slideplayer.com/slide/8354408/ Spectroscopy Usual Wavelength Type of Quantum
Because light behaves like a wave, we can describe it in one of two ways by its wavelength or by its frequency.
 Light We can use different terms to describe light: Color Wavelength Frequency Light is composed of electromagnetic waves that travel through some medium. The properties of the medium determine how light
CHEM*3440. Photon Energy Units. Spectrum of Electromagnetic Radiation. Chemical Instrumentation. Spectroscopic Experimental Concept.
 Spectrum of Electromagnetic Radiation Electromagnetic radiation is light. Different energy light interacts with different motions in molecules. CHEM*344 Chemical Instrumentation Topic 7 Spectrometry Radiofrequency
10/2/2008. hc λ. νλ =c. proportional to frequency. Energy is inversely proportional to wavelength And is directly proportional to wavenumber
 CH217 Fundamentals of Analytical Chemistry Module Leader: Dr. Alison Willows Electromagnetic spectrum Properties of electromagnetic radiation Many properties of electromagnetic radiation can be described
2001 Spectrometers. Instrument Machinery. Movies from this presentation can be access at
 2001 Spectrometers Instrument Machinery Movies from this presentation can be access at http://www.shsu.edu/~chm_tgc/sounds/sound.html Chp20: 1 Optical Instruments Instrument Components Components of various
25 Instruments for Optical Spectrometry
 25 Instruments for Optical Spectrometry 25A INSTRUMENT COMPONENTS (1) source of radiant energy (2) wavelength selector (3) sample container (4) detector (5) signal processor and readout (a) (b) (c) Fig.
R O Y G B V. Spin States. Outer Shell Electrons. Molecular Rotations. Inner Shell Electrons. Molecular Vibrations. Nuclear Transitions
 Spin States Molecular Rotations Molecular Vibrations Outer Shell Electrons Inner Shell Electrons Nuclear Transitions NMR EPR Microwave Absorption Spectroscopy Infrared Absorption Spectroscopy UV-vis Absorption,
Instrumental Analysis: Spectrophotometric Methods
 Instrumental Analysis: Spectrophotometric Methods 2007 By the end of this part of the course, you should be able to: Understand interaction between light and matter (absorbance, excitation, emission, luminescence,fluorescence,
Spectroscopy. Page 1 of 8 L.Pillay (2012)
") Spectroscopy Electromagnetic radiation is widely used in analytical chemistry. The identification and quantification of samples using electromagnetic radiation (light) is called spectroscopy. Light has
Spectroscopy Electromagnetic radiation is widely used in analytical chemistry. The identification and quantification of samples using electromagnetic radiation (light) is called spectroscopy. Light has
Analytical Spectroscopy Review
 Analytical Spectroscopy Review λ = wavelength ν = frequency V = velocity = ν x λ = 2.998 x 10 8 m/sec = c (in a vacuum) ν is determined by source and does not change as wave propogates, but V can change
Lecture 0. NC State University
 Chemistry 736 Lecture 0 Overview NC State University Overview of Spectroscopy Electronic states and energies Transitions between states Absorption and emission Electronic spectroscopy Instrumentation Concepts
MOLECULAR AND ATOMIC SPECTROSCOPY
 MOLECULAR AND ATOMIC SPECTROSCOPY 1. General Background on Molecular Spectroscopy 3 1.1. Introduction 3 1.2. Beer s Law 5 1.3. Instrumental Setup of a Spectrophotometer 12 1.3.1. Radiation Sources 13 1.3.2.
Chemistry 311: Instrumentation Analysis Topic 2: Atomic Spectroscopy. Chemistry 311: Instrumentation Analysis Topic 2: Atomic Spectroscopy
 Topic 1: Atomic Spectroscopy Text: Chapter 12,13 & 14 Rouessac (~2 weeks) 1.0 Review basic concepts in Spectroscopy 2.0 Atomic Absorption and Graphite Furnace Instruments 3.0 Inductively Coupled Plasmas
Course Details. Analytical Techniques Based on Optical Spectroscopy. Course Details. Textbook. SCCH 211: Analytical Chemistry I
 SCCH 211: Analytical Chemistry I Analytical Techniques Based on Optical Spectroscopy Course Details September 22 October 10 September 22 November 7 November 17 December 1 Topic Period Introduction to Spectrometric
Reflection = EM strikes a boundary between two media differing in η and bounces back
 Reflection = EM strikes a boundary between two media differing in η and bounces back Incident ray θ 1 θ 2 Reflected ray Medium 1 (air) η = 1.00 Medium 2 (glass) η = 1.50 Specular reflection = situation
Ultraviolet-Visible and Infrared Spectrophotometry
 Ultraviolet-Visible and Infrared Spectrophotometry Ahmad Aqel Ifseisi Assistant Professor of Analytical Chemistry College of Science, Department of Chemistry King Saud University P.O. Box 2455 Riyadh 11451
Chapter 13 An Introduction to Ultraviolet/Visible Molecular Absorption Spectrometry
 Chapter 13 An Introduction to Ultraviolet/Visible Molecular Absorption Spectrometry 13A Measurement Of Transmittance and Absorbance Absorption measurements based upon ultraviolet and visible radiation
Design and Development of a Smartphone Based Visible Spectrophotometer for Analytical Applications
 Design and Development of a Smartphone Based Visible Spectrophotometer for Analytical Applications Bedanta Kr. Deka, D. Thakuria, H. Bora and S. Banerjee # Department of Physicis, B. Borooah College, Ulubari,
Outline of Recombinant DNA technology. Application of UV spectroscopy in recombinant DNA technology
 NIKHIL.K.POTDUKHE Outline of UV spectrophotometer Outline of Recombinant DNA technology Application of UV spectroscopy in recombinant DNA technology References Lambert law: When a beam of light is allowed
Skoog Chapter 6 Introduction to Spectrometric Methods
 Skoog Chapter 6 Introduction to Spectrometric Methods General Properties of Electromagnetic Radiation (EM) Wave Properties of EM Quantum Mechanical Properties of EM Quantitative Aspects of Spectrochemical
Compact Knowledge: Absorbance Spectrophotometry. Flexible. Reliable. Personal.
 L A B O R A T O R Y C O M P E T E N C E Compact Knowledge: Absorbance Spectrophotometry Flexible. Reliable. Personal. The interaction of light with molecules is an essential and well accepted technique
Ultraviolet-Visible and Infrared Spectrophotometry
 Ultraviolet-Visible and Infrared Spectrophotometry Ahmad Aqel Ifseisi Assistant Professor of Analytical Chemistry College of Science, Department of Chemistry King Saud University P.O. Box 2455 Riyadh 11451
If you like us, please share us on social media. The latest UCD Hyperlibrary newsletter is now complete, check it out.
 Sign In Forgot Password Register username username password password Sign In If you like us, please share us on social media. The latest UCD Hyperlibrary newsletter is now complete, check it out. ChemWiki
Chemistry 524--Final Exam--Keiderling Dec. 12, pm SES
 Chemistry 524--Final Exam--Keiderling Dec. 12, 2002 --4-8 pm -- 238 SES Please answer all questions in the answer book provided. Calculators, rulers, pens and pencils are permitted plus one 8.5 x 11 sheet
Electronic Excitation by UV/Vis Spectroscopy :
 SPECTROSCOPY Light interacting with matter as an analytical tool III Pharm.D Department of Pharmaceutical Analysis SRM College Of Pharmacy,Katankulathur Electronic Excitation by UV/Vis Spectroscopy : X-ray:
Chemistry Instrumental Analysis Lecture 19 Chapter 12. Chem 4631
 Chemistry 4631 Instrumental Analysis Lecture 19 Chapter 12 There are three major techniques used for elemental analysis: Optical spectrometry Mass spectrometry X-ray spectrometry X-ray Techniques include:
Overview of Spectroscopy
 Overview of Spectroscopy A. Definition: Interaction of EM Radiation with Matter We see objects because they remit some part of the light falling on them from a source. We function as reflection/ transmission
Model Answer (Paper code: AR-7112) M. Sc. (Physics) IV Semester Paper I: Laser Physics and Spectroscopy
 M. Sc. (Physics) IV Semester Paper I: Laser Physics and Spectroscopy") Model Answer (Paper code: AR-7112) M. Sc. (Physics) IV Semester Paper I: Laser Physics and Spectroscopy Section I Q1. Answer (i) (b) (ii) (d) (iii) (c) (iv) (c) (v) (a) (vi) (b) (vii) (b) (viii) (a) (ix)
Model Answer (Paper code: AR-7112) M. Sc. (Physics) IV Semester Paper I: Laser Physics and Spectroscopy Section I Q1. Answer (i) (b) (ii) (d) (iii) (c) (iv) (c) (v) (a) (vi) (b) (vii) (b) (viii) (a) (ix)
Chem 310 rd. 3 Homework Set Answers
 -1- Chem 310 rd 3 Homework Set Answers 1. A double line labeled S 0 represents the _ground electronic_ state and the _ground vibrational_ state of a molecule in an excitation state diagram. Light absorption
UNIT I COLORIMETER AND SPECTROPHOTOMETERS PART A
 UNIT I COLORIMETER AND SPECTROPHOTOMETERS PART A 1. List any four elements used in spectrophotometers. 1.Radiant source 2.wavelength selector 3.photodetector 4.sample 2. What is meant by flame emission
JABLONSKI DIAGRAM INTERACTIONS BETWEEN LIGHT AND MATTER LIGHT AS A WAVE LIGHT AS A PARTICLE 2/1/16. Photoelectric effect Absorp<on Emission ScaDering
 INTERACTIONS BETWEEN LIGHT AND MATTER LIGHT AS A WAVE Diffrac
Introduction to Spectroscopic methods
 Introduction to Spectroscopic methods Spectroscopy: Study of interaction between light* and matter. Spectrometry: Implies a quantitative measurement of intensity. * More generally speaking electromagnetic
II. Spectrophotometry (Chapters 17, 19, 20)
") II. Spectrophotometry (Chapters 17, 19, 20) FUNDAMENTALS (Chapter 17) Spectrophotometry: any technique that uses light to measure concentrations (here: U and visible - ~190 800 nm) c = 2.99792 x 10 8 m/s
II. Spectrophotometry (Chapters 17, 19, 20) FUNDAMENTALS (Chapter 17) Spectrophotometry: any technique that uses light to measure concentrations (here: U and visible - ~190 800 nm) c = 2.99792 x 10 8 m/s
Spectrophotometry. Introduction
 Spectrophotometry Spectrophotometry is a method to measure how much a chemical substance absorbs light by measuring the intensity of light as a beam of light passes through sample solution. The basic principle
Complete the following. Clearly mark your answers. YOU MUST SHOW YOUR WORK TO RECEIVE CREDIT.
 CHEM 322 Name Exam 3 Spring 2013 Complete the following. Clearly mark your answers. YOU MUST SHOW YOUR WORK TO RECEIVE CREDIT. Warm-up (3 points each). 1. In Raman Spectroscopy, molecules are promoted
Classification of spectroscopic methods
 Introduction Spectroscopy is the study of the interaction between the electromagnetic radiation and the matter. Spectrophotometry is the measurement of these interactions i.e. the measurement of the intensity
Chem 434 -Instrumental Analysis Hour Exam 1
 Do any 8 of the following 9 problems Name: Chem 434 -Instrumental Analysis Hour Exam 1 +2 1. A 25.0 ml sample containing Cu gave an instrument reading of 23.6 units (corrected for a blank). When exactly
Lecture 3: Light absorbance
 Lecture 3: Light absorbance Perturbation Response 1 Light in Chemistry Light Response 0-3 Absorbance spectrum of benzene 2 Absorption Visible Light in Chemistry S 2 S 1 Fluorescence http://www.microscopyu.com
Analytical Technologies in Biotechnology Prof. Dr. Ashwani K Sharma Department of Biotechnology Indian Institute of Technology, Roorkee
 Analytical Technologies in Biotechnology Prof. Dr. Ashwani K Sharma Department of Biotechnology Indian Institute of Technology, Roorkee Module - 6 Spectroscopic Techniques Lecture - 2 UV-Visible Spectroscopy
Chem 155 Midterm Exam Page 1 of 10 Spring 2010 Terrill
 Chem 155 Midterm Exam Page 1 of 10 ame Signature 1. Mercury (Hg) is is believed to be hazardous to human neurological health at extremely low concentrations. Fortunately EPA Method 45.7 cold vapor atomic
Clinical Chemistry (CHE221) Professor Hicks Week 1. Statistics Made Slightly Less Boring and Introduction to Spectrophotometry. Accuracy vs Precision
 Professor Hicks Week 1. Statistics Made Slightly Less Boring and Introduction to Spectrophotometry. Accuracy vs Precision") Clinical Chemistry (CHE221) Professor Hicks Week 1 Statistics Made Slightly Less Boring and Introduction to Spectrophotometry 3 Accuracy vs Precision Precision is the consistency of a measurement made
Clinical Chemistry (CHE221) Professor Hicks Week 1 Statistics Made Slightly Less Boring and Introduction to Spectrophotometry 3 Accuracy vs Precision Precision is the consistency of a measurement made
Chem Homework Set Answers
 Chem 310 th 4 Homework Set Answers 1. Cyclohexanone has a strong infrared absorption peak at a wavelength of 5.86 µm. (a) Convert the wavelength to wavenumber.!6!1 8* = 1/8 = (1/5.86 µm)(1 µm/10 m)(1 m/100
Chapter 10. Spectroscopic Methods. An early example of a colorimetric analysis is Nessler s method for ammonia, which was.
 Chapter 10 Spectroscopic Methods Chapter Overview Section 10A Overview of Spectroscopy Section 10B Spectroscopy Based on Absorption Section 10C UV/Vis and IR Spectroscopy Section 10D Atomic Absorption
World Journal of Pharmaceutical Research SJIF Impact Factor 8.074
 SJIF Impact Factor 8.074 Volume 7, Issue 11, 1170-1180. Review Article ISSN 2277 7105 DEVELOPMENT AND OPTIMIZATION OF UV-VIS SPECTROSCOPY - A REVIEW Govinda Verma* and Dr. Manish Mishra Shri Guru Ram Rai
Absorption spectrometry summary
 Absorption spectrometry summary Rehearsal: Properties of light (electromagnetic radiation), dual nature light matter interactions (reflection, transmission, absorption, scattering) Absorption phenomena,
9/28/10. Visible and Ultraviolet Molecular Spectroscopy - (S-H-C Chapters 13-14) Valence Electronic Structure. n σ* transitions
 Valence Electronic Structure. n σ* transitions") Visible and Ultraviolet Molecular Spectroscopy - (S-H-C Chapters 13-14) Electromagnetic Spectrum - Molecular transitions Widely used in chemistry. Perhaps the most widely used in Biological Chemistry.
Visible and Ultraviolet Molecular Spectroscopy - (S-H-C Chapters 13-14) Electromagnetic Spectrum - Molecular transitions Widely used in chemistry. Perhaps the most widely used in Biological Chemistry.
Instrumental Chemical Analysis
 L6 page 1 Instrumental Chemical Analysis Ultraviolet and visible spectroscopy Dr. Ahmad Najjar Philadelphia University Faculty of Pharmacy Department of Pharmaceutical Sciences 2 nd semester, 2016/2017
Spectrochemical methods
 Spectrochemical methods G. Galbács The interactions of radiations and matter are the subject of spectroscopy py or spectrochemical methods (also called spectrometry). Spectrochemical methods usually measure
Ch 313 FINAL EXAM OUTLINE Spring 2010
 Ch 313 FINAL EXAM OUTLINE Spring 2010 NOTE: Use this outline at your own risk sometimes a topic is omitted that you are still responsible for. It is meant to be a study aid and is not meant to be a replacement
levels. The signal is either absorbance vibrational and rotational energy levels or percent transmittance of the analyte
 1 In this chapter, absorption by molecules, rather than atoms, is considered. Absorption in the ultraviolet and visible regions occurs due to electronic transitions from the ground state to excited state.
Chapter 10. Spectroscopic Methods. An early example of a colorimetric analysis is Nessler s method for ammonia, which was.
 Chapter 10 Spectroscopic Methods Chapter Overview 10A Overview of Spectroscopy 10B Spectroscopy Based on Absorption 10C UV/Vis and IR Spectroscopy 10D Atomic Absorption Spectroscopy 10E Emission Spectroscopy
Questions on Instrumental Methods of Analysis
 Questions on Instrumental Methods of Analysis 1. Which one of the following techniques can be used for the detection in a liquid chromatograph? a. Ultraviolet absorbance or refractive index measurement.
Instrumental Chemical Analysis
 L6 page 1 Instrumental Chemical Analysis Ultraviolet and visible spectroscopy Dr. Ahmad Najjar Philadelphia University Faculty of Pharmacy Department of Pharmaceutical Sciences 2 nd semester, 2016/2017
CEE 772: Instrumental Methods in Environmental Analysis
 Updated: 31 August 2014 Print version (Harris, Chapt. 1) (pp.1-20) CEE 772: Instrumental Methods in Environmental Analysis Lecture #3 Statistics: Detection Limits Spectroscopy: Beer s Law & Electronic
Spectrophotometry. Dr. Shareef SHAIK ASST. PROFESSOR Pharmacology
 Spectrophotometry Dr. Shareef SHAIK ASST. PROFESSOR Pharmacology Content Introduction Beer-Lambert law Instrument Applications Introduction 3 Body fluids such as blood, csf and urine contain organic and
Course: M.Sc (Chemistry) Analytical Chemistry Unit: III
 Analytical Chemistry Unit: III") Course: M.Sc (Chemistry) Analytical Chemistry Unit: III Syllabus: Principle of spectrophotometry Types of spectrophotometer Applications - Dissociation constants of an indicator simultaneous spectrophotometric
Course: M.Sc (Chemistry) Analytical Chemistry Unit: III Syllabus: Principle of spectrophotometry Types of spectrophotometer Applications - Dissociation constants of an indicator simultaneous spectrophotometric
Photochemical principles
 Chapter 1 Photochemical principles Dr. Suzan A. Khayyat 1 Photochemistry Photochemistry is concerned with the absorption, excitation and emission of photons by atoms, atomic ions, molecules, molecular
Chapter 4 Ultraviolet and visible spectroscopy Molecular Spectrophotometry
 Chapter 4 Ultraviolet and visible spectroscopy Molecular Spectrophotometry Properties of light Electromagnetic radiation and electromagnetic spectrum Absorption of light Beer s law Limitation of Beer s
Chapter 5 Electrons In Atoms
 Chapter 5 Electrons In Atoms 5.1 Revising the Atomic Model 5.2 Electron Arrangement in Atoms 5.3 Atomic Emission Spectra and the Quantum Mechanical Model 1 Copyright Pearson Education, Inc., or its affiliates.
Introduction to FT-IR Spectroscopy
 Introduction to FT-IR Spectroscopy An FT-IR Spectrometer is an instrument which acquires broadband NIR to FIR spectra. Unlike a dispersive instrument, i.e. grating monochromator or spectrograph, an FT-IR
Physics 30: Chapter 5 Exam Wave Nature of Light
 Physics 30: Chapter 5 Exam Wave Nature of Light Name: Date: Mark: /33 Numeric Response. Place your answers to the numeric response questions, with units, in the blanks at the side of the page. (1 mark
Lab 10: Spectroscopy & the Hydrogen Atom Phy208 Fall 2008
 Lab 10: Spectroscopy & the Hydrogen Atom Phy208 Fall 2008 Name Section This sheet is the lab document your TA will use to score your lab. It is to be turned in at the end of lab. To receive full credit
EXPERIMENT 17: Atomic Emission
 EXPERIMENT 17: Atomic Emission PURPOSE: To construct an energy level diagram of the hydrogen atom To identify an element from its line spectrum. PRINCIPLES: White light, such as emitted by the sun or an
EMISSION SPECTROSCOPY
 IFM The Department of Physics, Chemistry and Biology LAB 57 EMISSION SPECTROSCOPY NAME PERSONAL NUMBER DATE APPROVED I. OBJECTIVES - Understand the principle of atomic emission spectra. - Know how to acquire
Chapter 17: Fundamentals of Spectrophotometry
 Chapter 17: Fundamentals of Spectrophotometry Spectroscopy: the science that deals with interactions of matter with electromagnetic radiation or other forms energy acoustic waves, beams of particles such
Absorption photometry
 The light Absorption photometry Szilvia Barkó University of Pécs, Faculty of Medicines, Dept. Biophysics February 2011 Transversal wave E Electromagnetic wave electric gradient vector wavelength The dual
Chapter 5 Light and Matter
 Chapter 5 Light and Matter Stars and galaxies are too far for us to send a spacecraft or to visit (in our lifetimes). All we can receive from them is light But there is much we can learn (composition,
Reference. What is spectroscopy? What is Light? / EMR 11/15/2015. Principles of Spectroscopy. Processes in Spectroscopy
 Chapter 2 Principles of Spectroscopy EST 3203 Instrumental Analysis Rezaul Karim Environmental Science and Technology Jessore Science and Technology University Principles of Spectroscopy Electromagnetic
Properties of Electromagnetic Radiation Chapter 5. What is light? What is a wave? Radiation carries information
 Concepts: Properties of Electromagnetic Radiation Chapter 5 Electromagnetic waves Types of spectra Temperature Blackbody radiation Dual nature of radiation Atomic structure Interaction of light and matter
高等食品分析 (Advanced Food Analysis) I. SPECTROSCOPIC METHODS *Instrumental methods: 1. Spectroscopic methods (spectroscopy): a) Electromagnetic radiation
 I. SPECTROSCOPIC METHODS *Instrumental methods: 1. Spectroscopic methods (spectroscopy): a) Electromagnetic radiation") *Instrumental methods: 1. Spectroscopic methods (spectroscopy): a) Electromagnetic radiation (EMR): γ-ray emission X-Ray absorption, emission, fluorescence and diffraction Vacuum ultraviolet (UV) absorption
*Instrumental methods: 1. Spectroscopic methods (spectroscopy): a) Electromagnetic radiation (EMR): γ-ray emission X-Ray absorption, emission, fluorescence and diffraction Vacuum ultraviolet (UV) absorption
JABLONSKI DIAGRAM 2/15/16
 INDICATE THE EXCITED AND GROUND SINGLET AND TRIPLET STATES. INDICATE THE FOLLOWING TRANSITIONS: ABSORPTION, FLUORESCENCE, PHOSPHORESCENCE, NONRADIATIVE DECAY, INTERNAL CONVERSION AND INTERSYSTEM CROSSING.
PAPER No. 12: ORGANIC SPECTROSCOPY MODULE No. 7: Instrumentation for IR spectroscopy
 KNOW MORE Web links https://en.wikipedia.org/wiki/infrared_ http://hiq.lindegas.com/en/analytical_methods/infrared_/non_dispersive_infrared.html http://blamp.sites.truman.edu/files/2012/11/322-ir-and-ftir.pdf
Lab 5: Spectroscopy & the Hydrogen Atom Phy248 Spring 2009
 Lab 5: Spectroscopy & the Hydrogen Atom Phy248 Spring 2009 Name Section Return this spreadsheet to your TA that will use it to score your lab. To receive full credit you must use complete sentences and
2101 Atomic Spectroscopy
 2101 Atomic Spectroscopy Atomic identification Atomic spectroscopy refers to the absorption and emission of ultraviolet to visible light by atoms and monoatomic ions. It is best used to analyze metals.
The Fundamentals of Spectroscopy: Theory BUILDING BETTER SCIENCE AGILENT AND YOU
 The Fundamentals of Spectroscopy: Theory BUILDING BETTER SCIENCE AGILENT AND YOU 1 Agilent is committed to the educational community and is willing to provide access to company-owned material. This slide
Analytical Chemistry II
 Analytical Chemistry II L4: Signal processing (selected slides) Computers in analytical chemistry Data acquisition Printing final results Data processing Data storage Graphical display https://www.creativecontrast.com/formal-revolution-of-computer.html
Spectroscopy. a laboratory method of analyzing matter using electromagnetic radiation.
 Spectroscopy a laboratory method of analyzing matter using electromagnetic radiation. Mass Spectrometry Determines the relative abundance of the different isotopes of an element Used to determine the average
Ultraviolet-Visible Spectroscopy
 Ultraviolet-Visible Spectroscopy Introduction to UV-Visible Absorption spectroscopy from 160 nm to 780 nm Measurement of transmittance Conversion to absorbance * A=-logT=εbc Measurement of transmittance
Spectroscopy. a laboratory method of analyzing matter using electromagnetic radiation
 Spectroscopy a laboratory method of analyzing matter using electromagnetic radiation The electromagnetic spectrum Radiation Scale of Absorption involves: Example of spectroscopy Gamma rays pm Nuclear reactions
n ( λ ) is observed. Further, the bandgap of the ZnTe semiconductor is
 is observed. Further, the bandgap of the ZnTe semiconductor is") Optical Spectroscopy Lennon O Naraigh, 0000 Date of Submission: 0 th May 004 Abstract: This experiment is an exercise in the principles and practice of optical spectroscopy. The continuous emission spectrum
Optical Spectroscopy Lennon O Naraigh, 0000 Date of Submission: 0 th May 004 Abstract: This experiment is an exercise in the principles and practice of optical spectroscopy. The continuous emission spectrum
SPECTROPHOTOMETERS. Visible and UV-Visible
 Visible and UV-Visible The Manifacturer ONDA Spectrophotometers are manifactured by a company with over than ten years of experience in development of UV/Vis instruments, Single beam and Double beam, with
Spectroscopy Problem Set February 22, 2018
 Spectroscopy Problem Set February, 018 4 3 5 1 6 7 8 1. In the diagram above which of the following represent vibrational relaxations? 1. Which of the following represent an absorbance? 3. Which of following
Atomization. In Flame Emission
 FLAME SPECTROSCOPY The concentration of an element in a solution is determined by measuring the absorption, emission or fluorescence of electromagnetic by its monatomic particles in gaseous state in the
Chemistry Instrumental Analysis Lecture 15. Chem 4631
 Chemistry 4631 Instrumental Analysis Lecture 15 IR Instruments Types of Instrumentation Dispersive Spectrophotometers (gratings) Fourier transform spectrometers (interferometer) Single beam Double beam
APAS Laboratory { PAGE } Spectroscopy SPECTROSCOPY
 SPECTROSCOPY SYNOPSIS: In this lab you will eplore different types of emission spectra, calibrate a spectrometer using the spectrum of a known element, and use your calibration to identify an unknown element.
The Spectrophotometer and Atomic Spectra of Hydrogen Physics 246
 The Spectrophotometer and Atomic Spectra of Hydrogen Physics 46 Introduction: When heated sufficiently, most elements emit light. With a spectrometer, the emitted light can be broken down into its various
C101-E111. Talk Letter. Vol.2 February 2009
 C101-E111 UV Talk Letter Vol.2 February 2009 UV Talk Letter UV Talk Letter The Structure of a Spectrophotometer Vol.2 February 2009 1.The Measurement Principle Used by a Spectrophotometer The basic measurement
Infrared Spectroscopy: Identification of Unknown Substances
 Infrared Spectroscopy: Identification of Unknown Substances Suppose a white powder is one of the four following molecules. How can they be differentiated? H N N H H H H Na H H H H H A technique that is
1 WHAT IS SPECTROSCOPY?
 1 WHAT IS SPECTROSCOPY? 1.1 The Nature Of Electromagnetic Radiation Anyone who has been sunburnt will know that light packs a punch: in scientific terms, it contains considerable amounts of energy. All
Chapter 17: Fundamentals of Spectrophotometry
 Chapter 17: Fundamentals of Spectrophotometry Spectroscopy: the science that deals with interactions of matter with electromagnetic radiation or other forms energy acoustic waves, beams of particles such
INTERNATIONAL JOURNAL OF INSTITUTIONAL PHARMACY AND LIFE SCIENCES
 International Journal of Institutional Pharmacy and Life Sciences 5(5): September-October 2015 INTERNATIONAL JOURNAL OF INSTITUTIONAL PHARMACY AND LIFE SCIENCES Pharmaceutical Sciences Review Article!!!
The ROXI Colorimeter & Fluorimeter. Laboratory Application I. Colorimetric measurements via Beer s Law.
 The ROXI Colorimeter & Fluorimeter. Laboratory Application I. Colorimetric measurements via Beer s Law. Required Supplies & Costs: RGB LED; $1.95 Light Sensors; $3.95 ea 3-way switch; $6.54 3 ohm resistor;
Skoog Chapter 7 Components of Optical Instruments
 Skoog Chapter 7 Components of Optical Instruments General Design of Optical Instruments Sources of Radiation Wavelength Selectors (Filters, Monochromators, Interferometers) Sample Containers Radiation
UNIT 2 UV-VISIBLE SPECTROMETRY
 Molecular Spectroscopic Methods-I UNIT 2 UV-VISIBLE SPECTROMETRY Structure 2.1 Introduction Objectives 2.2 Origin and Characteristics of UV-VIS Spectrum Origin of UV-VIS spectrum Characteristics of UV-VIS
Modern Instrumental Methods of Analysis Prof. J. R. Mudakavi Department of Chemical Engineering Indian Institute of Science, Bangalore
 Modern Instrumental Methods of Analysis Prof. J. R. Mudakavi Department of Chemical Engineering Indian Institute of Science, Bangalore Lecture No. # 04 Interaction of Matter with Radiation Let us now take
MOLEBIO LAB #4: Using a Spectrophotometer
 Introduction: Spectrophotometry MOLEBIO LAB #4: Using a Spectrophotometer Many kinds of molecules interact with or absorb specific types of radiant energy in a predictable fashion. For example, when while
= (fundamental constants c 0, h, k ). (1) k
. (1) k") Introductory Physics Laboratory, Faculty of Physics and Geosciences, University of Leipzig W 12e Radiation Thermometers Tasks 1 Measure the black temperature T s of a glowing resistance wire at eight different
Introductory Physics Laboratory, Faculty of Physics and Geosciences, University of Leipzig W 12e Radiation Thermometers Tasks 1 Measure the black temperature T s of a glowing resistance wire at eight different
Sunlight. 1 radiation.
 Sunlight The eye has evolved to see a narrow range of EM waves which we call 'visible light'. This visible range of frequency is due to the light comes from the Sun. The photosphere of the Sun is a blackbody
Experiment 3 Electromagnetic Radiation and Atom Interaction
 Experiment 3 Electromagnetic Radiation and Atom Interaction B OBJECTIVES To be familiar with the relationship between emission line spectra and the energy levels of electrons in various atoms. B INTRODUCTION
Chapter 5 Electrons In Atoms
 Chapter 5 Electrons In Atoms 5.1 Revising the Atomic Model 5.2 Electron Arrangement in Atoms 5.3 Atomic Emission Spectra and the Quantum Mechanical Model 1 Copyright Pearson Education, Inc., or its affiliates.