Chemistry 524--Final Exam--Keiderling May 4, :30 -?? pm SES
|
|
|
- Mervin Sherman
- 5 years ago
- Views:
Transcription
1 Chemistry 524--Final Exam--Keiderling May 4, :30 -?? pm SES Please answer all questions in the answer book provided. Calculators, rulers, pens and pencils are permitted. No open books or extra sheets allowed. If you need a specific fundamental constant, conversion factor or definition ask for it; but everything needed should be in the exam, unless I made an error! Strategy there are lots of small questions, if you do not know one, skip ahead, leave a space in your answer book, it may come to you later and you will not waste time. You do not need to answer everything to get a good grade. There is some possibly helpful information at the end of the exam. GOOD LUCK! In the second half of the course we surveyed a number of different optical spectroscopic techniques and for each we reviewed the technologies used for building the spectrometers used for different kinds of analytical applications. Questions 1 7 are organized like the end of the course. All answers should be short and to the point, best answers are a few sentences. Unless clearly indicated to choose between them, all parts should be answered: 1. [10] Atomic spectroscopy is very valuable but got a short attention in lecture, although a large component of the text. It comes in several flavors: Atomic Absorption (AA), atomic emission (AE), resonance fluorescence, and I am sure there are several others. a. Compare AA and AE in terms of types of instrumentation needed, ability to discriminate analytes, costs, and sensitivity Answer only two (2) of b, c, d or e: b. What advantages does a graphite furnace have over flame atomization, problems? c. Describe the major steps the sample goes through for flame or plasma atomization. d. What are the advantages of using inductively coupled plasma (ICP) atomization? e. How is AA data quantified for determination of concentration? 2. [6] Molecular spectra are in general broader than atomic spectra and, if they were resolved to individual transitions, would be much more complex Answer only two (2) of a, b, c or d: a. Explain the apparent mirror symmetry between absorbance and fluorescence bandshapes and note why it is not a true mirror image b. Explain why fluorescence is normally seen from the S 1 excited state and often from just its v=0 vibrational state. How does this impact analyses? c. From which state do vibrations appear in the absorption spectral band shape, why? d. Why are rotational components of the molecular spectra relatively unimportant in analytical spectroscopy? - 1 -
2 3. [22] Absorbance spectroscopy in the uv-vis region underlies the most commonly used analytical techniques a. Absorbance requires two intensity measurements as opposed to one for luminescence. Explain why you need two, what they give you and how they are obtained Answer only one (1) of b or c: b. Explain a common way to create a double beam spectrometer (i.e. what kind of optical design is used) c. Explain some advantages of double beam spectrometry, disadvantages? Answer only two (2) of d, e, f or g: d. Some spectrometers scan from vis to uv but stop for a short time at ~350 nm. Explain why e. Since many spectrometers use gratings to scan from nm, how do they avoid second and third order diffraction interference? Give one or two example solutions f. Some spectrometers vary the slit width as the scan proceeds. Give a plausible reason why g. What range of absorbance is reasonable for a commercial uv-vis? What are the limiting noise sources at high and low absorbances? Answer only one (1) of h or j: h. What is important about isobestic points for analyses? How can it be used analytically? i. Why use the wavelength corresponding to the band maximum for analyses if the whole band absorbance varies linearly with concentration? j. What impact can the slit width have on concentration determination with absorbance? Answer only one (1) of k or l: k. Xe arcs make very good uv-vis sources. Why are they not used in most commercial spectrometers? l. Why do you think are there not commercial CCD based uv-vis absorption spectrometers, but there are incredible numbers of digital cameras and telephones with CCDs? 4. [22] Molecular luminescence is the counterpart to absorbance and consists of fluorescence and phosphorescence (and other less analytically relevant methods) a. Many molecules do not fluoresce, even though they have absorbance. Explain why b. What kind of information is obtained by scanning the excitation wavelength and fixing the emission wavelength? How is it different from absorbance? c. Propose advantages and disadvantages of using a broad band (thermal) detector for normalization of the total source intensity as compared to excitation of a rhodamine dye with the output of the excitation monochromator and detection of its fluorescence. d. Describe how you would detect fluorescence lifetimes (there are two ways, pick one). Specify the types of detectors and electronics you would need e. Why can fluorescence for an isotropic sample be polarized but not absorbance? - 2 -
3 Answer only one (1) of f or g: f. Explain how you might discriminate phosphorescence from fluorescence in a sample g. How would you discriminate Raman from fluorescence in a sample Answer only one (1) of h or i: h. Explain sampling or experimental design changes that can enhance phosphorescence. i. What is quenching and give an example of using it for analysis of structure or properties? 5. [30] IR absorbance spectra are primarily used to monitor molecular vibrations a. Modern FTIRs dominate the market, partly due to the three advantages of FTIR. List the advantages and explain why each leads to more reliable spectra with FTIR as compared to dispersive IR b. For near-ir spectra the bands are usually broad and not uniquely assigned. Plus they are very weak. Explain why near-ir has none-the-less become a useful analytical tool and how it can gain discrimination (selectivity). c. Why is IR used more for qualitative analyses than for quantitative analyses? d. My lab uses a dispersive IR for measuring VCD of single broad bands in proteins. Propose another experiment where dispersive IR is (or could be) used. Answer only one (1) of e or f: e. Water and CO 2 in the atmosphere pose interference issues in the IR spectrum. How is this interference normally corrected in FTIR? Where are these bands spectrally? f. To correct for the solvent absorbance I can subtract the spectrum measure in a similar cell. Why might this be in error? Why might I still have an error if I use the same cell? Answer only one (1) of g or i: g. Explain why most FTIRs are used (default scan) from cm -1, what limits scan? h. What modifications are needed to extend to the Far IR region (e.g cm -1 )? i. If I want to modify my FTIR to a new region, which might be more difficult, far IR or near IR and explain why (many possible answers) Answer only one (1) of j or k: j. Old dispersive spectrometers used thermopile detectors but FTIRs use DTGS detectors, why is this? How do they differ in fundamental detection mechanism? k. Photon detectors for the IR, like MCT and InSb are normally cooled with liquid N 2. What is gained and what is lost in this cooling? Why do routine FTIRs (e.g. Mattson in 4315 SES) not have a cooled detector? Answer only one (1) of l or m: l. Explain why ATR is surface sensitive and transmission IR is bulk sensitive m. Describe some materials that are useful for sampling (making cells) water-based solutions of proteins, and explain why they are chosen
4 6. [16] Raman spectroscopy also is focused primarily on vibrational spectra. a. IR and Raman are viewed as complementary but both allow v = ±1 transitions, what makes them different (i.e. complementary)? b. Explain the difference between Stokes and anti-stokes Raman spectra, where you find these transitions and why Stokes is usually more intense. c. Raman and fluorescence spectrometers are conceptually alike, however Raman spectrometers almost always use a laser source for excitation and fluorimeters often use a broadband source with monochromator. Explain d. Raman spectrometers originally used double monochromators, why? Now they often use single spectrographs. Why did they change and how did they solve the problem? Answer only one (1) of e or f: e. How can you use an internal standard to get Raman cross-section (intensity) measurements from a single measurement? f. Why can Raman sample smaller volumes than IR, but often need more sample? 7. [13] Circular dichroism is measured as an absorption modulation spectroscopy. a. CD is actually measured as A in absorbance. Biochemists in particular are interested in CD expressed as [ ]. How is the conversion made? b. Most CDs use a photoelastic modulator (PEM, often from Hinds Inc.). Explain how it works for CD measurements c. Why is CD so useful in biochemical analysis studies? Answer only one (1) of d or e: d. JASCO CDs are popular, but use old fashioned prism monochromators and do not seem to have an obvious linear polarizer. Please explain these observations. e. OLIS has a different CD detection design. Explain some aspects of its differences Answer only one (1) of f or g: f. What criteria are needed for a CD to be used for kinetics with stop-flow mixing? g. CD in the IR is vibrational CD (VCD). Describe how a typical VCD instrument differs from a UV CD instrument? 8. [6] Answer only two (2) of the following, a. My MCT detector for my FTIR spectrometer has 1/f noise. How do I know this is the source and how can I adjust the experimental conditions so that this is unimportant? b. Once 1/f noise is reduced, the detector is limited by Johnson noise. What is the source of this noise and what can I do about it? c. If it were perfect, the detector would be shot noise limited. What is the source of this noise and how can it be reduced or how can the S/N be improved? - 4 -
![9. [6] I have a fluorescence lifetime experiment which has a pulsed laser excitation, with pulses at 10 Hz. However the fluorescence decay data after each pulse are noisy.](/docs-images/82/86561735/images/5-0.jpg "Describe/ design a detection scheme that I could use to improve the S/N and determine the lifetime if the pulse were 10 ns and the lifetime were 300 ns.")
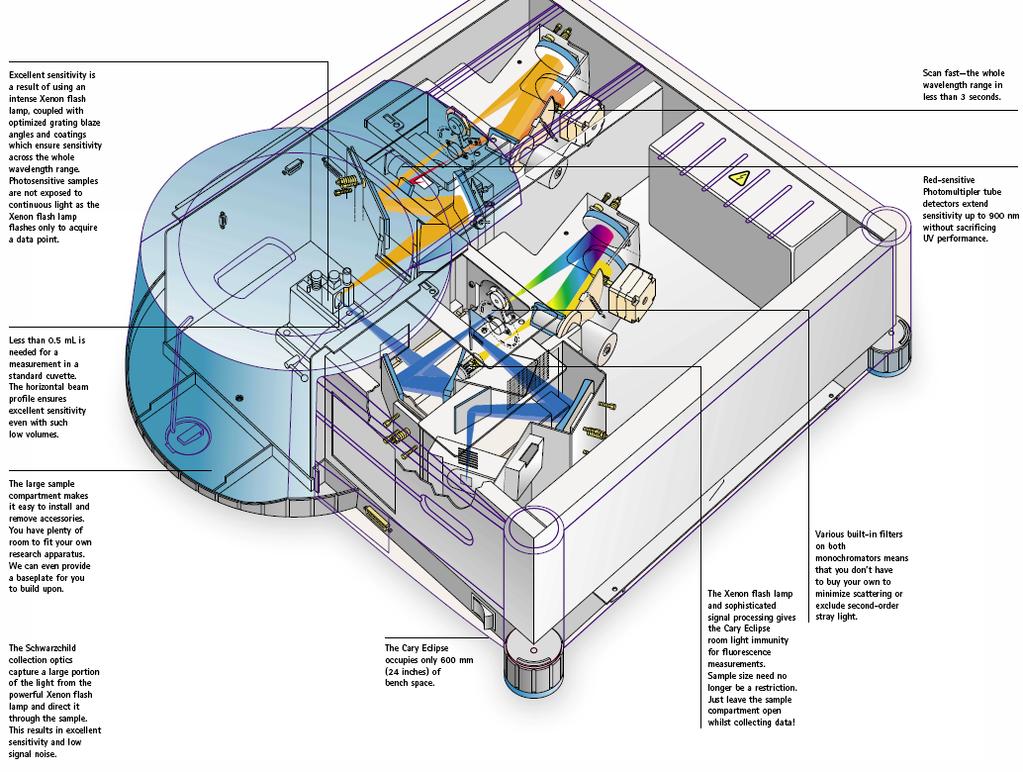
5 9. [6] I have a fluorescence lifetime experiment which has a pulsed laser excitation, with pulses at 10 Hz. However the fluorescence decay data after each pulse are noisy. Describe/ design a detection scheme that I could use to improve the S/N and determine the lifetime if the pulse were 10 ns and the lifetime were 300 ns. Be specific about detectors and electronics and explain your choices. 10. [5] We described several filters and amplifiers based on op amps. Describe the characteristics of the input and outputs of a typical op amp and how it can be used to control gain or band pass. 11. [10] For the two reflection IR sampling accessories below, identify the main components, explain what kind of measurement they are used for and contrast the elements and flexibility (adjustments) needed in the design. Specify what kind of information they yield 12. [43] For the attached instrument diagrams (starting next page) choose either A or B and then do C and D and E (next two pages). Identify the possible function and type of each of the major parts that are hand-labeled with a number in a circle. You may make a table with numbers coding the objects in the diagram and for each identified item propose specifically which type of component (e.g. "source: quartz-halogen or W-I lamp" or "detector: PMT") is being used (note: for optical components, just put what it is and purpose, e.g. lens, focus beam on slit). For the source and detector, briefly justify the choice. Finally state the purpose of the instrument shown and why you think you are right
6 A B - 6 -
7 C D - 7 -
8 E - 8 -
Chemistry 524--Final Exam--Keiderling Dec. 12, pm SES
 Chemistry 524--Final Exam--Keiderling Dec. 12, 2002 --4-8 pm -- 238 SES Please answer all questions in the answer book provided. Calculators, rulers, pens and pencils are permitted plus one 8.5 x 11 sheet
Chem 524 Lecture Notes CD (Section 18) update 2011
 update 2011") Chem 5 Lecture Notes CD (Section 8) update For HTML of 5 notes, click here XV. Circular Dichroism A. Differential absorption of left and right circular polarized light by molecular transition. Measure
Chem 5 Lecture Notes CD (Section 8) update For HTML of 5 notes, click here XV. Circular Dichroism A. Differential absorption of left and right circular polarized light by molecular transition. Measure
Spectroscopy Problem Set February 22, 2018
 Spectroscopy Problem Set February, 018 4 3 5 1 6 7 8 1. In the diagram above which of the following represent vibrational relaxations? 1. Which of the following represent an absorbance? 3. Which of following
CHEM*3440. Photon Energy Units. Spectrum of Electromagnetic Radiation. Chemical Instrumentation. Spectroscopic Experimental Concept.
 Spectrum of Electromagnetic Radiation Electromagnetic radiation is light. Different energy light interacts with different motions in molecules. CHEM*344 Chemical Instrumentation Topic 7 Spectrometry Radiofrequency
CHEM Outline (Part 15) - Luminescence 2013
 - Luminescence 2013") CHEM 524 -- Outline (Part 15) - Luminescence 2013 XI. Molecular Luminescence Spectra (Chapter 15) Kinetic process, competing pathways fluorescence, phosphorescence, non-radiative decay Jablonski diagram
CHEM 524 -- Outline (Part 15) - Luminescence 2013 XI. Molecular Luminescence Spectra (Chapter 15) Kinetic process, competing pathways fluorescence, phosphorescence, non-radiative decay Jablonski diagram
Instrumental Analysis: Spectrophotometric Methods
 Instrumental Analysis: Spectrophotometric Methods 2007 By the end of this part of the course, you should be able to: Understand interaction between light and matter (absorbance, excitation, emission, luminescence,fluorescence,
Chem Homework Set Answers
 Chem 310 th 4 Homework Set Answers 1. Cyclohexanone has a strong infrared absorption peak at a wavelength of 5.86 µm. (a) Convert the wavelength to wavenumber.!6!1 8* = 1/8 = (1/5.86 µm)(1 µm/10 m)(1 m/100
Ch 313 FINAL EXAM OUTLINE Spring 2010
 Ch 313 FINAL EXAM OUTLINE Spring 2010 NOTE: Use this outline at your own risk sometimes a topic is omitted that you are still responsible for. It is meant to be a study aid and is not meant to be a replacement
Chapter 15 Molecular Luminescence Spectrometry
 Chapter 15 Molecular Luminescence Spectrometry Two types of Luminescence methods are: 1) Photoluminescence, Light is directed onto a sample, where it is absorbed and imparts excess energy into the material
Complete the following. Clearly mark your answers. YOU MUST SHOW YOUR WORK TO RECEIVE CREDIT.
 CHEM 322 Name Exam 3 Spring 2013 Complete the following. Clearly mark your answers. YOU MUST SHOW YOUR WORK TO RECEIVE CREDIT. Warm-up (3 points each). 1. In Raman Spectroscopy, molecules are promoted
Model Answer (Paper code: AR-7112) M. Sc. (Physics) IV Semester Paper I: Laser Physics and Spectroscopy
 M. Sc. (Physics) IV Semester Paper I: Laser Physics and Spectroscopy") Model Answer (Paper code: AR-7112) M. Sc. (Physics) IV Semester Paper I: Laser Physics and Spectroscopy Section I Q1. Answer (i) (b) (ii) (d) (iii) (c) (iv) (c) (v) (a) (vi) (b) (vii) (b) (viii) (a) (ix)
Model Answer (Paper code: AR-7112) M. Sc. (Physics) IV Semester Paper I: Laser Physics and Spectroscopy Section I Q1. Answer (i) (b) (ii) (d) (iii) (c) (iv) (c) (v) (a) (vi) (b) (vii) (b) (viii) (a) (ix)
Reference literature. (See: CHEM 2470 notes, Module 8 Textbook 6th ed., Chapters )
") September 17, 2018 Reference literature (See: CHEM 2470 notes, Module 8 Textbook 6th ed., Chapters 13-14 ) Reference.: https://slideplayer.com/slide/8354408/ Spectroscopy Usual Wavelength Type of Quantum
September 17, 2018 Reference literature (See: CHEM 2470 notes, Module 8 Textbook 6th ed., Chapters 13-14 ) Reference.: https://slideplayer.com/slide/8354408/ Spectroscopy Usual Wavelength Type of Quantum
Classification of spectroscopic methods
 Introduction Spectroscopy is the study of the interaction between the electromagnetic radiation and the matter. Spectrophotometry is the measurement of these interactions i.e. the measurement of the intensity
Advanced Spectroscopy Laboratory
 Advanced Spectroscopy Laboratory - Raman Spectroscopy - Emission Spectroscopy - Absorption Spectroscopy - Raman Microscopy - Hyperspectral Imaging Spectroscopy FERGIELAB TM Raman Spectroscopy Absorption
Chapter 6 Photoluminescence Spectroscopy
 Chapter 6 Photoluminescence Spectroscopy Course Code: SSCP 4473 Course Name: Spectroscopy & Materials Analysis Sib Krishna Ghoshal (PhD) Advanced Optical Materials Research Group Physics Department, Faculty
Lecture 0. NC State University
 Chemistry 736 Lecture 0 Overview NC State University Overview of Spectroscopy Electronic states and energies Transitions between states Absorption and emission Electronic spectroscopy Instrumentation Concepts
CHEM 221 Instrumental Analysis FINAL EXAM May 10, 2016
 CHEM 221 Instrumental Analysis FINAL EXAM May 10, 2016 Name: INSTRUCTIONS: Read through the entire exam before you begin. Answer all of the questions. For questions involving calculations, show all of
INTRODUCTION Atomic fluorescence spectroscopy ( AFS ) depends on the measurement of the emission ( fluorescence ) emitted from gasphase analyte atoms
 depends on the measurement of the emission ( fluorescence ) emitted from gasphase analyte atoms") INTRODUCTION Atomic fluorescence spectroscopy ( AFS ) depends on the measurement of the emission ( fluorescence ) emitted from gasphase analyte atoms that have been excited to higher energy levels by absorption
INTRODUCTION Atomic fluorescence spectroscopy ( AFS ) depends on the measurement of the emission ( fluorescence ) emitted from gasphase analyte atoms that have been excited to higher energy levels by absorption
high temp ( K) Chapter 20: Atomic Spectroscopy
 Chapter 20: Atomic Spectroscopy") high temp (2000-6000K) Chapter 20: Atomic Spectroscopy 20-1. An Overview Most compounds Atoms in gas phase high temp (2000-6000K) (AES) (AAS) (AFS) sample Mass-to-charge (ICP-MS) Atomic Absorption experiment
high temp (2000-6000K) Chapter 20: Atomic Spectroscopy 20-1. An Overview Most compounds Atoms in gas phase high temp (2000-6000K) (AES) (AAS) (AFS) sample Mass-to-charge (ICP-MS) Atomic Absorption experiment
AS 101: Day Lab #2 Summer Spectroscopy
 Spectroscopy Goals To see light dispersed into its constituent colors To study how temperature, light intensity, and light color are related To see spectral lines from different elements in emission and
atomic absorption spectroscopy general can be portable and used in-situ preserves sample simpler and less expensive
 Chapter 9: End-of-Chapter Solutions 1. The following comparison provides general trends, but both atomic absorption spectroscopy (AAS) and atomic absorption spectroscopy (AES) will have analyte-specific
Chemistry 543--Final Exam--Keiderling May 5, pm SES
 Chemistry 543--Final Exam--Keiderling May 5,1992 -- 1-5pm -- 174 SES Please answer all questions in the answer book provided. Make sure your name is clearly indicated and that the answers are clearly numbered,
Molecular Luminescence Spectroscopy
 Molecular Luminescence Spectroscopy In Molecular Luminescence Spectrometry ( MLS ), molecules of the analyte in solution are excited to give a species whose emission spectrum provides information for qualitative
DEPARTMENT OF CHEMISTRY UNIVERSITY OF SWAZILAND
 o DEPARTMENT OF CHEMISTRY UNIVERSITY OF SWAZILAND C612 SPECTRO CHEMICAL ANALYSIS DECEMBER 2015 FINAL EXAMINATION Time Allowed: Three (3) Hours Instructions: 1. This examination has six (6) questions and
1. Transition dipole moment
 1. Transition dipole moment You have measured absorption spectra of aqueous (n=1.33) solutions of two different chromophores (A and B). The concentrations of the solutions were the same. The absorption
Atomization. In Flame Emission
 FLAME SPECTROSCOPY The concentration of an element in a solution is determined by measuring the absorption, emission or fluorescence of electromagnetic by its monatomic particles in gaseous state in the
Application of IR Raman Spectroscopy
 Application of IR Raman Spectroscopy 3 IR regions Structure and Functional Group Absorption IR Reflection IR Photoacoustic IR IR Emission Micro 10-1 Mid-IR Mid-IR absorption Samples Placed in cell (salt)
Analytical Spectroscopy Review
 Analytical Spectroscopy Review λ = wavelength ν = frequency V = velocity = ν x λ = 2.998 x 10 8 m/sec = c (in a vacuum) ν is determined by source and does not change as wave propogates, but V can change
Atomic Emission Spectroscopy
 Atomic Emission Spectroscopy Ahmad Aqel Ifseisi Assistant Professor of Analytical Chemistry College of Science, Department of Chemistry King Saud University P.O. Box 2455 Riyadh 11451 Saudi Arabia Building:
Spectroscopy tools for PAT applications in the Pharmaceutical Industry
 Spectroscopy tools for PAT applications in the Pharmaceutical Industry Claude Didierjean Sr. Technology and Applications Consultant Real Time Analytics Mettler Toledo AutoChem, Inc. claude.didierjean@mt.com
LABORATORY OF ELEMENTARY BIOPHYSICS
 LABORATORY OF ELEMENTARY BIOPHYSICS Experimental exercises for III year of the First cycle studies Field: Applications of physics in biology and medicine Specialization: Molecular Biophysics Fluorescence
Because light behaves like a wave, we can describe it in one of two ways by its wavelength or by its frequency.
 Light We can use different terms to describe light: Color Wavelength Frequency Light is composed of electromagnetic waves that travel through some medium. The properties of the medium determine how light
Spectroscopy. Page 1 of 8 L.Pillay (2012)
") Spectroscopy Electromagnetic radiation is widely used in analytical chemistry. The identification and quantification of samples using electromagnetic radiation (light) is called spectroscopy. Light has
Spectroscopy Electromagnetic radiation is widely used in analytical chemistry. The identification and quantification of samples using electromagnetic radiation (light) is called spectroscopy. Light has
Fourier Transform Infrared. Spectrometry
 Fourier Transform Infrared. Spectrometry Second Editio n PETER R. GRIFFITH S JAMES A. de HASETH PREFACE x v CHAPTER 1 INTRODUCTION TO VIBRATIONAL SPECTROSCOPY 1 1.1. Introduction 1 1.2. Molecular Vibrations
IR Spectrography - Absorption. Raman Spectrography - Scattering. n 0 n M - Raman n 0 - Rayleigh
 RAMAN SPECTROSCOPY Scattering Mid-IR and NIR require absorption of radiation from a ground level to an excited state, requires matching of radiation from source with difference in energy states. Raman
Ultraviolet-Visible and Infrared Spectrophotometry
 Ultraviolet-Visible and Infrared Spectrophotometry Ahmad Aqel Ifseisi Assistant Professor of Analytical Chemistry College of Science, Department of Chemistry King Saud University P.O. Box 2455 Riyadh 11451
2001 Spectrometers. Instrument Machinery. Movies from this presentation can be access at
 2001 Spectrometers Instrument Machinery Movies from this presentation can be access at http://www.shsu.edu/~chm_tgc/sounds/sound.html Chp20: 1 Optical Instruments Instrument Components Components of various
DAY LABORATORY EXERCISE: SPECTROSCOPY
 AS101 - Day Laboratory: Spectroscopy Page 1 DAY LABORATORY EXERCISE: SPECTROSCOPY Goals: To see light dispersed into its constituent colors To study how temperature, light intensity, and light color are
Visualization of Xe and Sn Atoms Generated from Laser-Produced Plasma for EUV Light Source
 3rd International EUVL Symposium NOVEMBER 1-4, 2004 Miyazaki, Japan Visualization of Xe and Sn Atoms Generated from Laser-Produced Plasma for EUV Light Source H. Tanaka, A. Matsumoto, K. Akinaga, A. Takahashi
Chem 524 Lecture Notes Raman (Section 17) 2013
 2013") Chem 524 Lecture Notes Raman (Section 17) 2013 For HTML of 2005 notes, click here XIII. Molecular Light Scattering and Raman Spectroscopy (Read Ch. 16) A. Elastic Scattering o = s - basis for Dynamic Light
Chem 524 Lecture Notes Raman (Section 17) 2013 For HTML of 2005 notes, click here XIII. Molecular Light Scattering and Raman Spectroscopy (Read Ch. 16) A. Elastic Scattering o = s - basis for Dynamic Light
Chem 155 Midterm Exam Page 1 of 10 Spring 2010 Terrill
 Chem 155 Midterm Exam Page 1 of 10 ame Signature 1. Mercury (Hg) is is believed to be hazardous to human neurological health at extremely low concentrations. Fortunately EPA Method 45.7 cold vapor atomic
VALLIAMMAI ENGINEERING COLLEGE SRM Nagar, Kattankulathur
 VALLIAMMAI ENGINEERING COLLEGE SRM Nagar, Kattankulathur 603 203 DEPARTMENT OF ELECTRONICS AND INSTRUMENTATION ENGINEERING QUESTION BANK V SEMESTER EI6501 Analytical Instruments Regulation 2013 Academic
Comments to Atkins: Physical chemistry, 7th edition.
 Comments to Atkins: Physical chemistry, 7th edition. Chapter 16: p. 483, Eq. (16.1). The definition that the wave number is the inverse of the wave length should be used. That is much smarter. p. 483-484.
Course Details. Analytical Techniques Based on Optical Spectroscopy. Course Details. Textbook. SCCH 211: Analytical Chemistry I
 SCCH 211: Analytical Chemistry I Analytical Techniques Based on Optical Spectroscopy Course Details September 22 October 10 September 22 November 7 November 17 December 1 Topic Period Introduction to Spectrometric
Raman and stimulated Raman spectroscopy of chlorinated hydrocarbons
 Department of Chemistry Physical Chemistry Göteborg University KEN140 Spektroskopi Raman and stimulated Raman spectroscopy of chlorinated hydrocarbons WARNING! The laser gives a pulsed very energetic and
Lab 10: Spectroscopy & the Hydrogen Atom Phy208 Fall 2008
 Lab 10: Spectroscopy & the Hydrogen Atom Phy208 Fall 2008 Name Section This sheet is the lab document your TA will use to score your lab. It is to be turned in at the end of lab. To receive full credit
JABLONSKI DIAGRAM 2/15/16
 INDICATE THE EXCITED AND GROUND SINGLET AND TRIPLET STATES. INDICATE THE FOLLOWING TRANSITIONS: ABSORPTION, FLUORESCENCE, PHOSPHORESCENCE, NONRADIATIVE DECAY, INTERNAL CONVERSION AND INTERSYSTEM CROSSING.
25 Instruments for Optical Spectrometry
 25 Instruments for Optical Spectrometry 25A INSTRUMENT COMPONENTS (1) source of radiant energy (2) wavelength selector (3) sample container (4) detector (5) signal processor and readout (a) (b) (c) Fig.
Absorption photometry
 The light Absorption photometry Szilvia Barkó University of Pécs, Faculty of Medicines, Dept. Biophysics February 2011 Transversal wave E Electromagnetic wave electric gradient vector wavelength The dual
Spectroscopy: Introduction. Required reading Chapter 18 (pages ) Chapter 20 (pages )
 Chapter 20 (pages )") Spectroscopy: Introduction Required reading Chapter 18 (pages 378-397) Chapter 20 (pages 424-449) Spectrophotometry is any procedure that uses light to measure chemical concentrations Properties of Light
Spectroscopy: Introduction Required reading Chapter 18 (pages 378-397) Chapter 20 (pages 424-449) Spectrophotometry is any procedure that uses light to measure chemical concentrations Properties of Light
9/13/10. Each spectral line is characteristic of an individual energy transition
 Sensitive and selective determination of (primarily) metals at low concentrations Each spectral line is characteristic of an individual energy transition 1 Atomic Line Widths Why do atomic spectra have
EXPERIMENT 09 OBSERVATION OF SPECTRA
 EXPERIMENT 09 OBSERVATION OF SPECTRA INTRODUCTION: In physics, as in very other area of study, one of the most valuable questions a student can learn to ask is, How do they know that? Thus, when you read
Lecture 16 Instrumentation for ICP AES-VIII-Instruments
 Inductive Couple Plasma Atomic Emission Spectrometry (ICP-AES) for Pollution Monitoring Dr. J R Mudakavi Department of Chemical Engineering Indian Institute of Science, Bangalore Lecture 16 Instrumentation
Diagnósticos em Plasmas
 Tecnologia a Plasma para o Processamento de Materiais Diagnósticos em Plasmas Diagnósticos Ópticos João Santos Sousa, nº50901 Semestre Inverno 2004/2005 21 de Janeiro de 2005, 9h-10h, sala F8 Contents
Wavelength λ Velocity v. Electric Field Strength Amplitude A. Time t or Distance x time for 1 λ to pass fixed point. # of λ passing per s ν= 1 p
 Introduction to Spectroscopy (Chapter 6) Electromagnetic radiation (wave) description: Wavelength λ Velocity v Electric Field Strength 0 Amplitude A Time t or Distance x Period p Frequency ν time for 1
Design and Development of a Smartphone Based Visible Spectrophotometer for Analytical Applications
 Design and Development of a Smartphone Based Visible Spectrophotometer for Analytical Applications Bedanta Kr. Deka, D. Thakuria, H. Bora and S. Banerjee # Department of Physicis, B. Borooah College, Ulubari,
Chemistry 2. Molecular Photophysics
 Chemistry 2 Lecture 12 Molecular Photophysics Assumed knowledge Electronic states are labelled using their spin multiplicity with singlets having all electron spins paired and triplets having two unpaired
9/28/10. Visible and Ultraviolet Molecular Spectroscopy - (S-H-C Chapters 13-14) Valence Electronic Structure. n σ* transitions
 Valence Electronic Structure. n σ* transitions") Visible and Ultraviolet Molecular Spectroscopy - (S-H-C Chapters 13-14) Electromagnetic Spectrum - Molecular transitions Widely used in chemistry. Perhaps the most widely used in Biological Chemistry.
Visible and Ultraviolet Molecular Spectroscopy - (S-H-C Chapters 13-14) Electromagnetic Spectrum - Molecular transitions Widely used in chemistry. Perhaps the most widely used in Biological Chemistry.
DETERMINATION OF RELATIVE FLUORESCENCE QUANTUM YIELD USING THE AGILENT CARY ECLIPSE
 FOOD ANALYSIS DETERMINATION OF RELATIVE FLUORESCENCE QUANTUM YIELD USING THE AGILENT CARY ECLIPSE Solutions for Your Analytical Business Markets and Applications Programs Authors Sangeetha Ramesan Co-Authors
Atomic Absorption Spectroscopy
 CH 2252 Instrumental Methods of Analysis Unit IV Atomic Absorption Spectroscopy Dr. M. Subramanian Associate Professor Department of Chemical Engineering Sri Sivasubramaniya Nadar College of Engineering
Singlet. Fluorescence Spectroscopy * LUMO
 Fluorescence Spectroscopy Light can be absorbed and re-emitted by matter luminescence (photo-luminescence). There are two types of luminescence, in this discussion: fluorescence and phosphorescence. A
OPERATING INSTRUCTIONS
 OPERATING INSTRUCTIONS for the Perkin Elmer Model 650-10S Fluorescence Spectrophotometer Re: Operating Instructions PE 650 2 The following flow diagram should help to guide you through the steps necessary
How does your eye form an Refraction
 Astronomical Instruments Eyes and Cameras: Everyday Light Sensors How does your eye form an image? How do we record images? How does your eye form an image? Refraction Refraction is the bending of light
Analytical Technologies in Biotechnology Prof. Dr. Ashwani K Sharma Department of Biotechnology Indian Institute of Technology, Roorkee
 Analytical Technologies in Biotechnology Prof. Dr. Ashwani K Sharma Department of Biotechnology Indian Institute of Technology, Roorkee Module - 6 Spectroscopic Techniques Lecture - 2 UV-Visible Spectroscopy
a. An emission line as close as possible to the analyte resonance line
 Practice Problem Set 5 Atomic Emission Spectroscopy 10-1 What is an internal standard and why is it used? An internal standard is a substance added to samples, blank, and standards. The ratio of the signal
Answers to questions on exam in laser-based combustion diagnostics on March 10, 2006
 Answers to questions on exam in laser-based combustion diagnostics on March 10, 2006 1. Examples of advantages and disadvantages with laser-based combustion diagnostic techniques: + Nonintrusive + High
P. Lambrev October 10, 2018
 TIME-RESOLVED OPTICAL SPECTROSCOPY Petar Lambrev Laboratory of Photosynthetic Membranes Institute of Plant Biology The Essence of Spectroscopy spectro-scopy: seeing the ghosts of molecules Kirchhoff s
Astr 2310 Thurs. March 3, 2016 Today s Topics
 Astr 2310 Thurs. March 3, 2016 Today s Topics Chapter 6: Telescopes and Detectors Optical Telescopes Simple Optics and Image Formation Resolution and Magnification Invisible Astronomy Ground-based Radio
Atomic Absorption Spectroscopy (AAS)
") Atomic Absorption Spectroscopy (AAS) Alex Miller ABC s of Electrochemistry 3/8/2012 Contents What is Atomic Absorption Spectroscopy? Basic Anatomy of an AAS system Theory of Operation Practical Operation
Atomic Absorption Spectroscopy (AAS) Alex Miller ABC s of Electrochemistry 3/8/2012 Contents What is Atomic Absorption Spectroscopy? Basic Anatomy of an AAS system Theory of Operation Practical Operation
n ( λ ) is observed. Further, the bandgap of the ZnTe semiconductor is
 is observed. Further, the bandgap of the ZnTe semiconductor is") Optical Spectroscopy Lennon O Naraigh, 0000 Date of Submission: 0 th May 004 Abstract: This experiment is an exercise in the principles and practice of optical spectroscopy. The continuous emission spectrum
Optical Spectroscopy Lennon O Naraigh, 0000 Date of Submission: 0 th May 004 Abstract: This experiment is an exercise in the principles and practice of optical spectroscopy. The continuous emission spectrum
Skoog Chapter 6 Introduction to Spectrometric Methods
 Skoog Chapter 6 Introduction to Spectrometric Methods General Properties of Electromagnetic Radiation (EM) Wave Properties of EM Quantum Mechanical Properties of EM Quantitative Aspects of Spectrochemical
Physics 214. Midterm Exam Spring Last Name: First Name NetID Discussion Section: Discussion TA Name:
 Last Name: First Name NetID Discussion Section: Discussion TA Name: Instructions Turn off your cell phone and put it away. Keep your calculator on your own desk. Calculators may not be shared. This is
Analytical Chemistry II
 Analytical Chemistry II L4: Signal processing (selected slides) Computers in analytical chemistry Data acquisition Printing final results Data processing Data storage Graphical display https://www.creativecontrast.com/formal-revolution-of-computer.html
Explain With A Schematic Diagram The Principle Of Vapor Absorption System
 Explain With A Schematic Diagram The Principle Of Vapor Absorption System Figure 1 provides a schematic diagram of the components of a typical vapor-compression refrigeration system.figure 1: Vapor compression
CHM 424 EXAM 4 CRIB - COVER PAGE FALL
 CHM 44 EXAM 4 CRIB - COVER PAGE FALL 007 There are six numbered pages with five questions. Answer the questions on the exam. Exams done in ink are eligible for regrade, those done in pencil will not be
1901 Application of Spectrophotometry
 1901 Application of Spectrophotometry Chemical Analysis Problem: 1 Application of Spectroscopy Organic Compounds Organic compounds with single bonds absorb in the UV region because electrons from single
10/2/2008. hc λ. νλ =c. proportional to frequency. Energy is inversely proportional to wavelength And is directly proportional to wavenumber
 CH217 Fundamentals of Analytical Chemistry Module Leader: Dr. Alison Willows Electromagnetic spectrum Properties of electromagnetic radiation Many properties of electromagnetic radiation can be described
How does your eye form an Refraction
 Astronomical Instruments and : Everyday Light Sensors How does your eye form an image? How do we record images? How does your eye form an image? Refraction Refraction is the of light Eye uses refraction
Lecture 7: Atomic Spectroscopy
 Lecture 7: Atomic Spectroscopy 1 Atomic spectroscopy The wavelengths of absorbance and emission from atoms in the gas phase are characteristic of atomic orbitals. 2 In the lowest energy transition, the
Direct, Reliable, and Correct Oxygen Measurement
 Direct, Reliable, and Correct Oxygen Measurement February, 2015 Oxygen-dependent quenching of phosphorescence has been used extensively for the last 25 years as a reliable method for measuring oxygen.
Fluorescence Polarization Anisotropy FPA
 Fluorescence Polarization Anisotropy FPA Optics study of light Spectroscopy = light interacts the study of the interaction between matter & electro-magnetic radiation matter Spectroscopy Atomic Spectroscopy
Spectroscopy. Practical Handbook of. J. W. Robinson, Ph.D., D.Sc, F.R.C.S. Department of Chemistry Louisiana State University Baton Rouge, Louisiana
 Practical Handbook of Spectroscopy Edited by J. W. Robinson, Ph.D., D.Sc, F.R.C.S. Department of Chemistry Louisiana State University Baton Rouge, Louisiana CRC Press Boca Raton Ann Arbor Boston TABLE
Atomic Absorption & Atomic Fluorescence Spectrometry
 Atomic Absorption & Atomic Fluorescence Spectrometry Sample Atomization Atomic Absorption (AA) Atomic Fluorescence (AF) - Both AA and AF require a light source - Like Molecular Absorption & Fluorescence,
What is spectroscopy?
 Absorption Spectrum What is spectroscopy? Studying the properties of matter through its interaction with different frequency components of the electromagnetic spectrum. With light, you aren t looking directly
2101 Atomic Spectroscopy
 2101 Atomic Spectroscopy Atomic identification Atomic spectroscopy refers to the absorption and emission of ultraviolet to visible light by atoms and monoatomic ions. It is best used to analyze metals.
Preview from Notesale.co.uk Page 1 of 38
 F UNDAMENTALS OF PHOTONICS Module 1.1 Nature and Properties of Light Linda J. Vandergriff Director of Photonics System Engineering Science Applications International Corporation McLean, Virginia Light
Supplementary Information for. Vibrational Spectroscopy at Electrolyte Electrode Interfaces with Graphene Gratings
 Supplementary Information for Vibrational Spectroscopy at Electrolyte Electrode Interfaces with Graphene Gratings Supplementary Figure 1. Simulated from pristine graphene gratings at different Fermi energy
CHEM 221 Instrumental Analysis FINAL EXAM May 10, 2016
 CHEM 221 Instrumental Analysis FINAL EXAM May 10, 2016 Name: Khee INSTRUCTIONS: Read through the entire exam before you begin. Answer all of the questions. For questions involving calculations, show all
Physics 214 Midterm Exam Spring Last Name: First Name NetID Discussion Section: Discussion TA Name:
 Physics 214 Midterm Exam Spring 215 Last Name: First Name NetID Discussion Section: Discussion TA Name: Instructions Turn off your cell phone and put it away. Keep your calculator on your own desk. Calculators
JABLONSKI DIAGRAM INTERACTIONS BETWEEN LIGHT AND MATTER LIGHT AS A WAVE LIGHT AS A PARTICLE 2/1/16. Photoelectric effect Absorp<on Emission ScaDering
 INTERACTIONS BETWEEN LIGHT AND MATTER LIGHT AS A WAVE Diffrac
Introduction. Molecules, Light and Natural Dyes. Experiment
 Experiment Molecules, Light and Natural Dyes 11 Introduction Chemistry of Color The production of dyes was the basis for the creation of modern chemical industry. During the mid-19 th century all dyes
Phys 2310 Fri. Dec. 12, 2014 Today s Topics. Begin Chapter 13: Lasers Reading for Next Time
 Phys 2310 Fri. Dec. 12, 2014 Today s Topics Begin Chapter 13: Lasers Reading for Next Time 1 Reading this Week By Fri.: Ch. 13 (13.1, 13.3) Lasers, Holography 2 Homework this Week No Homework this chapter.
Chem 310 rd. 3 Homework Set Answers
 -1- Chem 310 rd 3 Homework Set Answers 1. A double line labeled S 0 represents the _ground electronic_ state and the _ground vibrational_ state of a molecule in an excitation state diagram. Light absorption
Chem 344 Final Exam Tuesday, Dec. 11, 2007, 3-?? PM
 Chem 344 Final Exam Tuesday, Dec. 11, 2007, 3-?? PM Closed book exam, only pencils and calculators permitted. You may bring and use one 8 1/2 x 11" paper with anything on it. No Computers. Put all of your
EMISSION SPECTROSCOPY
 IFM The Department of Physics, Chemistry and Biology LAB 57 EMISSION SPECTROSCOPY NAME PERSONAL NUMBER DATE APPROVED I. OBJECTIVES - Understand the principle of atomic emission spectra. - Know how to acquire
What happens when light falls on a material? Transmission Reflection Absorption Luminescence. Elastic Scattering Inelastic Scattering
 Raman Spectroscopy What happens when light falls on a material? Transmission Reflection Absorption Luminescence Elastic Scattering Inelastic Scattering Raman, Fluorescence and IR Scattering Absorption
Spectroscopy in Inorganic Chemistry. Vibration and Rotation Spectroscopy
 Spectroscopy in Inorganic Chemistry Symmetry requirement for coupling combination bands and Fermi resonance 2 3 V 3 1505 cm -1 (R, IR) E' stretches v 1 888 cm -1 (R) A 1 ' stretch V 2 718 cm -1 (IR) A
Electronic Excitation by UV/Vis Spectroscopy :
 SPECTROSCOPY Light interacting with matter as an analytical tool III Pharm.D Department of Pharmaceutical Analysis SRM College Of Pharmacy,Katankulathur Electronic Excitation by UV/Vis Spectroscopy : X-ray:
Measurement Examples. Excitation and Emission Scans. Steady State Fluorescence Anisotropy. Kinetic Measurements
 Measurement Examples A division of Edinburgh Instruments Ltd. Excitation and Emission Scans Excitation and emission spectra are standard measurements in fluorescence spectroscopy. The figure demonstrates
R O Y G B V. Spin States. Outer Shell Electrons. Molecular Rotations. Inner Shell Electrons. Molecular Vibrations. Nuclear Transitions
 Spin States Molecular Rotations Molecular Vibrations Outer Shell Electrons Inner Shell Electrons Nuclear Transitions NMR EPR Microwave Absorption Spectroscopy Infrared Absorption Spectroscopy UV-vis Absorption,