AP 5301/8301 Instrumental Methods of Analysis and Laboratory
|
|
|
- Megan Lindsey
- 5 years ago
- Views:
Transcription
1 1 AP 5301/8301 Instrumental Methods of Analysis and Laboratory Lecture 7 Optical spectroscopies Prof YU Kin Man kinmanyu@cityu.edu.hk Tel: Office: P6422
2 Lecture 7: outline 2 Introduction Optical spectroscopy Dielectric function Optical constants Photon-solid interaction Spectrophotometry Reflectance Transmission/absorption Optical absorption in semiconductors Spectroscopic ellipsometry SE data analysis SE examples Advantages and limitations Photoluminescence spectroscopy Modulation spectroscopy
3 Optical spectroscopy Spectroscopy is basically the measurement of the interaction of light with various materials. The optical response intensity as a function of the wavelength (or energy) of light is analyzed to determine various properties of the material. Basically, two things can happen when light hits a sample: absorption or emission. In absorption, the sample absorbs some of the energy (photons). Emission occurs when we hit a sample with some light and it emits light of a different wavelength: fluorescence, luminescence and phosphorescence A spectrometer is an instrument for making relative measurements in the optical spectral region, using light that is spectrally dispersed by means of a dispersing element. 3


4 Optical excitation Wavelength λ (nm)

5 The complex dielectric function As electromagnetic wave interact with a medium, polarization of the medium occurs and this is dependent on the permittivity of the medium. Permittivity is the ability of a material to polarize and store a charge within it, and the relative permittivity ε r = ε ε o, ε o is the permittivity in vacuum. Hence the permittivity of a material determines how the material react to an incident light (EM wave) The relative permittivity r (or dielectric constant) is frequency dependent and is a complex function ε r ω = ε r ω + iε r " ω ε r is the in-phase component of the frequency response of the medium ε r " is the out-of-phase component of the frequency response ε r ω = ε + ε s ε 1 + iωτ ε r ω = ε r ω + iε r " ω Debye Equations: ε r = Re ε r = ε + ε s ε 1 + ωτ 2 ε " r = Im ε r = ωτ(ε s ε ) 1 + ωτ 2 5
6 Optical constants n and k The complex refractive index n(ω) of the material is related to ε r ω Maxwell relation: n ω = ε r ω = n(ω) + ik(ω) ε r ω = n 2 ω k 2 ω and ε " r ω = 2n ω k(ω) n and k are optical constants of the material. n is the refractive index, and k is the extinction coefficient related to the absorption coefficient α and reflectance R α = 4πk λ 1 n, and R = 1 + n 2 = 1 n 2 + k n 2 + k 2 6 Refractive index (n) and extinction coefficient (k) spectra of the nc-si QDs of varying average sizes. Das and Samanta, Phys.Chem.Chem.Phys., 17, (2015).
7 Photon-solid interaction When light incident on a solid, it is reflected, absorbed or transmitted Specular reflection 7 n 1 n 2 I o θ θ I R Fresnel s law: 2 I R = 1 n 1 + n = 1 n 2 + k n 2 + k 2 absorption θ Beer s law: I T = I o e αt where α is the absorption coefficient t is the thickness of the absorber Transmitted I T Snell s law: n 1 sin θ = n 2 sin θ By passing light through a solid, we can learn about its refractive index, absorption coefficient and thickness, as well as its electronic band structure
, near-ultraviolet (UV), and near-infrared (NIR).")
 getting an accurate measure of the incident light")
8 Spectrophotometry Spectrophotometry is the quantitative measurement of the reflection or transmission properties of a material as a function of wavelength in the spectral range of visible light (Vis), near-ultraviolet (UV), and near-infrared (NIR). It is more commonly called UV-Vis-NIR spectroscopy. Typically a dual beam configuration is used, one beam pass through a reference cell (air, substrate) getting an accurate measure of the incident light intensity (I o ), the other passing through the sample (I T ). Both transmission and reflection can be measured. 8 Perkin-Elmer Lambda 950 Spectrophotometer
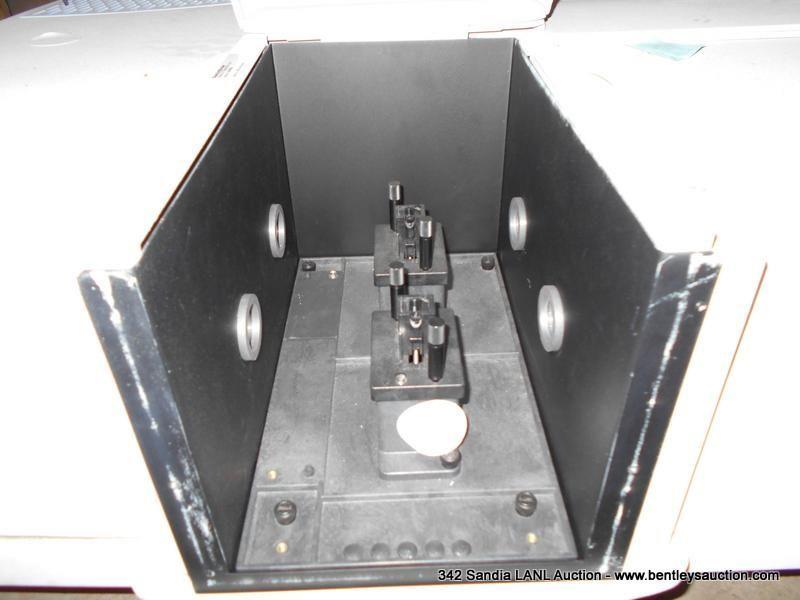
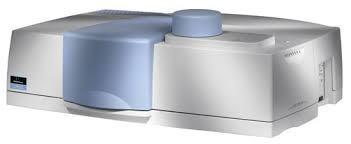
9 Spectrophotometer 9 Perkin-Elmer Lambda Spectrophotometer Reflectance Transmittance
 and extinction coefficient (k) are related to refraction and absorption (respectively).")

10 Spectrophotometry: reflectance 10 The light intensity reflected from the layer structure is measured in a specific spectral range. From Fresnel law: R = 1 n 2 +k 2 1+n 2 +k 2 The optical constants: refractive index (n) and extinction coefficient (k) are related to refraction and absorption (respectively). Light reflected from the different interfaces can be in or out of phase, resulting in intensity oscillation. Typically the reflectance data are analyzed by a curve fitting method, using calculated theoretical reflectance of the stack and parameters are adjusted to achieve best fit to the measured data. n and k can be calculated using the Forouhi-Bloomer dispersion equations

 gives equal spacings λ")

11 Spectrophotometry: reflectance For a simple structure with a thin film on a substrate, the thickness of the film can be easily obtained by the reflectance spectrum 11 R versus λ yields plots with unequal λ spacings R versus 1/λ (wavenumber) gives equal spacings λ max = 2n 1 d 1 cos φ, m = 1,2,3 m iλ o λ i d 1 = 2n 1 λ i λ o cos φ i is the number of complete cycles from λ o to λ i i d 1 = 2n 1 1/λ o 1/λ i cos φ
 and k(λ) can be extracted from the")
 and k(λ) with")


12 Spectrophotometry: reflectance Thin films parameters: film thickness t, n(λ) and k(λ) can be extracted from the measurement of R(λ) and/or T λ by combining the Forouhi-Bloomer dispersion equations for n(λ) and k(λ) with the Fresnel equations for the reflection and transmission of light at an interface to obtain theoretical, physically valid, expressions for reflectance and transmittance. Nonlinear least squares regression analysis will be performed using the theoretical parameters. 12
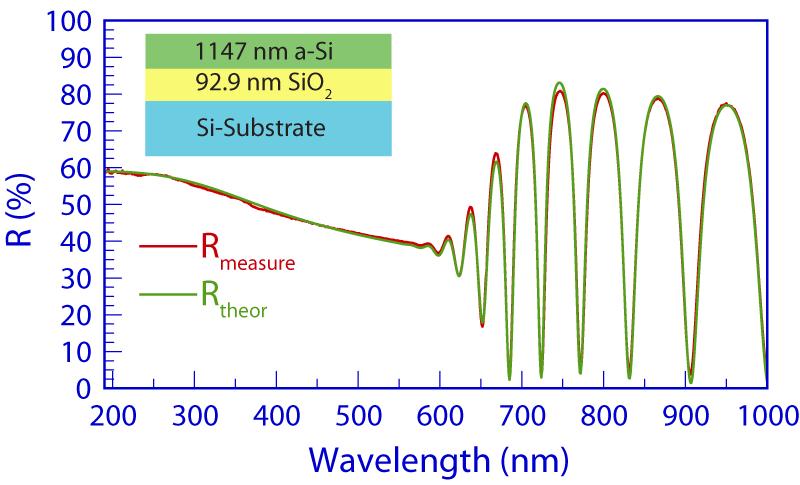
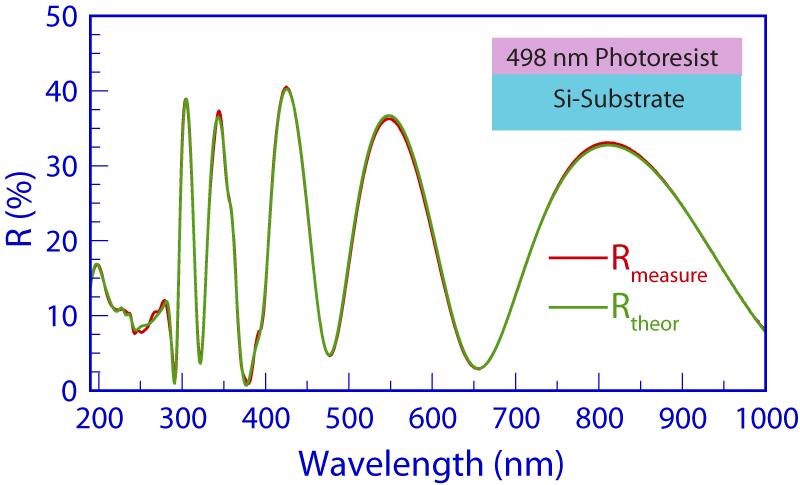
13 Spectrophotometry: reflectance 13

14 Transmission/Absorption 14 When a beam of light incident on a material, it can be scattered, absorbed, or transmitted Transmitted light: light emerges propagating in the same direction as the incident light Absorbed light: energy from light is absorbed in the volume of the material Scattered light: light emerges in a different direction from the incident light Absorption and scattering take place at the molecular and atomic level For energy from light to be absorbed, it must match available energy states in the atoms or molecules, or it can scatter from the molecule, atom, or electrons Probability that the light (photon) is removed (absorbed or scattered) from the incident beam is related to the cross section σ
 Number of molecules illuminated by light of incident intensity I x is CAdx Probability that the light is absorbed (scattered) is I o di x I x I T di x = σca A I x = 0 x dx σcdx I T = I o e")
15 Beer-Lambert law Consider light incident on a material with area A and thickness dx and concentration of molecules C (i. e. #/cm 3 ) Number of molecules illuminated by light of incident intensity I x is CAdx Probability that the light is absorbed (scattered) is I o di x I x I T di x = σca A I x = 0 x dx σcdx I T = I o e σcx = I o e αx 15 The coefficient α = σc is the linear attenuation coefficient Ignoring scattering, α is the absorption coefficient and is related to the extinction coefficient by α = 4πk λ The absorption coefficient is wavelength dependent so that: I T (λ) = I o (λ)e α(λ)x
")
 A = log")

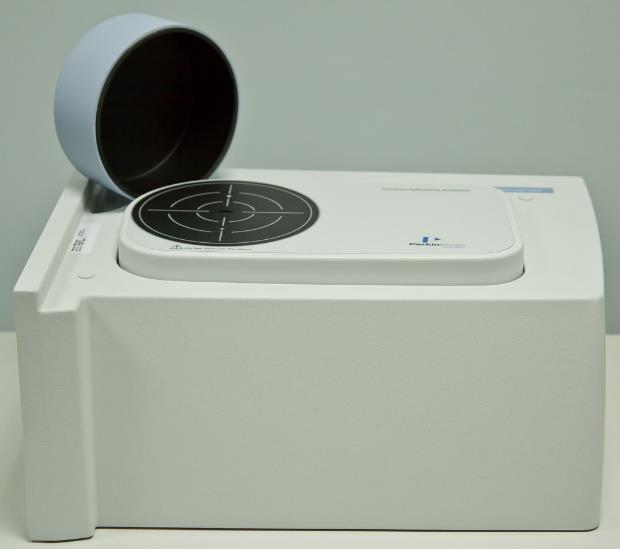
16 Transmission/Absorption 16 Transmittance is defined as T = I T(λ) I o (λ) A quantity called absorbance A is commonly used (by chemists) A = log 10 I o (λ) I T (λ) = log 10 e αx A = αxlog 10 e = 0.434αx Semiconsoft Mprobe UVVis-NIR
λ 1 ; d = d = (m + i)λ i 2n 2n m = iλ i d = iλ o λ i 2n(λ o λ i ) = λ o λ i i 2n(1/λ i 1/λ o ) More often, transmission and reflection data are combined to find the absorption")
17 Transmission/Absorption Similar to the case of reflection, oscillatory features in the transmission spectrum can also be used to determine sample thickness Oscillation maxima occurs at 17 d = mλ o 2n ; d = (m + 1)λ 1 ; d = d = (m + i)λ i 2n 2n m = iλ i d = iλ o λ i 2n(λ o λ i ) = λ o λ i i 2n(1/λ i 1/λ o ) More often, transmission and reflection data are combined to find the absorption coefficient α λ I T (λ) = (I o λ I R (λ))e α(λ)x α λ = 1 x ln I o λ I R (λ) I T (λ) From the absorption coefficient of a solid (thin film), the electronic properties can be derived. I o I R x I T Assuming that the substrate is transparent to the incident light


18 Transmission/Absorption: metal 18 In terms of energy bands, metals do not have an energy gap Since there is a very high concentration of electrons, practically all the light is absorbed within about 0.1µm of the surface The excited atoms in the surface layers of metal atoms relax again, emitting a photon. The energy lost by the descending electron is the same as that of the originally incident electron So metal reflects the light very well about 95% for most metals 2N states N electrons 3s
19 Reflectance: metal 19

20 Transmission/Absorption: non-metals 20 Dielectrics and semiconductors behave essentially the same way, the only difference being in the size of the bandgap We know that photons with energies greater than E g will be absorbed by giving their energy to electron-hole pairs which may or may not re-emit light when they relax.20 E C E G E V hole
21 Semiconductors and insulators: Absorption and Emission 21 hν > E g thermalization (~ps) E g conduction band recombination (~ns) k Emission (luminescence) at hν E g valence band The most important absorption process involves the transition of electrons from the valence to the conduction band. The process is referred to as fundamental absorption. In fundamental absorption, an electron absorbs an incident photon and jumps from the valence into available states in the conduction band. The photon energy hn must be equal to or larger than the energy gap E g In an absorption process, both energy and momentum must be conserved.
22 Direct and Indirect Gap Semiconductors 22 The 3-D band structures for semiconductors Si and GaAs E c E v E c E v Si GaAs Indirect band gap ( k gap 0) Direct band gap ( k gap = 0) In a direct gap semiconductor, conduction band minimum E C and valence band maximum E V occurs at the same k value For an indirect gap semiconductor, the conduction band minimum E C and valence band maximum E V occurs at different k.
23 Absorption: direct and indirect band gap For a direct gap materials, photons can excite electrons across the minimum band gap without a change in momentum efficient process involving only two particles: a photon and an electron Absorption coefficient is high α > cm 1 For an indirect gap material, a phonon is required to conserve momentum. 23 The phonon energy ħω is typically tens of mev, E g Phonons cause nearly horizontal transitions Such three-particle process is less likely than the two-particle process so that α direct α indirect (on the order of 10 3 cm 1 ) The absorption coefficient α can be related to the band gap by: αhν 1/n = A hν E g hν is the photon energy, E g is the bandgap, A is a proportionality constant and For direct allowed transition: n = 1/2 For indirect allowed transition: n = 2
24 Optical Absorption Measurement 24 x I o I T I R ZnO thin film α λ = 1 x ln I o λ I R (λ) I T (λ) αhν 1/n = A hν E g To determine if the material has a direct or indirect gap plot αhν 1/n vs. hν Notice that we can linearly extrapolate αhν 2 vs. hν (n = 1/2) to obtain a band gap E g = 3.3 ev αhν 1/2 vs. hν (n = 2) does not result in a straight line ZnO is a direct gap material.
 to a value of only 10 4 m -1 (100 cm -1 ) A second sharp rise up 10 6 m -1 (10 4 cm -1 ) occurs at higher energies where direct transitions becomes possible (>0.")
25 Absorption coefficient a 25 Take the indirect gap Ge, for example, the rise of a at the minimum band gap energy of 0.66 ev (1.878 mm) to a value of only 10 4 m -1 (100 cm -1 ) A second sharp rise up 10 6 m -1 (10 4 cm -1 ) occurs at higher energies where direct transitions becomes possible (>0.8 ev) Another indirect gap material Si the indirect gap of 1.1 ev (1127 nm) and direct gap is at >3 ev For direct gap semiconductors, e.g. GaAs, a is significantly larger, >10 5 m -1 (>10 4 cm -1 ) Wavelength (mm)
26 Spectrophotometry: strengths and weaknesses Strength: Very little to no sample preparation. Simplicity of use and data interpretation Short acquisition time, for most cases. Non destructive. Broad range of photon energies, typically from 150 nm to 3500 nm. Relatively low equipment cost, from <20k USD to 60k USD. Weaknesses: For transmission measurements, substrate has to be transparent to the beam. Sample surface has to be smooth, otherwise a more expensive integrating sphere collecting all diffused light is needed. Limited spatial resolution. 26


27 Spectroscopic ellipsometry (SE) Ellipsometry is an optical technique for investigating the dielectric properties (complex refractive index or dielectric function) of thin films. Ellipsometry measures the change of polarization upon reflection or transmission and compares it to a model. Optical constant n and k can be deduced from the result. It can be used to characterize composition, roughness, thickness (depth), crystalline nature, band gap, doping concentration, electrical conductivity and other material properties. It is very sensitive technique measuring films down to Å thickness. It is an absolute measurement: do not need any reference. It is an indirect method: does not give directly the physical parameters of the sample, it requires using a model to describe the sample. 27

28 Polarized light 28 When two orthogonal light waves are inphase, the resulting light will be linearly polarized. The relative amplitudes determine the resulting orientation When two orthogonal light waves are 90 o out-of-phase and equal in amplitude, the resulting light is circularly polarized. When two orthogonal light waves are of arbitrary amplitude and phase, then the resulting light will be elliptical. Ellipsometry measures the shape of this ellipse as the light is reflected from a sample surface, hence the name ellipsometry
 interacts with the material structure of interest (reflected, absorbed, scattered, or transmitted).")
29 Spectroscopic ellipsometry (SE) 29 The sample has a layered structure and each layer i has optical constants (n i, k i ) and a thickness t i. The measured signal is the change in polarization as the incident radiation (in a known state) interacts with the material structure of interest (reflected, absorbed, scattered, or transmitted). The polarization change is quantified by the amplitude ratio, Ψ, and the phase difference, Δ. ρ = R p R s = tanψe iδ = f(n i, k i, t i ) where R p R s is the Fresnel reflection coefficient R p = E p(reflected) E p (incident) ; R s = E s(reflected) E s (incident)

30 SE data analysis Ellipsometry is an indirect method, i.e. in general the measured Ψ and Δ cannot be converted directly into the optical constants of the sample. Normally, a model analysis must be performed. First, a layer model must be established, which considers the optical constants and thickness parameters of all individual layers of the sample including the correct layer sequence. Using an iterative procedure unknown optical constants and/or thickness parameters are varied, and Ψ and Δ values are calculated using the Fresnel equations. Ψ and Δ 30 n i, k i, t i Ψ theory, Δ theory n i, k i, t i

31 SE data analysis: models for n, k The dielectric function and the optical constants are related by n(λ) + ik λ = ε = ε 1 λ + iε 2 λ ε 1 = n 2 k 2 ; ε 2 = 2nk Cauchy model for transparent materials n λ = A + B λ 2 + C ; k λ = 0 λ4 Oscillator model for absorbing materials Lorentz, Gaussian, Harmonic, Tauc-Lorentz, etc. Common to all oscillator models is that they all have 3 common parameters: amplitude (Amp) or strength, broadening (Br) or width, center energy (E c ) or position. The Lorentz oscillator can be written as: 31 ε = ε 1,offset + AE c E c 2 E 2 ibe The dielectric function can be modeled as a sum of various oscillators


32 Example: thin metal film on oxide TiN thin film on SiO 2 on Si 32 Best fit results in layer structure and optical constants of TiN R. Synocicki, J. A. Woollam Co., Inc., Dec 2010.

 pp.")
33 Example: Al x Ga 1-x As multilayer 33 B. Johs, et al., SPIE Proc. Vol CR72, (1999) pp
34 SE: advantages and limitations 34 Non-destructive technique Film thickness measurement, can measure down to <1 nm Can measure optical constants n and k for unknown materials Absorption coefficient, band gap, carrier concentration, mobility, effective mass, etc. Can also measure film composition, porosity and roughness Absolute measurement: do not need any reference. Rapid measurement: get the full spectrum (190nm up1700nm) in few seconds Can be used for in-situ analysis Small equipment footprint: do not require a lot of lab space Can only measure flat, parallel and reflecting surfaces Some knowledge of the sample is required: number of layers, type of layers, etc. SE is an indirect measurement: does not give directly the physical parameters A realistic physical model of the sample is usually required to obtain useful information
: Photoluminescence (PL) Electrons: Cathodoluminescence (CL) Electric field:")
35 Luminescence Luminescence refers to the emission of light by a material due to the relaxation of the material from an excited state. The material can be excited by: Photons (typically a laser): Photoluminescence (PL) Electrons: Cathodoluminescence (CL) Electric field: Electroluminescence (EL)
36 Photoluminescence spectroscopy (PL) 36 Photoluminescence (PL) narrows this down to any emission of light that results from optical stimulation. The impinging light promote electrons from the less energetic levels to excited levels, forming electron-hole pairs. As the electrons and holes recombine, they may release some of the energy as photons. The emitted light is called luminescence. The detection and analysis of this emission is widely used as an analytical tool due to its sensitivity, simplicity, and low cost Depth sensitivity of PL is restricted by the optical penetration depth and carrier diffusion length (~0.05 to several mm). PL can give information on many inorganic solids: impurities, defects, surface damage; dopants and electronic band structures in semiconductors; structural imperfection in crystals


37 PL: basics In PL a material gains energy by absorbing light at some wavelength, promoting an electron from a low to a higher energy level. This may be described as making a transition from the ground state to an excited state of an atom or molecule, or from the valence band to the conduction band of a semiconductor crystal (electron-hole pair creation). The system then undergoes a nonradiative internal relaxation to a more stable excited level, such as the bottom of the conduction band or the lowest vibrational molecular state. The system will return to the ground state through emission of light radiative. The wavelength (energy) of this emission is longer (lower) than that of the incident light. The time dependence of the emission provide information about energy level coupling and lifetimes. 37
38 PL: basics 38 The light involved in PL excitation and emission usually is in the range ev (roughly nm), typically using a laser. At room temperature, PL emission is thermally broadened. As the temperature is lowered, features tend to become sharper, and PL is often stronger due to fewer nonradiative channels. Low temperatures are typically used to study phosphorescence in organic materials or to identify particular impurities in semiconductors. PL is generally most useful in semiconductors if their band gap is direct. Applications of PL are varied, including compositional analysis, trace impurity detection, spatial mapping, structural determination (crystallinity, bonding, layering), and the study of energytransfer mechanisms. Room and low (4.4 K) temperature μ-pl emission spectra from a single GaAs/AlGaAs core-shell NW (Zhou et al., 2009).
39 PL: example High purity GaAs epitaxial layer 39 Learn about the various impurities and their associated energy levels in a crystal Deduce the bandgap of a semiconductor Takagishi and Mori, Jpn. J. Appl. 23, L100 (1984).
40 40 Example: composition dependence of bandgap in InGaN PL signal In 1-x Ga x N 22% 17% 9% E (ev) 31% 50% 43% (a) a 2 (10 10 cm -2 ) % 31% 43% 50% E (ev) (b) E (ev) abs PL peak PL peak (11K) Shan et. al., PT Pereira et. al., abs x In 1-x Ga x N PL peak (ev) O'Donnell et. al. equal line this work absorption edge (ev) Wu et al. Appl. Phys. Lett. 80, 4741 (2002). PL was used to investigate the band gap of alloy semiconductor thin films as a function of alloy composition. Alternatively if the composition dependent bandgap of a certain alloy system is known, alloy composition of a sample can be obtained from its PL peak position

41 PL: material parameters 41 Spectral feature Peak energy Peak width Peak intensity Material parameter Compound identification Band gap/electronic levels Impurity or exciton binding energy Quantum well width Impurity species Alloy composition Internal strain Fermi energy Structural and chemical quality Quantum well interface roughness Carrier or doping density Relative quantity Polymer conformation Relative efficiency Surface damage Excited state lifetime Impurity or defect concentration
42 PL: strengths and weaknesses 42 Strengths: Very little to none sample preparation Non destructive technique Very informative spectrum Rapid data acquisition Weaknesses Often requires low temperature (down to LHe). Data analysis may be complex (many transition levels). Laser with different wavelengths may be needed as probe. Many materials have weak luminescence intensity


43 Modulation spectroscopy Modulation Spectroscopy is an analog method for taking the derivative of an optical spectrum (reflectance or transmittance) of a material by modifying the measurement conditions in some manner. This procedure results in a series of sharp, derivative-like spectral features in the photon energy region corresponding to electronic transitions between the filled and empty quantum levels of the atoms that constitute the bulk or surface of the material. Using Modulation Spectroscopy it is possible to measure the photon energies of the interband transitions to a high degree of accuracy and precision. 43 The modulation is applied by periodical changes of one of the system parameters: Electric field: modulation of the electric field by applying a periodic bias: Electroreflectance applying a periodic light probe: Photoreflectance (PR) Temperature: thermoreflectance (TR) Strain: piezoreflectance
44 Photoreflectance (PR) Photoreflectance (PR) spectroscopy is the simplest approach to modulate the internal electric field of a sample is by an additional light source and measure the reflectance of the sample. PR has many advantages: contactless and hence no special sample preparation needed non-destructive low cost, fast measurement The light beam (usually periodically chopped laser light with energy higher than the material bandgaps) generates electron-hole pairs in the structure causing the change in the occupation of the surface states 44 In PR the relative changes of the reflectivity are measured: R R = R R R where R and R are the reflectivity with the laser light off and on, respectively
45 Photoreflectance: principles 45 Changes in reflectivity R can be related to the perturbation of the dielectric R function of the material, ε = ε 1 + iε 2 : R R = α ε 1, ε 2 ε 1 + β ε 1, ε 2 ε 2 where α and β are the Seraphin coefficients, ε 1 and ε 2 represent photo-induced changes of the real and imaginary parts of the dielectric function, respectively. The imaginary part ε 2 changes slightly in electric field, resulting in a sharp resonance ε 2 exactly at the energy of the optical transition. It can be shown that in a case of the bulk crystal, the shape of dielectric function changes is of the third derivative of the unperturbed dielectric function.
46 Photoreflectance: principles The reflectively change under an electric field modulation can be expressed in a general form: R R = Re Aeiφ E E g + iγ n, where A is the amplitude of the signal, φ is the phase angle with respect to the modulating factor, E is the photon energy, E g is the energy gap, and Γ is the broadening parameter of the spectral line. 46 The n parameter determines the critical point type for three dimensional system (e.g. straight energy bandgap in GaAs) n = 2.5, and for the two dimensional critical point n = 3. For sufficiently high built-in electric fields the spectrum can display an oscillatory behavior above the band gap; these are called Franz- Keldysh oscillations (FK oscillations) The electric field intensity in the structure can be determined from the period of the FK oscillations.
. A laser beam (4) with energy higher than the band gap is chopped by a mechanical chopper (5) provides the modulation.")
47 PR operation 47 The sample (1) is mounted on a sample holder (or into a cryostat for low temperature measurement) The sample is illuminated by monochromatic light from a halogen lamp (2) passing through a monochromator (3). A laser beam (4) with energy higher than the band gap is chopped by a mechanical chopper (5) provides the modulation. A filter (6) is placed in front of the detector to block the laser light. The reflected signals are collected by a photodetector (7) and processes buy a lock-in amplifier (8). The chopper is also connected to the lock-in providing the reference frequency Halogen lamp chopper V DC V AC 6 1 filter sample
48 PR: quantum well Room temperature on InGaAsN/GaAs quantum well Kudrawiec, Wroclaw University of Technology, A single quantum well of InGaAsN/GaAs The reflectivity spectrum (R) exhibits only a very weak feature related to the bulk-like part of the structure (GaAs) at energy of 1.42 ev (GaAs band gap energy). Photoluminescence spectrum (PL) clearly indicates the energy of the ground state transition of the system (transition between first electron and first heavy hole levels in the quantum well) at the energy 0.93 ev. Photoreflectance spectrum ΔR/R, has a more complex structure all the critical transitions are observable both present the previously observed transitions (ground state and excited states in the quantum well. 48
49 PR: GaN x As 1-x 49 GaN x As 1-x 295 K E 0 E x=0 PR Signal (arb.units) E_ E_ E_+ 0 E_+ 0 E + E + (x10) x=0.008 x=0.014 E E + E + Δ o E_ E_+ 0 E + (x5) x= Photon Energy (ev) W. Walukiewicz et al., in Dilute Nitride Semiconductors, edited by M. Henini (Elsevier, Oxford, UK, 2005) Chapter 10, p
50 PR: Sn x Ge 1-x grown on Ge 50 Alberi et al., Phys. Rev. B 77, (2008). Alloying Sn in Ge results in restructuring of the valence band, giving rise to a strong decrease of the direct gap of the alloy
Lecture 20 Optical Characterization 2
 Lecture 20 Optical Characterization 2 Schroder: Chapters 2, 7, 10 1/68 Announcements Homework 5/6: Is online now. Due Wednesday May 30th at 10:00am. I will return it the following Wednesday (6 th June).
Temperature Dependent Optical Band Gap Measurements of III-V films by Low Temperature Photoluminescence Spectroscopy
 Temperature Dependent Optical Band Gap Measurements of III-V films by Low Temperature Photoluminescence Spectroscopy Linda M. Casson, Francis Ndi and Eric Teboul HORIBA Scientific, 3880 Park Avenue, Edison,
Review of Optical Properties of Materials
 Review of Optical Properties of Materials Review of optics Absorption in semiconductors: qualitative discussion Derivation of Optical Absorption Coefficient in Direct Semiconductors Photons When dealing
Luminescence basics. Slide # 1
 Luminescence basics Types of luminescence Cathodoluminescence: Luminescence due to recombination of EHPs created by energetic electrons. Example: CL mapping system Photoluminescence: Luminescence due to
Characterisation of vibrational modes of adsorbed species
 17.7.5 Characterisation of vibrational modes of adsorbed species Infrared spectroscopy (IR) See Ch.10. Infrared vibrational spectra originate in transitions between discrete vibrational energy levels of
Fall 2014 Nobby Kobayashi (Based on the notes by E.D.H Green and E.L Allen, SJSU) 1.0 Learning Objectives
 1.0 Learning Objectives") University of California at Santa Cruz Electrical Engineering Department EE-145L: Properties of Materials Laboratory Lab 7: Optical Absorption, Photoluminescence Fall 2014 Nobby Kobayashi (Based on the
University of California at Santa Cruz Electrical Engineering Department EE-145L: Properties of Materials Laboratory Lab 7: Optical Absorption, Photoluminescence Fall 2014 Nobby Kobayashi (Based on the
PHYSICS nd TERM Outline Notes (continued)
") PHYSICS 2800 2 nd TERM Outline Notes (continued) Section 6. Optical Properties (see also textbook, chapter 15) This section will be concerned with how electromagnetic radiation (visible light, in particular)
PHYSICS 2800 2 nd TERM Outline Notes (continued) Section 6. Optical Properties (see also textbook, chapter 15) This section will be concerned with how electromagnetic radiation (visible light, in particular)
Lecture 15: Optoelectronic devices: Introduction
 Lecture 15: Optoelectronic devices: Introduction Contents 1 Optical absorption 1 1.1 Absorption coefficient....................... 2 2 Optical recombination 5 3 Recombination and carrier lifetime 6 3.1
Ultraviolet-Visible and Infrared Spectrophotometry
 Ultraviolet-Visible and Infrared Spectrophotometry Ahmad Aqel Ifseisi Assistant Professor of Analytical Chemistry College of Science, Department of Chemistry King Saud University P.O. Box 2455 Riyadh 11451
Optical Properties of Solid from DFT
 Optical Properties of Solid from DFT 1 Prof.P. Ravindran, Department of Physics, Central University of Tamil Nadu, India & Center for Materials Science and Nanotechnology, University of Oslo, Norway http://folk.uio.no/ravi/cmt15
Supplementary Figure 1
 Supplementary Figure 1 XRD patterns and TEM image of the SrNbO 3 film grown on LaAlO 3(001) substrate. The film was deposited under oxygen partial pressure of 5 10-6 Torr. (a) θ-2θ scan, where * indicates
Optical Properties of Lattice Vibrations
 Optical Properties of Lattice Vibrations For a collection of classical charged Simple Harmonic Oscillators, the dielectric function is given by: Where N i is the number of oscillators with frequency ω
Optical Properties of Semiconductors. Prof.P. Ravindran, Department of Physics, Central University of Tamil Nadu, India
 Optical Properties of Semiconductors 1 Prof.P. Ravindran, Department of Physics, Central University of Tamil Nadu, India http://folk.uio.no/ravi/semi2013 Light Matter Interaction Response to external electric
Optical Characterization of CdTe Films for Solar Cell Applications
 Karachi University Journal of Science, 2011, 39, 1-5 1 Optical Characterization of CdTe Films for Solar Cell Applications Saeed Salem Babkair *, Najat Mohammad Al-Twarqi and Azhar Ahmad Ansari Department
Vibrational Spectroscopies. C-874 University of Delaware
 Vibrational Spectroscopies C-874 University of Delaware Vibrational Spectroscopies..everything that living things do can be understood in terms of the jigglings and wigglings of atoms.. R. P. Feymann Vibrational
Solar Cell Materials and Device Characterization
 Solar Cell Materials and Device Characterization April 3, 2012 The University of Toledo, Department of Physics and Astronomy SSARE, PVIC Principles and Varieties of Solar Energy (PHYS 4400) and Fundamentals
ET3034TUx Utilization of band gap energy
 ET3034TUx - 3.3.1 - Utilization of band gap energy In the last two weeks we have discussed the working principle of a solar cell and the external parameters that define the performance of a solar cell.
J. Price, 1,2 Y. Q. An, 1 M. C. Downer 1 1 The university of Texas at Austin, Department of Physics, Austin, TX
 Understanding process-dependent oxygen vacancies in thin HfO 2 /SiO 2 stacked-films on Si (100) via competing electron-hole injection dynamic contributions to second harmonic generation. J. Price, 1,2
Chapter 2 Optical Transitions
 Chapter 2 Optical Transitions 2.1 Introduction Among energy states, the state with the lowest energy is most stable. Therefore, the electrons in semiconductors tend to stay in low energy states. If they
Lecture 23 X-Ray & UV Techniques
 Lecture 23 X-Ray & UV Techniques Schroder: Chapter 11.3 1/50 Announcements Homework 6/6: Will be online on later today. Due Wednesday June 6th at 10:00am. I will return it at the final exam (14 th June).
CHEM*3440. Photon Energy Units. Spectrum of Electromagnetic Radiation. Chemical Instrumentation. Spectroscopic Experimental Concept.
 Spectrum of Electromagnetic Radiation Electromagnetic radiation is light. Different energy light interacts with different motions in molecules. CHEM*344 Chemical Instrumentation Topic 7 Spectrometry Radiofrequency
The Electromagnetic Properties of Materials
 The Electromagnetic Properties of Materials Electrical conduction Metals Semiconductors Insulators (dielectrics) Superconductors Magnetic materials Ferromagnetic materials Others Photonic Materials (optical)
Lecture 6 Optical Characterization of Inorganic Semiconductors Dr Tim Veal, Stephenson Institute for Renewable Energy and Department of Physics,
 Lecture 6 Optical Characterization of Inorganic Semiconductors Dr Tim Veal, Stephenson Institute for Renewable Energy and Department of Physics, University of Liverpool Lecture Outline Lecture 6: Optical
Ultraviolet-Visible and Infrared Spectrophotometry
 Ultraviolet-Visible and Infrared Spectrophotometry Ahmad Aqel Ifseisi Assistant Professor of Analytical Chemistry College of Science, Department of Chemistry King Saud University P.O. Box 2455 Riyadh 11451
Reflection = EM strikes a boundary between two media differing in η and bounces back
 Reflection = EM strikes a boundary between two media differing in η and bounces back Incident ray θ 1 θ 2 Reflected ray Medium 1 (air) η = 1.00 Medium 2 (glass) η = 1.50 Specular reflection = situation
Skoog Chapter 6 Introduction to Spectrometric Methods
 Skoog Chapter 6 Introduction to Spectrometric Methods General Properties of Electromagnetic Radiation (EM) Wave Properties of EM Quantum Mechanical Properties of EM Quantitative Aspects of Spectrochemical
Ellipsometry Tutorial
 Introduction Ellipsometry Tutorial [http://www.jawoollam.com/tutorial_1.html] This tutorial provided by the J. A. Woollam Co. is an introduction to ellipsometry for anyone interested in learning more about
Model Answer (Paper code: AR-7112) M. Sc. (Physics) IV Semester Paper I: Laser Physics and Spectroscopy
 M. Sc. (Physics) IV Semester Paper I: Laser Physics and Spectroscopy") Model Answer (Paper code: AR-7112) M. Sc. (Physics) IV Semester Paper I: Laser Physics and Spectroscopy Section I Q1. Answer (i) (b) (ii) (d) (iii) (c) (iv) (c) (v) (a) (vi) (b) (vii) (b) (viii) (a) (ix)
Model Answer (Paper code: AR-7112) M. Sc. (Physics) IV Semester Paper I: Laser Physics and Spectroscopy Section I Q1. Answer (i) (b) (ii) (d) (iii) (c) (iv) (c) (v) (a) (vi) (b) (vii) (b) (viii) (a) (ix)
Lecture 3: Light absorbance
 Lecture 3: Light absorbance Perturbation Response 1 Light in Chemistry Light Response 0-3 Absorbance spectrum of benzene 2 Absorption Visible Light in Chemistry S 2 S 1 Fluorescence http://www.microscopyu.com
Laser Basics. What happens when light (or photon) interact with a matter? Assume photon energy is compatible with energy transition levels.
 interact with a matter? Assume photon energy is compatible with energy transition levels.") What happens when light (or photon) interact with a matter? Assume photon energy is compatible with energy transition levels. Electron energy levels in an hydrogen atom n=5 n=4 - + n=3 n=2 13.6 = [ev]
What happens when light (or photon) interact with a matter? Assume photon energy is compatible with energy transition levels. Electron energy levels in an hydrogen atom n=5 n=4 - + n=3 n=2 13.6 = [ev]
Classification of spectroscopic methods
 Introduction Spectroscopy is the study of the interaction between the electromagnetic radiation and the matter. Spectrophotometry is the measurement of these interactions i.e. the measurement of the intensity
Lecture 0. NC State University
 Chemistry 736 Lecture 0 Overview NC State University Overview of Spectroscopy Electronic states and energies Transitions between states Absorption and emission Electronic spectroscopy Instrumentation Concepts
Interaction X-rays - Matter
 Interaction X-rays - Matter Pair production hν > M ev Photoelectric absorption hν MATTER hν Transmission X-rays hν' < hν Scattering hν Decay processes hν f Compton Thomson Fluorescence Auger electrons
Lecture 3: Optical Properties of Insulators, Semiconductors, and Metals. 5 nm
 Metals Lecture 3: Optical Properties of Insulators, Semiconductors, and Metals 5 nm Course Info Next Week (Sept. 5 and 7) no classes First H/W is due Sept. 1 The Previous Lecture Origin frequency dependence
Chapter 17: Fundamentals of Spectrophotometry
 Chapter 17: Fundamentals of Spectrophotometry Spectroscopy: the science that deals with interactions of matter with electromagnetic radiation or other forms energy acoustic waves, beams of particles such
Spectroscopy. Page 1 of 8 L.Pillay (2012)
") Spectroscopy Electromagnetic radiation is widely used in analytical chemistry. The identification and quantification of samples using electromagnetic radiation (light) is called spectroscopy. Light has
Spectroscopy Electromagnetic radiation is widely used in analytical chemistry. The identification and quantification of samples using electromagnetic radiation (light) is called spectroscopy. Light has
Chapter 4 Ultraviolet and visible spectroscopy Molecular Spectrophotometry
 Chapter 4 Ultraviolet and visible spectroscopy Molecular Spectrophotometry Properties of light Electromagnetic radiation and electromagnetic spectrum Absorption of light Beer s law Limitation of Beer s
Chapter 6 Photoluminescence Spectroscopy
 Chapter 6 Photoluminescence Spectroscopy Course Code: SSCP 4473 Course Name: Spectroscopy & Materials Analysis Sib Krishna Ghoshal (PhD) Advanced Optical Materials Research Group Physics Department, Faculty
Near field microscopy and optical spectroscopy Bringing some color to materials science Julio A. Soares, Ph.D.
 2008 Advanced Materials Characterization Workshop Near field microscopy and optical spectroscopy Bringing some color to materials science Julio A. Soares, Ph.D. Sponsors: Sponsors: Supported by the U.S.
What is spectroscopy?
 Absorption Spectrum What is spectroscopy? Studying the properties of matter through its interaction with different frequency components of the electromagnetic spectrum. With light, you aren t looking directly
Lecture contents. Burstein shift Excitons Interband transitions in quantum wells Quantum confined Stark effect. NNSE 618 Lecture #15
 1 Lecture contents Burstein shift Excitons Interband transitions in quantum wells Quantum confined Stark effect Absorption edges in semiconductors Offset corresponds to bandgap Abs. coefficient is orders
Electronic and Optoelectronic Properties of Semiconductor Structures
 Electronic and Optoelectronic Properties of Semiconductor Structures Jasprit Singh University of Michigan, Ann Arbor CAMBRIDGE UNIVERSITY PRESS CONTENTS PREFACE INTRODUCTION xiii xiv 1.1 SURVEY OF ADVANCES
Infrared Reflectivity Spectroscopy of Optical Phonons in Short-period AlGaN/GaN Superlattices
 Infrared Reflectivity Spectroscopy of Optical Phonons in Short-period AlGaN/GaN Superlattices J. B. Herzog, A. M. Mintairov, K. Sun, Y. Cao, D. Jena, J. L. Merz. University of Notre Dame, Dept. of Electrical
Spectroscopy at nanometer scale
 Spectroscopy at nanometer scale 1. Physics of the spectroscopies 2. Spectroscopies for the bulk materials 3. Experimental setups for the spectroscopies 4. Physics and Chemistry of nanomaterials Various
Chemistry Instrumental Analysis Lecture 8. Chem 4631
 Chemistry 4631 Instrumental Analysis Lecture 8 UV to IR Components of Optical Basic components of spectroscopic instruments: stable source of radiant energy transparent container to hold sample device
Chapter 1 Overview of Semiconductor Materials and Physics
 Chapter 1 Overview of Semiconductor Materials and Physics Professor Paul K. Chu Conductivity / Resistivity of Insulators, Semiconductors, and Conductors Semiconductor Elements Period II III IV V VI 2 B
Simple strategy for enhancing terahertz emission from coherent longitudinal optical phonons using undoped GaAs/n-type GaAs epitaxial layer structures
 Presented at ISCS21 June 4, 21 Session # FrP3 Simple strategy for enhancing terahertz emission from coherent longitudinal optical phonons using undoped GaAs/n-type GaAs epitaxial layer structures Hideo
Chapter 17: Fundamentals of Spectrophotometry
 Chapter 17: Fundamentals of Spectrophotometry Spectroscopy: the science that deals with interactions of matter with electromagnetic radiation or other forms energy acoustic waves, beams of particles such
Design and Development of a Smartphone Based Visible Spectrophotometer for Analytical Applications
 Design and Development of a Smartphone Based Visible Spectrophotometer for Analytical Applications Bedanta Kr. Deka, D. Thakuria, H. Bora and S. Banerjee # Department of Physicis, B. Borooah College, Ulubari,
Introduction to Spectroscopic methods
 Introduction to Spectroscopic methods Spectroscopy: Study of interaction between light* and matter. Spectrometry: Implies a quantitative measurement of intensity. * More generally speaking electromagnetic
OPTICAL ANALYSIS OF ZnO THIN FILMS USING SPECTROSCOPIC ELLIPSOMETRY AND REFLECTOMETRY.
 OPTICAL ANALYSIS OF ZnO THIN FILMS USING SPECTROSCOPIC ELLIPSOMETRY AND REFLECTOMETRY Katarína Bombarová 1, Juraj Chlpík 1,2, Soňa Flickyngerová 3, Ivan Novotný 3, Július Cirák 1 1 Institute of Nuclear
OPTICAL PROPERTIES AND SPECTROSCOPY OF NANOAAATERIALS. Jin Zhong Zhang. World Scientific TECHNISCHE INFORMATIONSBIBLIOTHEK
 OPTICAL PROPERTIES AND SPECTROSCOPY OF NANOAAATERIALS Jin Zhong Zhang University of California, Santa Cruz, USA TECHNISCHE INFORMATIONSBIBLIOTHEK Y World Scientific NEW JERSEY. t'on.don SINGAPORE «'BEIJING
Practical 1P4 Energy Levels and Band Gaps
 Practical 1P4 Energy Levels and Band Gaps What you should learn from this practical Science This practical illustrates some of the points from the lecture course on Elementary Quantum Mechanics and Bonding
Wavelength λ Velocity v. Electric Field Strength Amplitude A. Time t or Distance x time for 1 λ to pass fixed point. # of λ passing per s ν= 1 p
 Introduction to Spectroscopy (Chapter 6) Electromagnetic radiation (wave) description: Wavelength λ Velocity v Electric Field Strength 0 Amplitude A Time t or Distance x Period p Frequency ν time for 1
Because light behaves like a wave, we can describe it in one of two ways by its wavelength or by its frequency.
 Light We can use different terms to describe light: Color Wavelength Frequency Light is composed of electromagnetic waves that travel through some medium. The properties of the medium determine how light
Optical Properties of Thin Semiconductor Films
 Optical Properties of Thin Semiconductor Films Grolik Benno,KoppJoachim October, 31st 2003 1 Introduction Optical experiments provide a good way of examining the properties of semiconductors. Particulary
Self-Assembled InAs Quantum Dots
 Self-Assembled InAs Quantum Dots Steve Lyon Department of Electrical Engineering What are semiconductors What are semiconductor quantum dots How do we make (grow) InAs dots What are some of the properties
Photoluminescence and Raman Spectroscopy on truncated Nano Pyramids
 Photoluminescence and Raman Spectroscopy on truncated Nano Pyramids Physics of low Dimensions, FFF042 Josefin Voigt & Stefano Scaramuzza 10.12.2013, Lund University 1 Introduction In this project truncated
Emission Spectra of the typical DH laser
 Emission Spectra of the typical DH laser Emission spectra of a perfect laser above the threshold, the laser may approach near-perfect monochromatic emission with a spectra width in the order of 1 to 10
From here we define metals, semimetals, semiconductors and insulators
 Topic 11-1: Heat and Light for Intrinsic Semiconductors Summary: In this video we aim to discover how intrinsic semiconductors respond to heat and light. We first look at the response of semiconductors
Luminescence Process
 Luminescence Process The absorption and the emission are related to each other and they are described by two terms which are complex conjugate of each other in the interaction Hamiltonian (H er ). In an
Practical 1P4 Energy Levels and Band Gaps
 Practical 1P4 Energy Levels and Band Gaps What you should learn from this practical Science This practical illustrates some of the points from the lecture course on Elementary Quantum Mechanics and Bonding
1.1 FEATURES OF SPECTROSCOPIC ELLIPSOMETRY
 1 Introduction to Spectroscopic Ellipsometry Because of recent advances in computer technology, the spectroscopic ellipsometry technique has developed rapidly. As a result, the application area of spectroscopic
Reference literature. (See: CHEM 2470 notes, Module 8 Textbook 6th ed., Chapters )
") September 17, 2018 Reference literature (See: CHEM 2470 notes, Module 8 Textbook 6th ed., Chapters 13-14 ) Reference.: https://slideplayer.com/slide/8354408/ Spectroscopy Usual Wavelength Type of Quantum
September 17, 2018 Reference literature (See: CHEM 2470 notes, Module 8 Textbook 6th ed., Chapters 13-14 ) Reference.: https://slideplayer.com/slide/8354408/ Spectroscopy Usual Wavelength Type of Quantum
Modern Physics for Frommies IV The Universe - Small to Large Lecture 4
 Fromm Institute for Lifelong Learning University of San Francisco Modern Physics for Frommies IV The Universe - Small to Large Lecture 4 3 February 06 Modern Physics IV Lecture 4 Agenda Administrative
Chapter 6: Light-Emitting Diodes
 Chapter 6: Light-Emitting Diodes Photoluminescence and electroluminescence Basic transitions Luminescence efficiency Light-emitting diodes Internal quantum efficiency External quantum efficiency Device
(002)(110) (004)(220) (222) (112) (211) (202) (200) * * 2θ (degree)
(110) (004)(220) (222) (112) (211) (202) (200) * * 2θ (degree)") Supplementary Figures. (002)(110) Tetragonal I4/mcm Intensity (a.u) (004)(220) 10 (112) (211) (202) 20 Supplementary Figure 1. X-ray diffraction (XRD) pattern of the sample. The XRD characterization indicates
Supplementary Figures. (002)(110) Tetragonal I4/mcm Intensity (a.u) (004)(220) 10 (112) (211) (202) 20 Supplementary Figure 1. X-ray diffraction (XRD) pattern of the sample. The XRD characterization indicates
Exciton spectroscopy
 Lehrstuhl Werkstoffe der Elektrotechnik Exciton spectroscopy in wide bandgap semiconductors Lehrstuhl Werkstoffe der Elektrotechnik (WW6), Universität Erlangen-Nürnberg, Martensstr. 7, 91058 Erlangen Vortrag
An Introduction to Diffraction and Scattering. School of Chemistry The University of Sydney
 An Introduction to Diffraction and Scattering Brendan J. Kennedy School of Chemistry The University of Sydney 1) Strong forces 2) Weak forces Types of Forces 3) Electromagnetic forces 4) Gravity Types
Optical Spectroscopy of Advanced Materials
 Phys 590B Condensed Matter Physics: Experimental Methods Optical Spectroscopy of Advanced Materials Basic optics, nonlinear and ultrafast optics Jigang Wang Department of Physics, Iowa State University
Electroluminescence from Silicon and Germanium Nanostructures
 Electroluminescence from silicon Silicon Getnet M. and Ghoshal S.K 35 ORIGINAL ARTICLE Electroluminescence from Silicon and Germanium Nanostructures Getnet Melese* and Ghoshal S. K.** Abstract Silicon
Chalcogenide semiconductor research and applications. Tutorial 2: Thin film characterization. Rafael Jaramillo Massachusetts Institute of Technology
 Chalcogenide semiconductor research and applications Tutorial 2: Thin film characterization Rafael Jaramillo Massachusetts Institute of Technology Section 1: Measuring composition August 20, 2017 Jaramillo
Optical Characterization of Solids
 D. Dragoman M. Dragoman Optical Characterization of Solids With 184 Figures Springer 1. Elementary Excitations in Solids 1 1.1 Energy Band Structure in Crystalline Materials 2 1.2 k p Method 11 1.3 Numerical
2A: Absorbing Materials Pt-by-Pt and GenOsc
 2014 J.A. Woollam Co., Inc. www.jawoollam.com 1 2A: Absorbing Materials Pt-by-Pt and GenOsc Nina Hong U Penn, February 2014 2014 J.A. Woollam Co., Inc. www.jawoollam.com 2 Pt-by-Pt Fit UV Absorbing Films
Laserphysik. Prof. Yong Lei & Dr. Yang Xu. Fachgebiet Angewandte Nanophysik, Institut für Physik
 Laserphysik Prof. Yong Lei & Dr. Yang Xu Fachgebiet Angewandte Nanophysik, Institut für Physik Contact: yong.lei@tu-ilmenau.de; yang.xu@tu-ilmenau.de Office: Heisenbergbau V 202, Unterpörlitzer Straße
3.1 Introduction to Semiconductors. Y. Baghzouz ECE Department UNLV
 3.1 Introduction to Semiconductors Y. Baghzouz ECE Department UNLV Introduction In this lecture, we will cover the basic aspects of semiconductor materials, and the physical mechanisms which are at the
n ( λ ) is observed. Further, the bandgap of the ZnTe semiconductor is
 is observed. Further, the bandgap of the ZnTe semiconductor is") Optical Spectroscopy Lennon O Naraigh, 0000 Date of Submission: 0 th May 004 Abstract: This experiment is an exercise in the principles and practice of optical spectroscopy. The continuous emission spectrum
Optical Spectroscopy Lennon O Naraigh, 0000 Date of Submission: 0 th May 004 Abstract: This experiment is an exercise in the principles and practice of optical spectroscopy. The continuous emission spectrum
Physics of Semiconductor Devices. Unit 2: Revision of Semiconductor Band Theory
 Physics of Semiconductor Devices Unit : Revision of Semiconductor Band Theory Unit Revision of Semiconductor Band Theory Contents Introduction... 5 Learning outcomes... 5 The Effective Mass... 6 Electrons
Reflection = EM strikes a boundary between two media differing in η and bounces back
 Reflection = EM strikes a boundary between two media differing in η and bounces back Incident ray θ 1 θ 2 Reflected ray Medium 1 (air) η = 1.00 Medium 2 (glass) η = 1.50 Specular reflection = situation
Luminescence. Photoluminescence (PL) is luminescence that results from optically exciting a sample.
 is luminescence that results from optically exciting a sample.") Luminescence Topics Radiative transitions between electronic states Absorption and Light emission (spontaneous, stimulated) Excitons (singlets and triplets) Franck-Condon shift(stokes shift) and vibrational
Luminescence Topics Radiative transitions between electronic states Absorption and Light emission (spontaneous, stimulated) Excitons (singlets and triplets) Franck-Condon shift(stokes shift) and vibrational
Optical and Photonic Glasses. Lecture 30. Femtosecond Laser Irradiation and Acoustooptic. Professor Rui Almeida
 Optical and Photonic Glasses : Femtosecond Laser Irradiation and Acoustooptic Effects Professor Rui Almeida International Materials Institute For New Functionality in Glass Lehigh University Femto second
Semiconductor device structures are traditionally divided into homojunction devices
 0. Introduction: Semiconductor device structures are traditionally divided into homojunction devices (devices consisting of only one type of semiconductor material) and heterojunction devices (consisting
Single Emitter Detection with Fluorescence and Extinction Spectroscopy
 Single Emitter Detection with Fluorescence and Extinction Spectroscopy Michael Krall Elements of Nanophotonics Associated Seminar Recent Progress in Nanooptics & Photonics May 07, 2009 Outline Single molecule
R O Y G B V. Spin States. Outer Shell Electrons. Molecular Rotations. Inner Shell Electrons. Molecular Vibrations. Nuclear Transitions
 Spin States Molecular Rotations Molecular Vibrations Outer Shell Electrons Inner Shell Electrons Nuclear Transitions NMR EPR Microwave Absorption Spectroscopy Infrared Absorption Spectroscopy UV-vis Absorption,
Naser M. Ahmed *, Zaliman Sauli, Uda Hashim, Yarub Al-Douri. Abstract
 Int. J. Nanoelectronics and Materials (009) 89-95 Investigation of the absorption coefficient, refractive index, energy band gap, and film thickness for Al 0. Ga 0.89 N, Al 0.03 Ga 0.97 N, and GaN by optical
ANTIMONY ENHANCED HOMOGENEOUS NITROGEN INCORPORATION INTO GaInNAs FILMS GROWN BY ATOMIC HYDROGEN-ASSISTED MOLECULAR BEAM EPITAXY
 ANTIMONY ENHANCED HOMOGENEOUS NITROGEN INCORPORATION INTO GaInNAs FILMS GROWN BY ATOMIC HYDROGEN-ASSISTED MOLECULAR BEAM EPITAXY Naoya Miyashita 1, Nazmul Ahsan 1, and Yoshitaka Okada 1,2 1. Research Center
Chapter 3 Properties of Nanostructures
 Chapter 3 Properties of Nanostructures In Chapter 2, the reduction of the extent of a solid in one or more dimensions was shown to lead to a dramatic alteration of the overall behavior of the solids. Generally,
Chapter Two. Energy Bands and Effective Mass
 Chapter Two Energy Bands and Effective Mass Energy Bands Formation At Low Temperature At Room Temperature Valence Band Insulators Metals Effective Mass Energy-Momentum Diagrams Direct and Indirect Semiconduction
Light Interaction with Small Structures
 Light Interaction with Small Structures Molecules Light scattering due to harmonically driven dipole oscillator Nanoparticles Insulators Rayleigh Scattering (blue sky) Semiconductors...Resonance absorption
Signal regeneration - optical amplifiers
 Signal regeneration - optical amplifiers In any atom or solid, the state of the electrons can change by: 1) Stimulated absorption - in the presence of a light wave, a photon is absorbed, the electron is
M R S Internet Journal of Nitride Semiconductor Research
 M R S Internet Journal of Nitride Semiconductor Research Volume 2, Article 25 Properties of the Biexciton and the Electron-Hole-Plasma in Highly Excited GaN J.-Chr. Holst, L. Eckey, A. Hoffmann, I. Broser
Optical and Terahertz Characterization of Be-Doped GaAs/AlAs Multiple Quantum Wells
 Vol. 107 (2005) ACTA PHYSICA POLONICA A No. 2 Proceedings of the 12th International Symposium UFPS, Vilnius, Lithuania 2004 Optical and Terahertz Characterization of Be-Doped GaAs/AlAs Multiple Quantum
Optical Investigation of the Localization Effect in the Quantum Well Structures
 Department of Physics Shahrood University of Technology Optical Investigation of the Localization Effect in the Quantum Well Structures Hamid Haratizadeh hamid.haratizadeh@gmail.com IPM, SCHOOL OF PHYSICS,
Introduction to Optoelectronic Device Simulation by Joachim Piprek
 NUSOD 5 Tutorial MA Introduction to Optoelectronic Device Simulation by Joachim Piprek Outline:. Introduction: VCSEL Example. Electron Energy Bands 3. Drift-Diffusion Model 4. Thermal Model 5. Gain/Absorption
PH575 Spring Lecture #20 Semiconductors: optical properties: Kittel Ch. 8 pp ; Ch 15 pp
 PH575 Spring 2014 Lecture #20 Semiconductors: optical properties: Kittel Ch. 8 pp. 187-191; Ch 15 pp. 435-444 Figure VI-1-1: Different types of optical absorption phenomena; (1) transitions of highlying
Introduction to Sources: Radiative Processes and Population Inversion in Atoms, Molecules, and Semiconductors Atoms and Molecules
 OPTI 500 DEF, Spring 2012, Lecture 2 Introduction to Sources: Radiative Processes and Population Inversion in Atoms, Molecules, and Semiconductors Atoms and Molecules Energy Levels Every atom or molecule
Electron Energy, E E = 0. Free electron. 3s Band 2p Band Overlapping energy bands. 3p 3s 2p 2s. 2s Band. Electrons. 1s ATOM SOLID.
 Electron Energy, E Free electron Vacuum level 3p 3s 2p 2s 2s Band 3s Band 2p Band Overlapping energy bands Electrons E = 0 1s ATOM 1s SOLID In a metal the various energy bands overlap to give a single
Potential and Carrier Distribution in AlGaN Superlattice
 Vol. 108 (2005) ACTA PHYSICA POLONICA A No. 4 Proceedings of the XXXIV International School of Semiconducting Compounds, Jaszowiec 2005 Potential and Carrier Distribution in AlGaN Superlattice K.P. Korona,
Analytical Chemistry II
 Analytical Chemistry II L4: Signal processing (selected slides) Computers in analytical chemistry Data acquisition Printing final results Data processing Data storage Graphical display https://www.creativecontrast.com/formal-revolution-of-computer.html
NPTEL/IITM. Molecular Spectroscopy Lectures 1 & 2. Prof.K. Mangala Sunder Page 1 of 15. Topics. Part I : Introductory concepts Topics
 Molecular Spectroscopy Lectures 1 & 2 Part I : Introductory concepts Topics Why spectroscopy? Introduction to electromagnetic radiation Interaction of radiation with matter What are spectra? Beer-Lambert