Reflection = EM strikes a boundary between two media differing in η and bounces back
|
|
|
- Mark Hodge
- 5 years ago
- Views:
Transcription
1 Reflection = EM strikes a boundary between two media differing in η and bounces back Incident ray θ 1 θ 2 Reflected ray Medium 1 (air) η = 1.00 Medium 2 (glass) η = 1.50 Specular reflection = situation where angle of incidence (θ i ) equals angle of reflection (θ r )
2 I r (η 2 - η 1 ) 2 Reflectance = R = ---- = I i (η 2 + η 1 ) 2 Where I i and I r = incident & reflected intensity For radiation going from air (η = 1.00) to glass (η = 1.50) as shown in previous slide R = 0.04 = 4 % Many surfaces at 4 % each (i.e., many lenses) can cause serious light losses in a spectrometer. This generates stray radiation or stray light.
3 Reflectance varies with the angle of incidence Percent Reflectance (R) R = 4 % EM going from air (η = 1.00) to glass (η = 1.50) For monochromatic radiation, as incident angle deviates from the normal, the R tends to increase Angle of Incidence (θ i )
4 EM going from glass (η = 1.50) to air (η = 1.00) Percent Reflectance (R) R = 4 % Critical Angle EM going from a medium of higher η to a medium of lower η, the angle of incidence can only increase to the critical angle before all of the light is completely reflected back Angle of Incidence (θ i )
5 Critical Angle (Ф C ) Normal to surface At 90 o incidence sin Ф 1 = 1.0 η 1 sin Ф C = η 2 Incident ray is Ф 1 90 o to normal this is called grazing incidence Ф 2 Refracted ray Maximum value of Ф 2 Ф 2 = Ф C Medium 1 (air) Medium 2 (glass) Important for: 1) Refractometers 2) Fiber Optics
6 Critical Angle (Ф C ) Normal to surface When incidence is at the Critical angle, refraction is at 90 o η 2 sin Ф C = η 1 Refracted ray Ф 2 Medium 2 (air) Ф 1 Incident ray Maximum value of Ф 1 for Refraction Ф 1 = Ф C Medium 1 (glass) Important for: 1) Refractometers 2) Fiber Optics
7 Critical Angle (Ф C ) Normal to surface At angles greater than the Critical angle, 100 % reflection occurs or Total Internal Reflectance Refracted ray Ф 2 Medium 2 (air) Reflected ray Ф 1 Incident ray Medium 1 (glass) New value of Ф 1 for Reflection Ф 1 > Ф C Important for: 1) Refractometers 2) Fiber Optics
8 Applying UV-vis Spectrophotometry Qualitative (as discussed) I) The UV-vis absorption spectrum is related to molecular structure, therefore it provides qualitative information as to structure both from ε and λ. In order to take advantage of this it is desirable to have a scanning instrument to measure the entire spectrum (either a double beam, direct reading instrument or a single beam unit with computer interface. By itself an electronic spectrum is not sufficient to identify a compound (while an IR spectrum is)
9 Quantitative II) The UV-vis region of the spectrum is particularly well suited to quantitative analysis for several reasons (both chemical & spectroscopic reasons): 1) Large values for ε make it possible to measure low concentrations 2) Many compounds (both organic & inorganic) absorb in the UV-vis region, but most common solvents do not. This is a limiting factor in IR.
10 3) Absorption bands are broad making it easy to achieve conditions where there are no instrumental deviations from Beer s Law 4) Good instrumentation is available, i.e. good sources, detectors & monochromators III) UV-vis can be used for studying chemical processes that involve conversion of a non-absorber to an absorber or vice versa
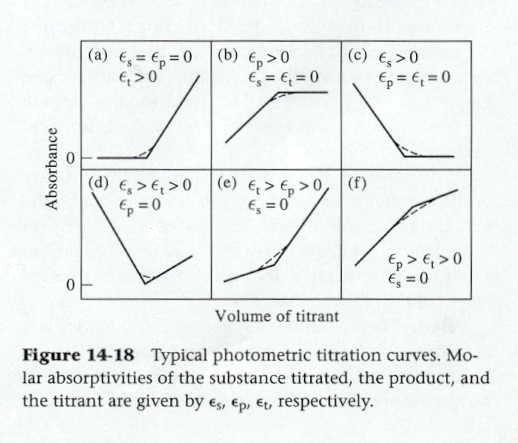
11 1) Spectrophotometric Titrations Example where titrant absorbs Sample + Titrant Product absorbs MnO Fe 2+ MnO 2 + Fe 3+ A Reaction incomplete at the endpoint Endpoint Volume of Titrant Added
12
13 2) Study Equilibria (acid-base, complex formation, redox, etc.) Reactants don t absorb M + nl ML n Fe 3+ + SCN - FeSCN 2+ Products absorb A Essentially all M is reacted to ML and excess L added 1 2 [L]/[M] Hold [M] constant and increase [L]
14 Can calculate ε ML from A at excess [L] Get n from extrapolated curve Can calculate equilibrium constant (K) from [ML n ] and mass balances K = [M] [L] n e.g. C M = [M] + [ML n ] Other calculation methods can be used A involving graphical or computer curve fitting procedures, e.g. Job s Mole ratio Method or the Method of Continuous Variation
15 3) Study Kinetics X + Y Z absorbs A Measure A vs time after mixing time For quantitative applications, we usually want to measure at one particular λ. Must first scan spectrum to determine the most suitable λ for measurements.
16 Errors in Photometric Analysis 1) Deviations from Beer s Law - either chemical or instrumental can be handled, in general, by preparing a calibration curve Important the calibration curve should include standards both at higher & lower concentrations than the sample 2) Technique errors cells must be carefully cleaned & kept free of scratches, fingerprints, etc. Clean in concentrated HNO 3. Rinse several times with water. Rinse with sample before use.
17 Round cells, e.g. Spectronic 20 cells should be positioned the same way for each measurement because of imperfections in glass (square cells too) 3) Source drift in single beam instruments. Must: a) Allow source sufficient time to warm up b) Check 0 and 100 % T settings frequently
18 4) Stray Radiation strikes detector without going through sample I o A true = log I I + o I s where I s A measured = log I + I s Stray Light Specification important characteristic of monochromators is intensity of stray radiation
19 Stray Light Specification e.g. Cary 14 I s = < 10-6 I o at all λ s Spectronic 505 I s = < 10-3 I o Stray light more serious at high concentrations (i.e. high A) makes it difficult to measure high A (i.e. A = 3 or 4) Some instruments are capable of measuring large absorbance Spec A measured = log = 1.96 for A true = I o 100 = log --- = log = 2 I 1 I s = 10-3 x 100 = 0.1
20 5) Reading Error random error involved in reading A value; today with digital readouts this usually involves: 1) Not allowing instrument to stabilize before taking the reading 2) Assuming greater precision (or accuracy) than the instrument is capable of 3) Biasing the result e.g and Are these 2 readings different from one another? Answer is NO! What about if s.d. is is 0.001?
21 Scale Expansion sometimes reading error can be improved upon by expanding scale Normally use a blank solution to set 100% T & set 0% T with shutter closed (i.e. no light) Expand scale by using a standard that has (for example) 50% T & set instrument to 100% T this expands lower end of scale by a factor of 2 & allows readings in the 0% T to 50% T range to be made with greater accuracy & precision
22 There is a limit to scale expansion imposed by instrument stability, so you can only expand scale to a point, then source and detector noise become limiting factors Can expand both ends of the scale although it is usually preferable to dilute Often reading error is not significant so it doesn t help to expand the scale
23 Luminescence light emission accompanying a transition from higher to lower energy levels 1) Phosphorescence example of photoluminescence (excited state generated by photons) often exhibited by solids like glow in the dark key chains, television screens (CRTs) & fluorescent lights 2) Fluorescence also photoluminescence which is usually observed in solution like quinine that is added to tonic water many analytical applications
24 3) Bioluminescence excited state induced biologically (enzymatic process) exhibited by fireflies, some algae & fish 4) Chemiluminescence excited state induced chemically by bond breakage, often oxidation & used for light sticks & some analytical applications 5) Triboluminescence excited state induced mechanically bite down on hard candy, also Curad bandaids 6) Electroluminescence electrical excitation found in some polymers & electric pickle
25 Photoluminescence is the most useful kind of luminescence for analysis because: 1) Many compounds exhibit this phenomenon 2) The effect can be readily produced 3) Several variables can be used to control the process (e.g. excitation λ, emission λ, pulsing or modulating excitation source, gating or synchronizing detector response) Chemiluminescence can be used for analysis also, but it is harder to control Bioluminescence is chemiluminescence Others are basically useless analytically
26 1 = absorption, 2 = vibrational relaxation, 3 = fluorescence, 4 & 7 = radiationless deactivation, 5 = intersystem crossing, 6 = phosphorescnce
27 When absorption of a photon occurs (process #1), several things can happen: Vibrational Relaxation (VR) - is a nonradiative process (#2) by which the upper vibrational levels lose energy & go to the lowest vibrational level in a given electronic energy state (very fast ~ s) Internal Conversion (IC) - non-radiative process (#4) where excited state couples to upper vibrational level of lower electronic energy level followed by VR
28 Because of Vibrational Relaxation (VR) all absorbed photons result in the promoted electron ending up in the lowest vibrational level of the first excited singlet state This level can then do one of three things: 1) Fluoresce make transition to one of the vibrational levels of the ground state giving up energy as a photon (process #3)
29 2) Radiationless Deactivation (#4) return to ground state giving up energy as heat, by internal conversion or some sort of collisional deactivation 3) Intersystem Crossing (#5) lowest vibrational level of first excited singlet couples to upper vibrational level of triplet state followed by vibrational relaxation Once formed the triplet state can go to ground state radiationlessly or by emitting a photon = phosphorescence (#6)
30 The transition T 1 S o (G) with emission of a photon is spin forbidden, has a low probability and a slow rate Fluorescence involves a spin allowed transition very probable fast rate & short lifetime (typically 1-20 nsec) Phosphorescence involves spin forbidden transition not so probable slower rate & longer lifetime ( from sec)
31
32 Moderately interesting website showing an animated Jablonski Diagram for absorption, VR, fluorescence, phosphorescence, etc. nski/lightandcolor/
33 Spectra 1) Excitation Spectrum fluorescence or phosphorescence intensity (at fixed λ) as a function of excitation λ or absorption λ 2) Fluorescence Emission Spectrum - fluorescence emission intensity vs. λ for a fixed excitation λ (= absorption λ, max.) 3) Phosphorescence Emission Spectrum phosphorescence emission intensity vs. λ for a fixed excitation λ (= absorption λ, max.)
34 Excitation Fluorescence Phosphorescence Phenanthrene Spectra
35 Fluorescence and Phosphorescence spectra are at longer λ s because the transition from S 1 S o or G is smaller than the absorption from S o (G) to some upper vibrational level of S 1 Degree of structure in fluorescence spectrum is due to the degree of solvation as discussed for absorption The rigidity of the phenanthrene molecule and its inherent lack of interaction with the solvent also plays a role in spectrum

36 Spectra 4) Excitation Emission Matrix (EEM) or Total Luminescence Spectrum 3D plot of emission for all possible combinations of excitation λ and emission λ Fluorescence Emission Intensity

37 EEMs represented as contour plots
Skoog Chapter 7 Components of Optical Instruments
 Skoog Chapter 7 Components of Optical Instruments General Design of Optical Instruments Sources of Radiation Wavelength Selectors (Filters, Monochromators, Interferometers) Sample Containers Radiation
Reflection = EM strikes a boundary between two media differing in η and bounces back
 Reflection = EM strikes a boundary between two media differing in η and bounces back Incident ray θ 1 θ 2 Reflected ray Medium 1 (air) η = 1.00 Medium 2 (glass) η = 1.50 Specular reflection = situation
R O Y G B V. Spin States. Outer Shell Electrons. Molecular Rotations. Inner Shell Electrons. Molecular Vibrations. Nuclear Transitions
 Spin States Molecular Rotations Molecular Vibrations Outer Shell Electrons Inner Shell Electrons Nuclear Transitions NMR EPR Microwave Absorption Spectroscopy Infrared Absorption Spectroscopy UV-vis Absorption,
Skoog Chapter 6 Introduction to Spectrometric Methods
 Skoog Chapter 6 Introduction to Spectrometric Methods General Properties of Electromagnetic Radiation (EM) Wave Properties of EM Quantum Mechanical Properties of EM Quantitative Aspects of Spectrochemical
Chapter 15 Molecular Luminescence Spectrometry
 Chapter 15 Molecular Luminescence Spectrometry Two types of Luminescence methods are: 1) Photoluminescence, Light is directed onto a sample, where it is absorbed and imparts excess energy into the material
Chapter 17: Fundamentals of Spectrophotometry
 Chapter 17: Fundamentals of Spectrophotometry Spectroscopy: the science that deals with interactions of matter with electromagnetic radiation or other forms energy acoustic waves, beams of particles such
Molecular Luminescence Spectroscopy
 Molecular Luminescence Spectroscopy In Molecular Luminescence Spectrometry ( MLS ), molecules of the analyte in solution are excited to give a species whose emission spectrum provides information for qualitative
Spectroscopy Problem Set February 22, 2018
 Spectroscopy Problem Set February, 018 4 3 5 1 6 7 8 1. In the diagram above which of the following represent vibrational relaxations? 1. Which of the following represent an absorbance? 3. Which of following
Chapter 17: Fundamentals of Spectrophotometry
 Chapter 17: Fundamentals of Spectrophotometry Spectroscopy: the science that deals with interactions of matter with electromagnetic radiation or other forms energy acoustic waves, beams of particles such
Singlet. Fluorescence Spectroscopy * LUMO
 Fluorescence Spectroscopy Light can be absorbed and re-emitted by matter luminescence (photo-luminescence). There are two types of luminescence, in this discussion: fluorescence and phosphorescence. A
Introduction ENERGY. Heat Electricity Electromagnetic irradiation (light)
") Photochemistry Introduction ENERGY Heat Electricity Electromagnetic irradiation (light) Vision: Triggered by a photochemical reaction Is red in the dark? The answer must be NO - Since what we see as colour
Photochemistry Introduction ENERGY Heat Electricity Electromagnetic irradiation (light) Vision: Triggered by a photochemical reaction Is red in the dark? The answer must be NO - Since what we see as colour
Chapter 6 Photoluminescence Spectroscopy
 Chapter 6 Photoluminescence Spectroscopy Course Code: SSCP 4473 Course Name: Spectroscopy & Materials Analysis Sib Krishna Ghoshal (PhD) Advanced Optical Materials Research Group Physics Department, Faculty
1901 Application of Spectrophotometry
 1901 Application of Spectrophotometry Chemical Analysis Problem: 1 Application of Spectroscopy Organic Compounds Organic compounds with single bonds absorb in the UV region because electrons from single
CHEM Outline (Part 15) - Luminescence 2013
 - Luminescence 2013") CHEM 524 -- Outline (Part 15) - Luminescence 2013 XI. Molecular Luminescence Spectra (Chapter 15) Kinetic process, competing pathways fluorescence, phosphorescence, non-radiative decay Jablonski diagram
CHEM 524 -- Outline (Part 15) - Luminescence 2013 XI. Molecular Luminescence Spectra (Chapter 15) Kinetic process, competing pathways fluorescence, phosphorescence, non-radiative decay Jablonski diagram
Spectroscopy. Page 1 of 8 L.Pillay (2012)
") Spectroscopy Electromagnetic radiation is widely used in analytical chemistry. The identification and quantification of samples using electromagnetic radiation (light) is called spectroscopy. Light has
Spectroscopy Electromagnetic radiation is widely used in analytical chemistry. The identification and quantification of samples using electromagnetic radiation (light) is called spectroscopy. Light has
Chemistry 2. Molecular Photophysics
 Chemistry 2 Lecture 12 Molecular Photophysics Assumed knowledge Electronic states are labelled using their spin multiplicity with singlets having all electron spins paired and triplets having two unpaired
Wavelength λ Velocity v. Electric Field Strength Amplitude A. Time t or Distance x time for 1 λ to pass fixed point. # of λ passing per s ν= 1 p
 Introduction to Spectroscopy (Chapter 6) Electromagnetic radiation (wave) description: Wavelength λ Velocity v Electric Field Strength 0 Amplitude A Time t or Distance x Period p Frequency ν time for 1
A Fluorometric Analysis of Quinine in Tonic Water
 A Fluorometric Analysis of Quinine in Tonic Water Introduction In this Laboratory Exercise, we will determine the amount of quinine in Tonic Water using a fluorometric analysis. Fluorescence Spectroscopy
Classification of spectroscopic methods
 Introduction Spectroscopy is the study of the interaction between the electromagnetic radiation and the matter. Spectrophotometry is the measurement of these interactions i.e. the measurement of the intensity
10/2/2008. hc λ. νλ =c. proportional to frequency. Energy is inversely proportional to wavelength And is directly proportional to wavenumber
 CH217 Fundamentals of Analytical Chemistry Module Leader: Dr. Alison Willows Electromagnetic spectrum Properties of electromagnetic radiation Many properties of electromagnetic radiation can be described
LAB #3: FLUROESCENCE SPECTROSCOPY AND ELECTRON TRANSFER (This lab is adapted from the U of MN Phsyical Chemistry lab manual)
") Chemistry 372 Gustavus Adolphus College A. Purpose LAB #3: FLUROESCENCE SPECTROSCOPY AND ELECTRON TRANSFER (This lab is adapted from the U of MN Phsyical Chemistry lab manual) In this experiment, you will
Chemistry 372 Gustavus Adolphus College A. Purpose LAB #3: FLUROESCENCE SPECTROSCOPY AND ELECTRON TRANSFER (This lab is adapted from the U of MN Phsyical Chemistry lab manual) In this experiment, you will
Introduction to Spectroscopic methods
 Introduction to Spectroscopic methods Spectroscopy: Study of interaction between light* and matter. Spectrometry: Implies a quantitative measurement of intensity. * More generally speaking electromagnetic
Lecture 3: Light absorbance
 Lecture 3: Light absorbance Perturbation Response 1 Light in Chemistry Light Response 0-3 Absorbance spectrum of benzene 2 Absorption Visible Light in Chemistry S 2 S 1 Fluorescence http://www.microscopyu.com
PART VI : MOLECULAR LUMINESCENCE SPECTROSCOPY (Recommendations 1985)
") PART VI : MOLECULAR LUMINESCENCE SPECTROSCOPY (Recommendations 1985) 1. INTRODUCTION This document does not aim to be completely self-contained since many of the terms and units needed for describing Molecular
PART VI : MOLECULAR LUMINESCENCE SPECTROSCOPY (Recommendations 1985) 1. INTRODUCTION This document does not aim to be completely self-contained since many of the terms and units needed for describing Molecular
Ultraviolet-Visible Spectroscopy
 Ultraviolet-Visible Spectroscopy Introduction to UV-Visible Absorption spectroscopy from 160 nm to 780 nm Measurement of transmittance Conversion to absorbance * A=-logT=εbc Measurement of transmittance
27-1 (a) Resonance fluorescence is observed when excited atoms emit radiation of the same
 Resonance fluorescence is observed when excited atoms emit radiation of the same") Chapter 27 27-1 (a) Resonance fluorescence is observed when excited atoms emit radiation of the same wavelength as that used to excite them. (b) Vibrational relaxation occurs when excited species collide
Chapter 27 27-1 (a) Resonance fluorescence is observed when excited atoms emit radiation of the same wavelength as that used to excite them. (b) Vibrational relaxation occurs when excited species collide
Molecular Luminescence. Absorption Instrumentation. UV absorption spectrum. lg ε. A = εbc. monochromator. light source. Rotating mirror (beam chopper)
") Molecular Luminescence Absorption Instrumentation light source I 0 sample I detector light source Rotating mirror (beam chopper) motor b sample I detector reference I 0 UV absorption spectrum lg ε A =
Molecular Luminescence Absorption Instrumentation light source I 0 sample I detector light source Rotating mirror (beam chopper) motor b sample I detector reference I 0 UV absorption spectrum lg ε A =
What is spectroscopy?
 Absorption Spectrum What is spectroscopy? Studying the properties of matter through its interaction with different frequency components of the electromagnetic spectrum. With light, you aren t looking directly
LABORATORY OF ELEMENTARY BIOPHYSICS
 LABORATORY OF ELEMENTARY BIOPHYSICS Experimental exercises for III year of the First cycle studies Field: Applications of physics in biology and medicine Specialization: Molecular Biophysics Fluorescence
Reference literature. (See: CHEM 2470 notes, Module 8 Textbook 6th ed., Chapters )
") September 17, 2018 Reference literature (See: CHEM 2470 notes, Module 8 Textbook 6th ed., Chapters 13-14 ) Reference.: https://slideplayer.com/slide/8354408/ Spectroscopy Usual Wavelength Type of Quantum
September 17, 2018 Reference literature (See: CHEM 2470 notes, Module 8 Textbook 6th ed., Chapters 13-14 ) Reference.: https://slideplayer.com/slide/8354408/ Spectroscopy Usual Wavelength Type of Quantum
Spectrophotometric Determination of Iron
 Spectrophotometric Determination of Iron INTRODUCTION Many investigations of chemical species involve the interaction between light and matter. One class of these investigations, called absorbance spectrophotometry,
Excited State Processes
 Excited State Processes Photophysics Fluorescence (singlet state emission) Phosphorescence (triplet state emission) Internal conversion (transition to singlet gr. state) Intersystem crossing (transition
Because light behaves like a wave, we can describe it in one of two ways by its wavelength or by its frequency.
 Light We can use different terms to describe light: Color Wavelength Frequency Light is composed of electromagnetic waves that travel through some medium. The properties of the medium determine how light
What the Einstein Relations Tell Us
 What the Einstein Relations Tell Us 1. The rate of spontaneous emission A21 is proportional to υ 3. At higher frequencies A21 >> B(υ) and all emission is spontaneous. A 21 = 8π hν3 c 3 B(ν) 2. Although
Ultraviolet-Visible and Infrared Spectrophotometry
 Ultraviolet-Visible and Infrared Spectrophotometry Ahmad Aqel Ifseisi Assistant Professor of Analytical Chemistry College of Science, Department of Chemistry King Saud University P.O. Box 2455 Riyadh 11451
09/05/40 MOLECULAR ABSORPTION METHODS
 MOLECULAR ABSORPTION METHODS Absorption spectroscopy refers to spectroscopic techniques that measure the absorption of radiation, as a function of wavelength ( absorption spectrum ), due to its interaction
Chapter 13 An Introduction to Ultraviolet/Visible Molecular Absorption Spectrometry
 Chapter 13 An Introduction to Ultraviolet/Visible Molecular Absorption Spectrometry 13A Measurement Of Transmittance and Absorbance Absorption measurements based upon ultraviolet and visible radiation
CHEM*3440. Photon Energy Units. Spectrum of Electromagnetic Radiation. Chemical Instrumentation. Spectroscopic Experimental Concept.
 Spectrum of Electromagnetic Radiation Electromagnetic radiation is light. Different energy light interacts with different motions in molecules. CHEM*344 Chemical Instrumentation Topic 7 Spectrometry Radiofrequency
C101-E145 TALK LETTER. Vol. 17
 C101-E145 TALK LETTER Vol. 17 UV-VIS Spectroscopy and Fluorescence Spectroscopy (Part 1 of 2) ------- 02 Applications: Spectrofluorophotometers Used in a Variety of Fields ------- 06 Q&A: Is there a way
PHOTOCHEMISTRY NOTES - 1 -
 - 1 - PHOTOCHEMISTRY NOTES 1 st Law (Grotthus-Draper Law) Only absorbed radiation produces chemical change. Exception inelastic scattering of X- or γ-rays (electronic Raman effect). 2 nd Law (Star-Einstein
Fluorescence Polarization Anisotropy FPA
 Fluorescence Polarization Anisotropy FPA Optics study of light Spectroscopy = light interacts the study of the interaction between matter & electro-magnetic radiation matter Spectroscopy Atomic Spectroscopy
Chem Homework Set Answers
 Chem 310 th 4 Homework Set Answers 1. Cyclohexanone has a strong infrared absorption peak at a wavelength of 5.86 µm. (a) Convert the wavelength to wavenumber.!6!1 8* = 1/8 = (1/5.86 µm)(1 µm/10 m)(1 m/100
Photochemical principles
 Chapter 1 Photochemical principles Dr. Suzan A. Khayyat 1 Photochemistry Photochemistry is concerned with the absorption, excitation and emission of photons by atoms, atomic ions, molecules, molecular
Lecture- 08 Emission and absorption spectra
 Atomic and Molecular Absorption Spectrometry for Pollution Monitoring Dr. J R Mudakavi Department of Chemical Engineering Indian Institute of Science, Bangalore Lecture- 08 Emission and absorption spectra
24 Introduction to Spectrochemical Methods
 24 Introduction to Spectrochemical Methods Spectroscopic method: based on measurement of the electromagnetic radiation produced or absorbed by analytes. electromagnetic radiation: include γ-ray, X-ray,
9/28/10. Visible and Ultraviolet Molecular Spectroscopy - (S-H-C Chapters 13-14) Valence Electronic Structure. n σ* transitions
 Valence Electronic Structure. n σ* transitions") Visible and Ultraviolet Molecular Spectroscopy - (S-H-C Chapters 13-14) Electromagnetic Spectrum - Molecular transitions Widely used in chemistry. Perhaps the most widely used in Biological Chemistry.
Visible and Ultraviolet Molecular Spectroscopy - (S-H-C Chapters 13-14) Electromagnetic Spectrum - Molecular transitions Widely used in chemistry. Perhaps the most widely used in Biological Chemistry.
NPTEL/IITM. Molecular Spectroscopy Lectures 1 & 2. Prof.K. Mangala Sunder Page 1 of 15. Topics. Part I : Introductory concepts Topics
 Molecular Spectroscopy Lectures 1 & 2 Part I : Introductory concepts Topics Why spectroscopy? Introduction to electromagnetic radiation Interaction of radiation with matter What are spectra? Beer-Lambert
Chemistry Instrumental Analysis Lecture 3. Chem 4631
 Chemistry 4631 Instrumental Analysis Lecture 3 Quantum Transitions The energy of a photon can also be transferred to an elementary particle by adsorption if the energy of the photon exactly matches the
CD Basis Set of Spectra that is used is that derived from comparing the spectra of globular proteins whose secondary structures are known from X-ray
 CD Basis Set of Spectra that is used is that derived from comparing the spectra of globular proteins whose secondary structures are known from X-ray crystallography An example of the use of CD Modeling
Excited States in Organic Light-Emitting Diodes
 Excited States in Organic Light-Emitting Diodes The metal-to-ligand charge transfer (MLCT) excited states of d 6 π coordination compounds have emerged as the most efficient for solar harvesting and sensitization
Luminescence Spectroscopy Excitation is very rapid (10-15 s). Vibrational relaxation is a non-radiational process. It involves vibrational levels of
. Vibrational relaxation is a non-radiational process. It involves vibrational levels of") Luminescence Spectroscopy Excitation is very rapid (10-15 s). Vibrational relaxation is a non-radiational process. It involves vibrational levels of the same electronic state. The excess of vibrational
Luminescence Spectroscopy Excitation is very rapid (10-15 s). Vibrational relaxation is a non-radiational process. It involves vibrational levels of the same electronic state. The excess of vibrational
SCINTILLATION DETECTORS AND PM TUBES
 SCINTILLATION DETECTORS AND PM TUBES General Characteristics Introduction Luminescence Light emission without heat generation Scintillation Luminescence by radiation Scintillation detector Radiation detector
Analytical Spectroscopy Review
 Analytical Spectroscopy Review λ = wavelength ν = frequency V = velocity = ν x λ = 2.998 x 10 8 m/sec = c (in a vacuum) ν is determined by source and does not change as wave propogates, but V can change
Luminescence. Photoluminescence (PL) is luminescence that results from optically exciting a sample.
 is luminescence that results from optically exciting a sample.") Luminescence Topics Radiative transitions between electronic states Absorption and Light emission (spontaneous, stimulated) Excitons (singlets and triplets) Franck-Condon shift(stokes shift) and vibrational
Luminescence Topics Radiative transitions between electronic states Absorption and Light emission (spontaneous, stimulated) Excitons (singlets and triplets) Franck-Condon shift(stokes shift) and vibrational
1 WHAT IS SPECTROSCOPY?
 1 WHAT IS SPECTROSCOPY? 1.1 The Nature Of Electromagnetic Radiation Anyone who has been sunburnt will know that light packs a punch: in scientific terms, it contains considerable amounts of energy. All
CHAPTER 2. Preliminaries A Review of Optical Physics
 CHAPTER 2 Preliminaries A Review of Optical Physics 1.1 Introduction The concentration of metal species in a variety of sample matrices has frequently been measured by observing an atom s interaction with
Experiment 12H, Parts A and B
 Experiment 12H, Parts A and B AHRM 8/17 PRINCIPLES OF EQUILIBRIUM AND THERMODYNAMICS MATERIALS: PURPOSE: 0.0200 M Fe(NO 3 ) 3 in 1 M HNO 3, 0.000200 M KSCN, 2.0 M HNO 3, solid Fe(NO 3 ) 3. 9H 2 O with
levels. The signal is either absorbance vibrational and rotational energy levels or percent transmittance of the analyte
 1 In this chapter, absorption by molecules, rather than atoms, is considered. Absorption in the ultraviolet and visible regions occurs due to electronic transitions from the ground state to excited state.
Optical Spectroscopy 1 1. Absorption spectroscopy (UV/vis)
") Optical Spectroscopy 1 1. Absorption spectroscopy (UV/vis) 2 2. Circular dichroism (optical activity) CD / ORD 3 3. Fluorescence spectroscopy and energy transfer Electromagnetic Spectrum Electronic Molecular
Optical Spectroscopy 1 1. Absorption spectroscopy (UV/vis) 2 2. Circular dichroism (optical activity) CD / ORD 3 3. Fluorescence spectroscopy and energy transfer Electromagnetic Spectrum Electronic Molecular
Chap. 12 Photochemistry
 Chap. 12 Photochemistry Photochemical processes Jablonski diagram 2nd singlet excited state 3rd triplet excited state 1st singlet excited state 2nd triplet excited state 1st triplet excited state Ground
Ch 313 FINAL EXAM OUTLINE Spring 2010
 Ch 313 FINAL EXAM OUTLINE Spring 2010 NOTE: Use this outline at your own risk sometimes a topic is omitted that you are still responsible for. It is meant to be a study aid and is not meant to be a replacement
Ultraviolet-Visible and Infrared Spectrophotometry
 Ultraviolet-Visible and Infrared Spectrophotometry Ahmad Aqel Ifseisi Assistant Professor of Analytical Chemistry College of Science, Department of Chemistry King Saud University P.O. Box 2455 Riyadh 11451
Application of IR Raman Spectroscopy
 Application of IR Raman Spectroscopy 3 IR regions Structure and Functional Group Absorption IR Reflection IR Photoacoustic IR IR Emission Micro 10-1 Mid-IR Mid-IR absorption Samples Placed in cell (salt)
10. 6 Photochemistry. Out-class reading: Levine, pp photochemistry
 Out-class reading: Levine, pp. 800-804 photochemistry 6.1 Brief introduction of light 1) Photochemistry The branch of chemistry which deals with the study of chemical reaction initiated by light. 2) Energy
What happens when light falls on a material? Transmission Reflection Absorption Luminescence. Elastic Scattering Inelastic Scattering
 Raman Spectroscopy What happens when light falls on a material? Transmission Reflection Absorption Luminescence Elastic Scattering Inelastic Scattering Raman, Fluorescence and IR Scattering Absorption
Chapter 4 Ultraviolet and visible spectroscopy Molecular Spectrophotometry
 Chapter 4 Ultraviolet and visible spectroscopy Molecular Spectrophotometry Properties of light Electromagnetic radiation and electromagnetic spectrum Absorption of light Beer s law Limitation of Beer s
Generation of light Light sources
 Generation of light Light sources Black-body radiation Luminescence Luminescence Laser Repetition Types of energy states in atoms and molecules are independent (not coupled) Energy states are non-continuous,
Lab 11: Must what goes in be the same as what comes out? Spectroscopy & Fluorescence in Chlorophyll.
 Lab 11: Must what goes in be the same as what comes out? Spectroscopy & Fluorescence in Chlorophyll. Introduction to Fluorescence: Fluorescence is one of the possible mechanisms for emission of light by
Chem 310 rd. 3 Homework Set Answers
 -1- Chem 310 rd 3 Homework Set Answers 1. A double line labeled S 0 represents the _ground electronic_ state and the _ground vibrational_ state of a molecule in an excitation state diagram. Light absorption
高等食品分析 (Advanced Food Analysis) I. SPECTROSCOPIC METHODS *Instrumental methods: 1. Spectroscopic methods (spectroscopy): a) Electromagnetic radiation
 I. SPECTROSCOPIC METHODS *Instrumental methods: 1. Spectroscopic methods (spectroscopy): a) Electromagnetic radiation") *Instrumental methods: 1. Spectroscopic methods (spectroscopy): a) Electromagnetic radiation (EMR): γ-ray emission X-Ray absorption, emission, fluorescence and diffraction Vacuum ultraviolet (UV) absorption
*Instrumental methods: 1. Spectroscopic methods (spectroscopy): a) Electromagnetic radiation (EMR): γ-ray emission X-Ray absorption, emission, fluorescence and diffraction Vacuum ultraviolet (UV) absorption
An Introduction to Diffraction and Scattering. School of Chemistry The University of Sydney
 An Introduction to Diffraction and Scattering Brendan J. Kennedy School of Chemistry The University of Sydney 1) Strong forces 2) Weak forces Types of Forces 3) Electromagnetic forces 4) Gravity Types
Analytical Chemistry II
 Analytical Chemistry II L4: Signal processing (selected slides) Computers in analytical chemistry Data acquisition Printing final results Data processing Data storage Graphical display https://www.creativecontrast.com/formal-revolution-of-computer.html
Fluorescence (Notes 16)
") Fluorescence - 2014 (Notes 16) XV 74 Jablonski diagram Where does the energy go? Can be viewed like multistep kinetic pathway 1) Excite system through A Absorbance S 0 S n Excite from ground excited singlet
Fluorescence - 2014 (Notes 16) XV 74 Jablonski diagram Where does the energy go? Can be viewed like multistep kinetic pathway 1) Excite system through A Absorbance S 0 S n Excite from ground excited singlet
Lab #12: Determination of a Chemical Equilibrium Constant
 Lab #12: Determination of a Chemical Equilibrium Constant Objectives: 1. Determine the equilibrium constant of the formation of the thiocyanatoiron (III) ions. 2. Understand the application of using a
Figure 1 Relaxation processes within an excited state or the ground state.
 Excited State Processes and Application to Lasers The technology of the laser (Light Amplified by Stimulated Emission of Radiation) was developed in the early 1960s. The technology is based on an understanding
Instrumental Chemical Analysis
 L6 page 1 Instrumental Chemical Analysis Ultraviolet and visible spectroscopy Dr. Ahmad Najjar Philadelphia University Faculty of Pharmacy Department of Pharmaceutical Sciences 2 nd semester, 2016/2017
Instrumental Chemical Analysis
 L6 page 1 Instrumental Chemical Analysis Ultraviolet and visible spectroscopy Dr. Ahmad Najjar Philadelphia University Faculty of Pharmacy Department of Pharmaceutical Sciences 2 nd semester, 2016/2017
Chem 321 Lecture 18 - Spectrophotometry 10/31/13
 Student Learning Objectives Chem 321 Lecture 18 - Spectrophotometry 10/31/13 In the lab you will use spectrophotometric techniques to determine the amount of iron, calcium and magnesium in unknowns. Although
Spectroscopy: Introduction. Required reading Chapter 18 (pages ) Chapter 20 (pages )
 Chapter 20 (pages )") Spectroscopy: Introduction Required reading Chapter 18 (pages 378-397) Chapter 20 (pages 424-449) Spectrophotometry is any procedure that uses light to measure chemical concentrations Properties of Light
Spectroscopy: Introduction Required reading Chapter 18 (pages 378-397) Chapter 20 (pages 424-449) Spectrophotometry is any procedure that uses light to measure chemical concentrations Properties of Light
INSTRUCTOR S MANUAL MOLECULAR AND ATOMIC SPECTROSCOPY
 INSTRUCTOR S MANUAL MOLECULAR AND ATOMIC SPECTROSCOPY Thomas Wenzel, Bates College The problem sets on spectroscopy can be used in at least two different manners. The primary intent is to use these as
Fluorescence Workshop UMN Physics June 8-10, 2006 Basic Spectroscopic Principles Joachim Mueller
 Fluorescence Workshop UMN Physics June 8-10, 2006 Basic Spectroscopic Principles Joachim Mueller Fluorescence, Light, Absorption, Jablonski Diagram, and Beer-Law First stab at a definition: What is fluorescence?
Model Answer (Paper code: AR-7112) M. Sc. (Physics) IV Semester Paper I: Laser Physics and Spectroscopy
 M. Sc. (Physics) IV Semester Paper I: Laser Physics and Spectroscopy") Model Answer (Paper code: AR-7112) M. Sc. (Physics) IV Semester Paper I: Laser Physics and Spectroscopy Section I Q1. Answer (i) (b) (ii) (d) (iii) (c) (iv) (c) (v) (a) (vi) (b) (vii) (b) (viii) (a) (ix)
Model Answer (Paper code: AR-7112) M. Sc. (Physics) IV Semester Paper I: Laser Physics and Spectroscopy Section I Q1. Answer (i) (b) (ii) (d) (iii) (c) (iv) (c) (v) (a) (vi) (b) (vii) (b) (viii) (a) (ix)
Characterisation of vibrational modes of adsorbed species
 17.7.5 Characterisation of vibrational modes of adsorbed species Infrared spectroscopy (IR) See Ch.10. Infrared vibrational spectra originate in transitions between discrete vibrational energy levels of
A Guide to Recording Fluorescence Quantum Yields
 Oa~äëíçåd~êÇÉåëIpí~åãçêÉIjáÇÇäÉëÉñe^TN_nIrh A Guide to Recording Fluorescence Quantum Yields Introduction: When a fluorophore absorbs a photon of light, an energetically excited state is formed. The fate
UV-VIS Spectroscopy and Fluorescence Spectroscopy (Part 2 of 2)
") C101-E150 Vol. 18 UV-VIS Spectroscopy and Fluorescence Spectroscopy (Part 2 of 2) ------- 02 Applications: Introduction of Examples of Chemiluminescence and Electroluminescence Analyses Using a Spectrofluorophotometer
C101-E150 Vol. 18 UV-VIS Spectroscopy and Fluorescence Spectroscopy (Part 2 of 2) ------- 02 Applications: Introduction of Examples of Chemiluminescence and Electroluminescence Analyses Using a Spectrofluorophotometer
Electronic Excitation by UV/Vis Spectroscopy :
 SPECTROSCOPY Light interacting with matter as an analytical tool III Pharm.D Department of Pharmaceutical Analysis SRM College Of Pharmacy,Katankulathur Electronic Excitation by UV/Vis Spectroscopy : X-ray:
PHYSICS nd TERM Outline Notes (continued)
") PHYSICS 2800 2 nd TERM Outline Notes (continued) Section 6. Optical Properties (see also textbook, chapter 15) This section will be concerned with how electromagnetic radiation (visible light, in particular)
PHYSICS 2800 2 nd TERM Outline Notes (continued) Section 6. Optical Properties (see also textbook, chapter 15) This section will be concerned with how electromagnetic radiation (visible light, in particular)
Spectrochemical methods
 Spectrochemical methods G. Galbács The interactions of radiations and matter are the subject of spectroscopy py or spectrochemical methods (also called spectrometry). Spectrochemical methods usually measure
Department of Chemistry Physical Chemistry Göteborg University
 Department of Chemistry Physical Chemistry Göteborg University &RQVWUXFWLRQRIDSXOVHGG\HODVHU 3OHDVHREVHUYHWKDWWKHVDIHW\SUHFDXWLRQVRQSDJHPXVW EHIROORZHGRWKHUZLVHWKHUHLVDULVNRIH\HGDPDJH Renée Andersson -97,
Complete the following. Clearly mark your answers. YOU MUST SHOW YOUR WORK TO RECEIVE CREDIT.
 CHEM 322 Name Exam 3 Spring 2013 Complete the following. Clearly mark your answers. YOU MUST SHOW YOUR WORK TO RECEIVE CREDIT. Warm-up (3 points each). 1. In Raman Spectroscopy, molecules are promoted
Advanced Spectroscopy Laboratory
 Advanced Spectroscopy Laboratory - Raman Spectroscopy - Emission Spectroscopy - Absorption Spectroscopy - Raman Microscopy - Hyperspectral Imaging Spectroscopy FERGIELAB TM Raman Spectroscopy Absorption
Course: M.Sc (Chemistry) Analytical Chemistry Unit: III
 Analytical Chemistry Unit: III") Course: M.Sc (Chemistry) Analytical Chemistry Unit: III Syllabus: Principle of spectrophotometry Types of spectrophotometer Applications - Dissociation constants of an indicator simultaneous spectrophotometric
Course: M.Sc (Chemistry) Analytical Chemistry Unit: III Syllabus: Principle of spectrophotometry Types of spectrophotometer Applications - Dissociation constants of an indicator simultaneous spectrophotometric
Analytical Topics to Consider in preparation for the MFAT/GRE
 Analytical Topics to Consider in preparation for the MFAT/GRE 1. Solutions and Measurement: (CHEM 222) Describe the steps in a chemical analysis Know the meaning and use of the following solution concentrations.
CHAPTER 13 Molecular Spectroscopy 2: Electronic Transitions
 CHAPTER 13 Molecular Spectroscopy 2: Electronic Transitions I. General Features of Electronic spectroscopy. A. Visible and ultraviolet photons excite electronic state transitions. ε photon = 120 to 1200
A Fluorometric Analysis of Quinine in Tonic Water
 A Fluorometric Analysis of Quinine in Tonic Water CHEM 329 Professor Vogt TA: Sam Rosolina Allison Poget Date Performed: March 29, 2016 Date Submitted: April 5, 2016 ABSTRACT In this experimental, various
Chemistry 1215 Experiment #11 Spectrophotometric Analysis of an Unknown Brass Sample
 Chemistry 1215 Experiment #11 Spectrophotometric Analysis of an Unknown Brass Sample Objective In this experiment you will use spectrophotometric measurements to determine the copper concentration of a
Chemistry 524--Final Exam--Keiderling Dec. 12, pm SES
 Chemistry 524--Final Exam--Keiderling Dec. 12, 2002 --4-8 pm -- 238 SES Please answer all questions in the answer book provided. Calculators, rulers, pens and pencils are permitted plus one 8.5 x 11 sheet
Determining Riboflavin Content in a Multivitamin: Things to do before the lab
 Determining Riboflavin Content in a Multivitamin: Things to do before the lab Calculate everything you can that you can in advance Step 1: Calculate the dilution of a 4.0 M solution to 1 L of a 0.02 M
Concepts, Techniques. Concepts, Techniques 9/11/2012. & Beer s Law. For a simple, transparent, COLORED material, e.g. ROYGBV
 9//22 OBJECTIVES Spectrophotometry of Food Dyes & Beer s Law Last Update: 9//22 9:54 AM What is the quantitative basis for the color of substances? How is the absorption/transmission of light measured?
Assumed knowledge. Chemistry 2. Learning outcomes. Electronic spectroscopy of polyatomic molecules. Franck-Condon Principle (reprise)
") Chemistry 2 Lecture 11 Electronic spectroscopy of polyatomic molecules Assumed knowledge For bound excited states, transitions to the individual vibrational levels of the excited state are observed with
Chemistry 2 Lecture 11 Electronic spectroscopy of polyatomic molecules Assumed knowledge For bound excited states, transitions to the individual vibrational levels of the excited state are observed with