A new prediction strategy for long local protein. structures using an original description
|
|
|
- Edwina Webster
- 6 years ago
- Views:
Transcription

1 Author manuscript, published in "Proteins Structure Function and Bioinformatics 2009;76(3):570-87" DOI : /prot A new prediction strategy for long local protein structures using an original description Aurélie Bornot 1, Catherine Etchebest 1 & Alexandre G. de Brevern 1 1 Equipe de Bioinformatique Génomique et Moléculaire (EBGM), INSERM UMR- S726, DSIMB workgroup, Université Paris Diderot - Paris 7, Institut National de la Transfusion Sanguine, 6 rue Alexandre Cabanel, Paris Cedex 15, FRANCE. Corresponding author Correspondence to: Aurelie BORNOT (aurelie.bornot@univ-paris-diderot.fr), Equipe de Bioinformatique Génomique et Moléculaire (EBGM), INSERM UMR- S726, DSIMB workgroup, Université Paris Diderot - Paris 7, Institut National de la Transfusion Sanguine, 6 rue Alexandre Cabanel, Paris Cedex 15, FRANCE. Phone/Fax : / Short title: Protein Long Local Structure Prediction Keywords: library of fragments, structural networks, local structure prediction, support vector machines, ab initio
2 Abstract: A relevant and accurate description of three-dimensional (3D) protein structures can be achieved by characterising recurrent local structures. In a previous study, we developed a library of 120 3D structural prototypes encompassing all known 11- residues long local protein structures and ensuring a good quality of structural approximation. A local structure prediction method was also proposed. Here, overlapping properties of local protein structures in global ones are taken into account in order to characterize frequent local networks. At the same time, we propose a new long local structure prediction strategy which involves the use of evolutionary information coupled with Support Vector Machines (SVMs). Our prediction is evaluated by a stringent geometrical assessment. Every local structure prediction with a Cα RMSD less than 2.5 Å from the true local structure is considered as correct. A global prediction rate of 63.1% is then reached, corresponding to an improvement of 7.7 points compared to the previous strategy. In the same way, the prediction of 88.33% of the 120 structural classes is improved with 8.65 % mean gain. And 85.33% of proteins have better prediction results with a 9.43 % average gain. An analysis of prediction rate per local network also supports the global improvement and gives insights into the potential of our method for predicting super local structures. Moreover, a confidence index for the direct estimation of prediction quality is proposed. Finally, our method is proved to be very competitive with cutting-edge strategies encompassing three categories of local structure predictions
3 Introduction Three-dimensional (3D) structural information is very critical for understanding the functional properties of proteins. Therein, 3D structures are a valuable source of data for understanding their biological roles, their potential implication in diseases, and for progress in drug design 1-3. It is now admitted that the folded state of proteins, i.e. the native 3D structure, may be described by a limited set of recurring local structures 4,5. Besides, native-like local structures were experimentally observed during folding pathways and, thus, could have a guiding role in the folding process toward the global native structure 4,6. These observations support the idea that local structures are relevant in characterizing native folds and that the structural information encoded in sequence segments should be predictable and useful for proposing relevant structural models 7,8. In addition, costs and difficulties associated with experimental determination of protein 3D global structures led the prediction of pertinent structural models from sequence to become a major area of interest. In this context, prediction of accurate local structure characteristics is a promising field and, can provide relevant information and constraints for global structure prediction 9,10. Indeed, some of the most successful prediction methods in competition at CASP7 in the hardest category, the new fold prediction, used biased sampling of structural fragments and assembly techniques combined in different strategies 11. Accordingly, fragment libraries or structural alphabets were designed to characterize in the most suitable way, the local structures of all proteins with known 3D structures. These alphabets consist of a finite set of representative structural fragments. They have been reviewed in 12. They differ by the number of local - 3 -
4 structure groups and representatives, the fragments length and the selected criteria and methods used to design them, e.g., 10,13. We had previously developed such a structural alphabet named Protein Blocks (PBs), with the aim of not only characterizing the local structures observed among the largest set of known proteins 3D structures but also at identifying optimal sequencestructure specificities for prediction purpose 14,15. It was developed by using an unsupervised cluster analyser and by relying on series of eight dihedral angles characterizing five-residue long fragments observed in protein structures. Thus, this alphabet is optimally composed of 16 structural classes. Each class is represented by a PB, i.e. an average dihedral vector. The Protein Blocks alphabet takes into account the preference of consecutive fragments to occur in a sequence and, has been shown to be highly informative and to have the best predictive ability among those tested by Karchin and co-workers 16. PBs have been designed to describe protein 3D backbones 15 and to predict local structures 13. They have been successfully used to predict short loop regions 17, to superimpose protein structures 18,19, to mine PDB 20, to help difficult modelling of transmembrane proteins 21, to study mutation structural consequences 22, to rebuild protein structure 23 and for the for the discovering of functional structural motifs 24. Recently, we proposed an extension of this description with a novel library consisting of 120 overlapping structural classes of 11-residues long fragments 25. This library was constructed with an original unsupervised structural clustering method called the Hybrid Protein Model (HPM) 26,27. The Hybrid Protein principle is similar to a self-organizing neural network 28,29. It was constructed as a ring of N neurons (here N=120), each representing a cluster of structurally similar 3D fragments encoded into series of PBs. Its training strategy consisted in learning the similarities - 4 -
5 between protein fragments by aligning them according to their PB series. Once the HPM was trained, each neuron or cluster was associated with a set of fragments representing a structural class 25. For each class, a mean representative fragment, or a local structure prototype (LSP), was chosen. The 120 LSPs correctly approximated the local structure ensembles. The major advantage of this library is its capacity to capture the continuity between the identified recurrent local structures. Relevant sequence-structure relationships were also observed. This permitted us to develop an original method for the prediction of long local protein structures from sequence. The principal interest of this method is that, for a target sequence of 11-residue long, it proposes a short list of the best structural candidates among the 120 LSPs of the library. This prediction was assessed by a geometrical criterion, i.e. a prediction was considered as correct if the Cα RMSD between the best candidate and the true local structure was less than of 2.5 Å. The prediction rate based on single sequence information reached 51.2%, a satisfying result taking into accounts the very large size of the library and the long length of fragments 25. Compared to other local structure libraries, the long length of the fragments studied here is worth being stressed. As a matter of fact, until our previous work in 2006, no local structure library handled fragments as long as 11 residues for prediction purposes. Actually, libraries have often been developed for fragments encompassing 4 to 9 residues 12. Only Bystroff and Baker developed the I-sites library characterizing fragments of 3 to 15 residues. A prediction method was associated but the results were assessed for fragments of 8 residue-long only 30. Recently, Beaten and co-workers constructed the BriX database encompassing more than 1000 frequent local conformations ranging from 4 to 14 residues 31. Similarly, Sawada and Honda developed a database of structural clusters taking into account fragments of 5, 9, 11 and 15 residues 32. But, in these cases, - 5 -
6 prediction methods were not developed. Indeed, 11 residue fragments correspond to long patterns for analysis and prediction of protein local structures. Thus owing to the greater length of the fragments, the LSP library associated to its prediction method represents the first attempt to trap the consequences of long-range interactions at both sequence and structure levels. In the present work, three main points were addressed: i) the development of a new strategy for protein local structure prediction using LSPs, ii) the proposal of an index for directly assessing the relevance of the prediction at each sequence site and iii) the evaluation of the quality of prediction using an original description of long fragments that relies on the overlapping properties of prototypes. The novel prediction approach still takes advantage of the features of the LSPs library. In addition, the method benefits from the use of sequence information of proteins homologous to target. Evolutionary information is widely being used for different prediction purposes and is well known to improve the quality of prediction. 33. Moreover, the learning process is performed using Support Vector Machines (SVMs), a sophisticated classifier which has already been used successfully in various fields related to protein structure prediction 10, We take care of preserving a well-balanced prediction rate for each one of the 120 structural classes. The results obtained were compared and discussed with other tested schemas of prediction. An index that directly estimates the quality of each prediction and the relevance of the structural candidates for each fragment sequences all along a protein sequence was also proposed. Finally, we analyze the results in the light of a new structural description. Taking into account the most frequent transitions between LSPs in the whole - 6 -
7 databank, preferential sub-networks can be delineated. The latter encompass long structural fragments and even super-secondary structures. This representation reminds, at a different scale, the network representation of Protein Blocks we previously designed and that permitted to define Structural Words 36. Apart from its structural interest for defining rather long structures, this new representation was also used to assess the local structure prediction results. Methods Protein structural databank and datasets A databank of 1041 X-ray structures (available on request) was extracted using PDB-REPRDB 37 such that they share a resolution better than 2 Å, no more than 30% pair wise sequence identity and a Cα RMSD between them higher than 10 Å. Each protein structure was then analysed as overlapping fragments of 11 residues. The assignment of each fragment to a given HPM structural class was based on the minimal Cα RMSD criteria with the representative local structural prototype (named LSP) of the given class. A total of 251,497 fragments were obtained and encoded in terms of LSPs. Three protein datasets have been extracted from this databank (see Figure 1). Set 1 (half of the structure databank, i.e. 521 proteins, 125,074 fragments), was used as an independent set to deduce the relation between confidence index categories and prediction rate. Set 2 (the first quarter of the structure databank, i.e. 261 proteins, 62,194 fragments, different from set 1) was used as a training set for the SVM prediction procedure and the confidence index calibration. Set 3 was a validation set used to assess the local structure prediction method and the relevance of confidence - 7 -
8 index in inferring the prediction quality (the last quarter of the structure databank, i.e. 259 proteins, 64,229 fragments). In addition, for each structural class s, a machine learning we named an expert was trained to discriminate between fragments associated to the class s and those which are not (see Figure 1). Henceforth, for a given class s, a training subset was derived from set 2. Half of this training subset was made of 3D fragments assigned to s (positive part) and half was composed of the same number of 3D fragments taken randomly from other clusters and showing a Cα RMSD structural dissimilarity superior to 1.5 Å compared to the LSP of s (negative part). Prediction strategy for long local protein structures Overview of the prediction method The prediction method relies on an expert system. For each local structural class s represented by its LSP, an expert (LSP-expert) is trained to optimally discriminate between fragment sequences associated to s (positive examples) relative to other classes (negative examples). Each LSP-expert computes a compatibility score of a target sequence window with the class considered. The 120 scores are then ordered and finally, a jury selects the 5 top-scoring classes and proposes their representative LSPs as structural candidates. Representation of the target amino-acid sequence Sequence profiles defined by Position-Specific Scoring Matrices (PSSM) were built using PSI-BLAST 38 to gather the evolutionary information. Similarly to our previous studies 13,25, we considered enlarged sequence windows that are 21 residues - 8 -
9 in length (marked from -10 to +10 and centred at 0) to take account of the amino acid content in the neighbourhood. A PSSM was first computed starting with the complete target protein sequence: PSI-BLAST searches were carried out up to four iterations against the nonredundant SWISS-PROT databank 39 with an the e-value threshold of The software blastpgp v was used (ftp://ftp.ncbi.nih.gov/blast/executables/release/2.2.13). Then, the PSSM was cut into overlapping matrices corresponding to the sequence fragments composing the whole protein sequence. So, each fragment sequence is represented by a PSSM of dimension 21 x 20 whose elements correspond to the log-likelihood of an amino-acid AA k substitution at a position y in the template. The values of the PSSM profiles were linearly scaled to the range [-1; +1] with the software LIBSVM 40. Definition of the expert predictors by support vector machines (SVMs) In this study, the prediction strategy is based on an expert system defined by SVMs. SVMs are a generalisation of the linear classifiers 41. We used SVM light that provides a fast optimization algorithm for SVMs 42. The principle of the training stands in two steps. Firstly, the dataset is projected into a different space using a kernel function which defines the similarity between a given pair of objects 43. We chose a radial basis function kernel (RBF) that was successfully used in recent studies related to protein structure prediction 10,33. It first implies the selection of a parameter γ : K ( x, x') = exp( γ x x' ) for γ > 0 where x et x' are two examples of the dataset 2 (1) In addition, SVM method consists in defining the optimal hyperplane that is the farthest from any training example and minimizes the training errors. The - 9 -
10 procedure depends on an additional parameter, i.e. a parameter C that represents the trade-off between minimizing the training error and maximizing the margins. In addition to C, a parameter λ can also be optimized. It determines the extent by which training errors on positive examples outweigh errors on negative ones and, thus corresponds to an asymmetric regularisation of parameter C. The SVM experts were trained using the training subsets derived from set 2 (see Figure 1). Optimal values for γ, C, and λ, were obtained for each structural class s through grid-searches and cross-validation. These parameters were optimized two by two, i.e. γ vs. C and γ vs. λ for keeping manageable CPU time calculation. The parameter ranges proposed by Hsu and co-workers 44 were tested and empirically adapted to our optimization procedure. For each structural class s, a cross-validation procedure was performed: the training subset was randomly divided in 2 sets containing the same number of positive and negative examples. The first part, representing 2/3 of the data was used to train the SVM with a given parameter pair (γ,λ) or (γ,c); the remaining part was then used as a validation set. For each parameters pair (γ,λ) or (γ,c), this process was repeated 5 times and, the mean of the obtained classification rates was calculated. Finally, for a given class s, the selected parameters pair (γ,λ) or (γ,c) maximized the mean classification rate. Once an optimal pair (γ,λ) or (γ,c) was selected for each structural class, the definitive training of the SVM experts was carried out on all subsets. Only results concerning the parameters pair (γ,λ) leading to the best prediction performance will be presented. Results associated to the pair (γ,c) are presented in supplementary data I
11 For the prediction of a given fragment sequence f, the LSP-SVM expert trained for class s computes a decision value v s that is proportional to the geometric distance of f from the maximum margin separating hyper plane fitted for s. Jury and decision rule for prediction The compatibility of a fragment sequence f with a given LSP is measured by the decision value or score given by each LSP-expert. The 120 scores thus obtained are ranked in descending order and a jury selects the best structural prototypes as candidates for the local 3D structure. This strategy of ranking classifier outputs was used in our previous study which relied on experts defined by logistic functions 25. In the same way, Kuang and co-workers used the same strategy with SVM while predicting 9-residue local structures, i.e. they took the maximum margin given by SVM classifiers specialized for each class 45. Finally a list of five candidates was proposed reducing considerably the number of possible structures for a given target sequence fragment. Evaluation of the predicted local structures The prediction strategies were assessed on set 3. Two types of evaluation schemes were tested. In the first one, a prediction for a target sequence window was defined as successful when the assigned LSP s was found among the predicted candidates. This evaluation was named Q 120. In the second scheme, a geometrical assessment was done, i.e. the prediction was considered to be successful if the Cα RMSD between one of the LSP candidates in the list and the true local structure was lower than a given threshold. Three thresholds were considered, i.e. 1.5, 2.0 and 2.5 Å. In order to simplify the reading of this study, the results with the two first approximations are summarized in supplementary data II. We will here mainly
12 concentrate on the latter approximation. As a matter of fact, we had shown in our previous study that this threshold was quite stringent. We studied the distribution of Cα RMSD values between 11-residue fragments randomly chosen from the databank. The Cα RMSD was calculated only if these fragments encoded into series of 7 Protein Blocks (PBs) differed by more than 5 PBs. The mean of this distribution was 4.5 Å (σ = 1.1 Å). The probability for a random match with Cα RMSD < 2.5 Å was For reference purpose, it is worth noting that this threshold is comparable to the value chosen by Yang and Wang (2.4 Å threshold) to evaluate the proportion of 9-residue fragments that was correctly predicted by their methodology 6. Analysis of the prediction according to LSPs categories The 120 LSPs are necessary to give a correct approximation of known local structures. Nevertheless, for analysis purposes, regrouping of LSPs in different coarser categories of LSPs can be done. For instance, secondary-structure-like categories can be defined 25 : Helical (H), Extended core (E), Extended edges (Ext) or Connecting (C) structures that respectively encompass, 16 LSPs, 13, 40 and 51 LSPs respectively. We defined a new description that is based on the overlapping property of LSPs and consists in grouping LSPs according to transition probabilities from one LSP to another in global structures. A network characterizing the chaining of all LSPs was defined accordingly (see Figure 2). The transition probability P from a LSP x x y to another LSP y was calculated as following: N x y x y = (2) Nx P where N was the number of observed transitions from x to y and N x the x y number of transitions from x
13 This global network was then iteratively divided into sub-networks. A subnetwork was definitely defined if composed of less than 20 LSPs and if its inner transition probabilities are higher than a probability p. p had an initial value of 0.20 and was then increased by steps of The process was stopped when no subnetwork of more than 20 LSPs was left. At this point p equaled Hence, the last two sub-networks created, 6 and 7, encompassed very frequent transitions higher than Considering all the defined sub-networks, 16.8 % of the transition probabilities considered (higher than 0.20) were higher than 0.50 and 4 % were higher than The maximum probability value was 0.86 between LSPs 101 and 102 in network 5. Like a pruning process, this iterative procedure progressively yielded to 7 subnetworks sufficiently populated and exhibiting significant transition probabilities. 52 LSPs remained as components of small sub-networks composed of less than 5 LSPs and even as isolated LSPs. They were further clustered into three groups according to their size and their inner and outward transition probabilities. Thus, ten substructures composed of different LSPs with preferential transitions finally emerged. Evaluation of the efficiency of the method compared to other predictions. We compare the efficiency of our prediction strategy coupling SVM with PSSM (and thus named SVM_PSSM) with four kinds of predictions: i) A random prediction: five candidates for each fragment sequence in set 3 are selected randomly 25. ii) A Naïve prediction : for each sequence of 21-residue long of set 3, the 5 most similar sequences in set 1 were selected. Similarity scores were computed using BLOSUM62 matrix. The corresponding fragment structures were superimposed to that of the target sequence, only considering the central 11-residue fragment
14 (positions 6 to 16 of the sequence fragment). This strategy is similar to the very first step of prediction associated with the use of fragment libraries like in Rosetta 46. iii) Different prediction schemas based on LSPs: SVM_seq: SVM learning without the use of PSSMs, i.e. for a single sequence. LR_seq: a logistic regression with single sequence, i.e. the prediction methodology developed in 25. LR_PSSM: a logistic regression with PSSM matrices. iv) Other cutting-edge methods described in the Discussion section. All these predictions were assessed with the Q 120 and the geometrical criterion Definition of a confidence index The confidence index (CI) was defined by making use of SVM expert decisions. A local structure prediction was performed on set 2 using the SVM_PSSM strategy. For each target fragment sequence, the 120 decisions of experts were retrieved and associated to correct or incorrect prediction classes according to the geometric criterion. This data was used for training a new SVM (namely SVM CI ) to learn which expert decision ensembles lead to correct or incorrect prediction. The procedure was quite similar to what was done for local structure prediction and was carried out with the optimisation of γ and C parameters (for more details see supplementary data III). The Confidence Index CI is defined as the decision value of SVM CI model. This model was assessed on the prediction results obtained on two independent sets, set 1 and set 3. The results obtained with set 1 were used for deciphering the optimal relationship between the CI categories and the prediction rate. This relationship was checked on set
15 Results The grouping of LSPs according to their preferential transitions in protein structures is first described. Then, the new local structure prediction strategy using support vector machines coupled with PSSM is assessed (SVM_PSSM). The efficiency of the prediction is discussed for the different sub-networks that group LSPs according to their most probable transitions. Finally, a confidence index that gives a direct indication of prediction quality is assessed. Analysis of preferential structural transitions between LSPs An analysis of the LSP structural transitions in protein structures, led to the LSP network presented in Figure 2. Using an iterative pruning procedure of this network, we defined ten LSP groups characterizing preferential transitions of local structures in global protein structures. The composition and the transitions of the most significant categories, or sub-networks, are described in Figure 3 and supplementary data IV. Each sub-network comprises a limited number n of LSPs (n ranges from 5 to 16). Owing to possible branching and transitions probabilities, it characterizes superlocal structures composed of at most n LSPs. Sub-networks 1 and 2 can characterize the fold of 15-residue sequences. Subnetwork 1 is composed of 5 LSPs and includes a helical LSP followed by four specific different connection LSPs defining a β-turn. Thus, this sub-network can be defined as a super-secondary structure, α-c cap -β-turn. It encompasses LSPs characterizing 2.74 % of fragments. The LSPs 44, 45 and 46 are respectively assigned to 0.67, 0.74 and 0.70 % of fragments. They are thus rather frequent LSPs given the great number of classes. As a matter of fact, each one of the 120 is assigned to 0.83 % of fragments in average (σ = 0.56) and the distribution has a median of 0.71 %. LSPs 47 and 48 are
16 less frequent, i.e. they represent 0.33 and 0.30 % of fragments. This relative rarity strengthens the significance of the succession of LSPs 46 and 47 observed in protein structures ( P =27.53 %). Sub-network 2 is composed of 12 LSPs encompassing 6.57 % of fragments. As an example, the super-secondary structure shown in Figure 3, corresponds to a pathway involving transitions from LSPs 51 to 60. It is composed of four LSPs associated to extended edges leading to an extended core LSP. All supersecondary structures defined by this sub-network begin with a β-turn followed by a small β-strand, and then a second one, longer than the first, and nearly orthogonal to this latter. We define this super secondary structure as a turn-ββ-corner. The core of this sub-network also encompasses frequent LSPs like 57, 58, 59 or 60 that characterize the more frequent type of corner, with occurrence frequencies of 0.91, 0.78, 0.63 and 0.79 respectively. Sub-networks 3 and 4 comprise 6 LSPs. Sub-network 3 describes the chaining of 4 four successive LSPs while sub-network 4 characterizes the transition of at the most 5 successive LSPs, i.e. sequences of up to 14 and 15-residue long. Sub-network 3 proposes alternative ways to enter a β-strand after a change in the direction of the backbone, always involving an α-turn. We thus named this sub-network α-turn-βstrand. LSPs of this sub-network represent 4.05 % of fragments. LSPs 106 and 96, characterizing this pathway for entering a β-strand, are among the 35 % most frequent ones with frequencies of 0.89 and 0.91 % respectively. On the contrary, sub-network 4 proposes a different situation where β-strand endings lead to a direction change in the backbone due to a β-turn. In general, this direction change leads to another extended structure. Nevertheless, in each case, this pathway includes bulge-like irregularities. Sub-network 4 was identified as an Irregular β-hairpin-turn. In this case also, LSPs 118, 84, 85, present in the core of this sub-network, are among the
17 most frequent ones as they represent respectively 0.73, 0.82 and 1.81 % of fragments respectively. The total percentage of fragments characterized by the LSPs of this subnetwork is 4.24 %. Sub-networks 5 and 6 are the longest (up to 20 residues) and the most complex super-structures. Sub-network 5 is composed of 16 LSPs encompassing % of fragments and presents two main pathways for entering extended structures through an α-turn including a β-turn. The first pathway starts with helical structures while the second one begins with extended structures. This sub-network can thus be defined as an α/β-hairpin. The structural classes composing this sub-network are highly populated, i.e., 10 characterize more than 1 % of fragments each. Sub-network 6 comprises 14 helical LSPs and connecting LSPs characterizing % of fragments. It presents three main pathways to enter a helical structure. The first pathway connects two helical structures with a loop and the two others are constituted of long series of connection structures. In general, the latter follow extended structures. Sub-network 6 can be defined as a α/β-loop-α super structure. Like sub-network 5, sub-network 6 encompasses very frequent LSPs, 6 of them represent more than 1 % of fragment each. Finally, Sub-network 7 comprising 9 LSPs (up to 16 successive residues), presents alternative pathways to enter a helical structure, either only through connecting LSPs or through both extended edges and connecting LSPs. Owing to the orthogonal orientation of the connection or extended edge structures with reference to the helix, this sub-network was identified as a βα-corner % of fragments are characterized by the LSPs of this sub-network. LSPs 64, 65, 66, 67 and 68 represent 0.86, 1.02, 1.19, 0.79 and 0.97 % of fragments respectively
18 Together, these 7 sub-networks characterize % of transitions observed in protein structures. According to their transition properties, the remaining LSPs were clustered in three categories referred to as groups 8, 9 and 10. Group 8 comprised 11 LSPs presented high inwards or outwards transition probabilities with more than one other LSP whatever its group. Group 9 was composed of 22 LSPs clustered in 9 small subnetworks (2 or 3 LSPs) with very high inner transition probabilities. Finally, the group 10 clustered 19 single LSPs associated to low transition probabilities with other LSPs, for two reasons: either they were quite rare and do not have strong transition preferences, or, they were very frequent and were a sort of hub toward many possibilities (see Methods section and supplementary data IV for details). SVMs using PSSMs achieve successful prediction of long local structures Global evaluation of predicted lists of local structure candidates It must be recalled that the prediction of a fragment sequence is considered as correct if the list of five candidates contains the true LSP (Q 120 ) or if the Cα RMSD between at least one LSP in the list and the true structural fragment is less than 2.5 Å (geometric criterion). This value has to be compared with the intrinsic variability of each LSP that ranges from 0.28 to 2.44 Å 25. Coupling SVM experts with the evolutionary information represented in the form of PSSMs makes the proportion of true-positive predicted LSP, Q 120, reach 38.8% (see Table I and supplementary data II). This result is quite significant given the large number of classes and the length of the predicted sequence fragments. It corresponds to a significant gain of 34.6 % over a random prediction and 18.3% for the naïve prediction, using a list of five candidates in both cases. Considering the geometric
19 criterion, the prediction rate increases to 63.1%. The gains compared to a random or a naïve prediction, are noteworthy, 38.0 % and 15.2% respectively. Table II (third column, first row) shows that for the fragments predicted as correct (i.e. 63.1% of samples), at least one candidate among the five proposed has an average RMSD of only 1.45 Å from the true local structure. For these sequence fragments, the mean approximation over the 5 candidates has an average value of 2.54 Å. By considering all samples, a satisfying 2.09 Å minimal approximation is still available in average among the 5 candidates and the mean approximation for all candidates is 3.03 Å. It may be noted that the prediction procedure is not biased towards the most frequent and the least heterogeneous classes. Indeed, the prediction of each of the 120 structural classes is largely better than random. The mean true positive rate per class reaches 33.7 %, which corresponds to an average gain of 30.4 % over random. Considering the geometric criterion, the SVM_PSSM achieves a 58.1 % mean prediction rate per class, i.e. an average gain of 39.2 % over the random prediction. These gains are well balanced over all structural classes. The weakest gain was observed for the LSP 113, which still scores 13.3 points over random. This class presents the largest structural variability, i.e. a mean 2.44 Å Cα RMSD between the representative LSP and the fragments of this cluster 25. Assessing prediction through a secondary structure vision While considering the four secondary-structure-like LSP categories as done previously 25, the Q 120 ranges from 28.4 % for Ext LSPs to 50.9 % for H LSPs corresponding to gains of 24.2 % and 46.5 % respectively over a random prediction and of 14 % and 23.5 % over a naïve prediction (see Table I). The prediction rates based on the geometrical criterion, ranges from 49.5 % to 84.6 % (see Table I). Well-balanced gains of 43, 39.3, 36.5 and 33.9 % were obtained
20 for H, E, C and Ext local structures, respectively, over random. When compared with the naïve prediction, the gains remain very high, i.e. 23.9, 16.2 and 23.2 for E, C and Ext structures respectively, with one exception associated to helical structures, where the gain is only 3.5 %. This less significant performance may be attributed to i) the high sequence specificities of helical structures that make easier the prediction even by a simple sequence similarity search and ii) the choice of the geometric threshold 2.5 Å, that is not stringent enough to accurately assess the prediction of helical structures. Considering a 1.5 Å threshold (see supplementary data II), our method still provides a 67.8 % prediction rate for Helical structures. In this case, a higher 6.5 points gain over a naïve prediction is observed. While examining the correct predictions defined by the geometric criterion for all predicted fragments, the best available approximations reach in average 0.83, 1.78, 1.75 and 1.93 Å for H, E, C and Ext fragments respectively, while the structural approximation had in average values of 1.21, 2.17, 2.48 and 2.41 Å respectively. These results are quite significant if one considers the structural variability existing inside the H, E, C and Ext LSP categories, i.e. respectively 1.29 Å (σ = 0.98), 2.14 Å (σ = 0.48), 3.34 Å (σ = 0.61) and by distinguishing extended structure entrances and exits, 2.87 (σ = 0.68) and 2.58 Å (σ= 0.53) 47. Assessing prediction with the view-point of super-secondary structures The four categories previously defined help for analysing the LSPs in comparison with well-known polypeptide descriptions. However, these categories are rather crude and fail to capture specific structural features particularly in coil category. To go further, we examined the prediction results obtained for the seven different frequent super-secondary structure types we described above, and, the three
21 remaining LSP groups characterizing their transition properties (see Result section: Analysis of preferential structural transitions between LSPs). With such a description, prediction rates based on geometric criterion range from 37% (sub-network 4/Irregular β-hairpin-turn) to 64 % (sub-network 1/α-C cap -βturn and 2/turn-ββ-corner) for the first seven categories (see Table III) and the rate even reaches 73 % for the three last groups. The gains are quite significant ranging from 25.5 % (sub-network 4/Irregular β-hairpin-turn) to 42.8 % (sub-network 5/α/βhairpin) compared to a random prediction, and from 8.8 % (group 9) to 29.1 % (subnetwork 2/turn-ββ-corner) when compared to a naïve prediction. Interestingly, the prediction rates are not related to the number of LSPs in sub-networks (data not shown). The accuracy of these predictions is well balanced over the different subnetworks and groups (see Table II). For instance, considering all predicted fragments and the first 7 categories, the average geometric accuracy over the 5 LSP candidates ranges from 3.07 Å to 3.63 Å. And the optimal structural approximation (minimal RMSD over the 5 candidates), ranges from average values of 2.17 to 2.80 Å. The groups 8 and 9 are associated with a better accuracy with a mean RMSD of 2.93 and 2.43 Å respectively. The average minimal RMSD drops in average from 1.94 to 1.56 Å. This result is related to the high helical content of these two groups. More details on predictions and different representative examples of structural candidates are given in Supplementary data V, VI, and VII. The results for three different proteins belonging to different SCOP classes 48 (α/β, all-α, all-β) are described. The prediction rate for these three cases ranges from 71.5 to 74.5%
22 Assessment of a confidence index All the results described above emphasize the importance of identifying the sequence regions with high predictive power. Thus an index aiming at estimating the quality of the prediction is strongly required. This question was previously addressed for accompanying different prediction methods: for instance PsiPred 49 or HYPROSP II 50 benefit from indices that estimate the probability to obtain the value by chance. Generally, they are related to the information content of the target object. We have previously proposed similar indexes, like Neq or confidence index, that effectively quantify the reliability of the prediction rate and permit us to focus on specific regions of the sequence 13,51,52. In the present study, we propose a Confidence Index CI based on the SVM CI decision values. This index gives an indication of the extent to which a predicted local structure corresponds to a correct prediction. The SVM CI decision values obtained on set 1 were divided into 30 equivalent parts. The first 8 and the last 5 categories representing only 1.15 and 0.95% of predictions respectively were gathered, yielding a final number of 19 categories of SVM CI decision values. The distribution of the prediction rates as a function of these 19 categories for sets 1 and 3 are given in Figure 4 A. The categories are ordered from low to high confidence. The curve representing the average prediction rates as a function of the categories of SVM CI decision values is clearly sigmoid. Whatever be the set considered, the average local structure prediction rate is high (61.3 % and 63.1 % respectively), and the distribution of rates as a function of SVM CI decision values is almost identical. SVM CI decision values inferior to (categories 1 to 5) are associated to poor quality predictions, with prediction rates ranging between 20 and
23 30 %. Inversely, SVM CI decision values greater than 1.10 (categories 15 to 19) are associated with high quality predictions, the rates ranging from 83.9 to 96.8 %. Between these two extremes, the prediction rate increases rapidly according to SVM CI decision values categories. Hence, the SVM CI decision values are related to the reliability of the prediction: the larger they are, the more reliable is the prediction. Consequently, SVM CI decision values can be defined as CI values. The clear relationship existing between CI categories and the prediction rates can be estimated quantitatively using a linear regression after logarithmic transformation of results from set 1. This relationship permits the definition of a theoretical prediction rate (TPR) as a function of the CI category (Equation 3) 4 1 TPR =.36( CI category 11.53) 5 1+ e 1 4 ( ) 0 + This relation can explain 96% of set 1 data (determination coefficient equal to 0.96) and residue distribution followed a normal law (Lilliefors test; R software 53 ). The model found to be correct for set 1, was assessed on the validation set 3. The mean theoretical prediction rate (TPR) calculated on all predictions of set 3 equals 61.80%, a value very close to the observed rate, i.e %. Figure 4 B shows the (3) correspondence between the estimated mean TPR for each protein of set 3 and their observed prediction rate. A significant linear correlation of 0.77 was observed (pvalue < ). We also observe a significant correlation (0.86) between the estimated mean TPR per structural class and the observed prediction rate. Therefore, the confidence index defined here, along with the relation described in equation (3), is proved to be very relevant in the estimation of the quality of a prediction
24 Discussion Our results show that the SVM_PSSM local structure prediction strategy can give results whose quality and accuracy are far better than a random prediction or a prediction based on sequence similarity searches. By reducing the structure space to 5 relevant candidates for 11-residue long local structures, our method is efficient in simplifying the combinatory problem associated with the generation of structural models for longer protein sequences. Prediction rates and approximation accuracy when compared to simple prediction schemas like random or naïve predictions are noteworthy given the large number of classes, the length of the predicted fragments and the diversity of the structural classes. Moreover, the confidence index is relevant in the identification of regions corresponding to the best predictions. In the following section, we will discuss and compare the relevance of our strategy to more sophisticated schemas of prediction and state-of-art methods. Comparing SVM experts with LR experts The LR method, previously developed in 25, was based on a logistic regression with the use of single sequence information and supervised with a system of experts. These experts estimated the probability for a given sequence fragment to belong to a given LSP. All the candidates with a probability larger than a given threshold were considered. Hence, for each sequence fragment a list of structural candidates belonging to different structural classes was proposed. This list could contain a variable number of candidates (from 1 to 5 and 4.2 on average among 120 classes). The prediction rate of the method based on single sequence information reached 51.2%. Compared to a random prediction, a significant gain of 29.3% was observed. Moreover, this method was also shown to be very competitive with cutting-edge local
25 structure prediction methods 25, i.e. with Yang & Wang prediction method 6 and with HMMSTR predictions based on the I-sites library 54. We also checked that the prediction was not biased towards a reduced set of structural classes, but well balanced between the whole set of LSPs, confirming the relevance of all structural classes and the sequence information they contained. In the present SVM_PSSM method, we have chosen to fix the number of candidates for each sequence (5 candidates in the list). Accordingly, for comparison purpose we re-assessed the original methodology defined by logistic regression (LR) with a fixed number of 5 candidates. As in our previous study 25, the approach, named LR_seq in the following discussion, was carried out using single sequence. We also evaluated the putative gain yielded by evolutionary information for each of the approaches, LR or SVM (LR_PSSM, SVM_seq respectively). For comparison purpose, all these strategies were developed using the non-redundant protein databank used in our previous study 25. In the same way, the datasets defined earlier were used. SVMs and LR show similar performances with single sequence When SVM approach was performed with single sequence information, the average Q 120 equalled 30.61% (see Table I and supplementary data II). This is almost equivalent to the value obtained with the LR_seq strategy. With the geometric criterion, the SVM_seq prediction rate reached 55.54%. This result was again comparable to the result obtained with LR_seq. These similarities were observed for the four secondary-structure-like categories of LSPs. Therefore, LR and SVM experts behave in a similar way and have similar ability to trap relevant structural information with single sequence encoding. This capability is quite interesting in case of orphan
26 protein sequences since in such cases, LR_seq remains an interesting method because of to its low computational cost. Improvement of prediction coupling SVMs with PSSMs The introduction of evolutionary information in the SVM strategy leads to a significant improvement of the prediction performance when compared to both approaches performed with single sequence information. This result is achieved as well by considering the true positive rate (Q 120 ) as the geometric criterion (+7.3 and 7.7% respectively). Detailed analyses show that the prediction is improved for all the local structures), two-thirds exhibit an improved Q 120 prediction rate. Half of them gain by least 10 % increase. Considering the geometrical criterion, the prediction rate for 88.33% of LSP classes was increased compared to LR_seq (see Figure 5). Only, 12 C and Ext classes show limited losses ranging from 1.6 to 6.8 points. These classes represent only 7.4 % of fragments. Interestingly, when the ten transition categories were considered, significant gains were also obtained (on average 7.6%). The largest value was observed for subinserm , version 1-21 Dec 2008 four categories of LSPs based on secondary structures. The gain ranges from 4.5% for the connecting structures to 16% for extended structures (see Table I and supplementary data II). Overall, the significant improvements in the mean true positive rate were observed for the majority of the structural classes, independently of their frequency, i.e. the Q 120 of 74.17% of structural classes was increased compared to the LR_seq strategy. Clearly, there is no correlation between the improvement in the prediction rate per class and the corresponding class frequencies (correlation coefficient r equals to 0.21). For instance, among the 35 weak populated classes (with less than 5% of the
27 network 2 (16%) (see Table III) while the smallest gains of 4.2 and 4.9 % were obtained for sub-networks 4 and 5 respectively. Finally and more importantly, the prediction of 85.33% of the proteins was improved. Superiority of SVM with PSSM For comparison purpose, we also considered the influence of evolutionary information (PSSM) with LR strategy (LR_pssm). In this case, a drastic loss of performance was observed. A first explanation comes from the size of the databank which, for certain classes, affected the correct estimation of the coefficients of the logistic functions. Nevertheless, the main explanation for the reduced performance lies on the expert behaviour. Indeed, a detailed analysis showed that the distribution of probabilities, brought by the experts, which measured the compatibility between a target sequence and a given LSP, were not uniformly spread but mainly confined towards extreme values, i.e. 0 and 1. Since the selection and the ranking of candidates depend on these values, the introduction of PSSM clearly decreased the discriminative power of experts because a very large set of examples is required to appropriately train the experts (see supplementary data II). Considering these results, the relevance of coupling SVM experts to PSSMs can be emphasized. Comparison to cutting-edge other local structure prediction methods Comparing local structure prediction methods is not trivial due to the large diversity of the existing strategies. Actually, different representations of the local structure space, different protocols of prediction and assessment have been defined
28 We compared our results with three categories of local structure analysis and associated prediction methods. Backbone torsion angle prediction Bystroff and co-workers defined a backbone torsion angle prediction method (HMMSTR) relying on an alphabet of 11 conformational states for protein backbone 54. These states characterized 11 torsion angle regions mapped onto the Φ-Ψ Ramachandran plot (see Figure 5 of Bystroff et al. 54 ). In the same way, Yang and Wang 6 and Kuang et al. 55 defined local structure prediction methods specialized in the prediction of the backbone conformation of the central amino-acid of nine-residue sequence fragments. Four states, A, B, G, E, were defined. For comparison purpose, they grouped the Bystroff s eleven main states into the four states they defined 55. Similarly, in our previous study 25, we extracted the φ,ψ angles defining each local structure candidate we proposed and allocated to the corresponding A,B,G or E states. We showed that LR_seq method with 4.2 candidates in average, evaluated in the context of backbone torsion angle prediction, yielded a prediction rate ranging from 64 to 76%. This result, obtained for a single sequence, was comparable to the 75% accuracy obtained by Yang and Wang and to the 77% obtained by Kuang et al. while their methods profited from the use of information from the results of PSI-PRED 55. This result was also comparable to the 74% prediction accuracy obtained for HMMSTR. Thus, insofar as our previous strategy, LR_seq, was as efficient as these cutting-edge local structure prediction methods, and as the present SVM_PSSM strategy gives a larger prediction accuracy compared to LR_seq (~12%), so, the methodology we present here, can be considered as a significant contribution to the field of local structure prediction
29 Prediction based on Structural Alphabet Recently, Sander et al. defined a new structural alphabet associated to an efficient prediction strategy 10. They defined 27 canonical local structures of 7-residue long by a discretization method taking into account both sequence and structural information. Several prediction strategies were tested; the most successful one used a combination of Random Forest (RF) classifiers with a representation of the sequence as profiles of amino-acid properties. Comparison with SVM_PSSM is arduous because of very different numbers of classes and lengths of local structures considered. Nevertheless, we tentatively tried to get closer to the Sander et al. prediction conditions and we mapped our 120 LSPs in the 27 classes they defined according to their structural proximities. Our prediction rate was then evaluated accordingly. Table IV reports the prediction rate Q 27 obtained by Sander and co-workers 10 for 7-residue long local structures. The Q 27 results ranged from 34 to 64% for 1 to 5 candidates (see 10, Figure 10). These results are comparable with the prediction rates that we obtained with our SVM_PSSM strategy, which range from 32 to 61 % for 1 to 5 candidates. These rates are all the more satisfying in the sense that we predict 11-residue long fragments, i.e. 4 residues longer than those predicted by Sander and co-workers. The performance of our prediction method can also be evaluated through Receiver Operating Characteristic (ROC) curves for each structural class. These curves represent the repartition of true positive rate versus false positive rate 56. They are class distribution-independent, and can be calculated for classifiers with continuous output. For each fragment, we thus computed the difference between the best SVM decision value and the decision value of the expert specialized for the class considered. The classification performance of each class was then represented by the
30 area under the ROC curve (AUC) that ranges between 0.5 (random prediction) and 1 (perfect prediction). The AUCs that we obtained range from 0.71 to 0.92, and the average value is 0.82 (see Figure 6). The minimal and maximal values correspond to respectively the classes 55 (connection structure) and 33 (extended edge structure). Thus, even while considering the AUC values, our prediction method performs as good as or slightly better than Sander et al. approach, for which the AUCs range from 0.68 to An interesting application of LSP prediction: the long loop prediction Loop prediction is a major step and a difficult task (even the most difficult one) confronted in the context of homology modelling methods. Loop prediction is frequently performed on a protein structural framework where the secondary structures are already delineated. Thus, per se, the approach benefits from the complete or partial knowledge, of the rest of the protein structure. Interesting protocols have recently been proposed that generally comprise two main strongly imbricated tasks, even concomitant: the sampling of the conformational space of the loop fragment and the scoring of the corresponding sampled conformations (see below). The sampling may be carried out using a set of structures extracted from a dedicated database or using ab initio methods. The latter seems to be more effective for long loops 57. Most recent approaches perform rather well and accurately for loops comprising less than 10 residues. Above this limit, sampling becomes the stumbling block of the procedure because it requires tremendous cpu-time to be efficient and to yield accurate results 58. Thus prediction of long loops remains a challenging field. Consequently, the question we address here concerns the efficiency of the LSP description coupled with the use of SVM_PSSM to provide rapid predictions of conformations for a loop region. Accordingly, we compare the accuracy obtained with
31 ab initio prediction methods dedicated to loop prediction to the accuracy that we observe for the connection structures (assigned to C LSPs) using our generic local structure prediction method. We focused on five loop prediction methods that were recently compared: LoopBuilder 59, the Modeller loop prediction method 60, LOOPY 57, RAPPER 61 and PLOP 58. The comparison we propose is rather difficult for two main reasons: the definition of the loops region and the evaluation of the prediction accuracy. Indeed the C LSPs connection structures can correspond to loops shorter than 11 residues or, inversely can also be part of longer loops. In addition, the assessment is done for all protein loops, i.e fragments while most loop prediction methods carefully focus on specific loop datasets. For instance, LoopBuider discards structures crystallized at a non standard ph and loops found to be involved in interaction with a ligand. The datasets may thus be very small (for example, LoopBuilder is assessed on 54 loops which are 11 residues long). So, our results may be affected by artefacts due to ligands or experimental conditions. Briefly, we recall the main and the common features of the different approaches tested. All of them are all-atom prediction methods and rely on a two-step algorithm: first the sterically allowed backbone conformations are sampled and then they are scored and ranked based on the most favourable energy. Importantly, the selection is done after taking into account the conformation and the side chain coordinates of the rest of the protein. The Modeller loop prediction method samples all-atom loops in a Cartesian space and optimizes the energy function by coupling conjugate gradients and molecular dynamics with simulated annealing. Before selecting the conformation associated with the lowest energy value, 50 to 500 independent optimizations are done 60. LOOPY relies on a colony energy filter that favours conformations having many
32 neighbours in configurational space. For a single loop prediction, 2000 random backbone conformations are generated and then filtered 57. In the same way, for a target, RAPPER generates 1000 backbone conformations using fine-grained Φ/Ψ tables. The best candidate is then selected by coupling the AMBER force field and the Generalized Born/Surface Area (GBSA) solvatation model 61. PLOP performs a very extensive multistage Φ/Ψ conformational sampling and scores the generated loop conformations using an OPLS all-atom force field combined with a generalized Born solvation and a new hydrophobic terms 58. Lastly, LoopBuilder relies on LOOPY for sampling and select best conformations using the DFIRE potential before minimizing 62. Our purpose is not to compete with these elaborated approaches that make use of force fields, minimization techniques and energy functions. They were assessed mostly on small and carefully selected samples while in our case, the assessment was done on a large and diversified set of examples, so with a wider variability. Nevertheless, our point is to show that our approach can provide interesting structural start points for a deeper analysis or a more elaborated algorithm. For assessing the accuracy, we choose to compute the local Cα RMSD between the predicted and the real local structure. Classically, the criteria used in loop prediction methods is a global RMSD on the loop main-chain heavy atoms after superposition of the main-chain atoms in the stem residues on each side of the loop 60. Fiser and al. gave an idea of the relation between the two measures, i.e. the global RMSD is about 1.5 times the local RMSD for the heavy main-chain atoms for a 8- residue loop, and, the local Cα RMSD is about the same as the local RMSD computed for all the heavy main-chain atoms 60. For a comparison purpose and to give an idea of the scale, we will use this factor in the following discussion
33 For 11-residue loops, after sampling and selection of the best structural candidate, the method implemented in Modeller achieves an average global RMSD value of 5.5 Å, LOOPY 3.52 Å, RAPPER 4.94 Å, PLOP 1.00 Å and LoopBuilder 2.50 Å. Over the 5 candidates per target fragment that are predicted by our method, we obtained an average local Cα RMSD of 3.41 Å (see Table III, row untitled C secondary structure categories ), which corresponds to a global RMSD near 5.12 Å if a scaling factor of 1.5 factor is considered. Among these 5 candidates, the best one succeeded to have an average Cα RMSD prediction accuracy of 2.48 Å that can be associated to a 3.72 Å global RMSD accuracy using a factor of 1.5. Moreover, if we now consider fragments correctly predicted according to our geometrical criteria (49.5% of fragments), the mean local RMSD accuracy over the 5 candidates was 2.93 Å (4.40 Å with a 1.5 factor) and with the best candidates an average accuracy of 1.75 Å was obtained (2.63 Å with a 1.5 factor). This last result is all the more interesting that the confidence index we have developed helps to give a direct assessment of prediction and thus indicates fragments that are well predicted. These results are comparable with Modeller, LOOPY and RAPPER accuracies. LoopBuilder and PLOP perform better. Nevertheless, the computational time for these prediction methods is very high. The average CPU time for one 11- residue loop target is about 12 days for PLOP on a single processor 58. LoopBuilder, for which computational efficiency was a challenge, still perform in few hours 59. Thus, our results are all the more interesting considering the fact that the prediction is done instantaneously for a target sequence. In addition, it has to be noted that we do not introduce any constraint on the extremities of the loop regions or add any information on the rest of the protein and side-chain position. Moreover, there is no any energetic criterion that filters the results. So, our prediction method is so
34 competitive with some of the cutting-edge loop prediction methods. More importantly, it would be a noteworthy help for proposing few relevant and accurate candidates that could enrich this field of research by providing filter or by directing the sampling of the most performing strategies. Demanding parameterization of SVM experts A parameterisation of SVM experts is required before construction of models. We checked the influence of two pairs of parameters and selected the one that provided the largest prediction rates. We took care to avoid biased prediction that favour of the most populated classes. The results obtained with the pair of parameters (γ,c) that showed a lower performance, are discussed in supplementary data I. In addition, the choice of the kernel is a matter of discussion. Hsu et al. suggested that RBF kernel was a reasonable choice compared to other kernels because (i) linear kernel is a special case of RBF, (ii) sigmoid kernel behaves like RBF for certain parameters and is not valid under some others, and (iii) polynomial kernel requires the optimization of more parameters and could have more numerical difficulties 44. Further improvement could also be achieved by considering the fact that sequences and profiles are structured data, i.e. information organisation and order do matter. Few kernels specially designed for profiles were already defined 45, 63, 64 and could be used for defining various relevant feature spaces. Different nature of structural prediction using LR_seq or SVM_PSSM The comparison between the two strategies was not limited to the prediction rate. We also examined the overlap between lists of candidates yielded by each approach. Considering LR_seq and SVM_seq lists with very similar success rate,
35 78.4% of correct candidates were found in common. This large but incomplete covering rate is probably due to the difference in the mapping of input data by LR and SVM classifiers. The difference in lists covering increases when PSSMs are included in the SVM strategy. Indeed, only 51.2% and 50.4% of the correct structural candidates were found in common between the SVM_PSSM lists and the LR_seq and SVM_seq lists. Thus, since correct predictions found by LR_seq were not found by SVM_PSSM and reciprocally, further improvement is still possible. Conclusions In this work, we have focused on the assessment of a new method we developed for predicting long local protein structures. We coupled efficient support vector machines classifiers with an enriched representation of the target segment sequences by using evolutionary profiles obtained from PSI-BLAST. Five structural candidates are predicted per sequence window. This combination yields a prediction rate of 63.1% for 120 classes of 11-residue local structures considering a geometrical approximation better than 2.5 Å as a correct prediction. This result corresponds to a very significant gain over other approaches aiming at predicting long structural prototypes. It is worth noting that this improvement encompassed all LSPs categories. Indeed, the average prediction rate of 88.3 % of structural classes is improved when compared to a previous strategy proposing lists of five structural candidates. We also focus on the overlapping properties of LSPs and propose transition sub-networks and groups characterizing their implication in frequent super-structures and their properties in a global structural network. This original description is an interesting way of assessing prediction for fragment structures longer than
36 residues. For instance, a significant 60.9 % prediction rate is obtained for the subnetwork 5 which can characterize sequences up to 20 residues in length. Moreover, we address the question of the structural predictability of a sequence by defining a confidence index for prediction. This index reflects the informativity, i.e. the information content, of a target sequence according to the experts ability to give a correct prediction. It is shown to be a valuable tool for estimating a theoretical correct prediction rate along a target protein sequence. Confidence indices can be useful tools to guide the generation of homology or de novo protein models involving local structure predictions. A hierarchical procedure for modelling a protein structure could be envisaged where first, the regions considered as accurately predicted would be selected and fixed and then regions with lower informativity would be examined more extensively, by considering for instance a larger number of candidates. As a whole, this procedure would significantly reduce the global conformational space sampling for the entire protein sequence. These promising results suggest that our approach will prove effective in real biological and biochemical applications. Indeed, applications for our local structure prediction strategy are numerous and diverse. It can be included in de novo or homology modelling of global protein structures and for the prediction of loops. Concerning the representation of the sequence, according to Pei & Grishin 9, combining evolutionary information with structural preference in amino acids should be a very promising way to improve local structure prediction methods. In our method this combination is implicitly done. An important point of our strategy is that PSSMs were derived from the complete target sequence. This choice made it possible to take into account the whole structural and physico-chemical environment of sequence fragments, and to learn amino acids preferences in sequence families. It
37 would be interesting to compare them with PSSMs calculated only on single fragments and to quantify the extent to which such fragment PSSMs capture long range interactions and properties. The quality of PSSM would also be an important point to study further. Actually, a benchmarking of the procedure for taking into account potential misalignments could lead to better prediction performances. As suggested by Altschul and co-workers, one way to refine alignments of PSI-BLAST would be to construct a multiple alignment of the sequences found and to calculate a new PSSM. This matrix can then be used in steps for rescoring and realigning database sequences 38. Another important point is the handling of sequences with very few homologues for which the use of PSSM could be inappropriate (see supplementary data VIII). An analysis of raw PSI-BLAST alignments could help in identifying these cases and elaborating an adapted strategy for prediction. Our future work will focus on global 3D structure prediction. Our approach will rely on one hand, on local structures prediction from sequence and on the other hand, on a fragment assembly strategy taking into account predicted global constraints. In this context, the use of the frequent sub-networks defined here will be particularly useful and the intrinsic flexibility of the structures will be taken into account. Beside its utility for better understanding the Hybrid Protein Model and for assessing prediction quality as done in this study, this new description will be particularly fruitful toward the proposition of 3D protein models. As a matter of fact, taking account of LSP transition probabilities should not only help to appropriately filter the results of the prediction by preventing the choice of incompatible LSPs in two successive sites, but also allow predictions for longer local structures
38 Acknowledgements This work was supported by French Institute for Health and Medical Care (INSERM) and University of Paris Diderot - Paris 7. AB benefits from a grant of the Ministère de la Recherche. The authors thank Agnel Praveen Joseph for fruitful discussions
39 References 1. Blundell TL, Sibanda BL, Montalvao RW, Brewerton S, Chelliah V, Worth CL, Harmer NJ, Davies O, Burke D. Structural biology and bioinformatics in drug design: opportunities and challenges for target identification and lead discovery. Philos Trans R Soc Lond B Biol Sci 2006;361(1467): Noble ME, Endicott JA, Johnson LN. Protein kinase inhibitors: insights into drug design from structure. Science 2004;303(5665): Doppelt O, Moriaud F, Bornot A, De Brevern AG. Functional annotation strategy for protein structures. Bioinformation 2007;1(9): Fitzkee NC, Fleming PJ, Gong H, Panasik N, Jr., Street TO, Rose GD. Are proteins made from a limited parts list? Trends Biochem Sci 2005;30(2): Zhang Y, Hubner IA, Arakaki AK, Shakhnovich E, Skolnick J. On the origin and highly likely completeness of single-domain protein structures. Proc Natl Acad Sci U S A 2006;103(8): Yang AS, Wang LY. Local structure prediction with local structure-based sequence profiles. Bioinformatics 2003;19(10): Bowie JU, Luthy R, Eisenberg D. A method to identify protein sequences that fold into a known three-dimensional structure. Science 1991;253(5016): Rooman MJ, Rodriguez J, Wodak SJ. Relations between protein sequence and structure and their significance. J Mol Biol 1990;213(2): Pei J, Grishin NV. Combining evolutionary and structural information for local protein structure prediction. Proteins 2004;56(4):
40 10. Sander O, Sommer I, Lengauer T. Local protein structure prediction using discriminative models. BMC Bioinformatics 2006;7: Jauch R, Yeo HC, Kolatkar PR, Clarke ND. Assessment of CASP7 structure predictions for template free targets. Proteins 2007;69 Suppl 8: Offmann B, Tyagi M, de Brevern AG. Local Protein Structures. Current Bioinformatics 2007;2: Etchebest C, Benros C, Hazout S, de Brevern AG. A structural alphabet for local protein structures: improved prediction methods. Proteins 2005;59(4): de Brevern AG, Etchebest C, Hazout S. Bayesian probabilistic approach for predicting backbone structures in terms of protein blocks. Proteins 2000;41(3): de Brevern AG. New assessment of a structural alphabet. In Silico Biol 2005;5(3): Karchin R, Cline M, Mandel-Gutfreund Y, Karplus K. Hidden Markov models that use predicted local structure for fold recognition: alphabets of backbone geometry. Proteins 2003;51(4): Fourrier L, Benros C, de Brevern AG. Use of a structural alphabet for analysis of short loops connecting repetitive structures. BMC Bioinformatics 2004;5: Tyagi M, Gowri VS, Srinivasan N, de Brevern AG, Offmann B. A substitution matrix for structural alphabet based on structural alignment of homologous proteins and its applications. Proteins 2006;65(1): Tyagi M, Sharma P, Swamy CS, Cadet F, Srinivasan N, de Brevern AG, Offmann B. Protein Block Expert (PBE): a web-based protein structure
41 analysis server using a structural alphabet. Nucleic Acids Res 2006;34(Web Server issue):w Tyagi M, de Brevern AG, Srinivasan N, Offmann B. Protein structure mining using a structural alphabet. Proteins de Brevern AG, Wong H, Tournamille C, Colin Y, Le Van Kim C, Etchebest C. A structural model of a seven-transmembrane helix receptor: the Duffy antigen/receptor for chemokine (DARC). Biochim Biophys Acta 2005;1724(3): Etchebest C, Benros C, Bornot A, Camproux AC, de Brevern AG. A reduced amino acid alphabet for understanding and designing protein adaptation to mutation. Eur Biophys J 2007;36(8): Dong QW, Wang XL, Lin L. Methods for optimizing the structure alphabet sequences of proteins. Comput Biol Med 2007;37(11): Dudev M, Lim C. Discovering structural motifs using a structural alphabet: application to magnesium-binding sites. BMC Bioinformatics 2007;8: Benros C, de Brevern AG, Etchebest C, Hazout S. Assessing a novel approach for predicting local 3D protein structures from sequence. Proteins 2006;62(4): de Brevern AG, Hazout S. Compacting local protein fold with a 'hybrid protein model'. Theorical Chemistry Accounts 2001;106(1/2): de Brevern AG, Hazout S. 'Hybrid protein model' for optimally defining 3D protein structure fragments. Bioinformatics 2003;19(3): Kohonen T. Self-organizing formation of topologically correct feature maps. Biol Cybernet 1982;43: Kohonen T. Self-Organizing Maps. Berlin, Germany;
42 30. Bystroff C, Baker D. Prediction of local structure in proteins using a library of sequence-structure motifs. J Mol Biol 1998;281(3): Baeten L, Reumers J, Tur V, Stricher F, Lenaerts T, Serrano L, Rousseau F, Schymkowitz J. Reconstruction of protein backbones from the BriX collection of canonical protein fragments. PLoS Comput Biol 2008;4(5):e Sawada Y, Honda S. ProSeg: a database of local structures of protein segments. J Comput Aided Mol Des Song J, Burrage K, Yuan Z, Huber T. Prediction of cis/trans isomerization in proteins using PSI-BLAST profiles and secondary structure information. BMC Bioinformatics 2006;7: Ward JJ, McGuffin LJ, Buxton BF, Jones DT. Secondary structure prediction with support vector machines. Bioinformatics 2003;19(13): Eddy SR. Where did the BLOSUM62 alignment score matrix come from? Nat Biotechnol 2004;22(8): de Brevern AG, Valadie H, Hazout S, Etchebest C. Extension of a local backbone description using a structural alphabet: a new approach to the sequence-structure relationship. Protein Sci 2002;11(12): Noguchi T, Matsuda H, Akiyama Y. PDB-REPRDB: a database of representative protein chains from the Protein Data Bank (PDB). Nucleic Acids Res 2001;29(1): Altschul SF, Madden TL, Schaffer AA, Zhang J, Zhang Z, Miller W, Lipman DJ. Gapped BLAST and PSI-BLAST: a new generation of protein database search programs. Nucleic Acids Res 1997;25(17): Boeckmann B, Bairoch A, Apweiler R, Blatter MC, Estreicher A, Gasteiger E, Martin MJ, Michoud K, O'Donovan C, Phan I, Pilbout S, Schneider M. The
43 SWISS-PROT protein knowledgebase and its supplement TrEMBL in Nucleic Acids Res 2003;31(1): Chang C-C, Lin C-J. LIBSVM: a library for support vector machines. Software available at Hastie T, Tibshirani R, Friedman J. The Elements of statistical learning Data mining, Inference, and Prediction: Springer Series in Statistic; Joachims T. Making large-scale SVM Learning Practical. In: Schölkopf B, Burges C, Smola A, editors. Advances in Kernel Methods - Support Vector Learning: MIT-Press; Lewis DP, Jebara T, Noble WS. Support vector machine learning from heterogeneous data: an empirical analysis using protein sequence and structure. Bioinformatics 2006;22(22): Hsu CW, Chang CC, Lin CJ. A practical guide to support vector classification. Tech Rep, Department of computer science and information engineering, National Taiwan University, Tapei, Taiwan [Available at Kuang R, Ie E, Wang K, Wang K, Siddiqi M, Freund Y, Leslie C. Profilebased string kernels for remote homology detection and motif extraction. Proc IEEE Comput Syst Bioinform Conf 2004: Rohl CA, Strauss CE, Misura KM, Baker D. Protein structure prediction using Rosetta. Methods Enzymol 2004;383: Benros C. Analyse et prediction des structures tridimensionnelles locales des proteines [Analyse de Genomes et Modelisation Moleculaire]. Paris, France: University Paris 7 - Denis Diderot; p
44 48. Murzin AG, Brenner SE, Hubbard T, Chothia C. SCOP: a structural classification of proteins database for the investigation of sequences and structures. J Mol Biol 1995;247(4): Jones DT. Protein secondary structure prediction based on position-specific scoring matrices. J Mol Biol 1999;292(2): Lin HN, Chang JM, Wu KP, Sung TY, Hsu WL. HYPROSP II--a knowledgebased hybrid method for protein secondary structure prediction based on local prediction confidence. Bioinformatics 2005;21(15): Hazout S. Entropy-derived measures for assessing the accuracy of N-state prediction algorithms. In: de Brevern AG, editor. In Recent Advances in Structural Bioinformatics. Trivandrum, India: Research signpost; p pp de Brevern AG, Etchebest C, Benros C, Hazout S. "Pinning strategy": a novel approach for predicting the backbone structure in terms of protein blocks from sequence. J Biosci 2007;32(1): Ihaka R, Gentleman R. R: a language for data analysis and graphics. J Comp Graph Stat 1996;5: Bystroff C, Thorsson V, Baker D. HMMSTR: a hidden Markov model for local sequence-structure correlations in proteins. J Mol Biol 2000;301(1): Kuang R, Leslie CS, Yang AS. Protein backbone angle prediction with machine learning approaches. Bioinformatics 2004;20(10): Fawcett T. ROC Graphs: Notes and Practical Considerations for Data Mining Researchers. Intelligent Enterprise Technologies Laboratory
45 57. Xiang Z, Soto CS, Honig B. Evaluating conformational free energies: the colony energy and its application to the problem of loop prediction. Proc Natl Acad Sci U S A 2002;99(11): Zhu K, Pincus DL, Zhao S, Friesner RA. Long loop prediction using the protein local optimization program. Proteins 2006;65(2): Soto CS, Fasnacht M, Zhu J, Forrest L, Honig B. Loop modeling: Sampling, filtering, and scoring. Proteins 2008;70(3): Fiser A, Do RK, Sali A. Modeling of loops in protein structures. Protein Sci 2000;9(9): de Bakker PI, DePristo MA, Burke DF, Blundell TL. Ab initio construction of polypeptide fragments: Accuracy of loop decoy discrimination by an all-atom statistical potential and the AMBER force field with the Generalized Born solvation model. Proteins 2003;51(1): Zhou H, Zhou Y. Distance-scaled, finite ideal-gas reference state improves structure-derived potentials of mean force for structure selection and stability prediction. Protein Sci 2002;11(11): Rangwala H, Karypis G. Profile-based direct kernels for remote homology detection and fold recognition. Bioinformatics 2005;21(23): Mittelman D, Sadreyev R, Grishin N. Probabilistic scoring measures for profile-profile comparison yield more accurate short seed alignments. Bioinformatics 2003;19(12):
46 Figures Figure 1 - Datasets organisation and usage Set 1 was used for learning the relation between confidence index categories and prediction rate. Set 2 was used as a training set for prediction and for the development of the confidence index. Set 3 for prediction and confidence index assessment

 of transitions from a given LSPs to one, two or three others. It takes into account the 51% of the most frequent transitions observed.")


47 Figure 2 - Global preferential structural transition network between prototypes. For a better representation, only transitions with a probability greater than 0.15 are shown. These represented transitions, does not represent the whole complexity of the protein structure space but it shows in average % (σ ± 22.22) of transitions from a given LSPs to one, two or three others. It takes into account the 51% of the most frequent transitions observed. Actually, each LSP has at least a 0.15 probability to succeed or precede another given LSP. The only exception is the LSP 108. Transitions with a probability between 0.15 and 0.20 are shown in thin black arrows. Blue, green and yellow arrows show respectively 0.20 to 0.30, 0.30 to 0.50 and 0.50 to 0.70 probability transitions. Red arrows show transitions with probability more than Circular nodes with black and green border correspond to helical and connecting LSPs respectively. Rectangular nodes with red and blue border correspond to extended and extended edge LSPs respectively. Seven preferential transition subnetwork of LSPs have been defined (see Figure 3). Each node is filled with a color indicating its transition category
48 Figure 3-7 LSP sub-networks represent significant transition probabilities. These sub-networks made it possible to assess of the prediction of LSPs involved in frequent super-local protein structures. Examples of these local structures in proteins are given next to the corresponding sub-network. Their position in proteins, their assigned prototypes chain and length are indicated. Only transitions greater than 0.2 are represented. Blue, green, yellow and Red arrows show 0.2 to 0.3, 0.3 to 0.5, 0.5 to 0.7 and more than 0.7 probability transitions respectively. Circular nodes with black and green border correspond to Helical and Connecting LSPs respectively. Rectangular nodes with red and blue border correspond to Extended and Extended edge LSPs respectively
49 Figure 4 - Definition and assessment of a confidence index (CI). A: representation of the prediction rate associated with each category of CI on set 1 and on set 3. A model of the relation between categories and prediction rate was fitted on set 1 and is shown by a dashed line. The histogram represents the number of correct (dark stripes) and of incorrect (light stripes) predictions for each CI category on set 3. CI Categories numbered from 1 to 19 correspond to the following intervals of SVM outputs: ]-, -1.32], ]-1.32, -1.14], ]-1.14, -0.95], ]-0.95, -0.77], ]-0.77, ], ]-0.58, -0.39], ]-0.39, -0.21], ]-0.21, -0.02], ]-0.02, 0.17], ]0.17, 0.36], ]0.36, 0.54], ]0.54, 0.73], ]0.73, 0.92], ]0.92, 1.10], ]1.10, 1.29], ]1.29, 1.48], ]1.48, 1.67], ]1.67, 1.85], ]1.85, + ]. B: representation of the prediction rate per protein observed on set 3 according to the mean theoretical prediction rate (TPR) estimated per protein based on to CI values categories. The model corresponding to the linear relation between these 2 variables is shown by a solid line
50 Figure 5 - Global improvement of the local structure prediction per structural classes using the SVM_PSSM strategy. Comparison of the 120 prediction rates obtained using the LR_seq and the SVM_PSSM strategies


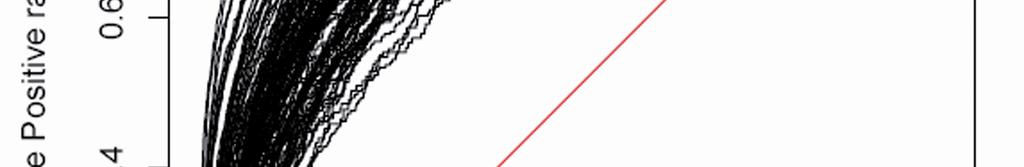
51 Figure 6 ROC curves for the 120 structural classes
52 Tables Table I - Local structure prediction results Table II Structural accuracy of the Local structure prediction

53 Table III Local structure prediction per transition category. Table IV Comparison with Sander & al. 10 local structure prediction
A Structural Alphabet for Local Protein Structures: Improved Prediction Methods
 PROTEINS: Structure, Function, and Bioinformatics 59:810 827 (2005) A Structural Alphabet for Local Protein Structures: Improved Prediction Methods Catherine Etchebest, Cristina Benros, Serge Hazout, and
Introduction to Comparative Protein Modeling. Chapter 4 Part I
 Introduction to Comparative Protein Modeling Chapter 4 Part I 1 Information on Proteins Each modeling study depends on the quality of the known experimental data. Basis of the model Search in the literature
CMPS 3110: Bioinformatics. Tertiary Structure Prediction
 CMPS 3110: Bioinformatics Tertiary Structure Prediction Tertiary Structure Prediction Why Should Tertiary Structure Prediction Be Possible? Molecules obey the laws of physics! Conformation space is finite
CMPS 6630: Introduction to Computational Biology and Bioinformatics. Tertiary Structure Prediction
 CMPS 6630: Introduction to Computational Biology and Bioinformatics Tertiary Structure Prediction Tertiary Structure Prediction Why Should Tertiary Structure Prediction Be Possible? Molecules obey the
Neural Networks for Protein Structure Prediction Brown, JMB CS 466 Saurabh Sinha
 Neural Networks for Protein Structure Prediction Brown, JMB 1999 CS 466 Saurabh Sinha Outline Goal is to predict secondary structure of a protein from its sequence Artificial Neural Network used for this
Protein Structure Prediction using String Kernels. Technical Report
 Protein Structure Prediction using String Kernels Technical Report Department of Computer Science and Engineering University of Minnesota 4-192 EECS Building 200 Union Street SE Minneapolis, MN 55455-0159
Physiochemical Properties of Residues
 Physiochemical Properties of Residues Various Sources C N Cα R Slide 1 Conformational Propensities Conformational Propensity is the frequency in which a residue adopts a given conformation (in a polypeptide)
Basics of protein structure
 Today: 1. Projects a. Requirements: i. Critical review of one paper ii. At least one computational result b. Noon, Dec. 3 rd written report and oral presentation are due; submit via email to bphys101@fas.harvard.edu
Supplemental Materials for. Structural Diversity of Protein Segments Follows a Power-law Distribution
 Supplemental Materials for Structural Diversity of Protein Segments Follows a Power-law Distribution Yoshito SAWADA and Shinya HONDA* National Institute of Advanced Industrial Science and Technology (AIST),
Homology Modeling. Roberto Lins EPFL - summer semester 2005
 Homology Modeling Roberto Lins EPFL - summer semester 2005 Disclaimer: course material is mainly taken from: P.E. Bourne & H Weissig, Structural Bioinformatics; C.A. Orengo, D.T. Jones & J.M. Thornton,
Building 3D models of proteins
 Building 3D models of proteins Why make a structural model for your protein? The structure can provide clues to the function through structural similarity with other proteins With a structure it is easier
Protein Structure Prediction, Engineering & Design CHEM 430
 Protein Structure Prediction, Engineering & Design CHEM 430 Eero Saarinen The free energy surface of a protein Protein Structure Prediction & Design Full Protein Structure from Sequence - High Alignment
Presentation Outline. Prediction of Protein Secondary Structure using Neural Networks at Better than 70% Accuracy
 Prediction of Protein Secondary Structure using Neural Networks at Better than 70% Accuracy Burkhard Rost and Chris Sander By Kalyan C. Gopavarapu 1 Presentation Outline Major Terminology Problem Method
Design of a Novel Globular Protein Fold with Atomic-Level Accuracy
 Design of a Novel Globular Protein Fold with Atomic-Level Accuracy Brian Kuhlman, Gautam Dantas, Gregory C. Ireton, Gabriele Varani, Barry L. Stoddard, David Baker Presented by Kate Stafford 4 May 05 Protein
Protein Structure Prediction II Lecturer: Serafim Batzoglou Scribe: Samy Hamdouche
 Protein Structure Prediction II Lecturer: Serafim Batzoglou Scribe: Samy Hamdouche The molecular structure of a protein can be broken down hierarchically. The primary structure of a protein is simply its
Protein structure prediction. CS/CME/BioE/Biophys/BMI 279 Oct. 10 and 12, 2017 Ron Dror
 Protein structure prediction CS/CME/BioE/Biophys/BMI 279 Oct. 10 and 12, 2017 Ron Dror 1 Outline Why predict protein structure? Can we use (pure) physics-based methods? Knowledge-based methods Two major
Radial Basis Function Neural Networks in Protein Sequence Classification ABSTRACT
 (): 195-04 (008) Radial Basis Function Neural Networks in Protein Sequence Classification Zarita Zainuddin and Maragatham Kumar School of Mathematical Sciences, University Science Malaysia, 11800 USM Pulau
Contact map guided ab initio structure prediction
 Contact map guided ab initio structure prediction S M Golam Mortuza Postdoctoral Research Fellow I-TASSER Workshop 2017 North Carolina A&T State University, Greensboro, NC Outline Ab initio structure prediction:
Giri Narasimhan. CAP 5510: Introduction to Bioinformatics. ECS 254; Phone: x3748
 CAP 5510: Introduction to Bioinformatics Giri Narasimhan ECS 254; Phone: x3748 giri@cis.fiu.edu www.cis.fiu.edu/~giri/teach/bioinfs07.html 2/15/07 CAP5510 1 EM Algorithm Goal: Find θ, Z that maximize Pr
Protein tertiary structure prediction with new machine learning approaches
 Protein tertiary structure prediction with new machine learning approaches Rui Kuang Department of Computer Science Columbia University Supervisor: Jason Weston(NEC) and Christina Leslie(Columbia) NEC
Procheck output. Bond angles (Procheck) Structure verification and validation Bond lengths (Procheck) Introduction to Bioinformatics.
 Structure verification and validation Bond lengths (Procheck) Introduction to Bioinformatics.") Structure verification and validation Bond lengths (Procheck) Introduction to Bioinformatics Iosif Vaisman Email: ivaisman@gmu.edu ----------------------------------------------------------------- Bond
Structure verification and validation Bond lengths (Procheck) Introduction to Bioinformatics Iosif Vaisman Email: ivaisman@gmu.edu ----------------------------------------------------------------- Bond
Protein Structure Prediction
 Page 1 Protein Structure Prediction Russ B. Altman BMI 214 CS 274 Protein Folding is different from structure prediction --Folding is concerned with the process of taking the 3D shape, usually based on
Improving De novo Protein Structure Prediction using Contact Maps Information
 CIBCB 2017 IEEE Conference on Computational Intelligence in Bioinformatics and Computational Biology Improving De novo Protein Structure Prediction using Contact Maps Information Karina Baptista dos Santos
Statistical Machine Learning Methods for Bioinformatics IV. Neural Network & Deep Learning Applications in Bioinformatics
 Statistical Machine Learning Methods for Bioinformatics IV. Neural Network & Deep Learning Applications in Bioinformatics Jianlin Cheng, PhD Department of Computer Science University of Missouri, Columbia
CMPS 6630: Introduction to Computational Biology and Bioinformatics. Structure Comparison
 CMPS 6630: Introduction to Computational Biology and Bioinformatics Structure Comparison Protein Structure Comparison Motivation Understand sequence and structure variability Understand Domain architecture
CAP 5510 Lecture 3 Protein Structures
 CAP 5510 Lecture 3 Protein Structures Su-Shing Chen Bioinformatics CISE 8/19/2005 Su-Shing Chen, CISE 1 Protein Conformation 8/19/2005 Su-Shing Chen, CISE 2 Protein Conformational Structures Hydrophobicity
114 Grundlagen der Bioinformatik, SS 09, D. Huson, July 6, 2009
 114 Grundlagen der Bioinformatik, SS 09, D. Huson, July 6, 2009 9 Protein tertiary structure Sources for this chapter, which are all recommended reading: D.W. Mount. Bioinformatics: Sequences and Genome
Identification of Representative Protein Sequence and Secondary Structure Prediction Using SVM Approach
 Identification of Representative Protein Sequence and Secondary Structure Prediction Using SVM Approach Prof. Dr. M. A. Mottalib, Md. Rahat Hossain Department of Computer Science and Information Technology
2MHR. Protein structure classification is important because it organizes the protein structure universe that is independent of sequence similarity.
 Protein structure classification is important because it organizes the protein structure universe that is independent of sequence similarity. A global picture of the protein universe will help us to understand
Motif Prediction in Amino Acid Interaction Networks
 Motif Prediction in Amino Acid Interaction Networks Omar GACI and Stefan BALEV Abstract In this paper we represent a protein as a graph where the vertices are amino acids and the edges are interactions
Supporting Online Material for
 www.sciencemag.org/cgi/content/full/309/5742/1868/dc1 Supporting Online Material for Toward High-Resolution de Novo Structure Prediction for Small Proteins Philip Bradley, Kira M. S. Misura, David Baker*
Model Accuracy Measures
 Model Accuracy Measures Master in Bioinformatics UPF 2017-2018 Eduardo Eyras Computational Genomics Pompeu Fabra University - ICREA Barcelona, Spain Variables What we can measure (attributes) Hypotheses
Week 10: Homology Modelling (II) - HHpred
 - HHpred") Week 10: Homology Modelling (II) - HHpred Course: Tools for Structural Biology Fabian Glaser BKU - Technion 1 2 Identify and align related structures by sequence methods is not an easy task All comparative
Week 10: Homology Modelling (II) - HHpred Course: Tools for Structural Biology Fabian Glaser BKU - Technion 1 2 Identify and align related structures by sequence methods is not an easy task All comparative
Prediction and Classif ication of Human G-protein Coupled Receptors Based on Support Vector Machines
 Article Prediction and Classif ication of Human G-protein Coupled Receptors Based on Support Vector Machines Yun-Fei Wang, Huan Chen, and Yan-Hong Zhou* Hubei Bioinformatics and Molecular Imaging Key Laboratory,
Protein Secondary Structure Prediction
 Protein Secondary Structure Prediction Doug Brutlag & Scott C. Schmidler Overview Goals and problem definition Existing approaches Classic methods Recent successful approaches Evaluating prediction algorithms
SUPPLEMENTARY MATERIALS
 SUPPLEMENTARY MATERIALS Enhanced Recognition of Transmembrane Protein Domains with Prediction-based Structural Profiles Baoqiang Cao, Aleksey Porollo, Rafal Adamczak, Mark Jarrell and Jaroslaw Meller Contact:
A short introduction to supervised learning, with applications to cancer pathway analysis Dr. Christina Leslie
 A short introduction to supervised learning, with applications to cancer pathway analysis Dr. Christina Leslie Computational Biology Program Memorial Sloan-Kettering Cancer Center http://cbio.mskcc.org/leslielab
Analysis of N-terminal Acetylation data with Kernel-Based Clustering
 Analysis of N-terminal Acetylation data with Kernel-Based Clustering Ying Liu Department of Computational Biology, School of Medicine University of Pittsburgh yil43@pitt.edu 1 Introduction N-terminal acetylation
An Artificial Neural Network Classifier for the Prediction of Protein Structural Classes
 International Journal of Current Engineering and Technology E-ISSN 2277 4106, P-ISSN 2347 5161 2017 INPRESSCO, All Rights Reserved Available at http://inpressco.com/category/ijcet Research Article An Artificial
HMM applications. Applications of HMMs. Gene finding with HMMs. Using the gene finder
 HMM applications Applications of HMMs Gene finding Pairwise alignment (pair HMMs) Characterizing protein families (profile HMMs) Predicting membrane proteins, and membrane protein topology Gene finding
ECE662: Pattern Recognition and Decision Making Processes: HW TWO
 ECE662: Pattern Recognition and Decision Making Processes: HW TWO Purdue University Department of Electrical and Computer Engineering West Lafayette, INDIANA, USA Abstract. In this report experiments are
Algorithms in Bioinformatics FOUR Pairwise Sequence Alignment. Pairwise Sequence Alignment. Convention: DNA Sequences 5. Sequence Alignment
 Algorithms in Bioinformatics FOUR Sami Khuri Department of Computer Science San José State University Pairwise Sequence Alignment Homology Similarity Global string alignment Local string alignment Dot
Number sequence representation of protein structures based on the second derivative of a folded tetrahedron sequence
 Number sequence representation of protein structures based on the second derivative of a folded tetrahedron sequence Naoto Morikawa (nmorika@genocript.com) October 7, 2006. Abstract A protein is a sequence
Support'Vector'Machines. Machine(Learning(Spring(2018 March(5(2018 Kasthuri Kannan
 Support'Vector'Machines Machine(Learning(Spring(2018 March(5(2018 Kasthuri Kannan kasthuri.kannan@nyumc.org Overview Support Vector Machines for Classification Linear Discrimination Nonlinear Discrimination
Protein Dynamics. The space-filling structures of myoglobin and hemoglobin show that there are no pathways for O 2 to reach the heme iron.
 Protein Dynamics The space-filling structures of myoglobin and hemoglobin show that there are no pathways for O 2 to reach the heme iron. Below is myoglobin hydrated with 350 water molecules. Only a small
Molecular Modeling. Prediction of Protein 3D Structure from Sequence. Vimalkumar Velayudhan. May 21, 2007
 Molecular Modeling Prediction of Protein 3D Structure from Sequence Vimalkumar Velayudhan Jain Institute of Vocational and Advanced Studies May 21, 2007 Vimalkumar Velayudhan Molecular Modeling 1/23 Outline
INDEXING METHODS FOR PROTEIN TERTIARY AND PREDICTED STRUCTURES
 INDEXING METHODS FOR PROTEIN TERTIARY AND PREDICTED STRUCTURES By Feng Gao A Thesis Submitted to the Graduate Faculty of Rensselaer Polytechnic Institute in Partial Fulfillment of the Requirements for
Alpha-helical Topology and Tertiary Structure Prediction of Globular Proteins Scott R. McAllister Christodoulos A. Floudas Princeton University
 Alpha-helical Topology and Tertiary Structure Prediction of Globular Proteins Scott R. McAllister Christodoulos A. Floudas Princeton University Department of Chemical Engineering Program of Applied and
Finding Similar Protein Structures Efficiently and Effectively
 Finding Similar Protein Structures Efficiently and Effectively by Xuefeng Cui A thesis presented to the University of Waterloo in fulfillment of the thesis requirement for the degree of Doctor of Philosophy
Protein structural motif prediction in multidimensional - space leads to improved secondary structure prediction
 Provided by the author(s) and University College Dublin Library in accordance with publisher policies. Please cite the published version when available. Title Protein structural motif prediction in multidimensional
Support Vector Machines (SVM) in bioinformatics. Day 1: Introduction to SVM
 in bioinformatics. Day 1: Introduction to SVM") 1 Support Vector Machines (SVM) in bioinformatics Day 1: Introduction to SVM Jean-Philippe Vert Bioinformatics Center, Kyoto University, Japan Jean-Philippe.Vert@mines.org Human Genome Center, University
1 Support Vector Machines (SVM) in bioinformatics Day 1: Introduction to SVM Jean-Philippe Vert Bioinformatics Center, Kyoto University, Japan Jean-Philippe.Vert@mines.org Human Genome Center, University
Evolutionary design of energy functions for protein structure prediction
 Evolutionary design of energy functions for protein structure prediction Natalio Krasnogor nxk@ cs. nott. ac. uk Paweł Widera, Jonathan Garibaldi 7th Annual HUMIES Awards 2010-07-09 Protein structure prediction
09/06/25. Computergestützte Strukturbiologie (Strukturelle Bioinformatik) Non-uniform distribution of folds. Scheme of protein structure predicition
 Non-uniform distribution of folds. Scheme of protein structure predicition") Sequence identity Structural similarity Computergestützte Strukturbiologie (Strukturelle Bioinformatik) Fold recognition Sommersemester 2009 Peter Güntert Structural similarity X Sequence identity Non-uniform
Sequence identity Structural similarity Computergestützte Strukturbiologie (Strukturelle Bioinformatik) Fold recognition Sommersemester 2009 Peter Güntert Structural similarity X Sequence identity Non-uniform
Presenter: She Zhang
 Presenter: She Zhang Introduction Dr. David Baker Introduction Why design proteins de novo? It is not clear how non-covalent interactions favor one specific native structure over many other non-native
A General Method for Combining Predictors Tested on Protein Secondary Structure Prediction
 A General Method for Combining Predictors Tested on Protein Secondary Structure Prediction Jakob V. Hansen Department of Computer Science, University of Aarhus Ny Munkegade, Bldg. 540, DK-8000 Aarhus C,
Lecture 2. Judging the Performance of Classifiers. Nitin R. Patel
 Lecture 2 Judging the Performance of Classifiers Nitin R. Patel 1 In this note we will examine the question of how to udge the usefulness of a classifier and how to compare different classifiers. Not only
proteins Estimating quality of template-based protein models by alignment stability Hao Chen 1 and Daisuke Kihara 1,2,3,4 * INTRODUCTION
 proteins STRUCTURE O FUNCTION O BIOINFORMATICS Estimating quality of template-based protein models by alignment stability Hao Chen 1 and Daisuke Kihara 1,2,3,4 * 1 Department of Biological Sciences, College
1-D Predictions. Prediction of local features: Secondary structure & surface exposure
 1-D Predictions Prediction of local features: Secondary structure & surface exposure 1 Learning Objectives After today s session you should be able to: Explain the meaning and usage of the following local
A Novel Prediction Method of Protein Structural Classes Based on Protein Super-Secondary Structure
 Journal of Computer and Communications, 2016, 4, 54-62 http://www.scirp.org/journal/jcc ISSN Online: 2327-5227 ISSN Print: 2327-5219 A Novel Prediction Method of Protein Structural Classes Based on Protein
10/05/2016. Computational Methods for Data Analysis. Massimo Poesio SUPPORT VECTOR MACHINES. Support Vector Machines Linear classifiers
 Computational Methods for Data Analysis Massimo Poesio SUPPORT VECTOR MACHINES Support Vector Machines Linear classifiers 1 Linear Classifiers denotes +1 denotes -1 w x + b>0 f(x,w,b) = sign(w x + b) How
Artificial Neural Networks Examination, June 2005
 Artificial Neural Networks Examination, June 2005 Instructions There are SIXTY questions. (The pass mark is 30 out of 60). For each question, please select a maximum of ONE of the given answers (either
Supersecondary Structures (structural motifs)
") Supersecondary Structures (structural motifs) Various Sources Slide 1 Supersecondary Structures (Motifs) Supersecondary Structures (Motifs): : Combinations of secondary structures in specific geometric
Supersecondary Structures (structural motifs) Various Sources Slide 1 Supersecondary Structures (Motifs) Supersecondary Structures (Motifs): : Combinations of secondary structures in specific geometric
CS145: INTRODUCTION TO DATA MINING
 CS145: INTRODUCTION TO DATA MINING 5: Vector Data: Support Vector Machine Instructor: Yizhou Sun yzsun@cs.ucla.edu October 18, 2017 Homework 1 Announcements Due end of the day of this Thursday (11:59pm)
December 2, :4 WSPC/INSTRUCTION FILE jbcb-profile-kernel. Profile-based string kernels for remote homology detection and motif extraction
 Journal of Bioinformatics and Computational Biology c Imperial College Press Profile-based string kernels for remote homology detection and motif extraction Rui Kuang 1, Eugene Ie 1,3, Ke Wang 1, Kai Wang
Linear & nonlinear classifiers
 Linear & nonlinear classifiers Machine Learning Hamid Beigy Sharif University of Technology Fall 1394 Hamid Beigy (Sharif University of Technology) Linear & nonlinear classifiers Fall 1394 1 / 34 Table
SUPPLEMENTARY INFORMATION
 doi:10.1038/nature17991 Supplementary Discussion Structural comparison with E. coli EmrE The DMT superfamily includes a wide variety of transporters with 4-10 TM segments 1. Since the subfamilies of the
proteins Comprehensive description of protein structures using protein folding shape code Jiaan Yang* INTRODUCTION
 proteins STRUCTURE O FUNCTION O BIOINFORMATICS Comprehensive description of protein structures using protein folding shape code Jiaan Yang* MicrotechNano, LLC, Indianapolis, Indiana 46234 ABSTRACT Understanding
CS612 - Algorithms in Bioinformatics
 Fall 2017 Databases and Protein Structure Representation October 2, 2017 Molecular Biology as Information Science > 12, 000 genomes sequenced, mostly bacterial (2013) > 5x10 6 unique sequences available
THE TANGO ALGORITHM: SECONDARY STRUCTURE PROPENSITIES, STATISTICAL MECHANICS APPROXIMATION
 THE TANGO ALGORITHM: SECONDARY STRUCTURE PROPENSITIES, STATISTICAL MECHANICS APPROXIMATION AND CALIBRATION Calculation of turn and beta intrinsic propensities. A statistical analysis of a protein structure
Introduction to" Protein Structure
 Introduction to" Protein Structure Function, evolution & experimental methods Thomas Blicher, Center for Biological Sequence Analysis Learning Objectives Outline the basic levels of protein structure.
Protein structure prediction. CS/CME/BioE/Biophys/BMI 279 Oct. 10 and 12, 2017 Ron Dror
 Protein structure prediction CS/CME/BioE/Biophys/BMI 279 Oct. 10 and 12, 2017 Ron Dror 1 Outline Why predict protein structure? Can we use (pure) physics-based methods? Knowledge-based methods Two major
Protein Structure Prediction Using Neural Networks
 Protein Structure Prediction Using Neural Networks Martha Mercaldi Kasia Wilamowska Literature Review December 16, 2003 The Protein Folding Problem Evolution of Neural Networks Neural networks originally
Protein structure analysis. Risto Laakso 10th January 2005
 Protein structure analysis Risto Laakso risto.laakso@hut.fi 10th January 2005 1 1 Summary Various methods of protein structure analysis were examined. Two proteins, 1HLB (Sea cucumber hemoglobin) and 1HLM
Template Free Protein Structure Modeling Jianlin Cheng, PhD
 Template Free Protein Structure Modeling Jianlin Cheng, PhD Associate Professor Computer Science Department Informatics Institute University of Missouri, Columbia 2013 Protein Energy Landscape & Free Sampling
Protein Structure and Function Prediction using Kernel Methods.
 Protein Structure and Function Prediction using Kernel Methods. A THESIS SUBMITTED TO THE FACULTY OF THE GRADUATE SCHOOL OF THE UNIVERSITY OF MINNESOTA BY Huzefa Rangwala IN PARTIAL FULFILLMENT OF THE
Chemical Shift Restraints Tools and Methods. Andrea Cavalli
 Chemical Shift Restraints Tools and Methods Andrea Cavalli Overview Methods Overview Methods Details Overview Methods Details Results/Discussion Overview Methods Methods Cheshire base solid-state Methods
Machine learning comes from Bayesian decision theory in statistics. There we want to minimize the expected value of the loss function.
 Bayesian learning: Machine learning comes from Bayesian decision theory in statistics. There we want to minimize the expected value of the loss function. Let y be the true label and y be the predicted
Programme Last week s quiz results + Summary Fold recognition Break Exercise: Modelling remote homologues
 Programme 8.00-8.20 Last week s quiz results + Summary 8.20-9.00 Fold recognition 9.00-9.15 Break 9.15-11.20 Exercise: Modelling remote homologues 11.20-11.40 Summary & discussion 11.40-12.00 Quiz 1 Feedback
Protein Structure Determination from Pseudocontact Shifts Using ROSETTA
 Supporting Information Protein Structure Determination from Pseudocontact Shifts Using ROSETTA Christophe Schmitz, Robert Vernon, Gottfried Otting, David Baker and Thomas Huber Table S0. Biological Magnetic
Analysis of the Performance of AdaBoost.M2 for the Simulated Digit-Recognition-Example
 Analysis of the Performance of AdaBoost.M2 for the Simulated Digit-Recognition-Example Günther Eibl and Karl Peter Pfeiffer Institute of Biostatistics, Innsbruck, Austria guenther.eibl@uibk.ac.at Abstract.
The typical end scenario for those who try to predict protein
 A method for evaluating the structural quality of protein models by using higher-order pairs scoring Gregory E. Sims and Sung-Hou Kim Berkeley Structural Genomics Center, Lawrence Berkeley National Laboratory,
hsnim: Hyper Scalable Network Inference Machine for Scale-Free Protein-Protein Interaction Networks Inference
 CS 229 Project Report (TR# MSB2010) Submitted 12/10/2010 hsnim: Hyper Scalable Network Inference Machine for Scale-Free Protein-Protein Interaction Networks Inference Muhammad Shoaib Sehgal Computer Science
Gene Expression Data Classification with Revised Kernel Partial Least Squares Algorithm
 Gene Expression Data Classification with Revised Kernel Partial Least Squares Algorithm Zhenqiu Liu, Dechang Chen 2 Department of Computer Science Wayne State University, Market Street, Frederick, MD 273,
Protein Structure. W. M. Grogan, Ph.D. OBJECTIVES
 Protein Structure W. M. Grogan, Ph.D. OBJECTIVES 1. Describe the structure and characteristic properties of typical proteins. 2. List and describe the four levels of structure found in proteins. 3. Relate
ARTIFICIAL NEURAL NETWORKS گروه مطالعاتي 17 بهار 92
 ARTIFICIAL NEURAL NETWORKS گروه مطالعاتي 17 بهار 92 BIOLOGICAL INSPIRATIONS Some numbers The human brain contains about 10 billion nerve cells (neurons) Each neuron is connected to the others through 10000
PROTEIN SECONDARY STRUCTURE PREDICTION USING NEURAL NETWORKS AND SUPPORT VECTOR MACHINES
 PROTEIN SECONDARY STRUCTURE PREDICTION USING NEURAL NETWORKS AND SUPPORT VECTOR MACHINES by Lipontseng Cecilia Tsilo A thesis submitted to Rhodes University in partial fulfillment of the requirements for
Diversity Regularization of Latent Variable Models: Theory, Algorithm and Applications
 Diversity Regularization of Latent Variable Models: Theory, Algorithm and Applications Pengtao Xie, Machine Learning Department, Carnegie Mellon University 1. Background Latent Variable Models (LVMs) are
Induction of Decision Trees
 Induction of Decision Trees Peter Waiganjo Wagacha This notes are for ICS320 Foundations of Learning and Adaptive Systems Institute of Computer Science University of Nairobi PO Box 30197, 00200 Nairobi.
Prediction and refinement of NMR structures from sparse experimental data
 Prediction and refinement of NMR structures from sparse experimental data Jeff Skolnick Director Center for the Study of Systems Biology School of Biology Georgia Institute of Technology Overview of talk
Machine Learning Linear Classification. Prof. Matteo Matteucci
 Machine Learning Linear Classification Prof. Matteo Matteucci Recall from the first lecture 2 X R p Regression Y R Continuous Output X R p Y {Ω 0, Ω 1,, Ω K } Classification Discrete Output X R p Y (X)
Predictive Analytics on Accident Data Using Rule Based and Discriminative Classifiers
 Advances in Computational Sciences and Technology ISSN 0973-6107 Volume 10, Number 3 (2017) pp. 461-469 Research India Publications http://www.ripublication.com Predictive Analytics on Accident Data Using
Brief Introduction of Machine Learning Techniques for Content Analysis
 1 Brief Introduction of Machine Learning Techniques for Content Analysis Wei-Ta Chu 2008/11/20 Outline 2 Overview Gaussian Mixture Model (GMM) Hidden Markov Model (HMM) Support Vector Machine (SVM) Overview
A New Similarity Measure among Protein Sequences
 A New Similarity Measure among Protein Sequences Kuen-Pin Wu, Hsin-Nan Lin, Ting-Yi Sung and Wen-Lian Hsu * Institute of Information Science Academia Sinica, Taipei 115, Taiwan Abstract Protein sequence
Conditional Graphical Models
 PhD Thesis Proposal Conditional Graphical Models for Protein Structure Prediction Yan Liu Language Technologies Institute University Thesis Committee Jaime Carbonell (Chair) John Lafferty Eric P. Xing
Discriminative Direction for Kernel Classifiers
 Discriminative Direction for Kernel Classifiers Polina Golland Artificial Intelligence Lab Massachusetts Institute of Technology Cambridge, MA 02139 polina@ai.mit.edu Abstract In many scientific and engineering
STA 414/2104: Lecture 8
 STA 414/2104: Lecture 8 6-7 March 2017: Continuous Latent Variable Models, Neural networks With thanks to Russ Salakhutdinov, Jimmy Ba and others Outline Continuous latent variable models Background PCA
Optimization of the detection of train wheel defects. SNCF Innovation and Research Department Paris, FRANCE 1
 Optimization of the detection of train wheel defects 1 R. Ziani SNCF Innovation and Research Department Paris, FRANCE 1 Abstract This paper describes how statistical models and learning algorithms could
Pattern Recognition 2018 Support Vector Machines
 Pattern Recognition 2018 Support Vector Machines Ad Feelders Universiteit Utrecht Ad Feelders ( Universiteit Utrecht ) Pattern Recognition 1 / 48 Support Vector Machines Ad Feelders ( Universiteit Utrecht
Orientational degeneracy in the presence of one alignment tensor.
 Orientational degeneracy in the presence of one alignment tensor. Rotation about the x, y and z axes can be performed in the aligned mode of the program to examine the four degenerate orientations of two
Predictive analysis on Multivariate, Time Series datasets using Shapelets
 1 Predictive analysis on Multivariate, Time Series datasets using Shapelets Hemal Thakkar Department of Computer Science, Stanford University hemal@stanford.edu hemal.tt@gmail.com Abstract Multivariate,