Supplementary Information
|
|
|
- Rose Lynch
- 5 years ago
- Views:
Transcription
1 Supplementary Information LINE-1-like retrotransposons contribute to RNA-based gene duplication in dicots Zhenglin Zhu 1, Shengjun Tan 2, Yaqiong Zhang 2, Yong E. Zhang 2,3 1. School of Life Sciences, Chongqing University, Chongqing , China 2. Key Laboratory of the Zoological Systematics and Evolution & State Key Laboratory of Integrated Management of Pest Insects and Rodents, Institute of Zoology, Chinese Academy of Sciences, Beijing , China 3. University of Chinese Academy of Sciences, Beijing , China This file consists of full materials and methods, supplementary tables and supplementary figures
2 Index Methods... 3 Identification and assembly of retrocnvs... 3 RetroCNV genotyping in Arabidopsis accessions... 4 LTR/LINE retrotransposon inference... 5 Identification of newly evolved retrocopies in dicot reference genomes... 6 Supplementary Tables... 7 Table S Table S Table S Table S Table S Supplementary Figures Figure S Figure S Figure S Figure S Figure S Figure S Figure S Figure S Figure S Figure S Figure S Figure S References in the Supplementary Information
3 Methods Identification and assembly of retrocnvs We identified retrocnvs in Arabidopsis (Arabidopsis thaliana) by integrating several published retrocnv identification strategies (Fig. 2) 1,2. Specifically, we downloaded the fastq-format Illumina sequencing data of 18 Arabidopsis accessions, with sequencing coverage ranging from 27-fold to 36-fold and read length ranging from 36 to 51 bp 3. We split all paired-end reads into single reads to retain cases of retroposition in which one read is mapped to the parental locus and its partner is mapped to the insertion site. We also retrieved the reference genome and gene annotations from TAIR10 4,5. We mapped reads against the exon-exon junction library (200 bp) using NovoAlign (version 2.08, with the parameters -o Softclip -r All 10 -s 1, which allows up to the top 10 alignment hits for one read and enables automatic trimming at two ends. For reads with more than one hit, we kept reads with differences in their alignment scores of greater than 5 and with identities greater than 5% between the top 1 and 2 alignment positions. In this way, we excluded all multimapping reads, i.e., reads that mapped to more than one location equally well. Then, we pulled out reads that uniquely mapped to the exon-exon junctions after removing reads generated by PCR duplication using Picard (picard.sourceforge.net). We called an event retroposition or intron loss if there were at least three reads from one accession spanning the exon-exon junctions with an overhang ( 10 bp). The introns of parental genes are present during retroposition but are absent during intron loss. Thus, in the case of retroposition, we expected to detect reads that mapped to both exon-intron and intron-exon junctions, suggesting the existence of parental introns. On this basis, we further selected cases in which at least three reads spanned the exonintron or intron-exon junctions with an overhang ( 10 bp). After applying these two filtering steps, we identified candidate retrocnvs in Arabidopsis accessions. In contrast to previous efforts 1,2, we next performed targeted de novo assembly. We - 3 -
4 collected reads that were uniquely mapped to exon-exon junctions and the 500-bp flanking regions of the parental genes. We assembled these reads using MIRA 6, which is able to recognize differences between parental and retro copies, including SNPs and intron deletions. Afterwards, we retrieved exon-exon junction-spanning sequences with 20 bp on each side and used BLAT 7 to align these 40-bp sequences against contigs assembled by MIRA. Given the output, we further extracted candidate retrocnvs that covered the junctions with both identity and coverage higher than 95%. Then, we mapped all retrocnvs against the genome using BLAT on the Arabidopsis Genome Browser (epigenomics.mcdb.ucla.edu) and retained only those cases with the hallmark of intron loss compared with the presumed parental gene. Finally, for these retrocnvs, we implemented the PRICE package 8 to extend the flanking regions by searching and merging reads aligned to the contigs generated by MIRA. We were able to assemble the flanking regions of four retrocnvs. For each retrocnv, we took the longest contig (median length, 528 bp) in one accession as the template for downstream mechanistic analyses. All the reads mapping to retrocnvs and their insert sites, especially those spanning exon-exon junctions, and the breaking points between retrocnvs and flanking regions are shown in Fig. S2, S3, S5 and S7 (Panels D-F). RetroCNV genotyping in Arabidopsis accessions Next, we employed a conservative approach to determine the presence/absence of the four retrocnvs across the 18 accessions (Fig. S12). Specifically, we mapped the reads of the different accessions onto the reference genome as well as the template retrocnvs using NovoAlign ( with the aforementioned parameters -r All 10 -s 1. We extracted the reads that were uniquely mapped to retrocnvs and used BLAT 7 to align these reads against the retrocnvs and the corresponding parental genes. We retained reads that mapped to the retrocnvs with at least 95% coverage and that had higher identity than when mapped to the parental genes. If at least two reads mapped better to the retrocnvs, we again assembled these reads into longer contigs using MIRA 6. We then searched the contigs against the - 4 -
5 retrocnvs and the reference genome using BLAT 7. If the retrocnv produced a better alignment, we classified it as presence in this accession. In parallel, given that the 3 breakpoint may be disturbed by polya sequences, we extended the 5 breakpoint of the retrocnv of interest by 50 bp and used the spanning 100-bp sequence to search reads in the 18 accessions. We then assembled the mapped reads using MIRA 6. If we generated a contig that spanned the 5 breakpoint, we classified this as the presence of the insertion site. Overall, we conservatively assigned the presence of retrocnvs across accessions by requiring both the presence of the retroposed region and the corresponding 5 breakpoint sequences. In other words, the population frequency in Table S1 represents a lower-bound estimation. LTR/LINE retrotransposon inference To infer whether the flanking regions of retrocnvs and recently evolved retrocopies encoded by the reference genomes consist of LTR/LINE retrotransposons, we used RepeatMasker ( to search a customized repeat library. Considering the issue of incomplete annotation, this library not only included known plant retrotransposons listed in Repbase 9,10 and TIGR 11 but also covered retrotransposons predicted in the reference genomes of Arabidopsis and the cassava, Manihot esculenta (M. esculenta) (version 4.1) 12 by two de novo strategies based on MGESCan-LTR 13 and MGEScan-nonLTR 14. We clustered all repeat elements via CD- HIT 15, with an identity cutoff of 80%, considering that in MGESCan-LTR, the identity cutoff of the upstream and downstream long terminal repeat was set at 80% 13. Based on our comprehensive and non-redundant repeat library, we scanned for repeat elements using RepeatMasker with the parameter -s to increase the sensitivity. Given that the retroelement structure could rapidly degenerate 16, we specified relatively relaxed criteria: coverage > 50% or mapped length > 150 bp, divergence < 50% and SW score >
6 Identification of newly evolved retrocopies in dicot reference genomes As in the case of retrocnvs, we again searched for the hallmark of intron loss and identified retrocopies encoded by Arabidopsis and the M. esculenta (version 4.1). For both species, we first extracted exon-exon junction sequences by extending 20 bp beyond the junction. Then, we aligned these sequences against the reference genome via BLAT. We extracted the possible segments of candidate retrocopies by only retaining alignments with a single block, suggesting an intron loss event. Moreover, because we were interested in recently evolved retrocopies, we required that the alignment showed high identity ( 95%) and high coverage ( 95%). Given these short alignments indicating intron loss, we further extended the boundaries of each candidate retrocopy and its corresponding parental gene by 1,000 bp and aligned them using BLAT. We reiterated this step until we could no longer extend the alignment. After this step, we inferred the breakpoint of the retrocopy and the insertion site. For all candidate retrocopies, we performed the following two filters. First, there were cases with one parental gene and multiple paralogous retrocopies that may represent secondary DNA-level duplications of the first retrocopy. Thus, we only kept the retrocopy with the highest similarity to the parental gene (i.e., the one with the highest BLAT score). Second, we manually checked the candidate retrocopies by mapping them onto the reference genome using BLAT on the Arabidopsis Genome Browser (epigenomics.mcdb.ucla.edu) and only retained the entries that showed spliced alignment against the corresponding parental genes. We genotyped 10 recently evolved retrocopies in the 18 Arabidopsis accessions by searching these retrocopies in the assembled genomes of the 18 accessions 3 via BLAT
7 Supplementary Tables Table S1. Genotyping of retrocnvs across 18 accessions. The name of each retrocnv is represented by RC_ (short for retrocnv) followed by its parental gene accession. Y denotes presence, whereas N denotes absence. RetroCNV Bur-0 Can-0 Ct-1 Edi-0 Hi-0 Kn-0 Ler-0 Mt-0 No-0 Oy-0 Po-0 Rsch-4 Sf-2 Tsu-0 Wil-2 Ws-0 Wu-0 Zu-0 RC_AT3G N Y N N Y N N N N N N N Y N N N N N RC_AT3G N N N Y Y Y N Y Y Y Y Y Y Y Y Y Y Y RC_AT5G N N N N N N N N N Y Y N N N N N N Y RC_AT5G N N N N N N N N Y N N N N N N N N N - 7 -
8 Table S2. The length (bp) of the assembled retrocnvs and their flanking regions. RetroCNV Retrocopy 5' flanking region 3' flanking region RC_AT3G ,321 RC_AT3G , RC_AT5G RC_AT5G
9 Table S3. Newly evolved retrocopies encoded by the Arabidopsis reference genome. The convention largely follows Table 1 in the main text. Reported denotes whether the retrocopy is identified previously Only the retrocopy derived from the parental gene AT5G is associated with LTR retrotransposon at two sides. Another three cases associated with a polya tail but not LTR retrotransposons were possibly driven by an L1-like mechanism. The remaining six cases are associated with either a previously undescribed mechanism or with an LTR or L1-like mechanism in which the sequence signatures have already degenerated over evolutionary time. Thus, we called these cases uncertain in the last column. After aligning the sequences between the retrocopy and its corresponding parental gene on the basis of reading frame of the later, we calculated non-synonymous substitution rate (Ka) and synonymous substitution rate (Ks) via the codeml program in the PAML package 20. We then performed the likelihood ratio test on whether Ka/Ks is significantly smaller than Such a conservative criteria ensured that the retrocopy must be under constraint even the parental locus is neutrally evolving with a Ka/Ks of
10 PG Locations Reported Flank PolyA TSD TTAAAA Mechanism Ka Ks Ka/Ks P-value AT1G Chr1(+): Y Y N N L1-like AT1G Chr2(+): N N N N uncertain AT1G Chr4(-): N N N N uncertain AT1G Chr3(-): Y N N N uncertain NA AT2G Chr5(+): Y N N N uncertain AT3G Chr1(-): Y N N N uncertain AT4G Chr4(+): Y N N N uncertain AT4G Chr1(+): N Y N N L1-like AT4G Chr4(-): N Y Y N L1-like AT5G Chr5(-): Y LTR/LTR N N N LTR
11 Table S4. Genotyping of recently evolved retrocopies in the 18 accessions. The name of each retrocopy is represented by R_ (short for recently evolved retrocopy) and its parental gene. Y denotes presence, whereas N denotes absence. Retrocopy Bur-0 Can-0 Ct-1 Edi-0 Hi-0 Kn-0 Ler-0 Mt-0 No-0 Oy-0 Po-0 Rsch-4 Sf-2 Tsu-0 Wil-2 Ws-0 Wu-0 Zu-0 R_AT1G Y Y Y Y Y Y Y Y Y Y Y Y Y Y Y Y Y Y R_AT1G Y Y Y Y Y Y Y Y Y Y Y Y Y Y Y Y Y Y R_AT1G Y Y Y Y Y Y Y Y Y Y Y Y Y Y Y Y Y Y R_AT1G Y Y Y Y Y Y Y Y Y Y Y Y Y Y Y Y Y Y R_AT2G Y Y Y Y Y Y Y Y Y Y Y Y Y Y Y Y Y Y R_AT3G Y Y Y Y Y Y Y Y Y Y Y Y N Y Y Y Y Y R_AT4G Y Y Y Y Y Y Y Y Y Y Y Y Y Y Y Y Y Y R_AT4G Y Y Y Y Y Y Y Y Y Y Y Y Y Y Y Y Y Y R_AT4G Y Y Y Y Y Y Y Y Y Y Y Y Y Y Y Y Y Y R_AT5G Y Y Y Y Y Y Y Y Y Y Y Y Y Y Y Y N Y
12 Table S5. Newly evolved retrocopies encoded by the M. esculenta reference genome. The convention follows Table 1. LTR retrotransposons could be identified in only one side for three cases. Another four cases associated with the polya tail but not LTR retrotransposons were possibly driven by an L1-like mechanism. The remaining six cases are associated with either an undescribed mechanism or with an LTR or L1-like mechanism in which the sequence signatures have already degenerated over evolutionary time. Retrocopy Parental gene Location Flank PolyA TSD TTAAAA Mechinism R_cassava4.1_000716m cassava4.1_000716m scaffold12341(+): /LTR N N N LTR R_cassava4.1_000867m cassava4.1_000867m scaffold02865(+): LTR/ N N N LTR R_cassava4.1_001372m cassava4.1_001372m scaffold12746(-): N N N uncertain R_cassava4.1_002584m cassava4.1_002584m scaffold02658(-): N N N uncertain R_cassava4.1_006936m cassava4.1_006936m scaffold07238(+): Y Y Y L1-like R_cassava4.1_007181m cassava4.1_007181m scaffold06700(+): LTR/ N N N LTR R_cassava4.1_012117m cassava4.1_012117m scaffold06582(-): Y N N L1-like R_cassava4.1_012226m cassava4.1_012226m scaffold00325(-): N N N uncertain R_cassava4.1_015105m cassava4.1_015105m scaffold07329(-): Y N N L1-like R_cassava4.1_018827m cassava4.1_018827m scaffold00847(-): N N N uncertain R_cassava4.1_019865m cassava4.1_019865m scaffold08617(-): Y Y Y L1-like R_cassava4.1_019883m cassava4.1_019883m scaffold00847(-): N N N uncertain R_cassava4.1_033677m cassava4.1_033677m scaffold10563(-): N N N uncertain
13 Supplementary Figures A TCCGTTATCTCCGCCGAACCATCCATCCTCCGCTACTTCATCTCCGCCGCTGAGATCGGAATCAC TATCCCACTCCATTTGATTTTGCATACACACCCACAAAATAAAGCTTAAGACTGCCCACGAATCT TCTTCCTCAGCGACAGGAGAAGAGACCCAGAAGAACACAGTTTGATTTTGAATCGCGGAATCTGA TATCTGTAGGTAATCGAAGTCTCCACAGGAAAAAGTTCAAAACTTTAGACAAACCCAGAAATCGT CTTCTTCAAGAACAGGAGACAGAAGAACAGATTTTGAAATGGAATCAAGCGAAGGAAAGAGGAAT CTGATATTTGTAGGTAATGGAAGTCTCCACCGCCCACTTCTAAGAGGAGGAGAAGAAGAAGAGAG ATGATTCGGTCGCTCGATGACTCGGCTCTTCTCAGTGCCTCTCCTTTTCCATCTTTAACCAGACC GGTTTCTTAATTTTACCTTACCGGTTTAGTTTATTTATCCGGTTTACACAAAATATCCTGTAAGT TCCTTGTGAGATTTTTTTGGTTTTACCAAATGAGTGTATTAGAATCAATTTTAATGATTTAGAAA CATTAGAAACATCGTGACTCAGCTCCGTCTCTCACTGTAATAATCAAGTCAGAGCCGACGAAGTT GACGTTTGCGCCGTCGGAGGAGAGTTTTTACTGTTGCTGTCCAGTTGACATTTTGAGACATGAAA TGATCTGGGGTTGATGTTTGTATGGTAACAGAGGAATTATAGTCATGAAGCTTATTTCACTTGTC AGAAACGTTCGTTCTCGCCAATGTCAACCGGAAGTTATCTGGTCTTTGCAAGTTCGTTTCTTGCA GCAAGATTCTGTCTCGAAAGCTAAACCCAAGAAATACAAACACCCGTCAGTTTATGATCCGTATG GTCCTAGACCCCAGCCTTCAAGCAAAATCATGGAGCTAGCTGAGCGTATAGCTGCATTATCTCCA GAAGAAAGAAAACAGATTGGTCCTGCTCTCAATGAACACCTGAGGCTTCCAAAACAACAGATGAT TTCATCGGACGGCATTGGAGCAAACAAGATACGGAGCTGGGAATGTAGAGGAGAAGAAGGAGAAG ACGGCTTTCGATGTGAAGTTGGAGAAGTTTAATGCATCTGATAAGATCAAAGTGATAAAAGAAGT TAGAACGTTCACAAGTTTGGGTCTGAAGGAAGCGAAAGAGCTTGTGGAGAAAGGATAATAGTCTT TTTCTACTTTCGATCTCAAAAACTACTAAAAAGTGAAGCCTTGTAAATCTTCTTTAAAGAGTAGA AACATGTATTATTATCTTTTAGTTATTCATCTTCAAAGTTTTGATTAATTTAAAGTGAATGAAAT ATAAATTCAATACAAAAAAAGAAGAAACCCAAATCTACAAAAGAAAAAAAGAAAAATATATAATT GATTTAGGATTCTAAATTCTCACGTACTCGGAGAGCAAGCCGTTGAATAGACTGATCATCGAAGC AAGGATCAAAGGTCTTAATCTTGGACACAAAATCCATAGCTTCACTATACTTCCCTGCTCTGCAA TAACCATCTACTACCATTTTAAAAGTCAGCTCATTTGGTCTGCAATCATTCTTCGCCATGCACTC AATCACATCTTCTATCTCTGCAAACATTCCCATCGCCGTGTAACCCGAAACAAACGTGTTGTAAG TGAAAATGCACGGTCTGATTCCCCGCTCTGTCATCTCAGACAGCATCCTAACCGCTTCTTGCATC AACCCTCTTCTGCAGAAACCTTTGATCACTGTGTTGTAAGAGACCAGGTCCGGTTTTAACTGCGA TTTTTCTAGAGTCTTGAGGATTTCTTCGGCTTTCCAACACTCTCCTCTTCTTACGTACATGTCCA TCAGG
14 B TTATATGATAACATTCCTAAATTTTCAAAGGTGTCTATCAATCTATAAAACCATGATTACTTTCT GAAACCTTCCAGAAATTTACTAAAAACATGTTGTTCCTAGATACTTTTGAGTTTTGACACAATGA GGACCATTCCTATATCTTTTGTAAGATACTCTAGTAGTCTAGTCCTACTGTCTCGATCTTCTATT AAATCTTTAAGTATAGAAGATCCAAGTAAACTTACATATAGTTAATAGAAGATCCAAGTAAGATC AAAGCCAATAATATTAAATTTATATAAAAAAAAATTGTAAACACTGTTTTTTTTTTCAATTGATG AAAGGAAAAAAGCATTCAGGAATTGTTTTTATTTTTATTTTTTTGTTAACATTCATTTATTTAAA TTGCATAAGAAAAGAAAAAAGTGATAACCATTGCCAGAAACAAAGGTATAGAGAATGTGGTAACC ATTGATCTGCATGGTCAGCATGTTAAACCAGCAATGAAGCTACTGAAGCTACATCTGTTATTTGG ATCATATGTTCCAGCCATTCAGACTCTACGAGTGATCACAGGATGTGGAGCTTCTGGGTTTGGGA AGTCTAAGGTGAAACAATCAGTGGTAAAGCTGCTAGAAAGAGAAGGAGTTAGGTATTGTGAAGAG AACAGAGGGACACTGCTGATCAAGCTTGACGGAGGTAGTAGAGAGTTCAGTTTCTTAGACACAGA GAGTGACTCTGATGAATAAGTGATAACTAAAACTAAAGTCAGGTTTTAGCTTTAGATCTTAAAAT TTATGTCGATTTTGCCTATATCTGATGCTAGCTCTCTGTTGTTAAGTAAATGTTGAGCAAAAAAA AAAAAAAGTTAACAAGCCTTAGACAAAAAATTAAGAGCCCAATAACGAAAGTTGAACTGTAAAGA AACGAAATATAACTAGTTGTAGAATTGTATATATAGGATAGCTAGTAAAAAAGAGTGGTTGTTCT GTAACTACAATCATTTATTTTTTTGTTGACATTCGTAATCATTGTAACATACGA
15 C AATGTTGGCGACCCACAACCCCAATGCGTTTCCAACACATTCAAAAGCTGACAGTTTGACAAATT GTGAAAGGTCACATCAACTTGACAAAGAGATTCATTTCCTTTGCCACTTTTGAATTATTTATATG TAATTTCTTTCCTTTTCCATAAAAAAAAACTATGAGGTAGAAAAACAAGATCTGGGTTTCCTCTT ATAGAAACCCTGATTCCAACCTAACTGTCTTCAGATTACACGTTTCAAGTGTACTTTGCATGTGA TCGTGATAATATTTTTAATTATTATTTTTTTATTTTAGCATATGCTCCCACAACAATCTGTGACA CTATCACACTAACATTAATATTAAAAGCACAACATGTCAATCATATATACGGTCTTATTCGCAAG TCCTGTGATAGAACTTTTCTTCTCAGGTAGAGGAAACCAACCTTTCATTTGTTCCTTGAAACTGA AAAGTAAAAAAACAATCGAAATTAAAGCTCGTCAGTGTTACATCGTTTAATTAGAGCCGTTATTC GTGACTTACACTGATACCATATTAGAGTGTGGGCTTCCAACCTAAAACCAATTGGCAATAGGTGG AGAGGCCCATATCTTATATATACCACTTAAGATCCTACTCAACTTCCGATGTGGGACATTGTCCC TAATACGCCCCCTCGAGATGATGGCTCTTCTAGCCATTGATCTCGATATGTTTGGGCATGGATCG GCGGGCCAAGTATTGGGCCGGACCGATGTGGATCGGGTTGAGTATGTGCGGATCGGGCTCTGATA CCATATTAGACTGTGGGCTTCTACACCACAGAAAAAACTTCGTCTCTCTTCTCTGCTTCGCCCTC TCATTTCCTGTGAGATAAAGGCGGAGTCTCTCTCCAATTATTTTGCTCATCCATCGATTCTTAGA GTTCAAAATGGTTGATCAAGTTCAGCACCCCACTATTGCGCAGAAAGCTGCCGGGCAGTTCATGC GTTCAAGTGTTTCCAAGGACGTTCAAGTGGGTTACCAGAGGCCTTCTATGTATCAAAGACATGCA ACCTACGGAAACTACTCCAATGCTGCATTTCAATTTCCTCCCACATAGGAGAGAAGGGGTTCACT AACTTTGCCCTTGACTTTCTGATGGGTGGTGTTTCTGCTGCCGTCTCCAAGACTGCTGCTGCTCC TATTGAACGTGTTAAGCTTTTGATCCAGAACCAGGATGAGATGATTAAAGCTGGCAGGCTTTCTG AACCCTACAAGGGTATTGGTGACTGTTTCGGCAGGACGATTAAGGATGAAGGTTTTGGTTCTCTA TGGAGAGGCAACACTGCCAATGTTATCCGTTATTTCCCCACTCAGGTTTGTTGAGTTTCATACTC TTTCTTGTTATAGCTTTTGAAAAAACATAATTTTGTGCTAACCTTCTTTTTTGTCTATTGTAGGC CTTGAACTTTGCCTTCAAAGATTACTTCAAAAGACTTTTCAACTTTAAGAAGGACAGAGATGGTT ACTGGAAGTGGTTTGCTGGTAACTTGGCATCTGGAGGAGCAGCTGGTGCCTCTTCCCTTCTGTTT GTGTACTCCCTTGACTATGCCCGTACCCGTCTAGCTAATGATGCCAAGGCTGCAAAGAAAGGAGG TGGTGGAAGACAGTTTGATGGTCTTGTTGATGTCTACAGAAAGACACTTAAGACTGATGGTATTG CTGGTCTGTACCGTGGATTCAACATCTCATGTGTTGGTATCATTGTCTACCGTGGTCTGTACTTT GGACTCTATGACTCTGTGAAGCCTGTTCTCCTCACTGGTGACTTACAGGTATGTCTTGTTGTCTT TCATTTATATCTGTAAGGTGACAGCTTAA
16 D TTAACAACAACAAAAAAGGTTGTTGCATGGAAGATTTTTCACCGTTGTTTGTCTTGAAGTGAAAT TTTAATGTCTGGCTCCACTTTTTTGTGTCAATTTTCTTCTAAGAATAAAACAAAAAGGAAAAGGA GAAGCAATTGCATTGAAGTGGTGAACAAAATTAATTTCTCAACATCAAAGTTGATGACTTCATAC ATATAATTTCACACCTAAGAGACTAATTTGACACTGTTAGCAAAAATAAAAATCAAACCTTCATC ATGGGTCAACTCTTAATTAAAAATCTATCTAGATATTTATATGTAGTGTTGTTGTTTTAAGAACT AAAACTAAATATCAAGAAAAGAAATAAGTTTGAAACGGAGCCGAGAAAAAAACAGGGTTTACAGT TTGATATAACACCGTATCGATGGGGTGTGAAGTATAATGTTTTGATAATTACCAATCATAAAAGC ATTATTAAAATCGATATTTTCGGCTTTAATTTGTGTCTTGGGGCCAGGAACTTTGCAAATTAATG AGCTATTCTAAGAGTTTGAGACCTTACCACCACTACTTTGTAACGTTTTTAACTATTTTTTATCG TTTGCCGCTAAACAGTTTATATCGTTTTTGTGTTATCCGTCAGACCCTAAAAACTAAAATGGAAA AATACAAGTTAACTTGTACATTACGTATGAGGAAGAGACATTATAATTTGAGCAAAAAATATGAC AGTTTTAGGGGCACGATGCTAGAGGAAAGAGATTCAAGTAAAGGTATGTCAATTTAGGTTTAAAA TGAGATTTGGTATAATAATTTTCTTAATTGTTTTGACACTACAAGAAATATCCACATTCTTAGCA AGTTAGAAGCGCTGTATTTGTTTATCCACATTATTTATAATAGTTTGATTTGCTATAATAATTTT CTTAATAATTTGAAAAAAAATTGTTATCACATAGAAACTGTAATCACTATAAATAAAAATCATGA TCCTTTTTATCCTATCATTTAGTTATAGAAATTAAAGTTCTTAGATTCTTAAAAAAGCATAGTAT TAGAATAA

17 E

18 F Figure S1. Assembled sequences and validation of retrocnvs in Arabidopsis
19 Panels A and B show retrocnvs derived from AT3G and AT5G , which were assembled in the accessions Can-0 and Oy-0, respectively. The underlined sequence shows the retrocopy. For each retrocnv, we designed two pairs of primers (forward primer, dark blue; reverse primer, light blue) to amplify the sequences colored in red to validate the linkage of the 5 flanking region, retrocnv and 3 flanking region. Similarly, Panels C and D indicate retrocnvs derived from AT3G (No-0) and AT5G (No-0), respectively. In these two cases, only one suitable pair of primers could be designed, which spanned from the 5 flanking region to the 3 flanking region. These two panels were similarly marked following A and B. Panels E and F show the PCR results performed in accessions in which four retrocnvs were initially assembled (Table 1). In E, RC_AT3G , 5 and RC_AT3G , 3 correspond to the amplified sequence at the 5 end and that at the 3 end of RC_AT3G , respectively. Similarly, RC_AT5G , 5 and RC_AT5G , 3 show two sides of RC_AT5G , 3. Finally, Panel F shows the amplified fragment derived from RC_AT3G and RC_AT5G , respectively. For both Panel E and F, Exp denotes the expected length of amplified segments. For all cases, the lengths of all amplified fragments are consistent with the expected length inferred according to the aforementioned sequences (Panels A-D)
20 A. ACTTTGCATGTGATCGTGATAATATTTTTAATTATTATTTTTTTATTTTAGCATATGCTCCCACA ACAATCTGTGACACTATCACACTAACATTAATATTAAAAGCACAACATGTCAATCATATATACGG TCTTATTCGCAAGTCCTGTGATAGAACTTTTCTTCTCAGGTAGAGGAAACCAACCTTTCATTTGT TCCTTGAAACTGAAAAGTAAAAAAACAATCGAAATTAAAGCTCGTCAGTGTTACATCGTTTAATT AGAGCCGTTATTCGTGACTTACACTGATACCATATTAGAGTGTGGGCTTCCAACCTAAAACCAAT TGGCAATAGGTGGAGAGGCCCATATCTTATATATACCACTTAAGATCCTACTCAACTTCCGATGT GGGACATTGTCCCTAATACGCCCCCTCGAGATGATGGCTCTTCTAGCCATTGATCTCGATATGTT TGGGCATGGATCGGCGGGCCAAGTATTGGGCCGGACCGATGTGGATCGGGTTGAGTATGTGCGGA TCGGGCTCTGATACCATATTAGACTGTGGGCTTCTACACCACAGAAAAAACTTCGTCTCTCTTCT CTGCTTCGCCCTCTCATTTCCTGTGAGATAAAGGCGGAGTCTCTCTCCAATTATTTTGCTCATCC ATCGATTCTTAGAGTTCAAAATGGTTGATCAAGTTCAGCACCCCACTATTGCGCAGAAAGCTGCC GGGCAGTTCATGCGTTCAAGTGTTTCCAAGGACGTTCAAGTGGGTTACCAGAGGCCTTCTATGTA TCAAAGACATGCAACCTACGGAAACTACTCCAATGCTGCATTTCAATTTCCTCCCACATAGGAGA GAAGGGGTTCACTAACTTTGCCCTTGACTTTCTGATGGGTGGTGTTTCTGCTGCCGTCTCCAAGA CTGCTGCTGCTCCTATTGAACGTGTTAAGCTTTTGATCCAGAACCAGGATGAGATGATTAAAGCT GGCAGGCTTTCTGAACCCTACAAGGGTATTGGTGACTGTTTCGGCAGGACGATTAAGGATGAAGG TTTTGGTTCTCTATGGAGAGGCAACACTGCCAATGTTATCCGTTATTTCCCCACTCAGGTTTGTT GAGTTTCATACTCTTTCTTGTTATAGCTTTTGAAAAAACATAATTTTGTGCTAACCTTCTTTTTT GTCTATTGTAGGCCTTGAACTTTGCCTTCAAAGATTACTTCAAAAGACTTTTCAACTTTAAGAAG GACAGAGATGGTTACTGGAAGTGGTTTGCTGGTAACTTGGCATCTGGAGGAGCAGCTGGTGCCTC TTCCCTTCTGTTTGTGTACTCCCTTGACTATGCCCGTACCCGTCTAGCTAATGATGCCAAGGCTG CAAAGAAAGGAGGTGGTGGAAGACAGTTTGATGGTCTTGTTGATGTCTACAGAAAGACACTTAAG ACTGATGGTATTGCTGGTCTGTACCGTGGATTCAACATCTCATGTGTTGGTATCATTGTCTACCG TGGTCTGTACTTTGGACTCTATGACTCTGTGAAGCCTGTTCTCCTCACTGGTGACTTACAGGTAT GTCTTGTTGTCTTTCATTTATATCTGTAAGGTGACAGCTTAA B. C


21 D. E

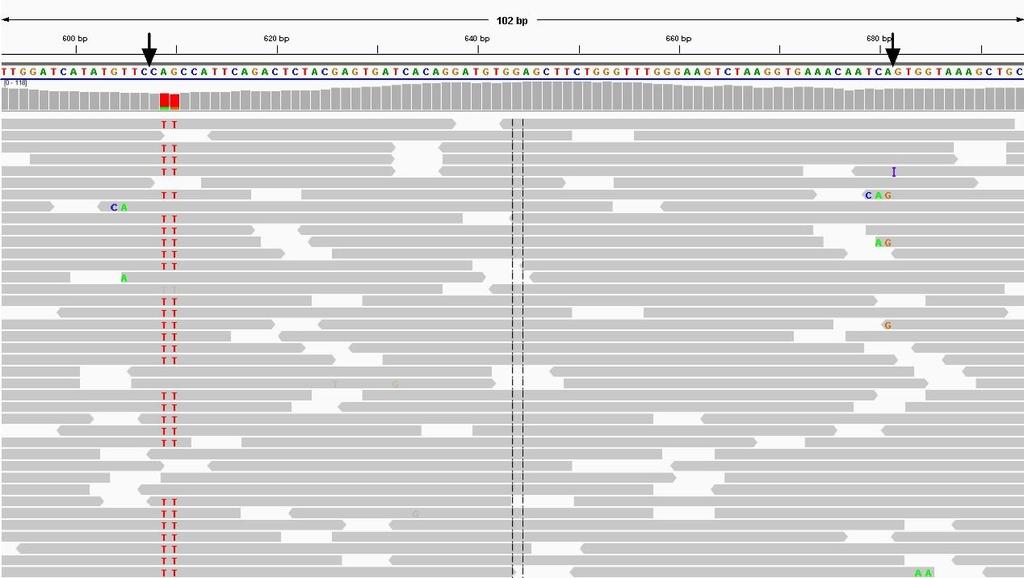
22 F. Figure S2. Schematic representation of the retrocnv RC_AT3G Panel A shows the architecture of the whole retroposed locus with the retrocnv underlined, the exon-exon junction of the parental gene in bold ( GA ), 5 and 3' flanking LTR retrotransposon sequences in purple and the preexisting sequence in the insertion site in yellow, respectively. All other nucleotides (e.g., 3 flanking ATT ) possibly represent secondary mutations or mutations generated during the template switch from the LTR retrotransposon to the mrna. Panel B shows the alignment of the 5 end of the LTR (labeled FIVE ) and the 3 flanking sequence in panel A (labeled THREE ). Such a decent alignment (Identity = 53.8%) indicates that the 3 flanking sequence is also derived from the same retrotransposon. Panel C shows a Genome Browser view (epigenomics.mcdb.ucla.edu) in which the retrocnv was aligned to the parental gene via BLAT 7. The green boxes mark the exons of the parental gene, whereas the thin arrowed lines mark the introns. The retrocnv was represented as black boxes, with the first short line indicating a possible secondary deletion and the second long line indicating the lost intron. Interestingly, a small intron encoded by the parental gene is inherited by the retrocnv. Panels D, E and F show the snapshots in the IGV genome browser 22,23 zooming onto the 5 breaking point, a partial region of
23 retrocnv encoding one exon-exon junction and the 3 breaking point, separately. For each panel, only one 100 bp window is shown to enable a base-level view. The browser consists of the following four tracks: the axis, the consensus nucleotide with A, T, G and C color-coded, the depth curve and the reads aligned to the focal regions with single nucleotide polymorphism shown. The two black dashed lines mark the center of each view. In order to generate such a view, we prepared a customized SAM file by running BWA 24 and aligning reads onto the assembled contig in the accession No-0, in which the contig was originally assembled. Since hundreds of reads could be aligned to the contig, the snapshot only shows a portion of them. Consistent with Panel A, the nucleotide track is decorated with the LTR retrotransposon marked in a purple box, the retrocnv underlined by the blue line and the exon-exon junction highlighted by a downward arrow. As shown in Panel E, numerous reads span the junction directly suggesting an intron-loss event
24 A. AAAGGTAATTAAATTAAGCGAAAATATATTATCTATTTAAAAATGTATCCAAACAATTATCATAA ATCTCAAAAATTTATATGATAACATTCCTAAATTTTCAAAGGTGTCTATCAATCTATAAAACCAT GATTACTTTCTGAAACCTTCCAGAAATTTACTAAAAACATGTTGTTCCTAGATACTTTTGAGTTT TGACACAATGAGGACCATTCCTATATCTTTTGTAAGATACTCTAGTAGTCTAGTCCTACTGTCTC GATCTTCTATTAAATCTTTAAGTATAGAAGATCCAAGTAAACTTACATATAGTTAATAGAAGATC CAAGTAAGATCAAAGCCAATAATATTAAATTTATATAAAAAAAAATTGTAAACACTGTTTTTTTT TTCAATTGATGAAAGGAAAAAAGCATTCAGGAATTGTTTTTATTTTTATTTTTTTGTTAACATTC ATTTATTTAAATTGCATAAGAAAAGAAAAAAGTGATAACCATTGCCAGAAACAAAGGTATAGAGA ATGTGGTAACCATTGATCTGCATGGTCAGCATGTTAAACCAGCAATGAAGCTACTGAAGCTACAT CTGTTATTTGGATCATATGTTCCAGCCATTCAGACTCTACGAGTGATCACAGGATGTGGAGCTTC TGGGTTTGGGAAGTCTAAGGTGAAACAATCAGTGGTAAAGCTGCTAGAAAGAGAAGGAGTTAGGT ATTGTGAAGAGAACAGAGGGACACTGCTGATCAAGCTTGACGGAGGTAGTAGAGAGTTCAGTTTC TTAGACACAGAGAGTGACTCTGATGAATAAGTGATAACTAAAACTAAAGTCAGGTTTTAGCTTTA GATCTTAAAATTTATGTCGATTTTGCCTATATCTGATGCTAGCTCTCTGTTGTTAAGTAAATGTT GAGCAAAAAAAAAAAAAAGTTAACAAGCCTTAGACAAAAAATTAAGAGCCCAATAACGAAAGTTG AACTGTAAAGAAACGAAATATAACTAGTTGTAGAATTGTATATATAGGATAGCTAGTAAAAAAGA GTGGTTGTTCTGTAACTACAATCATTTATTTTTTTGTTGACATTCGTAATCATTGTAACATACGA AATGGAATTTGAAAATAGTGACAGTAGCATACATGTTCTAAAGAACATTGGTAAAGTAAAAAAGA GTGACTGAGTGTTCAGTAATTGGAACAGTAGCACACATGTTCTAGATATTTAATGTTATTTATAA ACTTCACGATACAATAAAATTTAACATAATATATTTATAAACTTATATCGATACAATATAGTTAA CACAAAATATTTATAAAATTATTGATATATATTTTGTTATCTTGTTAACACAATAAGTATCAGTT AATTTATAATATATTATTACTTATATATTTGATAAACAATATCATTTGAATAAGATAAAAGATGT CGATAACAATTTTCTTATGTTGTTAAATAATTTATTATGAGCGAAAAAGTATTTTTGTCCAACTT ATAAAAATTGAAAATAATTATGCAAAAACTATAAATATATTTTTAGTTTTTATGTTTTTAGGTAT ATAAATTAATATAGTCCAT B. C

25 D. E

26 F. Figure S3. Schematic representation of the retrocnv RC_AT5G The figure convention follows Fig. S2 except that in Panels A, D and F, the candidate target site, the target site duplication and the polya tail are marked in orange, green and red, respectively. For Panels D, E and F, the short reads are from the accession Oy- 0 where the contig is originally assembled


27 A. B. Figure S4. Multiple sequence alignment at the insertion site of the retrocnv RC_AT5G (A) and RC_AT3G (B), respectively. The snapshot is made by Mega 25,26 and the alignment is done using MUSCLE 27. TSD is marked in a green frame. In A, the third sequence is the assembled retrocnv and its 3 flanking region. The last 16 sequences show the empty site in the accessions without RC_AT5G // denotes the skipped retrocnv sequence. The left side is poorly aligned compared to the right side suggesting the absence of 5 TSD. Panel B is similarly plotted as Panel A. Compared to Panel A (RC_AT5G ), the empty site of RC_AT3G clearly encodes 5 TSD, polya tail and 3 TSD. // denotes the 6 kb insertion across the reference genome and 16 accessions
28 A. TCCGTTATCTCCGCCGAACCATCCATCCTCCGCTACTTCATCTCCGCCGCTGAGATCGGAATCAC TATCCCACTCCATTTGATTTTGCATACACACCCACAAAATAAAGCTTAAGACTGCCCACGAATCT TCTTCCTCAGCGACAGGAGAAGAGACCCAGAAGAACACAGTTTGATTTTGAATCGCGGAATCTGA TATCTGTAGGTAATCGAAGTCTCCACAGGAAAAAGTTCAAAACTTTAGACAAACCCAGAAATCGT CTTCTTCAAGAACAGGAGACAGAAGAACAGATTTTGAAATGGAATCAAGCGAAGGAAAGAGGAAT CTGATATTTGTAGGTAATGGAAGTCTCCACCGCCCACTTCTAAGAGGAGGAGAAGAAGAAGAGAG ATGATTCGGTCGCTCGATGACTCGGCTCTTCTCAGTGCCTCTCCTTTTCCATCTTTAACCAGACC GGTTTCTTAATTTTACCTTACCGGTTTAGTTTATTTATCCGGTTTACACAAAATATCCTGTAAGT TCCTTGTGAGATTTTTTTGGTTTTACCAAATGAGTGTATTAGAATCAATTTTAATGATTTAGAAA CATTAGAAACATCGTGACTCAGCTCCGTCTCTCACTGTAATAATCAAGTCAGAGCCGACGAAGTT GACGTTTGCGCCGTCGGAGGAGAGTTTTTACTGTTGCTGTCCAGTTGACATTTTGAGACATGAAA TGATCTGGGGTTGATGTTTGTATGGTAACAGAGGAATTATAGTCATGAAGCTTATTTCACTTGTC AGAAACGTTCGTTCTCGCCAATGTCAACCGGAAGTTATCTGGTCTTTGCAAGTTCGTTTCTTGCA GCAAGATTCTGTCTCGAAAGCTAAACCCAAGAAATACAAACACCCGTCAGTTTATGATCCGTATG GTCCTAGACCCCAGCCTTCAAGCAAAATCATGGAGCTAGCTGAGCGTATAGCTGCATTATCTCCA GAAGAAAGAAAACAGATTGGTCCTGCTCTCAATGAACACCTGAGGCTTCCAAAACAACAGATGAT TTCATCGGACGGCATTGGAGCAAACAAGATACGGAGCTGGGAATGTAGAGGAGAAGAAGGAGAAG ACGGCTTTCGATGTGAAGTTGGAGAAGTTTAATGCATCTGATAAGATCAAAGTGATAAAAGAAGT TAGAACGTTCACAAGTTTGGGTCTGAAGGAAGCGAAAGAGCTTGTGGAGAAAGGATAATAGTCTT TTTCTACTTTCGATCTCAAAAACTACTAAAAAGTGAAGCCTTGTAAATCTTCTTTAAAGAGTAGA AACATGTATTATTATCTTTTAGTTATTCATCTTCAAAGTTTTGATTAATTTAAAGTGAATGAAAT ATAAATTCAATACAAAAAAAGAAGAAACCCAAATCTACAAAAGAAAAAAAGAAAAATATATAATT GATTTAGGATTCTAAATTCTCACGTACTCGGAGAGCAAGCCGTTGAATAGACTGATCATCGAAGC AAGGATCAAAGGTCTTAATCTTGGACACAAAATCCATAGCTTCACTATACTTCCCTGCTCTGCAA TAACCATCTACTACCATTTTAAAAGTCAGCTCATTTGGTCTGCAATCATTCTTCGCCATGCACTC AATCACATCTTCTATCTCTGCAAACATTCCCATCGCCGTGTAACCCGAAACAAACGTGTTGTAAG TGAAAATGCACGGTCTGATTCCCCGCTCTGTCATCTCAGACAGCATCCTAACCGCTTCTTGCATC AACCCTCTTCTGCAGAAACCTTTGATCACTGTGTTGTAAGAGACCAGGTCCGGTTTTAACTGCGA TTTTTCTAGAGTCTTGAGGATTTCTTCGGCTTTCCAACACTCTCCTCTTCTTACGTACATGTCCA TCAGGCTGTTGTAGGTTACAAGATCCGGGCTTAGCCCATCCTCGCGGATAGACTCGAGAATCCCC TCTGCTTGATCGTACATGTTGTTCCTCGTGAAAATGGAGAGCATTGAGTTGAAAATCACCATGTC GGGTTTGTATCCGTGCTTTTTAAACAATGTGAATGCTCTCTCTGATCCTGCTAGTGCTCGGCATT TAAAGTTTGCGAGGAGTAATGTTCTCAAAAGCATCCAGCTCGGGAATATTTGGCCCTCCTTTATC CCATTCTCGATTCTCTCTATCCCTAGATAGTTCCCTCCTTTAGCATAACACTGAAGCATCAAGGA ATAAGATGTTTCAGTAGGTTTGAAACCTTTACTTTTCATGTCGGAAATCACATTTTCGCCTGATC TCCAATCTCCTTTTCTTGCCAAGGCATTAAGTAACGCGTTGTAAGTCGTAACGCAAGCGTTGAAC CCTGCTCTTGTCATCTCACCATACATTTTCGATGCATCAACCTCTGAACCACATCGCCCATAGGC ACTGATCAGCGTGTTGAATGTGTCCCTATCAGGTTCAAATCCGCAGCTCTTCATTTCACGGAACA CCCGGTTCACAAACTTATCCATACCCTTATTCCCACACAGAGCAAGCATTGTGTTCCAAGTGGCA CGATTAGGGG

29 B. C. D. E


30 F. Figure S5. Schematic representation of the retrocnv RC_AT3G The figure convention follows Fig. S3. The short reads in Panels D, E and F are from the accession Can

31 Figure S6. Genome Browser view ( of the alignment of Arabidopsis thaliana and Arabidopsis lyrata in a 13 kb region around the insertion site of RC_AT3G The following tracks are shown including gene annotation, various repeats and user-supplied sequences aligned to this region. Sequences tagged by A_lyrata refer to the orthologous genome sequence of Arabidopsis lyrata identified via BLAT 7 search using the sequence flanking the insertion site of the retrocnv at the reference genome, while 6K is the insertion between two TSDs of RC_AT3G in the reference genome. Clearly, this insertion is absent in the Arabidopsis lyrata genome

32 A. TTAACAACAACAAAAAAGGTTGTTGCATGGAAGATTTTTCACCGTTGTTTGTCTTGAAGTGAAAT TTTAATGTCTGGCTCCACTTTTTTGTGTCAATTTTCTTCTAAGAATAAAACAAAAAGGAAAAGGA GAAGCAATTGCATTGAAGTGGTGAACAAAATTAATTTCTCAACATCAAAGTTGATGACTTCATAC ATATAATTTCACACCTAAGAGACTAATTTGACACTGTTAGCAAAAATAAAAATCAAACCTTCATC ATGGGTCAACTCTTAATTAAAAATCTATCTAGATATTTATATGTAGTGTTGTTGTTTTAAGAACT AAAACTAAATATCAAGAAAAGAAATAAGTTTGAAACGGAGCCGAGAAAAAAACAGGGTTTACAGT TTGATATAACACCGTATCGATGGGGTGTGAAGTATAATGTTTTGATAATTACCAATCATAAAAGC ATTATTAAAATCGATATTTTCGGCTTTAATTTGTGTCTTGGGGCCAGGAACTTTGCAAATTAATG AGCTATTCTAAGAGTTTGAGACCTTACCACCACTACTTTGTAACGTTTTTAACTATTTTTTATCG TTTGCCGCTAAACAGTTTATATCGTTTTTGTGTTATCCGTCAGACCCTAAAAACTAAAATGGAAA AATACAAGTTAACTTGTACATTACGTATGAGGAAGAGACATTATAATTTGAGCAAAAAATATGAC AGTTTTAGGGGCACGATGCTAGAGGAAAGAGATTCAAGTAAAGGTATGTCAATTTAGGTTTAAAA TGAGATTTGGTATAATAATTTTCTTAATTGTTTTGACACTACAAGAAATATCCACATTCTTAGCA AGTTAGAAGCGCTGTATTTGTTTATCCACATTATTTATAATAGTTTGATTTGCTATAATAATTTT CTTAATAATTTGAAAAAAAATTGTTATCACATAGAAACTGTAATCACTATAAATAAAAATCATGA TCCTTTTTATCCTATCATTTAGTTATAGAAATTAAAGTTCTTAGATTCTTAAAAAAGCATAGTAT TAGAATAA B. C
33 D. Figure S7. Schematic representation of the retrocnv RC_AT5G The conventions of Panels A, B and C follow Fig. S3. Panel D follows Fig. 1. The short reads in C are from the accession No
34 A. ATAATTTTGCTTAAACATATTTTTTGTTTTGCTTATTTGATGGACATAAATGTACAACATCCTAT TGGATTTGAATCTCATGGAGATATTGCAACCCTCTTCTCATGGTGCTGGGATTTAGCGGGACTGA AAGGAATATCTTTTTACGTACGTTTAAGAGGTATGGAACTGGAAACTTTGATTGGAAGGAGTTTG TTAATCCCTTATACATGAAGACCTATGACGAGATAAATAAGTATGGAATATTACTTTTGAAACAC ATTGCCGAAAACCCTAACGATAATCCTAAAACTTTTAAAGATGGAGTTCCCAAAGAAGGGATAAG AAGTGACGAGCTACTAGTGAGCATGACTTTTATGATGCTAGTAAAGGAGAAGTGTCAATTTTTGG ACAACAATCCGACCAAACCTGTTTTCTCTGACTACTTTATCAGAAAGTACAATTTGAGAAGTGAA GCATTTTCTAAGGAAGAACATGATAGGATGCTGATTCTTGCTGTTTCCAAGCATGGCTATGGGAG ATGGGTGGCCATCGTTGAAGACGAAGAGTACAAAGGGCCTTGGCTATCACATCAGATTAGAGGTG CTCGGGTACGAAGATCCTTAACAAGAAAACCAAACGGATCAAATTCAACAGAGCAGAGATTATTA GTGGTAAATTGACGAACAAAAATTAGATTTTTTAGAATTTGAGGACAAATAAGAACATTATTGAG GTGAAGGGGACGAGAACTAGATGGAATTGTTGTTTGACCATAAGAAGTGACAGGAATTGTGGAAC CGTTACCGACAGTGACGAGAGGAAGAGAAGAATTAGAGGATGAGGTGATGGAAGAGAGTGTACCT GGCTGAGCCATGAGGTGAGCTGTAGCTGCGGAGTCCATGTACCATCCAACATCATTAGGATCCGA GAAAGTCATCGTGTTGAATGCATTTGCGAGCGTAGTGGGAATTATGTCTGTGTTTGCTGGAGAGG TGATTGGTTGGGCCGAGGTGAGGAAGGCAGACCCGTTTGATGGAGGTGCGTGACCGAGAATCCCT TGTGCGCGTTGTGGCAGCGTTGGTGGTTGAGAGCCAATGTGAAATCTTGGTTGCCCATAGAATTG TGGAGGAGGTGGTGTAGTGGGCCAAATTGGCATATTGGGCCATTGTGGATAACTTGGCCATTGAG GTTGGTTGGGCCAAGTTGATGTTTGATTTCCAGAGCTCCAATTACCGCCGTTGTAGTTAGGGTTG CCGCCACCACCACGACCTCTGTTTCCTCGACCTCCTCCGCGATTGTTTCGATTGTTTCGTCCTCC GCCACGACCGTACTGGAATTGTTGGTTTGTGAGGACTGAGCGATAGTCTTGTTGTTGAGAAGAGG CAAGAAGAACATGTGGTGAAGAAGCGTTGTCATCATTGTTAGGAAGAGATTGCAGCTTGGTTTTA AGCCTCGATTCTTCTTCAATGAGCATCGATCTGGCATCGCCAAAAGAGCAAGGTGGGGAACGATG TTTAATAACATTAATGATGTTATCAAATTTGGAGCTAAGTCCATTGAGAAGGTGCATCACTAAGG CGCGATCTGAGACAGGGGAATCCACATTGGCGAGCGTATCAGAGAGTGACTTCAGTTTTTGACAA TAGTCATGAACGGATTGATCGCCAATCCAGAGATTTCGGAGTTCATTTTTCAGTTGTATTGCACG GGCTTCTTTGTTGTCGAGGAATAAATTCTCGAGCATGAGCCAAAGTTCGCGTGCAGAGCACTGCG ATTTTAAGACAGAGTTGAGGAGCGATTCTGAAATGGTACCGTAGATCCACATCTTAACCGTATTG TCAAGTTGCTTCCATGTTGCGTCGGTTGGTCCGATGGGAAGGGAGGTGCCATCGATATGCCCGGT GAGAGAGAAACTAAGGCAATGAGTTTCGAAGAGGATGCGCCATGAATCGTAGTTCATCTTCTCCA TGTTGAGAGTGATGGGGATGTGAGCACGGATCTGAGTGAGACTCGCAGCAGGAGTAGTAGCGGTT GGTGGAGGAACTGTCGCCATGAATTAAGTGCAGATCAAGAGAGACAAAGAAAAAAAAATTGGAGA GAAGAGCTAGAGATACAGAGAGAAAAGTGAAGCGAAGAGCAAAAGAGAGAGAGAGAACACGAAGA AGAAGACTGAAAAGATGAGGAAAAGATGACTGCTAGAGTTTAGAGAAGAGTCTCTGATACCATAT TAGAATAGGTATAATCTCAATTGATGAGTTCCTTGACATATTCACAAAGGGTTTAAATACATAGC AATATACAAAGTAGCCGTTAGAGGCTTAATGAGAAGATTCCTAAAATACAGAAAGGAATATATGC ATTCCTATTCTAATAATACTTTTCCAAGAGGTTGCCTGCAAAGACCTGAATATCCATTTCCCTTC TGATACTGAGTCTGCTCATAAAAGAATTCGTGATCATGTGGAAAAACGGGTTAAGAAGATGGAAG ATGCGATAAAGTATGAGTACGCAGAAAAGATACGTGCTGAACAAGTATAAGCTGAAACAAAGGGA ACGAGCTTTGTTGATGCAGACAAAGAAATGCTTGATAGACTGCCTAAGAATGATCCCATCACTTC AGAAGAAATTTCTGAAGCTGCTGTTGACAACAAGCAAAGTAGAGTTATTATAGACATATTTAGAT ATTCAACCATACGATCAGAGTGTTAATAAGAAGTCATTATAGACATATTTAGATATTCAACCGCT
35 GATTCGAATGCCGAGGAAGAACTTTAGGCCTCTGAAACCTATCAGTAAGGAAATAAACACTAGGC TAAGCGCCGCAACAGATCATGATGTGGAGATAGATGTAGCGGATAACATCATTGTGTTGAATTGA CATCAAAATCATTATTACTTCTTTCATTACAGTTTTATCTTTGGCTGATTTTATTTACTAAGATA CCTTTCGCTGAATACTTTTTTTTGTCAAAATTATAATAACTAAGTTACCTTTTACTAAAAAAAAG GAAAAAAAAAAAACGATATTGCAGCCCTCGTGCCGTCTTATGTACTGTAGCCGTACGTTTTTGTC AAGTTCGATTCCTTACACTTAACAGAATC B. Figure S8. Schematic representation of the retrocopy R_AT4G ( R is short for recently evolved retrocopy) encoded by the Arabidopsis reference genome. The figure convention follows Fig. S3 except that 1) in panel A, an insertion is marked in dark blue which can be aligned to LTR element Copia-82_ALY-I on Repbase 9,10 with the BLAST E of 5x10-49 ; and 2) in panel B, the retrocopy was encoded by the reference genome itself, and it was further aligned to the parental gene, i.e., AT4G
36 CAGACGCGGACGGGGACTACGAGTCTGTATCCAGGAAGCGTGCGAAGAAGACGACGAGTGCTAGT ACAGATCTTAAGTTGGTTTCTATAGACTACTTGCGGATTTCAAATCTTTTAAAATATATTTTCCT TATTTTAGTATTGCTTTTAATCCTTGTTGTACTTATGTCTATGCGACTTTTTCTTGCTTGAAAGC ATGCGGTCTTTGTTTTATGCATCAAATTCGCCTGTCCCCCATTAGCATTTTTTTCTCCAAAAAGG ACCAGCACTTATGAAACATATGTAGGTTTTTGGAGAAGACTTCAAGAAGTGGTTTGTGTTCAATC AAATCAAATATTTCCAATTCTAGAAGTCTTAAGAGTTTACTTTTCATAAAAGGAAGAAACATGAA GACGAACAAAAATTTCCTATTCCAAATAGCCTCAACCTATTAAGTTTAAAATAGGTGCTAAGGCT AGAGAAAAATTTAGTTTGAGTGAAACTTGTAAGTGCACTAGGGTTCCCTACTTCGTCCAGCGAGA AAGGAAGAGGGGTTTCGTCTGATTCCGCTAAATCTCTATCTTTATTTAAAGATGATGGATTCCGA TGATGATATGCTCGATGCCCACGATATGGACTCGGTAGATTATGATTTTGACAGCGGCGGCACCG ATGATGACAACGATATTGATGAAACTGATTACGTGTTTGGTGAGGCTGACACGGACGATGCCGCC ATCATCGCCTACCATCGCTCTCAGATAAATTATGTTGTTCTCAAGGAAGAAGATATTCGCAGGCA TCAGAAGGATGACGTTGGGCGAGTTTCCGTTGTCCTCTCCATAACCGATGTCCAAGCAAGTCTTT TGCTTCTTCACTATCACTGGAGTGTCAGTAAAGTTAATGATGAATGGTTTGCGGATGAGGACAGA GTTCGTAGAACTGTTGGCATATTAGAGGGACCTGCACCTGATGGCAGAGAGTTTACATGTGGAAT ATGCTTTGAATCCTACCCTCTTGAGGAAACTATATCGGTTTCTTGTGGTCACCCATTCTGCGCTA CATGTTGGACGGGTTATATAAGCACAAGCATCAATGATGGCCCAGGATGTTTGATGCTAAAATGT CCCTACCCTTGTTGTCCTGCGGCCATTGGTCGAGATATGATCGATAACTTGTGTTCCAAGGAAGA CAAGTAGAGGTATTATAGATATTTTCTTAGGTCTTATGTTGAAGTCAACAGAGAGATGAAGTGCT GTCCTGCCCCAGGATGTGAGCATGCAATTAGTTTTGCTGCTGGGACCGAAAGTAATTATGATGTT TCGTGCTTGTGTTCGCATAGCTTTTGCTGGAATTGCAGTGAAGAGGCTCACCGTCCTGTGGATTG TGACACAGTTGGAAAATGGATACTAAAGAACAGCACTGAATCTGAAAATATGAATTGGATACTTG CCAATTCGAAGCCTTGTCCAAAGTGTAAGAGGCCAATAGAAAAGAATCATGGATGTATGCACATG ACATGCACACCACCTTGTAAGTTTGAGTTTTGTTGGCTCTGCCTTAACGCATGGACAGAACACGG GGAAAGTAGTGGTGGGTATTATGCCTGCAACCGGTATGAGGCGGCTAAGAAACAAGGGTTGTATG ATGAGGCTGAAAGGAGGCGAGAGATGGCAAAAAACTCGCTAGAGAAATACACTCATTACTATAAA CGATGGGCAAGCAATCAAGTGTCGAGGCAAAAAGCTATGGGGGATCTGCAGAAAATGCAATCAGA GAAGCTTAGGAAGCTTAGTGACATACAGTGCACATCAGAATCTCAGCTCAAGTTTATCGCAGAGG CTTGGCTCCAGATCATTGAATGCAGACGGGTACTCAAATGGACATATGCATATGGATACTATGTA CCAGATGATCATACTAAGAAACAATTTTTTGAGTATTTGCAAGGGGAGGCTGAGTCAGGTTTGGA GAGGCTCCACGAATGCATAGAGAATGATATTGAGGTGTTTGAATTTGGTGAGGGCCCTTCAGAGG AATTCAATCATTTCCGGACAAAATTAACTGATTTAACCAGCATAACAAAAACCTTCTTCCAAAAT CTGGTCAAAGCTCTGGAGAATGGTCTTGCTGACGTGGATTCACATGCTGCTAGCAGCAAACCAGC AAACTGTAAACCTTCTAGCAATACAAAAGACGGTGGGAAAGGTAAAAAGGAAGCTCTAACGATGG CGGGTTCAGCAGAAACCTAGATGGCAATTGAGATCAGCAAATTGGAGAAAGGTTTGGAGTTTAGA ATACTTTTGAGTACACTCCTGAGAGTTTGAAGGCTATTAAAGTATACTCCTGTGAAGTTTCTTAT CTGAAAAAAAAGAATACTAATTATGTTTACAACAATTTCTTTTATTTCTTTCAAAATTTTTGCAT TGTAACACTTTATTTTACAGTCAAAGTTTTATGAAGTTCTATGATCTTTCTCAATGTAGACAAAG CAATGACAGCTTCTGAGAAATAACATTGCCGTAATATATAATGCAAACGTTTATTGTAATAGTAA AGCTCATAAGCAGAGGCAAAACAATCTGTGATCATTTTAACATATCCCACTACTAATTTCAGTAG GTAAATAGTTCAGAGTAAAGTGTCTTTAAAAGGATTCTTAACGTGTCTCTCAAGCAGCCAAACTC TTGGAGGCAATCTCAAAGACATTCTCAGACAGCCCATTAGCAGACATTATCATTTCCAATTGTGC CTGCAAACACAACACACAAACACAACAGCTTAATCTAATGATTACGAATCATGGCTACAGATTCC GATCTGCGGAAATATTGAACACAGAGGCTCAATGAAGCAAAAGAACCAGGA
37 Figure S9. Schematic representation of the retrocopy R_AT1G encoded by the Arabidopsis reference genome. The figure convention follows Fig. S3A
38 TTCAAAGGTGATGGGTTTTCAGAGGAAACGTCATCTTCATCATCCGAAGAAGAGTTTCGTGCGAT TTCTTTACCTTCTTCGTCGCTTGAAGAAGCACTCGGCGGATCTTCTAACGGATTGAAACGTCTCG ACATTGTTTTAGGGTTTATGGGACTTTGGAGAGACTTAAGAGGTTGAAATTGAGATTTTTGCTTT GCTGCCTTCACCACTTCGTTCTTAGGGTTTATATATATTGAACAAAGTGTCTCTCTGTTTTCCAA AAATAAATAATCAAAAAATTATTGGAAAACGTATAAAATTATTTATTGTTTTTCCTCTTTTTTTG CATGACGTTTAGATTTCCGATTTCCTTCCTTAAAAATTTGGAAATTAGCTATATTGACCAATTTT ATTTCCCTATATTTTATCTCTTACAAATAAATGTTAGATCTCTCTTTTCACAACAACACCCGAAT ATGACCGCTCATTCAATCGTCGCACACGTTGATAGCGTCCTTCCCAAGAAATCTCGTGAGATCGA CCGTCGCCGCCGCAGACGGAAGCGGAAGAAGAAGAACAAAGCATCTCAGGCCGATGTAGATGCAA TGGACGTGTCAAAATCTCTGTCAAGCACTCCTACTGGTATTGAGACACCGGATGCAATTGAACTT CGTAAGGAACAGAGAAAGGAACCTGATAGGGCTCTATACCAGGTACTTGAAGAAAAGGGAGAGAG TGTTGTTGCTCCTGGAACATTGCTGAGAACTACACACACATACGTTATTAAGACTGGTACTCAGG ACAAGACGGGAACCAAAAGGGTTGATTTGCTGAGAGGGCAAAAGACAGATAGAGTGGATTTCAGT TTACAGCCAGAAGAGCTGGATGCTATGGGAAATGTTTTACAGTATGAGGAGGCAAGAGAAGAGGA GAAATAGCGCAATAAGCCAGTGGACTTGAGTGACATGGTCGTCGAGCATGTGTAGCAGAATAGTA GGAAGAGGAAAATGCATGGCAAGGAAGAGAAGAAAAAGAAAGATTTCAACTTCTGAGGTGCGTTA TGGAAGAGACAAAAAAAAAAAGATTTTAGATTCTGGACATGAGACATAGAAAGAGATTCATGTTC CAGAATTATTAGTCTTGAGTAAGAGATCTTGAGTTTTTAGTCTTAATGCTTATTAAAAAAAAAAA AAAATGTTAGACCACCAATGATGTAAATTTTTAAATAGGTGATTGCATCATTGTGTAAACCTAAT ATTTACATTTTGAAGGATTTGGTCTTTCTGCAGTATGTAAGTTAATTCAATCCCCTTATTATTCT GACTTGTAAGGGGATTCAAACCCCATCAATGGTTTCTAAACTTAAGTTTCTTATTTTAGAGAGAT AAGTTTTATTATAAAAAAATGTGTGGGTTTTTTGATTAATGAAGAAACCATCTCCAAAATACTTT ATATAAGAAATTTTGGAGAGAATTTCTAAATATTTAAGAAACCCACATAATTAAATAATATTATT TTTGTTGTTTTAATGTTAAGAAACTTATATTTAGAAACCACCAATGAAATTCCTCTAAACATTAA CATTGCATATAGTCATAAAAAAAATATCTATTTTCTTTTTGGTTCTCTTTTTAATATAGCTTTCT TGGTCAACACTTATTCTTAAATATCTTAGAAATT Figure S10. Schematic representation of the retrocopy R_ AT4G encoded by the Arabidopsis reference genome. The figure convention follows Fig. S3A
39 ATAATCAATGTTTTAAATTaAAACACTTATCTATCAATTTAATAtTATCAAAATTAAATTTATTT TAAAAACTATCTCAAAATATCTATTTTGTTATTTATATATGTTTTAAAATTAAAATAATTATTTA TTAAATTTAAATTAATTTAAATAATAAAATTAGTATTCACTTTAAATTTTCAATATAATATTTAT TATCTTATAACATAATAAATGTTTTATAGTTAACGATATATGCATTCAATTAATTTTTAAAAAAT ATTAAAATATTCTTTTTGTTTTTAAGACTCAAAAGAGTCCCAATTAGGGTTTCTATTTTGCAGAA CAGAAACAATGGTTTGCGAGAAGTGCGAGAAGAAGTTATCGAAGGTGATAGTAGCAGATAAGCAA TACCACCGAAGGCGGTGGTCGTAAGATGAACGAGAACAAACTCCTCTCTAAGAAGAAAAGATGGA CTCCTTATGGAAATACAAAGTGCATGATTGCAAGCAGCAAGTACACCAAGATGTCAAGTACTGCC ACACCTGTGCTTATACCAAAGGGGTTTGTGCAATGTGTGGTAAGCAAGTACTTGATACAAAGCTT TGCAAGCAAAGCAATGTATAATTCAAAGCAGATGCTATTTGGCATGTTGAAGTAGACCTAATGGT TTAGGGACTCTCGACTGTTTCAAGCTCAGTTGATCACTATCATTAACTTGCAGTATTGAAACTGG GGTTGTAAAGTTCACCAACTGTTATGTAATGTAGTGGCATGCTTTGTAAGTTTAATTCTTCCTGG GTAATGAAATATGATGGTAATAACTTCTCTGCATTCTCTCTTTTAACAAAAAAAAAAAAAAAATT AAAATATTATCATTTAAAATTAAGTTGATTGTTAAAATTATAATCTATCACTATAATAATTTTTT ATAATTTTGAGTTAGTTTTTTATTATTTTTCAGAATTTATCAATATTTAAATGTGTTATTTTGAT AATTTTATATCAAAATTTTGATTTTTAATATATACATATATATATCTCATAATTTACATACTATT TAATTAATTTAAATAAATTGAAATAATAAAAATTATTATAACACGC Figure S11. Schematic representation of the retrocopy R_cassava4.1_019865m encoded by the M. esculenta reference genome. The figure convention follows Fig. S3A

40 Figure S12. RetroCNV genotyping across Arabidopsis accessions
41 References in the Supplementary Information 1. Schrider, D. R., Stevens, K., Cardeno, C. M., Langley, C. H., & Hahn, M. W. Genome-wide analysis of retrogene polymorphisms in Drosophila melanogaster. Genome Res 21, (2011). 2. Schrider, D. R. et al. Gene copy-number polymorphism caused by retrotransposition in humans. PLoS Genet 9, e (2013). 3. Gan, X. et al. Multiple reference genomes and transcriptomes for Arabidopsis thaliana. Nature 477, (2011). 4. Huala, E. et al. The Arabidopsis Information Resource (TAIR): a comprehensive database and web-based information retrieval, analysis, and visualization system for a model plant. Nucleic Acids Res 29, (2001). 5. Poole, R. L. The TAIR database. Methods Mol Biol 406, (2007). 6. Chevreux, B. et al. Using the miraest assembler for reliable and automated mrna transcript assembly and SNP detection in sequenced ESTs. Genome Res 14, (2004). 7. Kent, W. J. BLAT--the BLAST-like alignment tool. Genome Res 12, (2002). 8. Ruby, J. G., Bellare, P., & Derisi, J. L. PRICE: software for the targeted assembly of components of (Meta) genomic sequence data. G3 (Bethesda) 3, (2013). 9. Jurka, J. Repbase update: a database and an electronic journal of repetitive elements. Trends Genet 16, (2000). 10. Jurka, J. et al. Repbase Update, a database of eukaryotic repetitive elements. Cytogenet Genome Res 110, (2005). 11. Ouyang, S. & Buell, C. R. The TIGR Plant Repeat Databases: a collective resource for the identification of repetitive sequences in plants. Nucleic Acids Res 32, D (2004). 12. Prochnik, S. et al. The Cassava Genome: Current Progress, Future Directions. Trop Plant Biol 5, (2012). 13. Rho, M., Choi, J. H., Kim, S., Lynch, M., & Tang, H. De novo identification of LTR retrotransposons in eukaryotic genomes. BMC Genomics 8, 90 (2007). 14. Rho, M. & Tang, H. MGEScan-non-LTR: computational identification and classification of autonomous non-ltr retrotransposons in eukaryotic genomes. Nucleic Acids Res 37, e143 (2009). 15. Li, W. & Godzik, A. Cd-hit: a fast program for clustering and comparing large sets of protein or nucleotide sequences. Bioinformatics 22, (2006). 16. Ma, J., Devos, K. M., & Bennetzen, J. L. Analyses of LTR-retrotransposon structures reveal recent and rapid genomic DNA loss in rice. Genome Res 14, (2004). 17. Abdelsamad, A. & Pecinka, A. Pollen-specific activation of Arabidopsis retrogenes is associated with global transcriptional reprogramming. Plant Cell 26, (2014). 18. Zhu, Z., Zhang, Y., & Long, M. Extensive structural renovation of retrogenes in the evolution of the Populus genome. Plant Physiol 151, (2009). 19. Zhang, Y., Wu, Y., Liu, Y., & Han, B. Computational identification of 69 retroposons in Arabidopsis. Plant Physiol 138, (2005). 20. Yang, Z. PAML: a program package for phylogenetic analysis by maximum likelihood. Comput Appl Biosci 13, (1997)
42 21. Betran, E., Thornton, K., & Long, M. Retroposed new genes out of the X in Drosophila. Genome Res 12, (2002). 22. Robinson, J. T. et al. Integrative genomics viewer. Nat Biotechnol 29, Thorvaldsdottir, H., Robinson, J. T., & Mesirov, J. P. Integrative Genomics Viewer (IGV): highperformance genomics data visualization and exploration. Brief Bioinform 14, Li, H. & Durbin, R. Fast and accurate short read alignment with Burrows-Wheeler transform. Bioinformatics 25, (2009). 25. Tamura, K. et al. MEGA5: molecular evolutionary genetics analysis using maximum likelihood, evolutionary distance, and maximum parsimony methods. Mol Biol Evol 28, Kumar, S., Tamura, K., & Nei, M. MEGA: Molecular Evolutionary Genetics Analysis software for microcomputers. Comput Appl Biosci 10, (1994). 27. Edgar, R. C. MUSCLE: multiple sequence alignment with high accuracy and high throughput. Nucleic Acids Res 32, (2004)
SUPPLEMENTARY INFORMATION
 Supplementary information S1 (box). Supplementary Methods description. Prokaryotic Genome Database Archaeal and bacterial genome sequences were downloaded from the NCBI FTP site (ftp://ftp.ncbi.nlm.nih.gov/genomes/all/)
Mathangi Thiagarajan Rice Genome Annotation Workshop May 23rd, 2007
 -2 Transcript Alignment Assembly and Automated Gene Structure Improvements Using PASA-2 Mathangi Thiagarajan mathangi@jcvi.org Rice Genome Annotation Workshop May 23rd, 2007 About PASA PASA is an open
Annotation of Plant Genomes using RNA-seq. Matteo Pellegrini (UCLA) In collaboration with Sabeeha Merchant (UCLA)
 In collaboration with Sabeeha Merchant (UCLA)") Annotation of Plant Genomes using RNA-seq Matteo Pellegrini (UCLA) In collaboration with Sabeeha Merchant (UCLA) inuscu1-35bp 5 _ 0 _ 5 _ What is Annotation inuscu2-75bp luscu1-75bp 0 _ 5 _ Reconstruction
Annotation of Plant Genomes using RNA-seq Matteo Pellegrini (UCLA) In collaboration with Sabeeha Merchant (UCLA) inuscu1-35bp 5 _ 0 _ 5 _ What is Annotation inuscu2-75bp luscu1-75bp 0 _ 5 _ Reconstruction
Unfixed endogenous retroviral insertions in the human population. Emanuele Marchi, Alex Kanapin, Gkikas Magiorkinis and Robert Belshaw
 Unfixed endogenous retroviral insertions in the human population Emanuele Marchi, Alex Kanapin, Gkikas Magiorkinis and Robert Belshaw Supplementary Methods Common sources of 'false positives' in mining
GEP Annotation Report
 GEP Annotation Report Note: For each gene described in this annotation report, you should also prepare the corresponding GFF, transcript and peptide sequence files as part of your submission. Student name:
Small RNA in rice genome
 Vol. 45 No. 5 SCIENCE IN CHINA (Series C) October 2002 Small RNA in rice genome WANG Kai ( 1, ZHU Xiaopeng ( 2, ZHONG Lan ( 1,3 & CHEN Runsheng ( 1,2 1. Beijing Genomics Institute/Center of Genomics and
BIOINFORMATICS. PILER: identification and classification of genomic repeats. Robert C. Edgar 1* and Eugene W. Myers 2 1 INTRODUCTION
 BIOINFORMATICS Vol. 1 no. 1 2003 Pages 1 1 PILER: identification and classification of genomic repeats Robert C. Edgar 1* and Eugene W. Myers 2 1 195 Roque Moraes Drive, Mill Valley, CA, U.S.A., bob@drive5.com.
Supplementary Information for: The genome of the extremophile crucifer Thellungiella parvula
 Supplementary Information for: The genome of the extremophile crucifer Thellungiella parvula Maheshi Dassanayake 1,9, Dong-Ha Oh 1,9, Jeffrey S. Haas 1,2, Alvaro Hernandez 3, Hyewon Hong 1,4, Shahjahan
Bioinformatics tools for phylogeny and visualization. Yanbin Yin
 Bioinformatics tools for phylogeny and visualization Yanbin Yin 1 Homework assignment 5 1. Take the MAFFT alignment http://cys.bios.niu.edu/yyin/teach/pbb/purdue.cellwall.list.lignin.f a.aln as input and
Comparing whole genomes
 BioNumerics Tutorial: Comparing whole genomes 1 Aim The Chromosome Comparison window in BioNumerics has been designed for large-scale comparison of sequences of unlimited length. In this tutorial you will
Ensembl focuses on metazoan (animal) genomes. The genomes currently available at the Ensembl site are:
 genomes. The genomes currently available at the Ensembl site are:") Comparative genomics and proteomics Species available Ensembl focuses on metazoan (animal) genomes. The genomes currently available at the Ensembl site are: Vertebrates: human, chimpanzee, mouse, rat,
Comparative genomics and proteomics Species available Ensembl focuses on metazoan (animal) genomes. The genomes currently available at the Ensembl site are: Vertebrates: human, chimpanzee, mouse, rat,
DEGseq: an R package for identifying differentially expressed genes from RNA-seq data
 DEGseq: an R package for identifying differentially expressed genes from RNA-seq data Likun Wang Zhixing Feng i Wang iaowo Wang * and uegong Zhang * MOE Key Laboratory of Bioinformatics and Bioinformatics
SUPPLEMENTARY INFORMATION
 Supplementary information S3 (box) Methods Methods Genome weighting The currently available collection of archaeal and bacterial genomes has a highly biased distribution of isolates across taxa. For example,
RNA- seq read mapping
 RNA- seq read mapping Pär Engström SciLifeLab RNA- seq workshop October 216 IniDal steps in RNA- seq data processing 1. Quality checks on reads 2. Trim 3' adapters (opdonal (for species with a reference
Supplemental Data. Perea-Resa et al. Plant Cell. (2012) /tpc
 /tpc") Supplemental Data. Perea-Resa et al. Plant Cell. (22)..5/tpc.2.3697 Sm Sm2 Supplemental Figure. Sequence alignment of Arabidopsis LSM proteins. Alignment of the eleven Arabidopsis LSM proteins. Sm and
Supplemental Data. Perea-Resa et al. Plant Cell. (22)..5/tpc.2.3697 Sm Sm2 Supplemental Figure. Sequence alignment of Arabidopsis LSM proteins. Alignment of the eleven Arabidopsis LSM proteins. Sm and
TE content correlates positively with genome size
 TE content correlates positively with genome size Mb 3000 Genomic DNA 2500 2000 1500 1000 TE DNA Protein-coding DNA 500 0 Feschotte & Pritham 2006 Transposable elements. Variation in gene numbers cannot
Tiffany Samaroo MB&B 452a December 8, Take Home Final. Topic 1
 Tiffany Samaroo MB&B 452a December 8, 2003 Take Home Final Topic 1 Prior to 1970, protein and DNA sequence alignment was limited to visual comparison. This was a very tedious process; even proteins with
Comparative Genomics II
 Comparative Genomics II Advances in Bioinformatics and Genomics GEN 240B Jason Stajich May 19 Comparative Genomics II Slide 1/31 Outline Introduction Gene Families Pairwise Methods Phylogenetic Methods
Supplementary Information for Discovery and characterization of indel and point mutations
 Supplementary Information for Discovery and characterization of indel and point mutations using DeNovoGear Avinash Ramu 1 Michiel J. Noordam 1 Rachel S. Schwartz 2 Arthur Wuster 3 Matthew E. Hurles 3 Reed
Outline. Genome Evolution. Genome. Genome Architecture. Constraints on Genome Evolution. New Evolutionary Synthesis 11/8/16
 Genome Evolution Outline 1. What: Patterns of Genome Evolution Carol Eunmi Lee Evolution 410 University of Wisconsin 2. Why? Evolution of Genome Complexity and the interaction between Natural Selection
Supplementary Figure 1. Phenotype of the HI strain.
 Supplementary Figure 1. Phenotype of the HI strain. (A) Phenotype of the HI and wild type plant after flowering (~1month). Wild type plant is tall with well elongated inflorescence. All four HI plants
Algorithms in Bioinformatics FOUR Pairwise Sequence Alignment. Pairwise Sequence Alignment. Convention: DNA Sequences 5. Sequence Alignment
 Algorithms in Bioinformatics FOUR Sami Khuri Department of Computer Science San José State University Pairwise Sequence Alignment Homology Similarity Global string alignment Local string alignment Dot
Supplementary Information
 Supplementary Information Supplementary Figure 1. Schematic pipeline for single-cell genome assembly, cleaning and annotation. a. The assembly process was optimized to account for multiple cells putatively
10-810: Advanced Algorithms and Models for Computational Biology. microrna and Whole Genome Comparison
 10-810: Advanced Algorithms and Models for Computational Biology microrna and Whole Genome Comparison Central Dogma: 90s Transcription factors DNA transcription mrna translation Proteins Central Dogma:
Nature Genetics: doi:0.1038/ng.2768
 Supplementary Figure 1: Graphic representation of the duplicated region at Xq28 in each one of the 31 samples as revealed by acgh. Duplications are represented in red and triplications in blue. Top: Genomic
Divergence of Gene Body DNA Methylation and Evolution of Plant Duplicate Genes
 Divergence of Gene Body DNA Methylation and Evolution of Plant Duplicate Genes Jun Wang, Nicholas C. Marowsky, Chuanzhu Fan* Department of Biological Sciences, Wayne State University, Detroit, Michigan,
Supplementary Figure 1
 Supplementary Figure 1 Supplementary Figure 1. HSP21 expression in 35S:HSP21 and hsp21 knockdown plants. (a) Since no T- DNA insertion line for HSP21 is available in the publicly available T-DNA collections,
BLAST. Varieties of BLAST
 BLAST Basic Local Alignment Search Tool (1990) Altschul, Gish, Miller, Myers, & Lipman Uses short-cuts or heuristics to improve search speed Like speed-reading, does not examine every nucleotide of database
BMI/CS 776 Lecture #20 Alignment of whole genomes. Colin Dewey (with slides adapted from those by Mark Craven)
") BMI/CS 776 Lecture #20 Alignment of whole genomes Colin Dewey (with slides adapted from those by Mark Craven) 2007.03.29 1 Multiple whole genome alignment Input set of whole genome sequences genomes diverged
BMI/CS 776 Lecture #20 Alignment of whole genomes Colin Dewey (with slides adapted from those by Mark Craven) 2007.03.29 1 Multiple whole genome alignment Input set of whole genome sequences genomes diverged
Comparative genomics: Overview & Tools + MUMmer algorithm
 Comparative genomics: Overview & Tools + MUMmer algorithm Urmila Kulkarni-Kale Bioinformatics Centre University of Pune, Pune 411 007. urmila@bioinfo.ernet.in Genome sequence: Fact file 1995: The first
O 3 O 4 O 5. q 3. q 4. Transition
 Hidden Markov Models Hidden Markov models (HMM) were developed in the early part of the 1970 s and at that time mostly applied in the area of computerized speech recognition. They are first described in
Whole Genome Alignments and Synteny Maps
 Whole Genome Alignments and Synteny Maps IINTRODUCTION It was not until closely related organism genomes have been sequenced that people start to think about aligning genomes and chromosomes instead of
08/21/2017 BLAST. Multiple Sequence Alignments: Clustal Omega
 BLAST Multiple Sequence Alignments: Clustal Omega What does basic BLAST do (e.g. what is input sequence and how does BLAST look for matches?) Susan Parrish McDaniel College Multiple Sequence Alignments
Introduction to de novo RNA-seq assembly
 Introduction to de novo RNA-seq assembly Introduction Ideal day for a molecular biologist Ideal Sequencer Any type of biological material Genetic material with high quality and yield Cutting-Edge Technologies
Introduction to Bioinformatics Online Course: IBT
 Introduction to Bioinformatics Online Course: IBT Multiple Sequence Alignment Building Multiple Sequence Alignment Lec1 Building a Multiple Sequence Alignment Learning Outcomes 1- Understanding Why multiple
Synteny Portal Documentation
 Synteny Portal Documentation Synteny Portal is a web application portal for visualizing, browsing, searching and building synteny blocks. Synteny Portal provides four main web applications: SynCircos,
Isoform discovery and quantification from RNA-Seq data
 Isoform discovery and quantification from RNA-Seq data C. Toffano-Nioche, T. Dayris, Y. Boursin, M. Deloger November 2016 C. Toffano-Nioche, T. Dayris, Y. Boursin, M. Isoform Deloger discovery and quantification
RGP finder: prediction of Genomic Islands
 Training courses on MicroScope platform RGP finder: prediction of Genomic Islands Dynamics of bacterial genomes Gene gain Horizontal gene transfer Gene loss Deletion of one or several genes Duplication
Pyrobayes: an improved base caller for SNP discovery in pyrosequences
 Pyrobayes: an improved base caller for SNP discovery in pyrosequences Aaron R Quinlan, Donald A Stewart, Michael P Strömberg & Gábor T Marth Supplementary figures and text: Supplementary Figure 1. The
Supplementary text for the section Interactions conserved across species: can one select the conserved interactions?
 1 Supporting Information: What Evidence is There for the Homology of Protein-Protein Interactions? Anna C. F. Lewis, Nick S. Jones, Mason A. Porter, Charlotte M. Deane Supplementary text for the section
Bio 1B Lecture Outline (please print and bring along) Fall, 2007
 Fall, 2007") Bio 1B Lecture Outline (please print and bring along) Fall, 2007 B.D. Mishler, Dept. of Integrative Biology 2-6810, bmishler@berkeley.edu Evolution lecture #5 -- Molecular genetics and molecular evolution
Bio 1B Lecture Outline (please print and bring along) Fall, 2007 B.D. Mishler, Dept. of Integrative Biology 2-6810, bmishler@berkeley.edu Evolution lecture #5 -- Molecular genetics and molecular evolution
Introduction to Bioinformatics
 CSCI8980: Applied Machine Learning in Computational Biology Introduction to Bioinformatics Rui Kuang Department of Computer Science and Engineering University of Minnesota kuang@cs.umn.edu History of Bioinformatics
Drosophila melanogaster and D. simulans, two fruit fly species that are nearly
 Comparative Genomics: Human versus chimpanzee 1. Introduction The chimpanzee is the closest living relative to humans. The two species are nearly identical in DNA sequence (>98% identity), yet vastly different
SUPPLEMENTARY INFORMATION
 reverse 3175 3175 F L C 318 318 3185 3185 319 319 3195 3195 315 8 1 315 3155 315 317 Supplementary Figure 3. Stability of expression of the GFP sensor constructs return to warm conditions. Semi-quantitative
Investigation 3: Comparing DNA Sequences to Understand Evolutionary Relationships with BLAST
 Investigation 3: Comparing DNA Sequences to Understand Evolutionary Relationships with BLAST Introduction Bioinformatics is a powerful tool which can be used to determine evolutionary relationships and
Genome-wide analysis of the MYB transcription factor superfamily in soybean
 Du et al. BMC Plant Biology 2012, 12:106 RESEARCH ARTICLE Open Access Genome-wide analysis of the MYB transcription factor superfamily in soybean Hai Du 1,2,3, Si-Si Yang 1,2, Zhe Liang 4, Bo-Run Feng
High-throughput sequencing: Alignment and related topic
 High-throughput sequencing: Alignment and related topic Simon Anders EMBL Heidelberg HTS Platforms E s ta b lis h e d p la tfo rm s Illu m in a H is e q, A B I S O L id, R o c h e 4 5 4 N e w c o m e rs
Organization of Genes Differs in Prokaryotic and Eukaryotic DNA Chapter 10 p
 Organization of Genes Differs in Prokaryotic and Eukaryotic DNA Chapter 10 p.110-114 Arrangement of information in DNA----- requirements for RNA Common arrangement of protein-coding genes in prokaryotes=
Computational approaches for functional genomics
 Computational approaches for functional genomics Kalin Vetsigian October 31, 2001 The rapidly increasing number of completely sequenced genomes have stimulated the development of new methods for finding
AS A SERVICE TO THE RESEARCH COMMUNITY, GENOME BIOLOGY PROVIDES A 'PREPRINT' DEPOSITORY
 http://genomebiology.com/2002/3/12/preprint/0011.1 This information has not been peer-reviewed. Responsibility for the findings rests solely with the author(s). Deposited research article MRD: a microsatellite
Repetitive sequences analysis
 Repetitive sequences analysis Érica Ramos erica.ramos@gmail.com Repetitive elements characterization Martins et al., 2010.!' Repetitive elements characterization Martins et al., 2010. Identical or similar
Supplementary Figure 1 The number of differentially expressed genes for uniparental males (green), uniparental females (yellow), biparental males
, uniparental females (yellow), biparental males") Supplementary Figure 1 The number of differentially expressed genes for males (green), females (yellow), males (red), and females (blue) in caring vs. control comparisons in the caring gene set and the
Supplementary Figure 1 The number of differentially expressed genes for males (green), females (yellow), males (red), and females (blue) in caring vs. control comparisons in the caring gene set and the
Nature Biotechnology: doi: /nbt Supplementary Figure 1. Detailed overview of the primer-free full-length SSU rrna library preparation.
 Supplementary Figure 1 Detailed overview of the primer-free full-length SSU rrna library preparation. Detailed overview of the primer-free full-length SSU rrna library preparation. Supplementary Figure
Supplemental Information
 Molecular Cell, Volume 52 Supplemental Information The Translational Landscape of the Mammalian Cell Cycle Craig R. Stumpf, Melissa V. Moreno, Adam B. Olshen, Barry S. Taylor, and Davide Ruggero Supplemental
Comparative Bioinformatics Midterm II Fall 2004
 Comparative Bioinformatics Midterm II Fall 2004 Objective Answer, part I: For each of the following, select the single best answer or completion of the phrase. (3 points each) 1. Deinococcus radiodurans
Chromosomal rearrangements in mammalian genomes : characterising the breakpoints. Claire Lemaitre
 PhD defense Chromosomal rearrangements in mammalian genomes : characterising the breakpoints Claire Lemaitre Laboratoire de Biométrie et Biologie Évolutive Université Claude Bernard Lyon 1 6 novembre 2008
Homology and Information Gathering and Domain Annotation for Proteins
 Homology and Information Gathering and Domain Annotation for Proteins Outline Homology Information Gathering for Proteins Domain Annotation for Proteins Examples and exercises The concept of homology The
Phylogenetic relationship among S. castellii, S. cerevisiae and C. glabrata.
 Supplementary Note S2 Phylogenetic relationship among S. castellii, S. cerevisiae and C. glabrata. Phylogenetic trees reconstructed by a variety of methods from either single-copy orthologous loci (Class
The Genomic Impact of Gene Retrocopies: What Have We Learned from Comparative Genomics, Population Genomics, and Transcriptomic Analyses?
 The Genomic Impact of Gene Retrocopies: What Have We Learned from Comparative Genomics, Population Genomics, and Transcriptomic Analyses? Claudio Casola 1, * and Esther Betran 2, * 1 Department of Ecosystem
Lecture 7 Mutation and genetic variation
 Lecture 7 Mutation and genetic variation Thymidine dimer Natural selection at a single locus 2. Purifying selection a form of selection acting to eliminate harmful (deleterious) alleles from natural populations.
2 Genome evolution: gene fusion versus gene fission
 2 Genome evolution: gene fusion versus gene fission Berend Snel, Peer Bork and Martijn A. Huynen Trends in Genetics 16 (2000) 9-11 13 Chapter 2 Introduction With the advent of complete genome sequencing,
Outline. Genome Evolution. Genome. Genome Architecture. Constraints on Genome Evolution. New Evolutionary Synthesis 11/1/18
 Genome Evolution Outline 1. What: Patterns of Genome Evolution Carol Eunmi Lee Evolution 410 University of Wisconsin 2. Why? Evolution of Genome Complexity and the interaction between Natural Selection
Bioinformatics Chapter 1. Introduction
 Bioinformatics Chapter 1. Introduction Outline! Biological Data in Digital Symbol Sequences! Genomes Diversity, Size, and Structure! Proteins and Proteomes! On the Information Content of Biological Sequences!
Bioinformatics. Dept. of Computational Biology & Bioinformatics
 Bioinformatics Dept. of Computational Biology & Bioinformatics 3 Bioinformatics - play with sequences & structures Dept. of Computational Biology & Bioinformatics 4 ORGANIZATION OF LIFE ROLE OF BIOINFORMATICS
Statistical Machine Learning Methods for Bioinformatics II. Hidden Markov Model for Biological Sequences
 Statistical Machine Learning Methods for Bioinformatics II. Hidden Markov Model for Biological Sequences Jianlin Cheng, PhD Department of Computer Science University of Missouri 2008 Free for Academic
Homology Modeling. Roberto Lins EPFL - summer semester 2005
 Homology Modeling Roberto Lins EPFL - summer semester 2005 Disclaimer: course material is mainly taken from: P.E. Bourne & H Weissig, Structural Bioinformatics; C.A. Orengo, D.T. Jones & J.M. Thornton,
Supplementary Information. Characteristics of Long Non-coding RNAs in the Brown Norway Rat and. Alterations in the Dahl Salt-Sensitive Rat
 Supplementary Information Characteristics of Long Non-coding RNAs in the Brown Norway Rat and Alterations in the Dahl Salt-Sensitive Rat Feng Wang 1,2,3,*, Liping Li 5,*, Haiming Xu 5, Yong Liu 2,3, Chun
GENOME-WIDE ANALYSIS OF CORE PROMOTER REGIONS IN EMILIANIA HUXLEYI
 1 GENOME-WIDE ANALYSIS OF CORE PROMOTER REGIONS IN EMILIANIA HUXLEYI Justin Dailey and Xiaoyu Zhang Department of Computer Science, California State University San Marcos San Marcos, CA 92096 Email: daile005@csusm.edu,
Divergence Pattern of Duplicate Genes in Protein-Protein Interactions Follows the Power Law
 Divergence Pattern of Duplicate Genes in Protein-Protein Interactions Follows the Power Law Ze Zhang,* Z. W. Luo,* Hirohisa Kishino,à and Mike J. Kearsey *School of Biosciences, University of Birmingham,
1. In most cases, genes code for and it is that
 Name Chapter 10 Reading Guide From DNA to Protein: Gene Expression Concept 10.1 Genetics Shows That Genes Code for Proteins 1. In most cases, genes code for and it is that determine. 2. Describe what Garrod
Genomics and bioinformatics summary. Finding genes -- computer searches
 Genomics and bioinformatics summary 1. Gene finding: computer searches, cdnas, ESTs, 2. Microarrays 3. Use BLAST to find homologous sequences 4. Multiple sequence alignments (MSAs) 5. Trees quantify sequence
Supplementary Information for Hurst et al.: Causes of trends of amino acid gain and loss
 Supplementary Information for Hurst et al.: Causes of trends of amino acid gain and loss Methods Identification of orthologues, alignment and evolutionary distances A preliminary set of orthologues was
A PARSIMONY APPROACH TO ANALYSIS OF HUMAN SEGMENTAL DUPLICATIONS
 A PARSIMONY APPROACH TO ANALYSIS OF HUMAN SEGMENTAL DUPLICATIONS CRYSTAL L. KAHN and BENJAMIN J. RAPHAEL Box 1910, Brown University Department of Computer Science & Center for Computational Molecular Biology
Frequently Asked Questions (FAQs)
") Frequently Asked Questions (FAQs) Q1. What is meant by Satellite and Repetitive DNA? Ans: Satellite and repetitive DNA generally refers to DNA whose base sequence is repeated many times throughout the
Frequently Asked Questions (FAQs) Q1. What is meant by Satellite and Repetitive DNA? Ans: Satellite and repetitive DNA generally refers to DNA whose base sequence is repeated many times throughout the
Student Handout Fruit Fly Ethomics & Genomics
 Student Handout Fruit Fly Ethomics & Genomics Summary of Laboratory Exercise In this laboratory unit, students will connect behavioral phenotypes to their underlying genes and molecules in the model genetic
Lecture Notes: BIOL2007 Molecular Evolution
 Lecture Notes: BIOL2007 Molecular Evolution Kanchon Dasmahapatra (k.dasmahapatra@ucl.ac.uk) Introduction By now we all are familiar and understand, or think we understand, how evolution works on traits
BLAST Database Searching. BME 110: CompBio Tools Todd Lowe April 8, 2010
 BLAST Database Searching BME 110: CompBio Tools Todd Lowe April 8, 2010 Admin Reading: Read chapter 7, and the NCBI Blast Guide and tutorial http://www.ncbi.nlm.nih.gov/blast/why.shtml Read Chapter 8 for
Annotation of Drosophila grimashawi Contig12
 Annotation of Drosophila grimashawi Contig12 Marshall Strother April 27, 2009 Contents 1 Overview 3 2 Genes 3 2.1 Genscan Feature 12.4............................................. 3 2.1.1 Genome Browser:
USING BLAST TO IDENTIFY PROTEINS THAT ARE EVOLUTIONARILY RELATED ACROSS SPECIES
 USING BLAST TO IDENTIFY PROTEINS THAT ARE EVOLUTIONARILY RELATED ACROSS SPECIES HOW CAN BIOINFORMATICS BE USED AS A TOOL TO DETERMINE EVOLUTIONARY RELATIONSHPS AND TO BETTER UNDERSTAND PROTEIN HERITAGE?
Genome sequence of Plasmopara viticola and insight into the pathogenic mechanism
 Genome sequence of Plasmopara viticola and insight into the pathogenic mechanism Ling Yin 1,3,, Yunhe An 1,2,, Junjie Qu 3,, Xinlong Li 1, Yali Zhang 1, Ian Dry 5, Huijun Wu 2*, Jiang Lu 1,4** 1 College
From gene to protein. Premedical biology
 From gene to protein Premedical biology Central dogma of Biology, Molecular Biology, Genetics transcription replication reverse transcription translation DNA RNA Protein RNA chemically similar to DNA,
Analysis of Biological Networks: Network Robustness and Evolution
 Analysis of Biological Networks: Network Robustness and Evolution Lecturer: Roded Sharan Scribers: Sasha Medvedovsky and Eitan Hirsh Lecture 14, February 2, 2006 1 Introduction The chapter is divided into
Phylogenetic Tree Reconstruction
 I519 Introduction to Bioinformatics, 2011 Phylogenetic Tree Reconstruction Yuzhen Ye (yye@indiana.edu) School of Informatics & Computing, IUB Evolution theory Speciation Evolution of new organisms is driven
Tandem repeat 16,225 20,284. 0kb 5kb 10kb 15kb 20kb 25kb 30kb 35kb
 Overview Fosmid XAAA112 consists of 34,783 nucleotides. Blat results indicate that this fosmid has significant identity to the 2R chromosome of D.melanogaster. Evidence suggests that fosmid XAAA112 contains
Sequences, Structures, and Gene Regulatory Networks
 Sequences, Structures, and Gene Regulatory Networks Learning Outcomes After this class, you will Understand gene expression and protein structure in more detail Appreciate why biologists like to align
Classification of repetitive elements based on the analysis of protein domains. Pavel Neumann May 2018
 Classification of repetitive elements based on the analysis of protein domains Pavel Neumann May 2018 A unified classification system for eukaryotic transposable elements (Wicker et al. 2007) Repbase classification
Bustamante et al., Supplementary Nature Manuscript # 1 out of 9 Information #
 Bustamante et al., Supplementary Nature Manuscript # 1 out of 9 Details of PRF Methodology In the Poisson Random Field PRF) model, it is assumed that non-synonymous mutations at a given gene are either
Introduction to Sequence Alignment. Manpreet S. Katari
 Introduction to Sequence Alignment Manpreet S. Katari 1 Outline 1. Global vs. local approaches to aligning sequences 1. Dot Plots 2. BLAST 1. Dynamic Programming 3. Hash Tables 1. BLAT 4. BWT (Burrow Wheeler
Introduction to protein alignments
 Introduction to protein alignments Comparative Analysis of Proteins Experimental evidence from one or more proteins can be used to infer function of related protein(s). Gene A Gene X Protein A compare
Sequence analysis and comparison
 The aim with sequence identification: Sequence analysis and comparison Marjolein Thunnissen Lund September 2012 Is there any known protein sequence that is homologous to mine? Are there any other species
Grundlagen der Bioinformatik Summer semester Lecturer: Prof. Daniel Huson
 Grundlagen der Bioinformatik, SS 10, D. Huson, April 12, 2010 1 1 Introduction Grundlagen der Bioinformatik Summer semester 2010 Lecturer: Prof. Daniel Huson Office hours: Thursdays 17-18h (Sand 14, C310a)
Supplementary Figure 3
 Supplementary Figure 3 7.0 Col Kas-1 Line FTH1A 8.4 F3PII3 8.9 F26H11 ATQ1 T9I22 PLS8 F26B6-B 9.6 F27L4 9.81 F27D4 9.92 9.96 10.12 10.14 10.2 11.1 0.5 Mb T1D16 Col % RGR 83.3 101 227 93.5 75.9 132 90 375
Proteomics. 2 nd semester, Department of Biotechnology and Bioinformatics Laboratory of Nano-Biotechnology and Artificial Bioengineering
 Proteomics 2 nd semester, 2013 1 Text book Principles of Proteomics by R. M. Twyman, BIOS Scientific Publications Other Reference books 1) Proteomics by C. David O Connor and B. David Hames, Scion Publishing
Title ghost-tree: creating hybrid-gene phylogenetic trees for diversity analyses
 1 2 3 4 5 6 7 8 9 10 11 12 13 14 15 16 17 18 19 20 21 22 23 24 25 26 27 28 29 30 31 32 33 34 35 36 37 38 39 40 41 42 43 44 45 Title ghost-tree: creating hybrid-gene phylogenetic trees for diversity analyses
Going Beyond SNPs with Next Genera5on Sequencing Technology Personalized Medicine: Understanding Your Own Genome Fall 2014
 Going Beyond SNPs with Next Genera5on Sequencing Technology 02-223 Personalized Medicine: Understanding Your Own Genome Fall 2014 Next Genera5on Sequencing Technology (NGS) NGS technology Discover more
Supporting Information
 Supporting Information Das et al. 10.1073/pnas.1302500110 < SP >< LRRNT > < LRR1 > < LRRV1 > < LRRV2 Pm-VLRC M G F V V A L L V L G A W C G S C S A Q - R Q R A C V E A G K S D V C I C S S A T D S S P E
BIOINFORMATICS LAB AP BIOLOGY
 BIOINFORMATICS LAB AP BIOLOGY Bioinformatics is the science of collecting and analyzing complex biological data. Bioinformatics combines computer science, statistics and biology to allow scientists to
FUNDAMENTALS OF MOLECULAR EVOLUTION
 FUNDAMENTALS OF MOLECULAR EVOLUTION Second Edition Dan Graur TELAVIV UNIVERSITY Wen-Hsiung Li UNIVERSITY OF CHICAGO SINAUER ASSOCIATES, INC., Publishers Sunderland, Massachusetts Contents Preface xiii
Genomes and Their Evolution
 Chapter 21 Genomes and Their Evolution PowerPoint Lecture Presentations for Biology Eighth Edition Neil Campbell and Jane Reece Lectures by Chris Romero, updated by Erin Barley with contributions from
Supporting Information
 Supporting Information Weghorn and Lässig 10.1073/pnas.1210887110 SI Text Null Distributions of Nucleosome Affinity and of Regulatory Site Content. Our inference of selection is based on a comparison of