DAVID STONER and THOMAS C. EDWARDS Utah State University, US Geological Survey
|
|
|
- Erik Dawson
- 5 years ago
- Views:
Transcription

1 DAVID STONER and THOMAS C. EDWARDS Utah State University, US Geological Survey
2 Science Needs Identified by the Mule Deer Focus Group 1. Synthesis / delivery of information pertaining to factors limiting mule deer populations; 2. Development of tools that use remotely sensed data to assess mule deer habitat quality; 3. Improve the efficiency, accuracy, and cost effectiveness of mule deer population monitoring i.e. use of satellite imagery to monitor mule deer habitat and demography
3 States in the SRLCC are the fastest growing!
4 .the driest Mean total annual mm ppt
!!$#% (012,*\" /4*015\" />++,*\" \"\"\"\"\"8*,90402):;1\" \" \"\"\"\"\"\"\"\"8<=\"?")
5 !and getting drier!,"*+-%()*+,*"!./"01+-".,//"01"(012,*"3" /4*0156"!"#$%&'%()!!$#%!.23-"7057,*"01"(012,*"3" /4*0156"*"+$#%%&'%()!!$#% (012,*" /4*015" />++,*" """""8*,90402):;1" "
(#4'$%5/'6&7e\"!>*f)10g):;1\"!,1,*5h6\"()2,*\"i,j,.")
*+,*\"2,+4/\"M\"F0+;I).\"442\"*,50+,\"!0)!\"#$%&'!")
6 More people * less water what does this mean for large, migratory mammals?!.'+)(#4'$%5/'6&7e"!>*f)10g):;1"!,1,*5h6"()2,*"i,j,.;4+,12"!(,,i/6"k*,6"*,9*,):;16",29c"!l"!"#$%&'%()*$&+,%"-&./"))! 8(1*#&"%+/'9"04'$:E"!()*+,*"2,+4/"M"F0+;I)."442"*,50+,"!0)!"#$%&'!"+)&$!(!-1)

2,\")F>1I)19,\")\"9,12*).")
4:3;3:<5)2=59>:56)")
H/6\")5*09>.")


7 Why is understanding the drivers of deer abundance so important? NC! O15>.)2,")F>1I)19,")"9,12*)."9;19,*1"P;*"233) )4:3;3:<5)2=59>:56) ;;<! 30'$'*10%1*+#0&:%! Q>1:156"7057()H/6")5*09>.2>*," ;;;<! 30'('510#(%1*+#0&:%! R0;I0J,*/02H"A)/4,16"4*,I)2;*"9;12*;.D" ;=<! >'01#(%0'$?10&:-%%! ST;*,"I,,*UV"J/C"SW;;"+)1H"I,,*"X&'%!,%-./0,.#1YUV"

1)5,+,12\" A+)104>.")

8 Research Concept: 8AFD;=CF3>% Predator Density & Distribution Prey Density & Distribution Climate & Weather T)1)5,+,12" A+)104>.):;1D" E3FG;=CF3>% =3B3,A,;CD% Primary Productivity Topography Z;"9;12*;." A4*,I09:;1D"


9 Changes in primary production transfer across trophic levels 10,000 J
10 Research Questions Use NDVI to evaluate mule deer abundance, migra:on, and habitat use with respect to climate and land- use; I. How does climate affect mule deer demography? II. How do climate and land- use influence mule deer migra:on? III. How can satellite observa:ons of vegeta:on phenology inform wildlife management?
")

11 Study region (1.5 million km") `a" Z\" OW"?b"?c" cd" ZT"


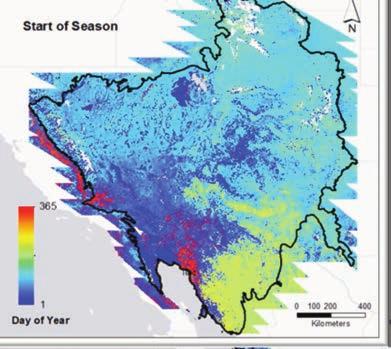


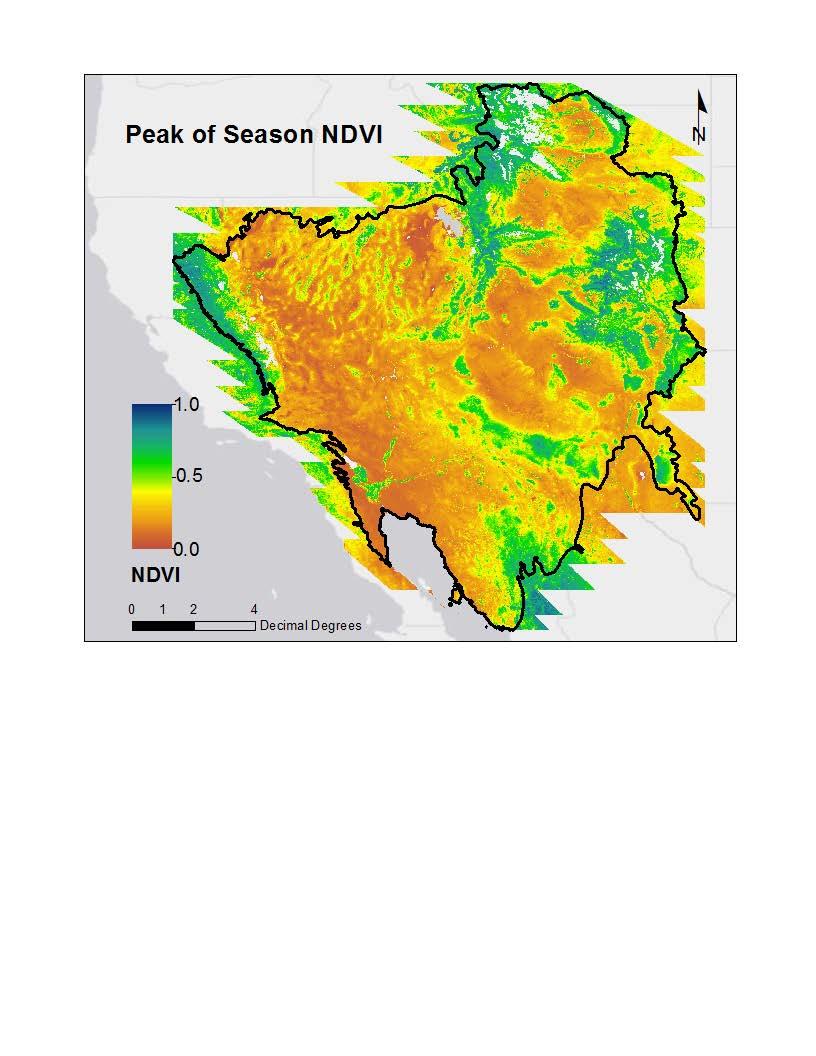
12 Vegetation metrics derived from The Stacks a=ce" f>.0)1"i)2,/"$g#6$$!"" A"$"f)1"%!!!"2;"&$"[,9"%!$'D" %!$'" Tb[NB"Z[\N"A%!!!<%!$'6"I)0.H6"#!!"+D" e,/4;1/,"\)*0)f.,"h"z[\ne"/9).,i"!<$" 9;)*/,"/4):).6"K1,"2,+4;*).6"" " %!!!" [,*0J,I"I)2)""


13 Study areas & sampling polygons %%%%%%%%%%%>)/H"I%J#&#%K$%L%MN%)$1&:O%%%%%%%%%%%%%%%%%%%%%%%%%%%B.>%J#&#%K$%L%P%)$1&:O%
(1/\"j\"$!!\"i;,/\"aow6\"cdd\"!")
:;1\",/:+)2,/\"AOWD\"! %!!k<%!")
10+)./\"! %!")
14 Response variables:! i)(1/"j"$!!"i;,/"aow6"cdd"! %!!'<%!$%"! TO"4;4>.):;1",/:+)2,/"AOWD"! %!!k<%!$&"! l8b"p*;+")i>.2"p,+).,/"aowd"! 1"h"$!!")10+)./"! %!!!<%!$#"


15 Question 1: How does climate affect mule deer demography?
16 Climate varies along a latitudinal gradient within the study area: Note three seasonal pamerns: 1. Winter snow proceeds from north to south 2. Heavy winter snowpack ends ~ 37 N 3. Monsoonal moisture progressing from south to north ~ mid- summer
17 Precipitation varies with latitude across the study region: 60% 50% cd"""ow" % WINTER % SUMMER % SPRING TOTAL ANNUAL PRECIP 40% 30% R! = 0.02 R! = % 10% R! = % LATITUDE
18 Timing of green-up (~ forage quality) varies with latitude: º `a" Mean NDVI º 33º Latitude Z\" OW"?b" 0.2 winter snow (July-Sept: 17%) snow-rain mix (July-Sept: 29%) summer rain (July-Sept: 52%) 0.1 MAR APR MAY JUN JUL AUG SEP OCT NOV GROWING SEASON cd" Longitude ZT"
19 Birthing dates track Peak-of-Growing- Season across latitude: ID WY NV Latitude UT CO AZ NM Longitude Southern deer :me birthing to monsoonal moisture.
20 Fawn production varies with summer precipitation: MEAN_FAWNS CV_FAWNS R! = % 45% 40% Z\" N[" `a" Fawn counts % 30% 25% 20% 15% CV (fawn counts) Latitude OW"?b" 20 10% 10 5% R! = % Latitude cd" Longitude ZT" B1;("I;+01)2,I"/H/2,+/",q70F02"7057,*"/>++,*"P)(1"/>*J0J).")1I".;(,*"012,*)11>)."J)*0):;1C"

21 Fawn production varies with mean annual AET: R! = N[" `a" Evapotranspiration R! = 0.59 EVAPOTRANSPIRATION =J)4;2*)1/40*):;1" i)(1"9;>12/" MEAN_J100F Fawns / 100 Does Latitude Z\" OW" cd" ZT"?b" Latitude Longitude i)(1"4*;i>9:;1"j)*0,/"01j,*/,.h"(027"+,)1")11>)."c=wc"
 Latitude Z\\" Z\\" OW\" OW\" cd\" cd\"?b\"?")
22 Density varies with summer range NDVI during parturition: R 2 = 0.58 N[" N[" `a" `a" (deer / 100 km 2 ) Latitude Z\" Z\" OW" OW" cd" cd"?b"?b" ZT" NDVI (Date-Of-Birth) Longitude e)15,"9;1i0:;1/"i>*015"f0*27"4*,i092"4;4>.):;1"i,1/02hc"

23 Question 2: How do climate and land-use influence mule deer seasonal movements?
24 Monroe Mtn elk: spring migration in response to climatic factors Note two seasonal pamerns: 1. Probing behavior to snowline during late winter; 2. Tracking green- up during late spring
25 Cedar Mtn deer: migration in response to climatic factors Note two seasonal pamerns: 1. Spring migra:on ini:ated when summer range is green (May 4); 2. Fall migra:on ini:ated arer first major snowstorm (October 20)
26 Migration is predictable in space! N[" 1000 MEAN ELEVATION (m) N Latitude 1200 SNOW 3000 MEAN (± 95% CI) ANNUALSNOWPACK (mm) MEAN_ELEV Z\" `a" OW" cd" Longitude LATITUDE N [,,*"+05*)2,"01")*,)/"(7,*,"/1;("I,427"L"%#!"++"Ao"$!VDC"?b" ZT"
**\"/%E'*\"%F#$5\":%KG')(T\"/%!&$U%V,U%RWXRO%!C#!\"!C'#\"!")


27 !and time: >F% B4*015"+05*):;1"A#j$'j%!$%D-" " i).."+05*):;1"auj%'j%!$%d-" YF% v6!!!w" >F% u6#!!w" YF% QRS%61$&"/%#$T%:)**"/%E'*"%F#$5":%KG')(T"/%!&$U%V,U%RWXRO%!C#!"!C'#"!C'!" M2J#I%!3AD%DJ=;%!C&#"!C&!"!C%#"!C%!"!C$#"!C$!"!C!#" %!$%t`e" %!$%tbe"!c!!" s$<#s" s$$<$#s" s%$<%#s" s$<#s" s$$<$#s" s%$<%#s" s$<#s" s$$<$#s" s%$<%#s" s$<#s" s$$<$#s" s%$<%#s" s$<#s" s$$<$#s" s%$<%#s" s$<#s" s$$<$#s" s%$<%#s" s$<#s" s$$<$#s" s%$<%#s" s$<#s" s$$<$#s" s%$<%#s" s$<#s" s$$<$#s" s%$<%#s" s$<#s" s$$<$#s" s%$<%#s" P,F" +)*" )>5" /,4" ;92" 1;J"
28 Mule deer are vulnerable to land use change:
15,\".0+02):;1E\"! x;//\";p\"+05*)2;*h\"*;>2,/e\"\"! i*)5+,12):;1\"27*,/7;.i/e\"\" 8*;J;<b*,+\"")
29 Mule deer are vulnerable to land use change: 2#$.3%4.*3%5.0$% by>0**7"t21/" B).2"x)n,"?02H" 63.7%5.0$%! `012,*"*)15,".0+02):;1E"! x;//";p"+05*)2;*h"*;>2,/e""! i*)5+,12):;1"27*,/7;.i/e"" 8*;J;<b*,+"

+4\"`0..0)+/\" $juj%!")
15,\"\" A%!")


30 Mule deer are vulnerable to land use change: [,,*"i%-"9)>572")2"?)+4"`0..0)+/" $juj%!$%" lbx" zo??" B).2"x)n,"?02H" B>++,*"*)15,"" A%!$%6"%!$&D" T05*):;1"*;>2,"A$D-"" c4*0."3"b92"%!$%6""?`" T05*):;1"*;>2,"A%D-" B4*015"%!$&" O2)7" x)n," 8*;J;" (012,*"*)15,"A%D"

F02)2-\"9;1/,*J):;1\"j\"*,/2;*):;1\" %C!")
31 Question 3: How can satellite observations of plant phenology inform wildlife management? $C! Q)F02)2-"9;1/,*J):;1"j"*,/2;*):;1" %C! [,+;5*)4709/-"4;4>.):;1"I,1/02H"j"2*,1I/"


32 Habitat: where possible, conserve / restore aspen communities B8c?=" WNT=" JUNE NDVI JUNE NDVI R! = R! = DECIDUOUS VEG SPRING PRECIP (mm)


33 Demographics: combined with field data, NDVI can be used to predict population abundance / trends DEER / 100 km JUNE NDVI SPRING NDVI SPRING NDVI FAWN COUNTS YEAR FAWNS / 100 DOES


34 The goal is to improve p/a maps by including demographic parameters: NDVI is correlated with density, produc:vity, and survival
35 Take Home Points: I. Climate (~ vegeta:on) can affect mule deer demography; detectable through standard survey data; II. Interannual varia:on in plant phenology is measurable with satellite imagery; III. Deer abundance varies predictably with NDVI; can be used to es:mate / calibrate popula:on objec:ves; IV. NDVI provides an affordable, :mely, synop:c tool for indexing deer habitat (state, regional, MU scales); can be used to: I. predict deer movements / iden:fy conflict hotspots / migra:on routes; II. Priori:ze management ac:ons (habitat restora:on, predator control, harvest, etc.).


36 Acknowledgements
Presentation Overview. Southwestern Climate: Past, present and future. Global Energy Balance. What is climate?
 Southwestern Climate: Past, present and future Mike Crimmins Climate Science Extension Specialist Dept. of Soil, Water, & Env. Science & Arizona Cooperative Extension The University of Arizona Presentation
Climate Change and Arizona s Rangelands: Management Challenges and Opportunities
 Climate Change and Arizona s Rangelands: Management Challenges and Opportunities Mike Crimmins Climate Science Extension Specialist Dept. of Soil, Water, & Env. Science & Arizona Cooperative Extension
Spatiotemporal variations of alpine climate, snow cover and phenology
 Spatiotemporal variations of alpine climate, snow cover and phenology S. Asam, M. Callegari, M. Matiu, G. Fiore, L. De Gregorio, A. Jacob, A. Menzel, C. Notarnicola, M. Zebisch Asam et al., Spatiotemporal
Satellite-derived environmental drivers for top predator hotspots
 Satellite-derived environmental drivers for top predator hotspots Peter Miller @PeterM654 South West Marine Ecosystems 2017 21 Apr. 2017, Plymouth University Satellite environmental drivers for hotspots
Climatic and Ecological Conditions in the Klamath Basin of Southern Oregon and Northern California: Projections for the Future
 Climatic and Ecological Conditions in the Klamath Basin of Southern Oregon and Northern California: Projections for the Future A Collaborative Effort by: CLIMATE LEADERSHIP INITIATIVE INSTITUTE FOR A SUSTAINABLE
Minnesota s Climatic Conditions, Outlook, and Impacts on Agriculture. Today. 1. The weather and climate of 2017 to date
 Minnesota s Climatic Conditions, Outlook, and Impacts on Agriculture Kenny Blumenfeld, State Climatology Office Crop Insurance Conference, Sep 13, 2017 Today 1. The weather and climate of 2017 to date
GAMINGRE 8/1/ of 7
 FYE 09/30/92 JULY 92 0.00 254,550.00 0.00 0 0 0 0 0 0 0 0 0 254,550.00 0.00 0.00 0.00 0.00 254,550.00 AUG 10,616,710.31 5,299.95 845,656.83 84,565.68 61,084.86 23,480.82 339,734.73 135,893.89 67,946.95
Changing Hydrology under a Changing Climate for a Coastal Plain Watershed
 Changing Hydrology under a Changing Climate for a Coastal Plain Watershed David Bosch USDA-ARS, Tifton, GA Jeff Arnold ARS Temple, TX and Peter Allen Baylor University, TX SEWRU Objectives 1. Project changes
Variability of Reference Evapotranspiration Across Nebraska
 Know how. Know now. EC733 Variability of Reference Evapotranspiration Across Nebraska Suat Irmak, Extension Soil and Water Resources and Irrigation Specialist Kari E. Skaggs, Research Associate, Biological
YACT (Yet Another Climate Tool)? The SPI Explorer
? The SPI Explorer") YACT (Yet Another Climate Tool)? The SPI Explorer Mike Crimmins Assoc. Professor/Extension Specialist Dept. of Soil, Water, & Environmental Science The University of Arizona Yes, another climate tool for
YACT (Yet Another Climate Tool)? The SPI Explorer Mike Crimmins Assoc. Professor/Extension Specialist Dept. of Soil, Water, & Environmental Science The University of Arizona Yes, another climate tool for
OVERVIEW OF IMPROVED USE OF RS INDICATORS AT INAM. Domingos Mosquito Patricio
 OVERVIEW OF IMPROVED USE OF RS INDICATORS AT INAM Domingos Mosquito Patricio domingos.mosquito@gmail.com Introduction to Mozambique /INAM Introduction to AGRICAB/SPIRITS Objectives Material & Methods Results
Table of Contents. Page
 Eighteen Years (1990 2007) of Climatological Data on NMSU s Corona Range and Livestock Research Center Research Report 761 L. Allen Torell, Kirk C. McDaniel, Shad Cox, Suman Majumdar 1 Agricultural Experiment
Lecture Topics. 1. Vegetation Indices 2. Global NDVI data sets 3. Analysis of temporal NDVI trends
 Lecture Topics 1. Vegetation Indices 2. Global NDVI data sets 3. Analysis of temporal NDVI trends Why use NDVI? Normalize external effects of sun angle, viewing angle, and atmospheric effects Normalize
Plasticity of Pleuraphis jamesii across a monsoon gradient: A field trial at the Canyonlands Research Center
 Plasticity of Pleuraphis jamesii across a monsoon gradient: A field trial at the Canyonlands Research Center Dave Hoover 1, Troy Wood 2 and Mike Duniway 1 1 US Geological Survey, Southwest Biological Science
Quenching the Valley s thirst: The connection between Sierra Nevada snowpack & regional water supply
 Quenching the Valley s thirst: The connection between Sierra Nevada snowpack & regional water supply Roger Bales, UC Merced Snow conditions Snow & climate change Research directions Sierra Nevada snow
Analysis of Historical Pattern of Rainfall in the Western Region of Bangladesh
 24 25 April 214, Asian University for Women, Bangladesh Analysis of Historical Pattern of Rainfall in the Western Region of Bangladesh Md. Tanvir Alam 1*, Tanni Sarker 2 1,2 Department of Civil Engineering,
Climate Change RMJOC Study Summary
 Climate Change RMJOC Study Summary Erik Pytlak Weather and Streamflow Forecasting Bonneville Power Administration Portland, OR IPCC: International Panel on Climate Change Established by the United Nations
Climate Change Impact Assessment on Indian Water Resources. Ashvin Gosain, Sandhya Rao, Debajit Basu Ray
 Climate Change Impact Assessment on Indian Water Resources Ashvin Gosain, Sandhya Rao, Debajit Basu Ray Objectives of the Study To quantify the impact of the climate change on the water resources of the
Funding provided by NOAA Sectoral Applications Research Project CLIMATE. Basic Climatology Colorado Climate Center
 Funding provided by NOAA Sectoral Applications Research Project CLIMATE Basic Climatology Colorado Climate Center Remember These? Factor 1: Our Energy Source Factor 2: Revolution & Tilt Factor 3: Rotation!
Global Climates. Name Date
 Global Climates Name Date No investigation of the atmosphere is complete without examining the global distribution of the major atmospheric elements and the impact that humans have on weather and climate.
Jackson County 2013 Weather Data
 Jackson County 2013 Weather Data 61 Years of Weather Data Recorded at the UF/IFAS Marianna North Florida Research and Education Center Doug Mayo Jackson County Extension Director 1952-2008 Rainfall Data
What is the difference between Weather and Climate?
 What is the difference between Weather and Climate? Objective Many people are confused about the difference between weather and climate. This makes understanding the difference between weather forecasts
Climate Variability. Eric Salathé. Climate Impacts Group & Department of Atmospheric Sciences University of Washington. Thanks to Nathan Mantua
 Climate Variability Eric Salathé Climate Impacts Group & Department of Atmospheric Sciences University of Washington Thanks to Nathan Mantua Northwest Climate: the mean Factors that influence local/regional
Local Ctimatotogical Data Summary White Hall, Illinois
 SWS Miscellaneous Publication 98-5 STATE OF ILLINOIS DEPARTMENT OF ENERGY AND NATURAL RESOURCES Local Ctimatotogical Data Summary White Hall, Illinois 1901-1990 by Audrey A. Bryan and Wayne Armstrong Illinois
Climate also has a large influence on how local ecosystems have evolved and how we interact with them.
 The Mississippi River in a Changing Climate By Paul Lehman, P.Eng., General Manager Mississippi Valley Conservation (This article originally appeared in the Mississippi Lakes Association s 212 Mississippi
2015 Fall Conditions Report
 2015 Fall Conditions Report Prepared by: Hydrologic Forecast Centre Date: December 21 st, 2015 Table of Contents Table of Figures... ii EXECUTIVE SUMMARY... 1 BACKGROUND... 2 SUMMER AND FALL PRECIPITATION...
The Climate of Oregon Climate Zone 5 High Plateau
 105 E55 Unbound issue i". 9 13oes not circulate CZe Special Report 917 May 1993 The Climate of Oregon Climate Zone 5 Property of OREGON STATE UNIVERSITY Library Serials Corvallis, OR 97331-4503 Agricultural
Three main areas of work:
 Task 2: Climate Information 1 Task 2: Climate Information Three main areas of work: Collect historical and projected weather and climate data Conduct storm surge and wave modeling, sea-level rise (SLR)
A Small Migrating Herd. Mapping Wildlife Distribution 1. Mapping Wildlife Distribution 2. Conservation & Reserve Management
 A Basic Introduction to Wildlife Mapping & Modeling ~~~~~~~~~~ Rev. Ronald J. Wasowski, C.S.C. Associate Professor of Environmental Science University of Portland Portland, Oregon 8 December 2015 Introduction
Seasonal and interannual relations between precipitation, soil moisture and vegetation in the North American monsoon region
 Seasonal and interannual relations between precipitation, soil moisture and vegetation in the North American monsoon region Luis A. Mendez-Barroso 1, Enrique R. Vivoni 1, Christopher J. Watts 2 and Julio
ZUMWALT WEATHER AND CLIMATE ANNUAL REPORT ( )
") ZUMWALT WEATHER AND CLIMATE ANNUAL REPORT (26-29) FINAL DRAFT (9 AUGUST 21) J.D. HANSEN 1, R.V. TAYLOR 2, AND V.S. JANSEN 3 INTRODUCTION The Zumwalt Prairie in northeastern Oregon is a unique grassland
ZUMWALT WEATHER AND CLIMATE ANNUAL REPORT (26-29) FINAL DRAFT (9 AUGUST 21) J.D. HANSEN 1, R.V. TAYLOR 2, AND V.S. JANSEN 3 INTRODUCTION The Zumwalt Prairie in northeastern Oregon is a unique grassland
Champaign-Urbana 2001 Annual Weather Summary
 Champaign-Urbana 2001 Annual Weather Summary ILLINOIS STATE WATER SURVEY 2204 Griffith Dr. Champaign, IL 61820 wxobsrvr@sws.uiuc.edu Maria Peters, Weather Observer January: After a cold and snowy December,
CLIMATE OVERVIEW. Thunder Bay Climate Overview Page 1 of 5
 CLIMATE OVERVIEW The climate in the Thunder Bay area is typical of a mid-latitude inland location with a Great Lake Moderating influence. The moderating effect of Lake Superior results in cooler summer
Average temperature ( F) World Climate Zones. very cold all year with permanent ice and snow. very cold winters, cold summers, and little rain or snow
 World Climate Zones. very cold all year with permanent ice and snow. very cold winters, cold summers, and little rain or snow") P r e v i e w Look carefully at the climagraph of Mumbai, India. What is the wettest month (or months) in Mumbai? What is the driest month (or months) in Mumbai? What effects might this city s climate
P r e v i e w Look carefully at the climagraph of Mumbai, India. What is the wettest month (or months) in Mumbai? What is the driest month (or months) in Mumbai? What effects might this city s climate
Chapter-3 GEOGRAPHICAL LOCATION, CLIMATE AND SOIL CHARACTERISTICS OF THE STUDY SITE
 Chapter-3 GEOGRAPHICAL LOCATION, CLIMATE AND SOIL CHARACTERISTICS OF THE STUDY SITE Chapter-3 GEOGRAPHICAL LOCATION, CLIMATE AND SOIL CHARACTERISTICS OF THE STUDY SITE Assam, the eastern most state of
Supplementary appendix
 Supplementary appendix This appendix formed part of the original submission and has been peer reviewed. We post it as supplied by the authors. Supplement to: Lowe R, Stewart-Ibarra AM, Petrova D, et al.
Rangeland Carbon Fluxes in the Northern Great Plains
 Rangeland Carbon Fluxes in the Northern Great Plains Wylie, B.K., T.G. Gilmanov, A.B. Frank, J.A. Morgan, M.R. Haferkamp, T.P. Meyers, E.A. Fosnight, L. Zhang US Geological Survey National Center for Earth
Weather History on the Bishop Paiute Reservation
 Weather History on the Bishop Paiute Reservation -211 For additional information contact Toni Richards, Air Quality Specialist 76 873 784 toni.richards@bishoppaiute.org Updated 2//214 3:14 PM Weather History
Weather and Climate of the Rogue Valley By Gregory V. Jones, Ph.D., Southern Oregon University
 Weather and Climate of the Rogue Valley By Gregory V. Jones, Ph.D., Southern Oregon University The Rogue Valley region is one of many intermountain valley areas along the west coast of the United States.
Sierra Weather and Climate Update
 Sierra Weather and Climate Update 2014-15 Kelly Redmond Western Regional Climate Center Desert Research Institute Reno Nevada Yosemite Hydroclimate Workshop Yosemite Valley, 2015 October 8-9 Percent of
Chiang Rai Province CC Threat overview AAS1109 Mekong ARCC
 Chiang Rai Province CC Threat overview AAS1109 Mekong ARCC This threat overview relies on projections of future climate change in the Mekong Basin for the period 2045-2069 compared to a baseline of 1980-2005.
What Does It Take to Get Out of Drought?
 What Does It Take to Get Out of Drought? Nolan J. Doesken Colorado Climate Center Colorado State University http://ccc.atmos.colostate.edu Presented at the Insects, Diseases and Drought Workshop, May 19,
Climate of Columbus. Aaron Wilson. Byrd Polar & Climate Research Center State Climate Office of Ohio.
 Climate of Columbus Aaron Wilson Byrd Polar & Climate Research Center http://bpcrc.osu.edu/greenteam Overview Historical Climatology Climate Change & Impacts Projected Changes Summary 2 Historical Climatology
P7: Limiting Factors in Ecosystems
 P7: Limiting Factors in Ecosystems Purpose To understand that physical factors temperature and precipitation limit the growth of vegetative ecosystems Overview Students correlate graphs of vegetation vigor
NIDIS Intermountain West Drought Early Warning System November 21, 2017
 NIDIS Drought and Water Assessment NIDIS Intermountain West Drought Early Warning System November 21, 2017 Precipitation The images above use daily precipitation statistics from NWS COOP, CoCoRaHS, and
The Climate of Oregon Climate Zone 4 Northern Cascades
 /05 E55 Unbound issue No. 9/ is Does not circulate Special Report 916 May 1993 The Climate of Oregon Climate Zone 4 Property of OREGON STATE UNIVERSITY Library Serials Corvallis, OR 97331-4503 Agricultural
Evapo-transpiration Losses Produced by Irrigation in the Snake River Basin, Idaho
 Nov 7, 2007 DRAFT Evapo-transpiration Losses Produced by Irrigation in the Snake River Basin, Idaho Wendell Tangborn and Birbal Rana HyMet Inc. Vashon Island, WA Abstract An estimated 8 MAF (million acre-feet)
The Colorado Drought : 2003: A Growing Concern. Roger Pielke, Sr. Colorado Climate Center.
 The Colorado Drought 2001-2003: 2003: A Growing Concern Roger Pielke, Sr. Colorado Climate Center Prepared by Tara Green and Odie Bliss http://climate.atmos.colostate.edu 2 2002 Drought History in Colorado
The Climate of Payne County
 The Climate of Payne County Payne County is part of the Central Great Plains in the west, encompassing some of the best agricultural land in Oklahoma. Payne County is also part of the Crosstimbers in the
Champaign-Urbana 1999 Annual Weather Summary
 Champaign-Urbana 1999 Annual Weather Summary ILLINOIS STATE WATER SURVEY 2204 Griffith Dr. Champaign, IL 61820 wxobsrvr@sws.uiuc.edu Maria Peters, Weather Observer A major snowstorm kicked off the new
A Recap of Colorado s Water Year 2018
 A Recap of Colorado s Water Year 2018 For further inquiries, please contact: Russ Schumacher, State Climatologist (970) 491-8084 Becky Bolinger, Assistant State Climatologist (970) 491-8506 Peter Goble,
The Climate of Grady County
 The Climate of Grady County Grady County is part of the Central Great Plains, encompassing some of the best agricultural land in Oklahoma. Average annual precipitation ranges from about 33 inches in northern
Highlights of the 2006 Water Year in Colorado
 Highlights of the 2006 Water Year in Colorado Nolan Doesken, State Climatologist Atmospheric Science Department Colorado State University http://ccc.atmos.colostate.edu Presented to 61 st Annual Meeting
2008 California Fire Season Outlook
 2008 California Fire Season Outlook For July through October 2008 (issued 6/25/08) 1 North Ops Concerns and Implications for Management NOPS currently in a worsening drought, due to the driest spring on
Study of Hydrometeorology in a Hard Rock Terrain, Kadirischist Belt Area, Anantapur District, Andhra Pradesh
 Open Journal of Geology, 2012, 2, 294-300 http://dx.doi.org/10.4236/ojg.2012.24028 Published Online October 2012 (http://www.scirp.org/journal/ojg) Study of Hydrometeorology in a Hard Rock Terrain, Kadirischist
Colorado s 2003 Moisture Outlook
 Colorado s 2003 Moisture Outlook Nolan Doesken and Roger Pielke, Sr. Colorado Climate Center Prepared by Tara Green and Odie Bliss http://climate.atmos.colostate.edu How we got into this drought! Fort
Physical Features of Monsoon Asia. 192 Unit 7 Teachers Curriculum Institute 60 N 130 E 140 E 150 E 60 E 50 N 160 E 40 N 30 N 150 E.
 50 N 60 E 70 E 80 E 90 E 100 E 60 N 110 E 120 E 130 E 140 E 150 E 50 N 160 E 40 N 40 N 30 N 60 E 30 N 150 E Tropic of Cancer 20 N Tropic of Cancer 20 N 10 N 10 N 0 Equator 0 Equator 10 S 10 S 0 500 1,000
Disentangling Impacts of Climate & Land Use Changes on the Quantity & Quality of River Flows in Southern Ontario
 Disentangling Impacts of Climate & Land Use Changes on the Quantity & Quality of River Flows in Southern Ontario by Trevor Dickinson & Ramesh Rudra, Water Resources Engineering University of Guelph Acknowledgements
Regents Earth Science Unit 7: Water Cycle and Climate
 Regents Earth Science Unit 7: Water Cycle and Climate Name Section Coastal and Continental Temperature Ranges Lab # Introduction: There are large variations in average monthly temperatures among cities
Drought and Future Water for Southern New Mexico
 Drought and Future Water for Southern New Mexico David S. Gutzler University of New Mexico gutzler@unm.edu * The big drought of 2018 * Longer term challenges for water supply * Forecasting streamflow Elephant
Monthly Long Range Weather Commentary Issued: May 15, 2014 Steven A. Root, CCM, President/CEO
 Monthly Long Range Weather Commentary Issued: May 15, 2014 Steven A. Root, CCM, President/CEO sroot@weatherbank.com APRIL 2014 REVIEW Climate Highlights The Month in Review The average temperature for
CHAPTER-11 CLIMATE AND RAINFALL
 CHAPTER-11 CLIMATE AND RAINFALL 2.1 Climate Climate in a narrow sense is usually defined as the "average weather", or more rigorously, as the statistical description in terms of the mean and variability
Modeling of peak inflow dates for a snowmelt dominated basin Evan Heisman. CVEN 6833: Advanced Data Analysis Fall 2012 Prof. Balaji Rajagopalan
 Modeling of peak inflow dates for a snowmelt dominated basin Evan Heisman CVEN 6833: Advanced Data Analysis Fall 2012 Prof. Balaji Rajagopalan The Dworshak reservoir, a project operated by the Army Corps
Monthly Long Range Weather Commentary Issued: APRIL 18, 2017 Steven A. Root, CCM, Chief Analytics Officer, Sr. VP,
 Monthly Long Range Weather Commentary Issued: APRIL 18, 2017 Steven A. Root, CCM, Chief Analytics Officer, Sr. VP, sroot@weatherbank.com MARCH 2017 Climate Highlights The Month in Review The average contiguous
Monthly Long Range Weather Commentary Issued: APRIL 1, 2015 Steven A. Root, CCM, President/CEO
 Monthly Long Range Weather Commentary Issued: APRIL 1, 2015 Steven A. Root, CCM, President/CEO sroot@weatherbank.com FEBRUARY 2015 Climate Highlights The Month in Review The February contiguous U.S. temperature
UK Flooding Feb 2003
 UK Flooding 2000 06 Feb 2003 Britain has taken a battering from floods in the last 5 years, with major events in 1998 and 2000, significant floods in 2001 and minor events in each of the other years. So
Monthly Long Range Weather Commentary Issued: July 18, 2014 Steven A. Root, CCM, President/CEO
 Monthly Long Range Weather Commentary Issued: July 18, 2014 Steven A. Root, CCM, President/CEO sroot@weatherbank.com JUNE 2014 REVIEW Climate Highlights The Month in Review The average temperature for
Let s Talk Climate! Nolan Doesken Colorado Climate Center Colorado State University. Yampatika Seminar February 16, 2011 Steamboat Springs, Colorado
 Let s Talk Climate! Nolan Doesken Colorado Climate Center Colorado State University Yampatika Seminar February 16, 2011 Steamboat Springs, Colorado First -- A short background In 1973 the federal government
Impacts of climate change on flooding in the river Meuse
 Impacts of climate change on flooding in the river Meuse Martijn Booij University of Twente,, The Netherlands m.j.booij booij@utwente.nlnl 2003 in the Meuse basin Model appropriateness Appropriate model
Chapter 6. Field Trip to Sandia Mountains.
 University of New Mexico Biology 310L Principles of Ecology Lab Manual Page -40 Chapter 6. Field Trip to Sandia Mountains. Outline of activities: 1. Travel to Sandia Mountains 2. Collect forest community
5 - Seasons. Figure 1 shows two pictures of the Sun taken six months apart with the same camera, at the same time of the day, from the same location.
 ASTR 110L 5 - Seasons Purpose: To plot the distance of the Earth from the Sun over one year and to use the celestial sphere to understand the cause of the seasons. What do you think? Write answers to questions
Coupling Climate to Clouds, Precipitation and Snow
 Coupling Climate to Clouds, Precipitation and Snow Alan K. Betts akbetts@aol.com http://alanbetts.com Co-authors: Ray Desjardins, Devon Worth Agriculture and Agri-Food Canada Shusen Wang and Junhua Li
Towards a Bankable Solar Resource
 Towards a Bankable Solar Resource Adam Kankiewicz WindLogics Inc. SOLAR 2010 Phoenix, Arizona May 20, 2010 Outline NextEra/WindLogics Solar Development Lessons learned TMY - Caveat Emptor Discussion 2
Missouri River Basin Water Management
 Missouri River Basin Water Management US Army Corps of Engineers Missouri River Navigator s Meeting February 12, 2014 Bill Doan, P.E. Missouri River Basin Water Management US Army Corps of Engineers BUILDING
Evolution of migration in a changing world. Cervus elaphus (known as red deer, elk, or wapiti)
") Evolution of migration in a changing world Cervus elaphus (known as red deer, elk, or wapiti) 1 Rates of energy gain by red deer or elk are highest when feeding on young vegetation (2-4 weeks of growth)
Evolution of migration in a changing world Cervus elaphus (known as red deer, elk, or wapiti) 1 Rates of energy gain by red deer or elk are highest when feeding on young vegetation (2-4 weeks of growth)
Extreme Weather. Extreme weather has always been a part of Utah
 Climate Notes Extreme Weather Extreme weather has always been a part of Utah Floods Severe storms Wind 1920 Lehi hail storm killed birds and chickens 1971 Farmington wind storm Climate vs. Weather Climate:
HYDROLOGICAL MODELING OF HIGHLY GLACIERIZED RIVER BASINS. Nina Omani, Raghavan Srinivasan, Patricia Smith, Raghupathy Karthikeyan, Gerald North
 HYDROLOGICAL MODELING OF HIGHLY GLACIERIZED RIVER BASINS Nina Omani, Raghavan Srinivasan, Patricia Smith, Raghupathy Karthikeyan, Gerald North Problem statement Glaciers help to keep the earth cool High
The Climate of Marshall County
 The Climate of Marshall County Marshall County is part of the Crosstimbers. This region is a transition region from the Central Great Plains to the more irregular terrain of southeastern Oklahoma. Average
The Climate of Bryan County
 The Climate of Bryan County Bryan County is part of the Crosstimbers throughout most of the county. The extreme eastern portions of Bryan County are part of the Cypress Swamp and Forest. Average annual
Biomes Section 2. Chapter 6: Biomes Section 2: Forest Biomes DAY ONE
 Chapter 6: Biomes Section 2: Forest Biomes DAY ONE Of all the biomes in the world, forest biomes are the most widespread and the most diverse. The large trees of forests need a lot of water, so forests
Interannual variation of MODIS NDVI in Lake Taihu and its relation to climate in submerged macrophyte region
 Yale-NUIST Center on Atmospheric Environment Interannual variation of MODIS NDVI in Lake Taihu and its relation to climate in submerged macrophyte region ZhangZhen 2015.07.10 1 Outline Introduction Data
Monthly Long Range Weather Commentary Issued: February 15, 2015 Steven A. Root, CCM, President/CEO
 Monthly Long Range Weather Commentary Issued: February 15, 2015 Steven A. Root, CCM, President/CEO sroot@weatherbank.com JANUARY 2015 Climate Highlights The Month in Review During January, the average
2003 Water Year Wrap-Up and Look Ahead
 2003 Water Year Wrap-Up and Look Ahead Nolan Doesken Colorado Climate Center Prepared by Odie Bliss http://ccc.atmos.colostate.edu Colorado Average Annual Precipitation Map South Platte Average Precipitation
Modeling the Effects of Climate and Land Cover Change in the Stoney Brook Subbasin of the St. Louis River Watershed
 Modeling the Effects of Climate and Land Cover Change in the Stoney Brook Subbasin of the St. Louis River Watershed Joe Johnson and Jesse Pruette 214 NASA Research Internship Geospatial Technologies Program
A Synoptic Climatology of Heavy Precipitation Events in California
 A Synoptic Climatology of Heavy Precipitation Events in California Alan Haynes Hydrometeorological Analysis and Support (HAS) Forecaster National Weather Service California-Nevada River Forecast Center
United States Climate
 25-1 Alabama Annual Average Temperature Data Source: http://www.wrcc.dri.edu/cgi-bin/divplot1_form.pl?0106 25-2 How does climate vary as we traverse the U.S. along 40 N? 25-3 Average Temperature Along
Many of remote sensing techniques are generic in nature and may be applied to a variety of vegetated landscapes, including
 Remote Sensing of Vegetation Many of remote sensing techniques are generic in nature and may be applied to a variety of vegetated landscapes, including 1. Agriculture 2. Forest 3. Rangeland 4. Wetland,
Agricultural Science Climatology Semester 2, Anne Green / Richard Thompson
 Agricultural Science Climatology Semester 2, 2006 Anne Green / Richard Thompson http://www.physics.usyd.edu.au/ag/agschome.htm Course Coordinator: Mike Wheatland Course Goals Evaluate & interpret information,
Jackson County 2018 Weather Data 67 Years of Weather Data Recorded at the UF/IFAS Marianna North Florida Research and Education Center
 Jackson County 2018 Weather Data 67 Years of Weather Data Recorded at the UF/IFAS Marianna North Florida Research and Education Center Doug Mayo Jackson County Extension Director 1952-2008 Rainfall Data
A Report on a Statistical Model to Forecast Seasonal Inflows to Cowichan Lake
 A Report on a Statistical Model to Forecast Seasonal Inflows to Cowichan Lake Prepared by: Allan Chapman, MSc, PGeo Hydrologist, Chapman Geoscience Ltd., and Former Head, BC River Forecast Centre Victoria
Communicating Climate Change Consequences for Land Use
 Communicating Climate Change Consequences for Land Use Site: Prabost, Skye. Event: Kyle of Lochalsh, 28 th February 28 Further information: http://www.macaulay.ac.uk/ladss/comm_cc_consequences.html Who
Drought in Southeast Colorado
 Drought in Southeast Colorado Nolan Doesken and Roger Pielke, Sr. Colorado Climate Center Prepared by Tara Green and Odie Bliss http://climate.atmos.colostate.edu 1 Historical Perspective on Drought Tourism
The Climate of Kiowa County
 The Climate of Kiowa County Kiowa County is part of the Central Great Plains, encompassing some of the best agricultural land in Oklahoma. Average annual precipitation ranges from about 24 inches in northwestern
CoCoRaHS Monitoring Colorado s s Water Resources through Community Collaborations
 CoCoRaHS Monitoring Colorado s s Water Resources through Community Collaborations Nolan Doesken Colorado Climate Center Atmospheric Science Department Colorado State University Presented at Sustaining
Tracking the Climate Of Northern Colorado Nolan Doesken State Climatologist Colorado Climate Center Colorado State University
 Tracking the Climate Of Northern Colorado Nolan Doesken State Climatologist Colorado Climate Center Colorado State University Northern Colorado Business Innovations November 20, 2013 Loveland, Colorado
Investigation of Rainfall Trend in Jorhat Town, Assam, India
 EUROPEAN ACADEMIC RESEARCH Vol. II, Issue 7/ October 2014 ISSN 2286-4822 www.euacademic.org Impact Factor: 3.1 (UIF) DRJI Value: 5.9 (B+) Investigation of Rainfall Trend in Jorhat Town, MAYURAKSHI BHUYAN
NIDIS Intermountain West Drought Early Warning System February 12, 2019
 NIDIS Intermountain West Drought Early Warning System February 12, 2019 Precipitation The images above use daily precipitation statistics from NWS COOP, CoCoRaHS, and CoAgMet stations. From top to bottom,
Siaga antelope migration revisited: relationship to recent mass deaths
 Siaga antelope migration revisited: relationship to recent mass deaths Navinder J Singh 1 and Matteo Mattiuzzi 2 1.Swedish University of Agricultural Sciences, Umeå 2.BOKU University, Vienna, Austria Theory
The Climate of Seminole County
 The Climate of Seminole County Seminole County is part of the Crosstimbers. This region is a transition region from the Central Great Plains to the more irregular terrain of southeastern Oklahoma. Average
Investigate the influence of the Amazon rainfall on westerly wind anomalies and the 2002 Atlantic Nino using QuikScat, Altimeter and TRMM data
 Investigate the influence of the Amazon rainfall on westerly wind anomalies and the 2002 Atlantic Nino using QuikScat, Altimeter and TRMM data Rong Fu 1, Mike Young 1, Hui Wang 2, Weiqing Han 3 1 School