A Synoptic Climatology of Heavy Precipitation Events in California
|
|
|
- MargaretMargaret Gilbert
- 5 years ago
- Views:
Transcription
1 A Synoptic Climatology of Heavy Precipitation Events in California Alan Haynes Hydrometeorological Analysis and Support (HAS) Forecaster National Weather Service California-Nevada River Forecast Center 3310 El Camino Ave, Ste. 227 Sacramento, CA Tel: , x328 Fax: Web: BIOGRAPHICAL SKETCH Originally from Maryland, my family and I moved to Salt Lake City when I was 9 years old. I developed an interest in weather from a young age, but didn't consider a career in meteorology until attending college. I changed my major to meteorology and upon graduating from the University of Utah in 1989, began my National Weather Service (NWS) career, later earning an MS degree from the University of Utah. Since beginning my NWS career, I was an intern in Salt Lake City, a forecaster in Pueblo CO and since 2000, a HAS forecaster for the California-Nevada River Forecast Center in Sacramento.
2 Alan Haynes National Weather Service California-Nevada River Forecast Center Sacramento, CA
3 Historical heavy precipitation events were defined for three different climatic regimes in California, including the south coast drainage basin, the north coast basin and the Sacramento basin. Synoptic patterns were associated with these events using gridded NMC analyses. The purpose of this study was to identify the primary large-scale features associated with heavy precipitation in the various climatic regimes of California and to document the synoptic climatology of these events. For simplification, heavy precipitation events were defined for three classifications. The first classification was defined by at least 3 stations receiving 3.00 inches of liquid equivalent precipitation in one day. The second class was defined by at least 3 stations receiving 6.00 inches in two consecutive days and the third class was the same as class 2, but with the added stipulation that at least one station received 10.0 inches in two consecutive days. Various synoptic patterns were identified and composited with each of these cases. There was a great deal of similarity between pattern types in the North Coast basin and the Sacramento basin. Some of the main features which appeared to contribute to heavy rain included strong westerly flow across the Pacific Ocean into California or a large scale upper level trough or closed low off the Pacific Northwest/British Columbia coast into the Gulf of Alaska with southwesterly flow into California. Sometimes there was a blocking upper level high over the Pacific in the vicinity of Alaska and sometimes the upper jet was displaced equatorward, especially in the South Coast cases. A sea level low pressure area was generally present along the west coast of North America in the vicinity of the Pacific Northwest or British Columbia, with varying pressure gradient strength across California. The Sacramento basin had the most frequent occurrence of heavy rain as defined for this project, while the South Coast had the least frequent. The Sacramento basin had more cases that were difficult to classify than the other basins and also had some cases with weaker synoptic features that were evidently still able to produce heavy precipitation. Heavier precipitation events, defined as the second class, were associated with stronger synoptic features, such as lower heights, a stronger upper jet and deeper sea level pressure lows and a few events appeared to be mainly attributable to more tropical moisture. The stronger synoptic features usually provided stronger orographic ascent and sometimes allowed a tap into subtropical moisture. There were also some events where an injection of cold continental air into the upper trough appeared to compensate for less moisture.
4 Literature Review Weaver (1962) categorized storms in California by synoptic pattern -storm classification focused on longitude of blocking high -identified three types + low-latitude type + high-latitude type + mid-latitude type Ferber et al (1993) characterized snowstorms over the Pugent Sound Lowlands using composites of basic meteorological fields such as 500 mb geopotential heights Mitchell and Blier (1997) -correlated California wintertime monthly mean precipitation variability and regional 500 mb height and sea level pressure anomalies -reconstructed 500 mb height and sea level pressure fields that were representative of the extreme wet and dry California winter months -however, examination of individual extreme wet and dry months showed several flow patterns were capable to producing anomalously large monthly precipitation totals in California
5 Precipitation data examined to identify heavy rain events within each climatic zone
6 Climatic Divisions
7 Arbitrary values selected as criteria for identifying heavy precipitation for three classes of events Classification I required at least 3 stations in the selected basin to have received >3.0 inches of liquid equivalent precipitation in one day Classification II required at least 3 stations in the selected basin to have received >6.0 inches of liquid equivalent precipitation in two consecutive days Classification III defined the same as class II with the added stipulation that at least one station received >10.0 inches in two consecutive days No attempt to account for basin geometry or antecedent soil conditions, both of which can affect impact of a given amount of precipitation
8 Precipitation data generally available from the 1940s to 1997 NCEP gridded analyses available from 1949 to 1994 Generally looked at 500 mb geopotential heights and sea level pressure since these were widely available Initial time assigned to each event was 1200 UTC of the day the criteria were met for classification I and 1200 UTC of the first of the two consecutive days where the criteria were met in classifications II and III Initial time used to tie each event to the associated 500 mb and sea level pressure fields Fields were composited using a program called DeCep (LeBlang 2001)
9 Frequency ranged from about 2 events/year in the South Coast to 5 events/year for the Sacramento Basin Nearly all events occurred in the cool season Oct-Apr with the highest frequency in Jan
10 Some of the main features seen in the following slides include one or more of the following: Moderate to strong westerly flow across the Pacific Ocean into California Moderate to strong westerly flow across the Pacific under a blocking high in the vicinity of Alaska A large scale upper level trough or closed low off the Pacific Northwest/British Columbia coast into the Gulf of Alaska with southwesterly flow into California An equatorward displacement of the upper jet, especially in the South Coast cases A sea level low pressure area was generally present along the west coast of North America in the vicinity of the Pacific Northwest or British Columbia, with varying pressure gradient strength across California
11 South Coast Distribution Southern California Coast (Cases with 3+ stations >3.0 in/24h) Series JUL AUG SEP OCT NOV DEC JAN FEB MAR APR MAY JUN
12 North Coast Distribution North Coast distribution for cases with precip > 3inches/24hrs Series JUL AUG SEP OCT NOV DEC JAN FEB MAR APR MAY JUN
13 Sacramento Distribution Sacramento distribution for cases with precip > 3inches/24hrs Series JUL AUG SEP OCT NOV DEC JAN FEB MAR APR MAY JUN
14 mb 1-1 SLP 60% mb 1-2 SLP 15% mb 1-3 SLP 20% mb 1-4 SLP 5%
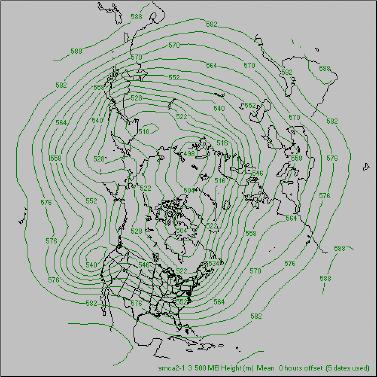
15 South Coast category I type 1 composite 500 mb heights
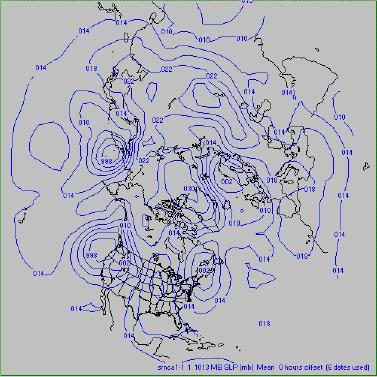
16 South Coast category I type 1 composite sea level pressure
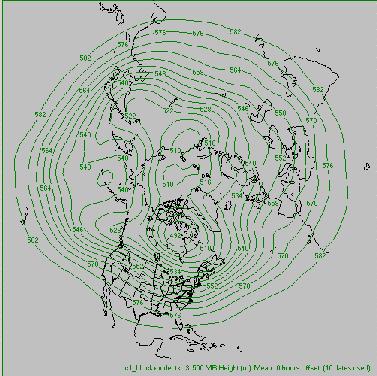
17 South Coast category I type 2 composite 500 mb heights
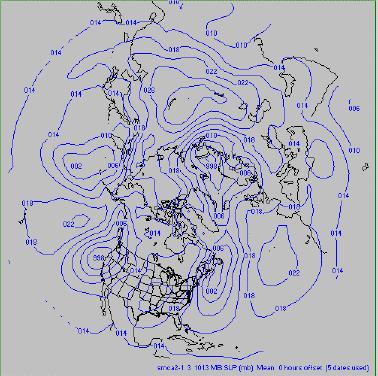
18 South Coast category I type 2 composite sea level pressure
19 South Coast category I type 3 composite 500 mb heights
20 South Coast category I type 3 composite sea level pressure

21 South Coast category I type 4 composite 500 mb heights

22 South Coast category I type 4 composite sea level pressure
23 mb 1-1 SLP 10% mb 1-2 SLP 10% mb 1-3 SLP 33% mb 1-4 SLP 33% mb 1-5 SLP 15%

24 North Coast category I type 1 composite 500 mb heights

25 North Coast category I type 1 composite sea level pressure

26 North Coast category I type 2 composite 500 mb heights

27 North Coast category I type 2 composite sea level pressure

28 North Coast category I type 3 composite 500 mb heights

29 North Coast category I type 3 composite sea level pressure

30 North Coast category I type 4 composite 500 mb heights

31 North Coast category I type 4 composite sea level pressure

32 North Coast category I type 5 composite 500 mb heights

33 North Coast category I type 5 composite sea level pressure
34 mb 1-1 SLP 20% mb 1-2 SLP 20% mb 1-3 SLP 10% mb 1-4 SLP 30% mb 1-5 SLP 10% mb 1-6 SLP 5%

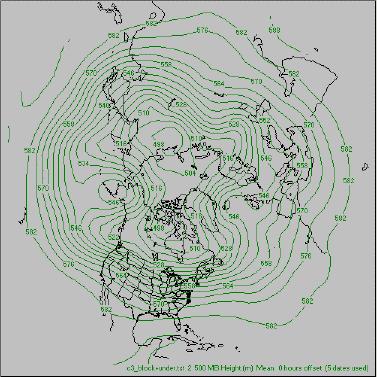
35 Sacramento category I type 1 composite 500 mb heights

36 Sacramento category I type 1 composite sea level pressure

37 Sacramento category I type 2 composite 500 mb heights

38 Sacramento category I type 2 composite sea level pressure

39 Sacramento category I type 3 composite 500 mb heights

40 Sacramento category I type 3 composite sea level pressure

41 Sacramento category I type 4 composite 500 mb heights

42 Sacramento category I type 4 composite sea level pressure

43 Sacramento category I type 5 composite 500 mb heights

44 Sacramento category I type 5 composite sea level pressure

45 Sacramento category I type 6 composite 500 mb heights

46 Sacramento category I type 6 composite sea level pressure
47 Most events were associated with one or more of the following synoptic characteristics: An upper trough or low near the coast of BC or the Pacific Northwest Moderate to strong low amplitude westerly flow across the Pacific, often undercutting a blocking high
48 The Sacramento Basin produced more cases than the other two basins, with many cases depicting ill-defined or weak synoptic patterns Many of the extreme events (classification III) that were accompanied by significant flooding were associated with strong low latitude westerly flow undercutting a blocking high in the Pacific These events are frequently related to the Madden-Julien Oscillation and often referred to as the Pineapple Express - Weaver referred to these events as the low latitude type
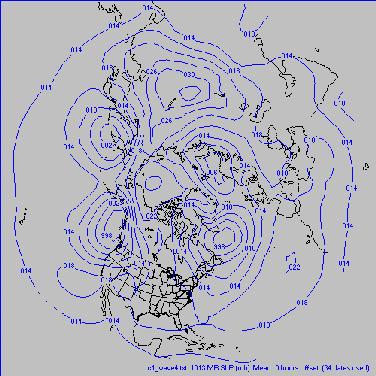
49 A 4-wave hemispheric pattern was associated with many events, mainly in Northern California Precipitation in some events appeared to be enhanced by an injection of cold continental air into the trough (implying increased baroclinicity and a reduction in static stability) Heavier events were usually associated with deeper systems, which tended to tap subtropical moisture and increase orographics- This is illustrated through composites of categories I and II for events with westerly flow and events with troughing for the Sacramento cases
 700 mb")
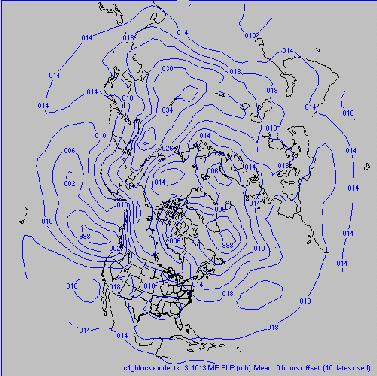
50 Category I composite for westerly flow cases (Sacramento) 700 mb heights
 700 mb")
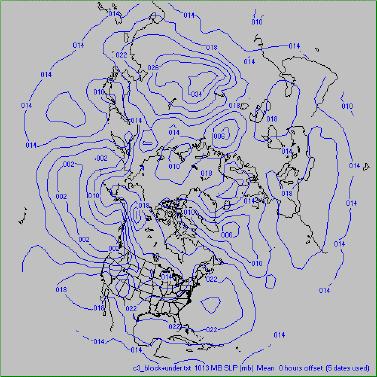
51 Category II composite for westerly flow cases (Sacramento) 700 mb heights
52 Notice the following characteristics evident from the 700 mb heights in the category II westerly flow cases: the heights are displaced southward implying moisture advection from the subtropics a tighter gradient is indicated through California, implying stronger orographics there is a stronger block near the Western Aleutians, with a colder trajectory flowing into the Gulf of Alaska this implies stronger baroclinicity along the Pacific Coast
 700")
53 Category I composite for troughing cases (Sacramento) 700 mb heights
 700")
54 Category I I composite for troughing cases (Sacramento) 700 mb heights
55 From the 700 mb heights in the category I and II troughing cases: There is a colder trajectory into the western side of the trough in the category II cases implying stronger baroclinicity near California The upper low is deeper in the category II cases across Western B.C. and the gradient is tighter across California, implying stronger orographics
56 South Coast mb 1-1 SLP mb 1-2 SLP mb 1-3 SLP mb 1-4 SLP North Coast mb 1-1 SLP mb 1-2 SLP mb 1-3 SLP mb 94 SLP mb 1-4 SLP mb 1-5 SLP Sacramento mb 1-1 SLP mb 86 SLP mb 1-2 SLP mb 1-3 SLP mb 1-4 SLP mb 1-5 SLP mb 1-6 SLP
57 You haven t shown much in the way of your type II cases. Can you show an example of type I vs type II?

58
59
60
61
62
63 Doesn t a composite field smooth out all of the interesting features?


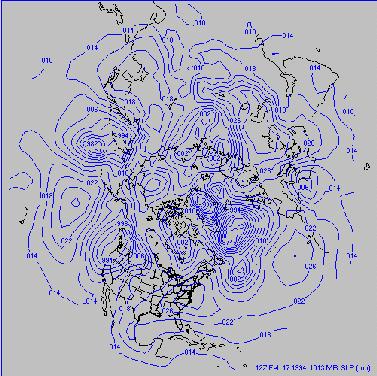
64 North Coast Type 3 Example 17 February mb Heights
65
66
67 Type I loop mb SLP 2/16/86 loop mb SLP
68 References Ferber G.K., C.F. Mass, G.M. Lackman, and M.W. Patnoe, 1993: Snowstorms over the Pugent Sound Lowlands. Wea. and Forecasting, 8, Leblang, R., 2001: DeCep windows software for displaying NCEP gridded analyses. Beta version. Mitchell T.P., Blier W., 1997: The Variability of Wintertime Precipitation in the Region of California, J. Climate, 10, Weaver, R. L., 1962: Meteorology of Hydrologically Critical Storms in California. U.S. Weather Bureau, Hydrologic Services Division, Hydrol. Rep. No.37, Washington D.C., 207 pp.
Impacts of the April 2013 Mean trough over central North America
 Impacts of the April 2013 Mean trough over central North America By Richard H. Grumm National Weather Service State College, PA Abstract: The mean 500 hpa flow over North America featured a trough over
Monthly Long Range Weather Commentary Issued: APRIL 18, 2017 Steven A. Root, CCM, Chief Analytics Officer, Sr. VP,
 Monthly Long Range Weather Commentary Issued: APRIL 18, 2017 Steven A. Root, CCM, Chief Analytics Officer, Sr. VP, sroot@weatherbank.com MARCH 2017 Climate Highlights The Month in Review The average contiguous
Climate Variability. Eric Salathé. Climate Impacts Group & Department of Atmospheric Sciences University of Washington. Thanks to Nathan Mantua
 Climate Variability Eric Salathé Climate Impacts Group & Department of Atmospheric Sciences University of Washington Thanks to Nathan Mantua Northwest Climate: the mean Factors that influence local/regional
Presentation Overview. Southwestern Climate: Past, present and future. Global Energy Balance. What is climate?
 Southwestern Climate: Past, present and future Mike Crimmins Climate Science Extension Specialist Dept. of Soil, Water, & Env. Science & Arizona Cooperative Extension The University of Arizona Presentation
Satellites, Weather and Climate Module??: Polar Vortex
 Satellites, Weather and Climate Module??: Polar Vortex SWAC Jan 2014 AKA Circumpolar Vortex Science or Hype? Will there be one this year? Today s objectives Pre and Post exams What is the Polar Vortex
Charles Jones ICESS University of California, Santa Barbara CA Outline
 The Influence of Tropical Variations on Wintertime Precipitation in California: Pineapple express, Extreme rainfall Events and Long-range Statistical Forecasts Charles Jones ICESS University of California,
Chiang Rai Province CC Threat overview AAS1109 Mekong ARCC
 Chiang Rai Province CC Threat overview AAS1109 Mekong ARCC This threat overview relies on projections of future climate change in the Mekong Basin for the period 2045-2069 compared to a baseline of 1980-2005.
ENSO UPDATE By Joseph D Aleo, CCM
 ENSO UPDATE By Joseph D Aleo, CCM El Nino is still hanging on but likely not for very long. Warmer than normal water can still be seen along the equator in the tropical Pacific. It is even warmer in the
ACCUMULATED PRECIPITATION IN INCHES
 4 3 CUMULATIVE PRECIPITATION WATER YEAR 7 COLUMBIA BASIN ABOVE GRAND COULEE 18% of Normal 1971- Average ACCUMULATED PRECIPITATION IN INCHES 1 3 1 4 3 1 8 6 4 94% of Normal 17% of Normal 118% of Normal
Weather and Climate Summary and Forecast Winter
 Weather and Climate Summary and Forecast Winter 2016-17 Gregory V. Jones Southern Oregon University February 7, 2017 What a difference from last year at this time. Temperatures in January and February
Global Climates. Name Date
 Global Climates Name Date No investigation of the atmosphere is complete without examining the global distribution of the major atmospheric elements and the impact that humans have on weather and climate.
Analysis of Fall Transition Season (Sept-Early Dec) Why has the weather been so violent?
 Why has the weather been so violent?") WEATHER TOPICS Analysis of Fall Transition Season (Sept-Early Dec) 2009 Why has the weather been so violent? As can be seen by the following forecast map, the Fall Transition and early Winter Season of
WEATHER TOPICS Analysis of Fall Transition Season (Sept-Early Dec) 2009 Why has the weather been so violent? As can be seen by the following forecast map, the Fall Transition and early Winter Season of
Monthly Long Range Weather Commentary Issued: APRIL 1, 2015 Steven A. Root, CCM, President/CEO
 Monthly Long Range Weather Commentary Issued: APRIL 1, 2015 Steven A. Root, CCM, President/CEO sroot@weatherbank.com FEBRUARY 2015 Climate Highlights The Month in Review The February contiguous U.S. temperature
Monthly Long Range Weather Commentary Issued: February 15, 2015 Steven A. Root, CCM, President/CEO
 Monthly Long Range Weather Commentary Issued: February 15, 2015 Steven A. Root, CCM, President/CEO sroot@weatherbank.com JANUARY 2015 Climate Highlights The Month in Review During January, the average
P2.4 THE IMPACT OF TROPICAL CYCLONE REMNANTS ON THE RAINFALL OF THE NORTH AMERICAN SOUTHWEST REGION
 P2.4 THE IMPACT OF TROPICAL CYCLONE REMNANTS ON THE RAINFALL OF THE NORTH AMERICAN SOUTHWEST REGION by Elizabeth A. Ritchie 1 and David Szenasi University of New Mexico 1. INTRODUCTION New Mexico has a
The Climate of Oregon Climate Zone 4 Northern Cascades
 /05 E55 Unbound issue No. 9/ is Does not circulate Special Report 916 May 1993 The Climate of Oregon Climate Zone 4 Property of OREGON STATE UNIVERSITY Library Serials Corvallis, OR 97331-4503 Agricultural
YACT (Yet Another Climate Tool)? The SPI Explorer
? The SPI Explorer") YACT (Yet Another Climate Tool)? The SPI Explorer Mike Crimmins Assoc. Professor/Extension Specialist Dept. of Soil, Water, & Environmental Science The University of Arizona Yes, another climate tool for
YACT (Yet Another Climate Tool)? The SPI Explorer Mike Crimmins Assoc. Professor/Extension Specialist Dept. of Soil, Water, & Environmental Science The University of Arizona Yes, another climate tool for
Climatography of the United States No
 Climate Division: AK 5 NWS Call Sign: ANC Month (1) Min (2) Month(1) Extremes Lowest (2) Temperature ( F) Lowest Month(1) Degree s (1) Base Temp 65 Heating Cooling 90 Number of s (3) Jan 22.2 9.3 15.8
SEPTEMBER 2013 REVIEW
 Monthly Long Range Weather Commentary Issued: October 21, 2013 Steven A. Root, CCM, President/CEO sroot@weatherbank.com SEPTEMBER 2013 REVIEW Climate Highlights The Month in Review The average temperature
Early May Cut-off low and Mid-Atlantic rains
 Abstract: Early May Cut-off low and Mid-Atlantic rains By Richard H. Grumm National Weather Service State College, PA A deep 500 hpa cutoff developed in the southern Plains on 3 May 2013. It produced a
Wind: Global Systems Chapter 10
 Wind: Global Systems Chapter 10 General Circulation of the Atmosphere General circulation of the atmosphere describes average wind patterns and is useful for understanding climate Over the earth, incoming
National Weather Service-Pennsylvania State University Weather Events
 National Weather Service-Pennsylvania State University Weather Events Abstract: West Coast Heavy Precipitation Event of January 2012 by Richard H. Grumm National Weather Service State College PA 16803
North Pacific Climate Overview N. Bond (UW/JISAO), J. Overland (NOAA/PMEL) Contact: Last updated: September 2008
, J. Overland (NOAA/PMEL) Contact: Last updated: September 2008") North Pacific Climate Overview N. Bond (UW/JISAO), J. Overland (NOAA/PMEL) Contact: Nicholas.Bond@noaa.gov Last updated: September 2008 Summary. The North Pacific atmosphere-ocean system from fall 2007
North Pacific Climate Overview N. Bond (UW/JISAO), J. Overland (NOAA/PMEL) Contact: Nicholas.Bond@noaa.gov Last updated: September 2008 Summary. The North Pacific atmosphere-ocean system from fall 2007
ACCUMULATED PRECIPITATION IN INCHES
 CUMULATIVE PRECIPITATION WATER YEAR COLUMBIA BASIN ABOVE GRAND COULEE 84% of Normal 1971- Average ACCUMULATED PRECIPITATION IN INCHES 8 6 82% of Normal 85% of Normal 82% of Normal SNAKE RIVER BASIN ABOVE
OVERVIEW OF IMPROVED USE OF RS INDICATORS AT INAM. Domingos Mosquito Patricio
 OVERVIEW OF IMPROVED USE OF RS INDICATORS AT INAM Domingos Mosquito Patricio domingos.mosquito@gmail.com Introduction to Mozambique /INAM Introduction to AGRICAB/SPIRITS Objectives Material & Methods Results
Summary report for Ruamāhanga Whaitua Committee The climate of the Ruamāhanga catchment
 Summary report for Ruamāhanga Whaitua Committee The climate of the Ruamāhanga catchment The Tararua and Rimutaka ranges have a large influence on the climate of the Ruamāhanga catchment. The ranges shelter
Minnesota s Climatic Conditions, Outlook, and Impacts on Agriculture. Today. 1. The weather and climate of 2017 to date
 Minnesota s Climatic Conditions, Outlook, and Impacts on Agriculture Kenny Blumenfeld, State Climatology Office Crop Insurance Conference, Sep 13, 2017 Today 1. The weather and climate of 2017 to date
Climatography of the United States No
 Climate Division: CA 4 NWS Call Sign: Month (1) Min (2) Month(1) Extremes Lowest (2) Temperature ( F) Lowest Month(1) Degree s (1) Base Temp 65 Heating Cooling 100 Number of s (3) Jan 55.6 39.3 47.5 77
Climatography of the United States No
 Climate Division: CA 5 NWS Call Sign: Month (1) Min (2) Month(1) Extremes Lowest (2) Temperature ( F) Lowest Month(1) Degree s (1) Base Temp 65 Heating Cooling 100 Number of s (3) Jan 56.6 36.5 46.6 81
Climatography of the United States No
 Climate Division: CA 1 NWS Call Sign: Month (1) Min (2) Month(1) Extremes Lowest (2) Temperature ( F) Lowest Month(1) Degree s (1) Base Temp 65 Heating Cooling 100 Number of s (3) Jan 57.9 38.9 48.4 85
Climatography of the United States No
 Climate Division: CA 5 NWS Call Sign: Month (1) Min (2) Month(1) Extremes Lowest (2) Temperature ( F) Lowest Month(1) Degree s (1) Base Temp 65 Heating Cooling 100 Number of s (3) Jan 44.8 25.4 35.1 72
Climatography of the United States No
 Climate Division: CA 4 NWS Call Sign: Month (1) Min (2) Month(1) Extremes Lowest (2) Temperature ( F) Lowest Month(1) Degree s (1) Base Temp 65 Heating Cooling 100 Number of s (3) Jan 49.4 37.5 43.5 73
Climatography of the United States No
 Climate Division: CA 6 NWS Call Sign: Month (1) Min (2) Month(1) Extremes Lowest (2) Temperature ( F) Lowest Month(1) Degree s (1) Base Temp 65 Heating Cooling 100 Number of s (3) Jan 69.4 46.6 58.0 92
Climatography of the United States No
 Climate Division: CA 4 NWS Call Sign: Month (1) Min (2) Month(1) Extremes Lowest (2) Temperature ( F) Lowest Month(1) Degree s (1) Base Temp 65 Heating Cooling 1 Number of s (3) Jan 58.5 38.8 48.7 79 1962
Climatography of the United States No
 Climate Division: CA 6 NWS Call Sign: Month (1) Min (2) Month(1) Extremes Lowest (2) Temperature ( F) Lowest Month(1) Degree s (1) Base Temp 65 Heating Cooling 1 Number of s (3) Jan 67.5 42. 54.8 92 1971
Climatography of the United States No
 Climate Division: CA 1 NWS Call Sign: Month (1) Min (2) Month(1) Extremes Lowest (2) Temperature ( F) Lowest Month(1) Degree s (1) Base Temp 65 Heating Cooling 1 Number of s (3) Jan 57.8 39.5 48.7 85 1962
Synoptic and mesoscale analysis of waterspouts in the Adriatic ( preliminary climatology)
") Synoptic and mesoscale analysis of waterspouts in the Adriatic (2001-2011 preliminary climatology) Josipa Kuzmić 1, Tanja Renko 1, Nataša Strelec Mahović 1 1 Meteorological and Hydrological Service of
Synoptic and mesoscale analysis of waterspouts in the Adriatic (2001-2011 preliminary climatology) Josipa Kuzmić 1, Tanja Renko 1, Nataša Strelec Mahović 1 1 Meteorological and Hydrological Service of
Climatography of the United States No
 Climate Division: ND 8 NWS Call Sign: BIS Month (1) Min (2) Month(1) Extremes Lowest (2) Temperature ( F) Lowest Month(1) Degree s (1) Base Temp 65 Heating Cooling 100 Number of s (3) Jan 21.1 -.6 10.2
Climatography of the United States No
 Climate Division: TN 1 NWS Call Sign: Month (1) Min (2) Month(1) Extremes Lowest (2) Temperature ( F) Lowest Month(1) Degree s (1) Base Temp 65 Heating Cooling 100 Number of s (3) Jan 47.6 24.9 36.3 81
Climatography of the United States No
 Climate Division: CA 5 NWS Call Sign: FAT Month (1) Min (2) Month(1) Extremes Lowest (2) Temperature ( F) Lowest Month(1) Degree s (1) Base Temp 65 Heating Cooling 1 Number of s (3) Jan 53.6 38.4 46. 78
Climatography of the United States No
 Climate Division: CA 6 NWS Call Sign: 1L2 N Lon: 118 3W Month (1) Min (2) Month(1) Extremes Lowest (2) Temperature ( F) Lowest Month(1) Degree s (1) Base Temp 65 Heating Cooling 1 Number of s (3) Jan 63.7
ENSO Outlook by JMA. Hiroyuki Sugimoto. El Niño Monitoring and Prediction Group Climate Prediction Division Japan Meteorological Agency
 ENSO Outlook by JMA Hiroyuki Sugimoto El Niño Monitoring and Prediction Group Climate Prediction Division Outline 1. ENSO impacts on the climate 2. Current Conditions 3. Prediction by JMA/MRI-CGCM 4. Summary
California 120 Day Precipitation Outlook Issued Tom Dunklee Global Climate Center
 California 120 Day Precipitation Outlook Issued 11-01-2008 Tom Dunklee Global Climate Center This is my second updated outlook for precipitation patterns and amounts for the next 4 s of the current rainy
UPDATE OF REGIONAL WEATHER AND SMOKE HAZE (December 2017)
") UPDATE OF REGIONAL WEATHER AND SMOKE HAZE (December 2017) 1. Review of Regional Weather Conditions for November 2017 1.1 In November 2017, Southeast Asia experienced inter-monsoon conditions in the first
UPDATE OF REGIONAL WEATHER AND SMOKE HAZE (December 2017) 1. Review of Regional Weather Conditions for November 2017 1.1 In November 2017, Southeast Asia experienced inter-monsoon conditions in the first
2015: A YEAR IN REVIEW F.S. ANSLOW
 2015: A YEAR IN REVIEW F.S. ANSLOW 1 INTRODUCTION Recently, three of the major centres for global climate monitoring determined with high confidence that 2015 was the warmest year on record, globally.
Climatography of the United States No
 Climate Division: CA 5 NWS Call Sign: BFL Month (1) Min (2) Month(1) Extremes Lowest (2) Temperature ( F) Lowest Month(1) Degree s (1) Base Temp 65 Heating Cooling 1 Number of s (3) Jan 56.3 39.3 47.8
Winter Steve Todd Meteorologist In Charge National Weather Service Portland, OR
 Winter 07-08 Steve Todd Meteorologist In Charge National Weather Service Portland, OR Overview Winter Weather Outlook How to stay informed Winter Outlook LaNina conditions are present across the tropical
David W. Reynolds * National Weather Service WFO San Francisco Bay Area Monterey, CA
 3.2 THE MADDEN JULIAN OSCILLATION: ITS POTENTIAL FOR WEEK TWO FLOOD OUTLOOKS AND RESERVOIR MANAGEMENT DECISIONS IN CALIFORNIA David W. Reynolds * National Weather Service WFO San Francisco Bay Area Monterey,
Climatography of the United States No
 Climate Division: TN 3 NWS Call Sign: BNA Month (1) Min (2) Month(1) Extremes Lowest (2) Temperature ( F) Lowest Month(1) Degree s (1) Base Temp 65 Heating Cooling 100 Number of s (3) Jan 45.6 27.9 36.8
2015 Fall Conditions Report
 2015 Fall Conditions Report Prepared by: Hydrologic Forecast Centre Date: December 21 st, 2015 Table of Contents Table of Figures... ii EXECUTIVE SUMMARY... 1 BACKGROUND... 2 SUMMER AND FALL PRECIPITATION...
Local Ctimatotogical Data Summary White Hall, Illinois
 SWS Miscellaneous Publication 98-5 STATE OF ILLINOIS DEPARTMENT OF ENERGY AND NATURAL RESOURCES Local Ctimatotogical Data Summary White Hall, Illinois 1901-1990 by Audrey A. Bryan and Wayne Armstrong Illinois
Key Findings & Implications
 A Tree-Ring Based Assessment of Synchronous Extreme Streamflow Episodes in the Upper Colorado & Salt-Verde-Tonto River Basins Key Findings & Implications August 10, 2005 Workshop A Collaborative Project
Climatography of the United States No
 Climate Division: CA 5 NWS Call Sign: Elevation: 6 Feet Lat: 37 Month (1) Min (2) Month(1) Extremes Lowest (2) Temperature ( F) Lowest Month(1) Degree s (1) Base Temp 65 Heating Cooling 1 Number of s (3)
Climatography of the United States No
 Climate Division: CA 4 NWS Call Sign: Elevation: 2 Feet Lat: 37 Month (1) Min (2) Month(1) Extremes Lowest (2) Temperature ( F) Lowest Month(1) Degree s (1) Base Temp 65 Heating Cooling 1 Number of s (3)
Climatography of the United States No
 Climate Division: CA 4 NWS Call Sign: Elevation: 13 Feet Lat: 36 Month (1) Min (2) Month(1) Extremes Lowest (2) Temperature ( F) Lowest Month(1) Degree s (1) Base Temp 65 Heating Cooling 1 Number of s
Climatography of the United States No
 Climate Division: CA 5 NWS Call Sign: Elevation: 1,14 Feet Lat: 36 Month (1) Min (2) Month(1) Extremes Lowest (2) Temperature ( F) Lowest Month(1) Degree s (1) Base Temp 65 Heating Cooling 1 Number of
Winter Forecast. Allan Huffman RaleighWx
 Winter 2015-16 Forecast Allan Huffman RaleighWx Disclaimer Seasonal forecasting is difficult and you are always learning. I attempt to look at all factors I understand and have seen correlate in the past
Global Atmospheric Circulation
 Global Atmospheric Circulation Polar Climatology & Climate Variability Lecture 11 Nov. 22, 2010 Global Atmospheric Circulation Global Atmospheric Circulation Global Atmospheric Circulation The Polar Vortex
The North Atlantic Oscillation: Climatic Significance and Environmental Impact
 1 The North Atlantic Oscillation: Climatic Significance and Environmental Impact James W. Hurrell National Center for Atmospheric Research Climate and Global Dynamics Division, Climate Analysis Section
Delayed Response of the Extratropical Northern Atmosphere to ENSO: A Revisit *
 Delayed Response of the Extratropical Northern Atmosphere to ENSO: A Revisit * Ruping Mo Pacific Storm Prediction Centre, Environment Canada, Vancouver, BC, Canada Corresponding author s address: Ruping
Climatography of the United States No
 Climate Division: CA 6 NWS Call Sign: LAX Elevation: 1 Feet Lat: 33 Month (1) Min (2) Month(1) Extremes Lowest (2) Temperature ( F) Lowest Month(1) Degree s (1) Base Temp 65 Heating Cooling 1 Number of
Climatography of the United States No
 Climate Division: CA 6 NWS Call Sign: TOA Elevation: 11 Feet Lat: 33 2W Temperature ( F) Month (1) Min (2) Month(1) Extremes Lowest (2) Lowest Month(1) Degree s (1) Base Temp 65 Heating Cooling 1 Number
Lecture 5: Atmospheric General Circulation and Climate
 Lecture 5: Atmospheric General Circulation and Climate Geostrophic balance Zonal-mean circulation Transients and eddies Meridional energy transport Moist static energy Angular momentum balance Atmosphere
Climatography of the United States No
 Climate Division: CA 6 NWS Call Sign: Month (1) Min (2) Month(1) Extremes Lowest (2) Temperature ( F) Lowest Month(1) Degree s (1) Base Temp 65 Heating Cooling 100 Number of s (3) Jan 51.5 35.0 43.3 80
ENSO Cycle: Recent Evolution, Current Status and Predictions. Update prepared by Climate Prediction Center / NCEP 23 April 2012
 ENSO Cycle: Recent Evolution, Current Status and Predictions Update prepared by Climate Prediction Center / NCEP 23 April 2012 Outline Overview Recent Evolution and Current Conditions Oceanic Niño Index
Climatography of the United States No
 Climate Division: CA 5 NWS Call Sign: Month (1) Min (2) Month(1) Extremes Lowest (2) Temperature ( F) Lowest Month(1) Degree s (1) Base Temp 65 Heating Cooling 100 Number of s (3) 59.3 31.5 45.4 80 1976
Climatography of the United States No
 Climate Division: CA 7 NWS Call Sign: Month (1) Min (2) Month(1) Extremes Lowest (2) Temperature ( F) Lowest Month(1) Degree s (1) Base Temp 65 Heating Cooling 100 Number of s (3) 44.5 29.3 36.9 69 1951
Climatography of the United States No
 Climate Division: CA 2 NWS Call Sign: Month (1) Min (2) Month(1) Extremes Lowest (2) Temperature ( F) Lowest Month(1) Degree s (1) Base Temp 65 Heating Cooling 100 Number of s (3) 53.3 37.1 45.2 77 1962
Climatography of the United States No
 Climate Division: CA 2 NWS Call Sign: Month (1) Min (2) Month(1) Extremes Lowest (2) Temperature ( F) Lowest Month(1) Degree s (1) Base Temp 65 Heating Cooling 100 Number of s (3) 53.3 31.8 42.6 74+ 1975
Climatography of the United States No
 Climate Division: CA 2 NWS Call Sign: Month (1) Min (2) Month(1) Extremes Lowest (2) Temperature ( F) Lowest Month(1) Degree s (1) Base Temp 65 Heating Cooling 100 Number of s (3) 53.7 32.7 43.2 79 1962
Climatography of the United States No
 Climate Division: CA 6 NWS Call Sign: Month (1) Min (2) Month(1) Extremes Lowest (2) Temperature ( F) Lowest Month(1) Degree s (1) Base Temp 65 Heating Cooling 100 Number of s (3) 68.5 45.7 57.1 90 1971
Climatography of the United States No
 Climate Division: CA 7 NWS Call Sign: Month (1) Min (2) Month(1) Extremes Lowest (2) Temperature ( F) Lowest Month(1) Degree s (1) Base Temp 65 Heating Cooling 100 Number of s (3) 56.0 35.7 45.9 83 1975
Climatography of the United States No
 Climate Division: CA 7 NWS Call Sign: Month (1) Min (2) Month(1) Extremes Lowest (2) Temperature ( F) Lowest Month(1) Degree s (1) Base Temp 65 Heating Cooling 1 Number of s (3) 65.5 38.7 52.1 87 1962
Climatography of the United States No
 Climate Division: CA 7 NWS Call Sign: Month (1) Min (2) Month(1) Extremes Lowest (2) Temperature ( F) Lowest Month(1) Degree s (1) Base Temp 65 Heating Cooling 1 Number of s (3) 64.8 45.4 55.1 85 1971
Climatography of the United States No
 Climate Division: CA 7 NWS Call Sign: Month (1) Min (2) Month(1) Extremes Lowest (2) Temperature ( F) Lowest Month(1) Degree s (1) Base Temp 65 Heating Cooling 100 Number of s (3) 58.8 34.3 46.6 81+ 1948
Climatography of the United States No
 Climate Division: CA 1 NWS Call Sign: Month (1) Min (2) Month(1) Extremes Lowest (2) Temperature ( F) Lowest Month(1) Degree s (1) Base Temp 65 Heating Cooling 100 Number of s (3) Jan 52.4 35.4 43.9 69
Climatography of the United States No
 Climate Division: CA 7 NWS Call Sign: Month (1) Min (2) Month(1) Extremes Lowest (2) Temperature ( F) Lowest Month(1) Degree s (1) Base Temp 65 Heating Cooling 100 Number of s (3) 70.4 44.2 57.3 95 1971
Climatography of the United States No
 No. 2 1971-2 Asheville, North Carolina 2881 COOP ID: 46646 Climate Division: CA 4 NWS Call Sign: 8W Month (1) Min (2) Month(1) Extremes Lowest (2) Temperature ( F) Lowest Month(1) Degree s (1) Base Temp
Climatography of the United States No
 No. 2 1971-2 Asheville, North Carolina 2881 COOP ID: 4792 Climate Division: CA 6 NWS Call Sign: Month (1) Min (2) Month(1) Extremes Lowest (2) Temperature ( F) Lowest Month(1) Degree s (1) Base Temp 65
Climatography of the United States No
 Climate Division: CA 4 NWS Call Sign: Month (1) Min (2) Month(1) Extremes Lowest (2) Temperature ( F) Lowest Month(1) Degree s (1) Base Temp 65 Heating Cooling 100 Number of s (3) Jan 61.9 42.0 52.0 89
Climatography of the United States No
 Climate Division: CA 2 NWS Call Sign: Month (1) Min (2) Month(1) Extremes Lowest (2) Temperature ( F) Lowest Month(1) Degree s (1) Base Temp 65 Heating Cooling 100 Number of s (3) Jan 55.6 38.8 47.2 81
Climatography of the United States No
 Climate Division: CA 2 NWS Call Sign: Month (1) Min (2) Month(1) Extremes Lowest (2) Temperature ( F) Lowest Month(1) Degree s (1) Base Temp 65 Heating Cooling 100 Number of s (3) Jan 53.5 37.6 45.6 78
Climatography of the United States No
 Climate Division: CA 6 NWS Call Sign: Month (1) Min (2) Month(1) Extremes Lowest (2) Temperature ( F) Lowest Month(1) Degree s (1) Base Temp 65 Heating Cooling 100 Number of s (3) Jan 66.1 38.3 52.2 91
Climatography of the United States No
 Climate Division: CA 1 NWS Call Sign: Month (1) Min (2) Month(1) Extremes Lowest (2) Temperature ( F) Lowest Month(1) Degree s (1) Base Temp 65 Heating Cooling 1 Number of s (3) Jan 56.2 4.7 48.5 79 1962
Climatography of the United States No
 Climate Division: CA 1 NWS Call Sign: Month (1) Min (2) Month(1) Extremes Lowest (2) Temperature ( F) Lowest Month(1) Degree s (1) Base Temp 65 Heating Cooling 100 Number of s (3) Jan 50.2 31.2 40.7 65+
Climatography of the United States No
 Climate Division: CA 4 NWS Call Sign: Month (1) Min (2) Month(1) Extremes Lowest (2) Temperature ( F) Lowest Month(1) Degree s (1) Base Temp 65 Heating Cooling 100 Number of s (3) Jan 61.4 33.1 47.3 82+
DEPARTMENT OF EARTH & CLIMATE SCIENCES Name SAN FRANCISCO STATE UNIVERSITY Nov 29, ERTH 360 Test #2 200 pts
 DEPARTMENT OF EARTH & CLIMATE SCIENCES Name SAN FRANCISCO STATE UNIVERSITY Nov 29, 2018 ERTH 360 Test #2 200 pts Each question is worth 4 points. Indicate your BEST CHOICE for each question on the Scantron
Climatography of the United States No
 Climate Division: CA 7 NWS Call Sign: Month (1) Min (2) Month(1) Extremes Lowest (2) Temperature ( F) Lowest Month(1) Degree s (1) Base Temp 65 Heating Cooling 100 Number of s (3) Jan 54.4 36.9 45.7 77+
Verification of the Seasonal Forecast for the 2005/06 Winter
 Verification of the Seasonal Forecast for the 2005/06 Winter Shingo Yamada Tokyo Climate Center Japan Meteorological Agency 2006/11/02 7 th Joint Meeting on EAWM Contents 1. Verification of the Seasonal
Seasonal Climate Watch February to June 2018
 Seasonal Climate Watch February to June 2018 Date issued: Jan 26, 2018 1. Overview The El Niño-Southern Oscillation (ENSO) is expected to remain in a weak La Niña phase through to early autumn (Feb-Mar-Apr).
Climatography of the United States No
 No. 2 1971-2 Asheville, North Carolina 2881 COOP ID: 43417 Climate Division: CA 4 NWS Call Sign: N Lon: 121 Month (1) Min (2) Month(1) Extremes Lowest (2) Temperature ( F) Lowest Month(1) Degree s (1)
Climatography of the United States No
 No. 2 1971-2 Asheville, North Carolina 2881 COOP ID: 4795 Climate Division: CA 6 NWS Call Sign: SBA Month (1) Min (2) Month(1) Extremes Lowest (2) Temperature ( F) Lowest Month(1) Degree s (1) Base Temp
North Pacific Climate Overview N. Bond (UW/JISAO), J. Overland (NOAA/PMEL) Contact: Last updated: August 2009
, J. Overland (NOAA/PMEL) Contact: Last updated: August 2009") North Pacific Climate Overview N. Bond (UW/JISAO), J. Overland (NOAA/PMEL) Contact: Nicholas.Bond@noaa.gov Last updated: August 2009 Summary. The North Pacific atmosphere-ocean system from fall 2008 through
North Pacific Climate Overview N. Bond (UW/JISAO), J. Overland (NOAA/PMEL) Contact: Nicholas.Bond@noaa.gov Last updated: August 2009 Summary. The North Pacific atmosphere-ocean system from fall 2008 through
Pre-Christmas Warm-up December 2013-Draft
 Pre-Christmas Warm-up 21-23 December 2013-Draft By Richard H. Grumm National Weather Service State College, PA 1. Overview A large ridge over the west-central Atlantic (Fig.1) and trough moving into eastern
1. Introduction. 2. Verification of the 2010 forecasts. Research Brief 2011/ February 2011
 Research Brief 2011/01 Verification of Forecasts of Tropical Cyclone Activity over the Western North Pacific and Number of Tropical Cyclones Making Landfall in South China and the Korea and Japan region
Predictability of Sudden Stratospheric Warmings in sub-seasonal forecast models
 Predictability of Sudden Stratospheric Warmings in sub-seasonal forecast models Alexey Karpechko Finnish Meteorological Institute with contributions from A. Charlton-Perez, N. Tyrrell, M. Balmaseda, F.
On the presence of tropical vortices over the Southeast Asian Sea- Maritime Continent region
 Technical Conference of 50 th Annual Session of Typhoon Committee 2018 On the presence of tropical vortices over the Southeast Asian Sea- Maritime Continent region Nguyen Dang-Quang 1, James Renwick 2,
Climatography of the United States No
 Climate Division: SC 7 NWS Call Sign: CHS Month (1) Min (2) Month(1) Extremes Lowest (2) Temperature ( F) Lowest Month(1) Degree s (1) Base Temp 65 Heating Cooling 100 Number of s (3) Jan 58.9 36.9 47.9
A summary of the heat episodes of June 2017
 A summary of the heat episodes of June 2017 By Richard H. Grumm and Elissa A. Smith National Weather Service State College, PA 1. Overview Over 1800 record high temperatures were set or tied during the
Life Cycle of Convective Systems over Western Colombia
 Life Cycle of Convective Systems over Western Colombia Meiry Sakamoto Uiversidade de São Paulo, São Paulo, Brazil Colombia Life Cycle of Convective Systems over Western Colombia Convective System (CS)