HYDROLOGICAL MODELING OF HIGHLY GLACIERIZED RIVER BASINS. Nina Omani, Raghavan Srinivasan, Patricia Smith, Raghupathy Karthikeyan, Gerald North
|
|
|
- Noel Morgan
- 5 years ago
- Views:
Transcription


1 HYDROLOGICAL MODELING OF HIGHLY GLACIERIZED RIVER BASINS Nina Omani, Raghavan Srinivasan, Patricia Smith, Raghupathy Karthikeyan, Gerald North
2 Problem statement Glaciers help to keep the earth cool High solar radiation reflection with albedo.8 (albedo ranges -1) Glaciers as reservoirs of fresh water Only 2% glacier cover provides more than 3% of total annual discharge in Indus river basin (Immerzeel et al., 21). Glacier compensation effect In European Alps during dry summer 23, glacier contribution was 12 times greater than normal, permitting normal hydroelectric production, whereas power production was significantly reduced elsewhere (Koboltschnig et al., 28).
3 Background Spatial variation of melt rates is affected by: topography (aspect, slope), ice or snow cover, climate type etc. SWAT model snow routing has been modified (SWAT212), so that the snow melt/accumulation parameters are allowed to be spatially variable in sub basins and elevation band scale Distributed temperature-index, allowing for spatially variable melt estimates (Cazorzi and Fontana, 1996; Hock, 1999; Daly et al., 2). 3
4 Objectives 1) Evaluation of SWAT s distributed snow algorithm in simulation of monthly runoff in glaciered basins 2) Extending the applied method to other river basins that are vary in climatic condition 4
5 Major steps 1) Identifying the vulnerable areas 2) Data collection 3) Modeling the glacierized area in SWAT 4) Model calibration and validation for pilot study areas vs. streamflow only vs. streamflow and glacier measurements 5) Extending the methodology to the other regions 5


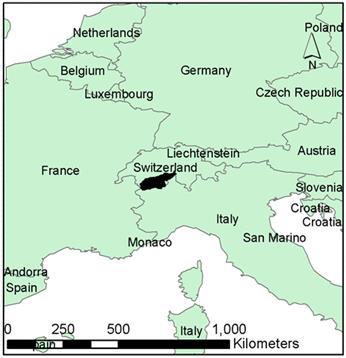
6 Study Area
7 Precipitation/Snow depth (mm) Flow (cms) Temperature (C) Precipitation (mm) Temperature (C) Flow (cms) Precipitation (mm) Flow (cms) Temperature (C) Runoff regime of the basins Upper Rhone (Switzerland) Precipitation Observed flow Temperature Jan Feb Mar Apr May Jun Jul Aug Sep Oct Nov Dec Narayani (Nepal) Precipitation at 1 m Precipitation at 3 m Observed flow Temperature Jan Feb Mar Apr May Jun Jul Aug Sep Oct Nov Dec Vakhsh, Mendoza, Chile Jan Feb Mar Apr May Jun Jul Aug Sep Oct Nov Dec Precipitation Snow depth 7 Observed flow (high glaciated) Temperature
 is zero. Parameter setting: Precipitation laps rate: controls accumulation Temperature laps late: controls melt Snow melt temperature: controls melt y = -.21x + 2864 R² =.")
8 ELA (m) Setting the climatic glacier boundary The climatic glacier boundary was set at some randomly selected subbasins Glacier climatic boundary is a synthetic line where accumulation = ablation Mass budget (Ba) is zero. Parameter setting: Precipitation laps rate: controls accumulation Temperature laps late: controls melt Snow melt temperature: controls melt y = -.21x R² =.98 Gries glacier Ba (mm w. e.) ablation accumulation
 GLIMS % Modeled Area% Narayani 1 11 Vakhsh 1 12 Upper Rhone 14 14 Mendoza - 4 Central Chile -")
9 Glacier modeling in SWAT 1 elevation bands with 1m to 25m intervals Glaciers accumulation boundary: Lowest boundary of climatic glaciation Infinite depth (1 km) GLIMS % Modeled Area% Narayani 1 11 Vakhsh 1 12 Upper Rhone Mendoza - 4 Central Chile - 4
10 Model Calibration and Validation A calibrated model can give good runoff predictions for the wrong reasons. On glaciers there are extra possibilities: mass balance and equilibrium-line altitude, besides the discharge can help constrain the values of parameters. 1) streamflow only 2) streamflow and glacier measurements Monthly flow data at 35 gauging stations. Automatic calibration tool: SWAT-CUP (Abbaspour, 22) 1
11 Effect of melt parameter distribution on simulated flow (Massa-Blatten in Rhone) SMFMX varies between 2 to 8 mm d -1 ºC -1 thorough elevation bands Glacier free bands Below 29 m Glacierized bands Over 29 m 11
12 Flow (cms) Massa-Blatten in Rhone Jan Feb Mar Apr May Jun Jul Aug Sep Oct Nov Dec Average of Observed Average of Simulated Average of Simulated (modified) 12
13 Jan Feb Mar Apr May Jun Jul Aug Sep Oct Nov Dec Flow (cms) Ba (mm w. e.) Rhone glacier (Gauged) Calibration 1: monthly flow (automatic calibration) Calibration 2: monthly flow + annual ELAs ( ) (manual parameter adjustments) Specific net mass balance 1 Rhone gauge station 1 Rhone glacier 8 6 Observed Flow calibration Flow+ELA calibration
14 Jul Aug Sep Oct Nov Dec Jan Feb Mar Apr May Jun Flow (cms) Jan-93 Sep-93 May-94 Jan-95 Sep-95 May-96 Jan-97 Sep-97 May-98 Jan-99 Sep-99 May- Jan-1 Sep-1 May-2 Jan-3 Sep-3 May-4 Jan-5 Sep-5 May-6 Jan-7 Sep-7 Flow (cms) Model accuracy in simulation of seasonal runoff was enhanced by setting the melt parameters for glaciers (high altitude elevation bands) and seasonal snow (low altitude elevation bands) separately Observed Lump model Modified model Mendoza (Colorado-Punta de Vacas)
15 Rhone Mendoza Narayani Calibration R 2 NSE PBIAS Validation lumped distributed lumped distributed lumped distributed R 2 NSE
16 Conclusions Treating the glacierized and glacier free areas separately, significantly improved the SWAT model performance in simulation of volume and seasonality of runoff in glacierized areas. Significance of meltwater is negligible where the melt season is coincidence with monsoon precipitation, so there was no significance different in the results by distributed model. This is due to dominance of rainfall-runoff model rather than the snow melt model. The results emphasized on the importance of combining even few information about the glaciers along with measured discharge data in model calibration.

17
GLACIER AND SNOWMELT MODELLING USING SWAT: GANGA BASIN CASE STUDY. INRM Consultants Pvt. Ltd.
 GLACIER AND SNOWMELT MODELLING USING SWAT: GANGA BASIN CASE STUDY INRM Consultants Pvt. Ltd. Introduction Snowmelt Runoff contribution in the Himalayan Rivers Estimation of Average contribution of Snowmelt
Changing Hydrology under a Changing Climate for a Coastal Plain Watershed
 Changing Hydrology under a Changing Climate for a Coastal Plain Watershed David Bosch USDA-ARS, Tifton, GA Jeff Arnold ARS Temple, TX and Peter Allen Baylor University, TX SEWRU Objectives 1. Project changes
GAMINGRE 8/1/ of 7
 FYE 09/30/92 JULY 92 0.00 254,550.00 0.00 0 0 0 0 0 0 0 0 0 254,550.00 0.00 0.00 0.00 0.00 254,550.00 AUG 10,616,710.31 5,299.95 845,656.83 84,565.68 61,084.86 23,480.82 339,734.73 135,893.89 67,946.95
Inter-linkage case study in Pakistan
 7 th GEOSS Asia Pacific Symposium GEOSS AWCI Parallel Session: 26-28 May, 2014, Tokyo, Japan Inter-linkage case study in Pakistan Snow and glaciermelt runoff modeling in Upper Indus Basin of Pakistan Maheswor
Hydro-meteorological Analysis of Langtang Khola Catchment, Nepal
 Hydro-meteorological Analysis of Langtang Khola Catchment, Nepal Tirtha R. Adhikari 1, Lochan P. Devkota 1, Suresh.C Pradhan 2, Pradeep K. Mool 3 1 Central Department of Hydrology and Meteorology Tribhuvan
Modeling of a River Basin Using SWAT Model and SUFI-2
 Modeling of a River Basin Using SWAT Model and SUFI-2 NINA OMANI MASOUD TAJRISHY AHMAD ABRISHAMCHI Sharif University of Technology, Tehran, Iran Karkheh Dam, Iran 1 Area of Gharasu Sub-basin : 5793 km2
Climate Change Impact Assessment on Indian Water Resources. Ashvin Gosain, Sandhya Rao, Debajit Basu Ray
 Climate Change Impact Assessment on Indian Water Resources Ashvin Gosain, Sandhya Rao, Debajit Basu Ray Objectives of the Study To quantify the impact of the climate change on the water resources of the
Impacts of climate change on flooding in the river Meuse
 Impacts of climate change on flooding in the river Meuse Martijn Booij University of Twente,, The Netherlands m.j.booij booij@utwente.nlnl 2003 in the Meuse basin Model appropriateness Appropriate model
Chiang Rai Province CC Threat overview AAS1109 Mekong ARCC
 Chiang Rai Province CC Threat overview AAS1109 Mekong ARCC This threat overview relies on projections of future climate change in the Mekong Basin for the period 2045-2069 compared to a baseline of 1980-2005.
Understanding Karnali River Basin. Kabi Raj Khatiwada
 Understanding Karnali River Basin Kabi Raj Khatiwada http://treasuresfromtheroad.com/karnali-river-too-slow-boat/ The asymmetric, single-tower, cable-stayed bridge is the longest of its type in the world
Impacts of snowpack accumulation and summer weather on alpine glacier hydrology
 Impacts of snowpack accumulation and summer weather on alpine glacier hydrology Caroline Aubry-Wake, Dhiraj Pradhananga, John W. Pomeroy GEWEX 8 th Open Science Meeting, Canmore AB, May 3-11 2018 Canadian
regime on Juncal Norte glacier, dry Andes of central Chile, using melt models of A study of the energy-balance and melt different complexity
 A study of the energy-balance and melt regime on Juncal Norte glacier, dry Andes of central Chile, using melt models of different complexity Francesca Pellicciotti 1 Jakob Helbing 2, Vincent Favier 3,
Climatography of the United States No
 Climate Division: AK 5 NWS Call Sign: ANC Month (1) Min (2) Month(1) Extremes Lowest (2) Temperature ( F) Lowest Month(1) Degree s (1) Base Temp 65 Heating Cooling 90 Number of s (3) Jan 22.2 9.3 15.8
Webinar and Weekly Summary February 15th, 2011
 Webinar and Weekly Summary February 15th, 2011 -Assessment of current water conditions - Precipitation Forecast - Recommendations for Drought Monitor Upper Colorado Normal Precipitation Upper Colorado
Flood Inundation Mapping under different climate change scenarios in the upper Indus River Basin, Pakistan
 Flood Inundation Mapping under different climate change scenarios in the upper Indus River Basin, Pakistan Sohaib Baig (doctoral student) 16 November 2017 Disaster Prevention Research Institute 1 Kyoto
2003 Water Year Wrap-Up and Look Ahead
 2003 Water Year Wrap-Up and Look Ahead Nolan Doesken Colorado Climate Center Prepared by Odie Bliss http://ccc.atmos.colostate.edu Colorado Average Annual Precipitation Map South Platte Average Precipitation
Climatography of the United States No
 Climate Division: CA 5 NWS Call Sign: Elevation: 6 Feet Lat: 37 Month (1) Min (2) Month(1) Extremes Lowest (2) Temperature ( F) Lowest Month(1) Degree s (1) Base Temp 65 Heating Cooling 1 Number of s (3)
Climatography of the United States No
 Climate Division: CA 4 NWS Call Sign: Elevation: 2 Feet Lat: 37 Month (1) Min (2) Month(1) Extremes Lowest (2) Temperature ( F) Lowest Month(1) Degree s (1) Base Temp 65 Heating Cooling 1 Number of s (3)
Climatography of the United States No
 Climate Division: CA 4 NWS Call Sign: Elevation: 13 Feet Lat: 36 Month (1) Min (2) Month(1) Extremes Lowest (2) Temperature ( F) Lowest Month(1) Degree s (1) Base Temp 65 Heating Cooling 1 Number of s
Climatography of the United States No
 Climate Division: CA 5 NWS Call Sign: Elevation: 1,14 Feet Lat: 36 Month (1) Min (2) Month(1) Extremes Lowest (2) Temperature ( F) Lowest Month(1) Degree s (1) Base Temp 65 Heating Cooling 1 Number of
Modeling the Effects of Climate and Land Cover Change in the Stoney Brook Subbasin of the St. Louis River Watershed
 Modeling the Effects of Climate and Land Cover Change in the Stoney Brook Subbasin of the St. Louis River Watershed Joe Johnson and Jesse Pruette 214 NASA Research Internship Geospatial Technologies Program
2003 Moisture Outlook
 2003 Moisture Outlook Nolan Doesken and Roger Pielke, Sr. Colorado Climate Center Prepared by Tara Green and Odie Bliss http://climate.atmos.colostate.edu Through 1999 Through 1999 Fort Collins Total Water
Climatography of the United States No
 Climate Division: CA 6 NWS Call Sign: LAX Elevation: 1 Feet Lat: 33 Month (1) Min (2) Month(1) Extremes Lowest (2) Temperature ( F) Lowest Month(1) Degree s (1) Base Temp 65 Heating Cooling 1 Number of
Climatography of the United States No
 Climate Division: CA 6 NWS Call Sign: TOA Elevation: 11 Feet Lat: 33 2W Temperature ( F) Month (1) Min (2) Month(1) Extremes Lowest (2) Lowest Month(1) Degree s (1) Base Temp 65 Heating Cooling 1 Number
Climate Change Impact Assessment on Long Term Water Budget for Maitland Catchment in Southern Ontario
 215 SWAT CONFERENCE, PURDUE Climate Change Impact Assessment on Long Term Water Budget for Maitland Catchment in Southern Ontario By Vinod Chilkoti Aakash Bagchi Tirupati Bolisetti Ram Balachandar Contents
Why modelling? Glacier mass balance modelling
 Why modelling? Glacier mass balance modelling GEO 4420 Glaciology 12.10.2006 Thomas V. Schuler t.v.schuler@geo.uio.no global mean temperature Background Glaciers have retreated world-wide during the last
Climatography of the United States No
 Month (1) Min (2) Month(1) Extremes Lowest (2) Temperature ( F) Lowest Month(1) Degree s (1) Base Temp 65 Heating Cooling 100 Number of s (3) Jan 63.9 39.3 51.6 86 1976 16 56.6 1986 20 1976 2 47.5 1973
Climatography of the United States No
 Temperature ( F) Month (1) Min (2) Month(1) Extremes Lowest (2) Lowest Month(1) Degree s (1) Base Temp 65 Heating Cooling 100 Number of s (3) Jan 32.8 21.7 27.3 62 1918 1 35.8 1983-24 1950 29 10.5 1979
Disentangling Impacts of Climate & Land Use Changes on the Quantity & Quality of River Flows in Southern Ontario
 Disentangling Impacts of Climate & Land Use Changes on the Quantity & Quality of River Flows in Southern Ontario by Trevor Dickinson & Ramesh Rudra, Water Resources Engineering University of Guelph Acknowledgements
COUPLING A DISTRIBUTED HYDROLOGICAL MODEL TO REGIONAL CLIMATE MODEL OUTPUT: AN EVALUATION OF EXPERIMENTS FOR THE RHINE BASIN IN EUROPE
 P.1 COUPLING A DISTRIBUTED HYDROLOGICAL MODEL TO REGIONAL CLIMATE MODEL OUTPUT: AN EVALUATION OF EXPERIMENTS FOR THE RHINE BASIN IN EUROPE Jan Kleinn*, Christoph Frei, Joachim Gurtz, Pier Luigi Vidale,
Climatography of the United States No
 Climate Division: CA 4 NWS Call Sign: Month (1) Min (2) Month(1) Extremes Lowest (2) Temperature ( F) Lowest Month(1) Degree s (1) Base Temp 65 Heating Cooling 100 Number of s (3) Jan 55.6 39.3 47.5 77
Climatography of the United States No
 Climate Division: CA 5 NWS Call Sign: Month (1) Min (2) Month(1) Extremes Lowest (2) Temperature ( F) Lowest Month(1) Degree s (1) Base Temp 65 Heating Cooling 100 Number of s (3) Jan 56.6 36.5 46.6 81
Climatography of the United States No
 Climate Division: CA 1 NWS Call Sign: Month (1) Min (2) Month(1) Extremes Lowest (2) Temperature ( F) Lowest Month(1) Degree s (1) Base Temp 65 Heating Cooling 100 Number of s (3) Jan 57.9 38.9 48.4 85
Climatography of the United States No
 Climate Division: CA 5 NWS Call Sign: Month (1) Min (2) Month(1) Extremes Lowest (2) Temperature ( F) Lowest Month(1) Degree s (1) Base Temp 65 Heating Cooling 100 Number of s (3) Jan 44.8 25.4 35.1 72
Climatography of the United States No
 Climate Division: CA 4 NWS Call Sign: Month (1) Min (2) Month(1) Extremes Lowest (2) Temperature ( F) Lowest Month(1) Degree s (1) Base Temp 65 Heating Cooling 100 Number of s (3) Jan 49.4 37.5 43.5 73
Climatography of the United States No
 Climate Division: CA 6 NWS Call Sign: Month (1) Min (2) Month(1) Extremes Lowest (2) Temperature ( F) Lowest Month(1) Degree s (1) Base Temp 65 Heating Cooling 100 Number of s (3) Jan 69.4 46.6 58.0 92
Climatography of the United States No
 Climate Division: CA 4 NWS Call Sign: Month (1) Min (2) Month(1) Extremes Lowest (2) Temperature ( F) Lowest Month(1) Degree s (1) Base Temp 65 Heating Cooling 1 Number of s (3) Jan 58.5 38.8 48.7 79 1962
Climatography of the United States No
 Climate Division: CA 6 NWS Call Sign: Month (1) Min (2) Month(1) Extremes Lowest (2) Temperature ( F) Lowest Month(1) Degree s (1) Base Temp 65 Heating Cooling 1 Number of s (3) Jan 67.5 42. 54.8 92 1971
Climatography of the United States No
 Climate Division: CA 1 NWS Call Sign: Month (1) Min (2) Month(1) Extremes Lowest (2) Temperature ( F) Lowest Month(1) Degree s (1) Base Temp 65 Heating Cooling 1 Number of s (3) Jan 57.8 39.5 48.7 85 1962
Climatography of the United States No
 No. 2 1971-2 Asheville, North Carolina 2881 COOP ID: 46175 Climate Division: CA 6 NWS Call Sign: 3L3 Elevation: 1 Feet Lat: 33 Month (1) Min (2) Month(1) Extremes Lowest (2) Temperature ( F) Lowest Month(1)
Climatography of the United States No
 No. 2 1971-2 Asheville, North Carolina 2881 COOP ID: 42713 Climate Division: CA 7 NWS Call Sign: Elevation: -3 Feet Lat: 32 Month (1) Min (2) Month(1) Extremes Lowest (2) Temperature ( F) Lowest Month(1)
Climatography of the United States No
 Climate Division: ND 8 NWS Call Sign: BIS Month (1) Min (2) Month(1) Extremes Lowest (2) Temperature ( F) Lowest Month(1) Degree s (1) Base Temp 65 Heating Cooling 100 Number of s (3) Jan 21.1 -.6 10.2
Climatography of the United States No
 Climate Division: TN 1 NWS Call Sign: Month (1) Min (2) Month(1) Extremes Lowest (2) Temperature ( F) Lowest Month(1) Degree s (1) Base Temp 65 Heating Cooling 100 Number of s (3) Jan 47.6 24.9 36.3 81
Climatography of the United States No
 Climate Division: CA 5 NWS Call Sign: FAT Month (1) Min (2) Month(1) Extremes Lowest (2) Temperature ( F) Lowest Month(1) Degree s (1) Base Temp 65 Heating Cooling 1 Number of s (3) Jan 53.6 38.4 46. 78
Climatography of the United States No
 Climate Division: CA 6 NWS Call Sign: 1L2 N Lon: 118 3W Month (1) Min (2) Month(1) Extremes Lowest (2) Temperature ( F) Lowest Month(1) Degree s (1) Base Temp 65 Heating Cooling 1 Number of s (3) Jan 63.7
Climatography of the United States No
 Climate Division: CA 5 NWS Call Sign: BFL Month (1) Min (2) Month(1) Extremes Lowest (2) Temperature ( F) Lowest Month(1) Degree s (1) Base Temp 65 Heating Cooling 1 Number of s (3) Jan 56.3 39.3 47.8
CFCAS project: Assessment of Water Resources Risk and Vulnerability to Changing Climatic Conditions. Project Report II.
 CFCAS project: Assessment of Water Resources Risk and Vulnerability to Changing Climatic Conditions Project Report II. January 2004 Prepared by and CFCAS Project Team: University of Western Ontario Slobodan
Climatography of the United States No
 Climate Division: TN 3 NWS Call Sign: BNA Month (1) Min (2) Month(1) Extremes Lowest (2) Temperature ( F) Lowest Month(1) Degree s (1) Base Temp 65 Heating Cooling 100 Number of s (3) Jan 45.6 27.9 36.8
4. THE HBV MODEL APPLICATION TO THE KASARI CATCHMENT
 Application of HBV model to the Kasari River, 1994 Page 1 of 6 Application of the HBV model to the Kasari river for flow modulation of catchments characterised by specific underlying features by R. Vedom,
Spatiotemporal variations of alpine climate, snow cover and phenology
 Spatiotemporal variations of alpine climate, snow cover and phenology S. Asam, M. Callegari, M. Matiu, G. Fiore, L. De Gregorio, A. Jacob, A. Menzel, C. Notarnicola, M. Zebisch Asam et al., Spatiotemporal
July, International SWAT Conference & Workshops
 July, 212 212 International SWAT Conference & Workshops Hydrological Modelling of Kosi and Gandak Basins using SWAT Model S. Dutta, Pritam Biswas, Sangita Devi, Suresh A Karth and Bimlesh kumar, Ganga
Glacier Monitoring: WAPDA s Initiative in the Upper Indus Basin
 Pakistan Water and Power Development Authority (WAPDA) Glacier Monitoring & Research Centre Glacier Monitoring: WAPDA s Initiative in the Upper Indus Basin Asim Rauf Khan, Project Director GMRC WAPDA 17-18
Colorado s 2003 Moisture Outlook
 Colorado s 2003 Moisture Outlook Nolan Doesken and Roger Pielke, Sr. Colorado Climate Center Prepared by Tara Green and Odie Bliss http://climate.atmos.colostate.edu How we got into this drought! Fort
APPLICATIONS OF DOWNSCALING: HYDROLOGY AND WATER RESOURCES EXAMPLES
 APPLICATIONS OF DOWNSCALING: HYDROLOGY AND WATER RESOURCES EXAMPLES Dennis P. Lettenmaier Department of Civil and Environmental Engineering For presentation at Workshop on Regional Climate Research NCAR
Climatography of the United States No
 No. 2 1971-2 Asheville, North Carolina 2881 COOP ID: 46646 Climate Division: CA 4 NWS Call Sign: 8W Month (1) Min (2) Month(1) Extremes Lowest (2) Temperature ( F) Lowest Month(1) Degree s (1) Base Temp
Climatography of the United States No
 No. 2 1971-2 Asheville, North Carolina 2881 COOP ID: 4792 Climate Division: CA 6 NWS Call Sign: Month (1) Min (2) Month(1) Extremes Lowest (2) Temperature ( F) Lowest Month(1) Degree s (1) Base Temp 65
The Huong River the nature, climate, hydro-meteorological issues and the AWCI demonstration project
 The Huong River the nature, climate, hydro-meteorological issues and the AWCI demonstration project 7th GEOSS AP Symposium, the AWCI parallel session May 27, 214, Tokyo National Centre for Hydro-Meteorological
A Report on a Statistical Model to Forecast Seasonal Inflows to Cowichan Lake
 A Report on a Statistical Model to Forecast Seasonal Inflows to Cowichan Lake Prepared by: Allan Chapman, MSc, PGeo Hydrologist, Chapman Geoscience Ltd., and Former Head, BC River Forecast Centre Victoria
Climatography of the United States No
 Month (1) Min (2) Month(1) Extremes Lowest (2) Temperature ( F) Lowest Month(1) Degree s (1) Base Temp 65 Heating Cooling 100 Number of s (3) 42.6 24.2 33.4 79 1950 25 44.2 1974-16 1994 19 18.8 1977 977
Climatography of the United States No
 No. 2 1971-2 Asheville, North Carolina 2881 COOP ID: 43417 Climate Division: CA 4 NWS Call Sign: N Lon: 121 Month (1) Min (2) Month(1) Extremes Lowest (2) Temperature ( F) Lowest Month(1) Degree s (1)
Climatography of the United States No
 Month (1) Min (2) Month(1) Extremes Lowest (2) Temperature ( F) Lowest Month(1) Degree s (1) Base Temp 65 Heating Cooling 100 Number of s (3) Jan 54.3 40.1 47.2 75 1998 17 53.0 1995 18 1949 11 41.7 1972
Climatography of the United States No
 No. 2 1971-2 Asheville, North Carolina 2881 COOP ID: 4795 Climate Division: CA 6 NWS Call Sign: SBA Month (1) Min (2) Month(1) Extremes Lowest (2) Temperature ( F) Lowest Month(1) Degree s (1) Base Temp
Climatography of the United States No
 Climate Division: CA 6 NWS Call Sign: Month (1) Min (2) Month(1) Extremes Lowest (2) Temperature ( F) Lowest Month(1) Degree s (1) Base Temp 65 Heating Cooling 100 Number of s (3) Jan 51.5 35.0 43.3 80
Climatography of the United States No
 Climate Division: CA 5 NWS Call Sign: Month (1) Min (2) Month(1) Extremes Lowest (2) Temperature ( F) Lowest Month(1) Degree s (1) Base Temp 65 Heating Cooling 100 Number of s (3) 59.3 31.5 45.4 80 1976
Climatography of the United States No
 Climate Division: CA 7 NWS Call Sign: Month (1) Min (2) Month(1) Extremes Lowest (2) Temperature ( F) Lowest Month(1) Degree s (1) Base Temp 65 Heating Cooling 100 Number of s (3) 44.5 29.3 36.9 69 1951
Climatography of the United States No
 Climate Division: CA 2 NWS Call Sign: Month (1) Min (2) Month(1) Extremes Lowest (2) Temperature ( F) Lowest Month(1) Degree s (1) Base Temp 65 Heating Cooling 100 Number of s (3) 53.3 37.1 45.2 77 1962
Climatography of the United States No
 Climate Division: CA 2 NWS Call Sign: Month (1) Min (2) Month(1) Extremes Lowest (2) Temperature ( F) Lowest Month(1) Degree s (1) Base Temp 65 Heating Cooling 100 Number of s (3) 53.3 31.8 42.6 74+ 1975
Climatography of the United States No
 Climate Division: CA 6 NWS Call Sign: Month (1) Min (2) Month(1) Extremes Lowest (2) Temperature ( F) Lowest Month(1) Degree s (1) Base Temp 65 Heating Cooling 100 Number of s (3) 68.5 45.7 57.1 90 1971
Climatography of the United States No
 Climate Division: CA 2 NWS Call Sign: Month (1) Min (2) Month(1) Extremes Lowest (2) Temperature ( F) Lowest Month(1) Degree s (1) Base Temp 65 Heating Cooling 100 Number of s (3) 53.7 32.7 43.2 79 1962
Climatography of the United States No
 Climate Division: CA 7 NWS Call Sign: Month (1) Min (2) Month(1) Extremes Lowest (2) Temperature ( F) Lowest Month(1) Degree s (1) Base Temp 65 Heating Cooling 100 Number of s (3) 56.0 35.7 45.9 83 1975
Climatography of the United States No
 Climate Division: CA 7 NWS Call Sign: Month (1) Min (2) Month(1) Extremes Lowest (2) Temperature ( F) Lowest Month(1) Degree s (1) Base Temp 65 Heating Cooling 1 Number of s (3) 64.8 45.4 55.1 85 1971
Climatography of the United States No
 Climate Division: CA 7 NWS Call Sign: Month (1) Min (2) Month(1) Extremes Lowest (2) Temperature ( F) Lowest Month(1) Degree s (1) Base Temp 65 Heating Cooling 1 Number of s (3) 65.5 38.7 52.1 87 1962
Climatography of the United States No
 Climate Division: CA 7 NWS Call Sign: Month (1) Min (2) Month(1) Extremes Lowest (2) Temperature ( F) Lowest Month(1) Degree s (1) Base Temp 65 Heating Cooling 100 Number of s (3) 58.8 34.3 46.6 81+ 1948
Climatography of the United States No
 Climate Division: CA 7 NWS Call Sign: Month (1) Min (2) Month(1) Extremes Lowest (2) Temperature ( F) Lowest Month(1) Degree s (1) Base Temp 65 Heating Cooling 100 Number of s (3) 70.4 44.2 57.3 95 1971
Climatography of the United States No
 Climate Division: CA 1 NWS Call Sign: Month (1) Min (2) Month(1) Extremes Lowest (2) Temperature ( F) Lowest Month(1) Degree s (1) Base Temp 65 Heating Cooling 100 Number of s (3) Jan 52.4 35.4 43.9 69
Climatography of the United States No
 Climate Division: CA 4 NWS Call Sign: Month (1) Min (2) Month(1) Extremes Lowest (2) Temperature ( F) Lowest Month(1) Degree s (1) Base Temp 65 Heating Cooling 100 Number of s (3) Jan 61.9 42.0 52.0 89
Climatography of the United States No
 Climate Division: CA 2 NWS Call Sign: Month (1) Min (2) Month(1) Extremes Lowest (2) Temperature ( F) Lowest Month(1) Degree s (1) Base Temp 65 Heating Cooling 100 Number of s (3) Jan 55.6 38.8 47.2 81
Climatography of the United States No
 Climate Division: CA 2 NWS Call Sign: Month (1) Min (2) Month(1) Extremes Lowest (2) Temperature ( F) Lowest Month(1) Degree s (1) Base Temp 65 Heating Cooling 100 Number of s (3) Jan 53.5 37.6 45.6 78
Climatography of the United States No
 Climate Division: CA 6 NWS Call Sign: Month (1) Min (2) Month(1) Extremes Lowest (2) Temperature ( F) Lowest Month(1) Degree s (1) Base Temp 65 Heating Cooling 100 Number of s (3) Jan 66.1 38.3 52.2 91
Climatography of the United States No
 Climate Division: CA 1 NWS Call Sign: Month (1) Min (2) Month(1) Extremes Lowest (2) Temperature ( F) Lowest Month(1) Degree s (1) Base Temp 65 Heating Cooling 1 Number of s (3) Jan 56.2 4.7 48.5 79 1962
Climatography of the United States No
 Climate Division: CA 1 NWS Call Sign: Month (1) Min (2) Month(1) Extremes Lowest (2) Temperature ( F) Lowest Month(1) Degree s (1) Base Temp 65 Heating Cooling 100 Number of s (3) Jan 50.2 31.2 40.7 65+
Climatography of the United States No
 Climate Division: CA 4 NWS Call Sign: Month (1) Min (2) Month(1) Extremes Lowest (2) Temperature ( F) Lowest Month(1) Degree s (1) Base Temp 65 Heating Cooling 100 Number of s (3) Jan 61.4 33.1 47.3 82+
Climatography of the United States No
 Climate Division: CA 4 NWS Call Sign: Month (1) Min (2) Month(1) Extremes Lowest (2) Temperature ( F) Lowest Month(1) Degree s (1) Base Temp 65 Heating Cooling 100 Number of s (3) Jan 56.4 43.6 50.0 77
Climatography of the United States No
 Climate Division: CA 7 NWS Call Sign: Month (1) Min (2) Month(1) Extremes Lowest (2) Temperature ( F) Lowest Month(1) Degree s (1) Base Temp 65 Heating Cooling 100 Number of s (3) Jan 54.4 36.9 45.7 77+
2015 Fall Conditions Report
 2015 Fall Conditions Report Prepared by: Hydrologic Forecast Centre Date: December 21 st, 2015 Table of Contents Table of Figures... ii EXECUTIVE SUMMARY... 1 BACKGROUND... 2 SUMMER AND FALL PRECIPITATION...
Promoting Rainwater Harvesting in Caribbean Small Island Developing States Water Availability Mapping for Grenada Preliminary findings
 Promoting Rainwater Harvesting in Caribbean Small Island Developing States Water Availability Mapping for Grenada Preliminary findings National Workshop Pilot Project funded by The United Nations Environment
Climate also has a large influence on how local ecosystems have evolved and how we interact with them.
 The Mississippi River in a Changing Climate By Paul Lehman, P.Eng., General Manager Mississippi Valley Conservation (This article originally appeared in the Mississippi Lakes Association s 212 Mississippi
Climatography of the United States No
 Climate Division: SC 7 NWS Call Sign: CHS Month (1) Min (2) Month(1) Extremes Lowest (2) Temperature ( F) Lowest Month(1) Degree s (1) Base Temp 65 Heating Cooling 100 Number of s (3) Jan 58.9 36.9 47.9
Average temperature ( F) World Climate Zones. very cold all year with permanent ice and snow. very cold winters, cold summers, and little rain or snow
 World Climate Zones. very cold all year with permanent ice and snow. very cold winters, cold summers, and little rain or snow") P r e v i e w Look carefully at the climagraph of Mumbai, India. What is the wettest month (or months) in Mumbai? What is the driest month (or months) in Mumbai? What effects might this city s climate
P r e v i e w Look carefully at the climagraph of Mumbai, India. What is the wettest month (or months) in Mumbai? What is the driest month (or months) in Mumbai? What effects might this city s climate
The 2 nd Annual Gobeshona Conference Future Changes of Flash Flood in the North East Region of Bangladesh using HEC-HMS Modeling
 The 2 nd Annual Gobeshona Conference 2016 Future Changes of Flash Flood in the North East Region of Bangladesh using HEC-HMS ing By- Shammi Haque 1*, Mutasim Billah 1, Afiya Narzis 2, A.K.M. Saiful Islam
Today s Lecture: Land, biosphere, cryosphere (All that stuff we don t have equations for... )
") Today s Lecture: Land, biosphere, cryosphere (All that stuff we don t have equations for... ) 4 Land, biosphere, cryosphere 1. Introduction 2. Atmosphere 3. Ocean 4. Land, biosphere, cryosphere 4.1 Land
Today s Lecture: Land, biosphere, cryosphere (All that stuff we don t have equations for... ) 4 Land, biosphere, cryosphere 1. Introduction 2. Atmosphere 3. Ocean 4. Land, biosphere, cryosphere 4.1 Land
HYDROLOGIC AND WATER RESOURCES EVALUATIONS FOR SG. LUI WATERSHED
 HYDROLOGIC AND WATER RESOURCES EVALUATIONS FOR SG. LUI WATERSHED 1.0 Introduction The Sg. Lui watershed is the upper part of Langat River Basin, in the state of Selangor which located approximately 20
Climate Variability in South Asia
 Climate Variability in South Asia V. Niranjan, M. Dinesh Kumar, and Nitin Bassi Institute for Resource Analysis and Policy Contents Introduction Rainfall variability in South Asia Temporal variability
Drought in Southeast Colorado
 Drought in Southeast Colorado Nolan Doesken and Roger Pielke, Sr. Colorado Climate Center Prepared by Tara Green and Odie Bliss http://climate.atmos.colostate.edu 1 Historical Perspective on Drought Tourism
Quenching the Valley s thirst: The connection between Sierra Nevada snowpack & regional water supply
 Quenching the Valley s thirst: The connection between Sierra Nevada snowpack & regional water supply Roger Bales, UC Merced Snow conditions Snow & climate change Research directions Sierra Nevada snow
ESTIMATING SNOWMELT CONTRIBUTION FROM THE GANGOTRI GLACIER CATCHMENT INTO THE BHAGIRATHI RIVER, INDIA ABSTRACT INTRODUCTION
 ESTIMATING SNOWMELT CONTRIBUTION FROM THE GANGOTRI GLACIER CATCHMENT INTO THE BHAGIRATHI RIVER, INDIA Rodney M. Chai 1, Leigh A. Stearns 2, C. J. van der Veen 1 ABSTRACT The Bhagirathi River emerges from
Streamflow, Sediment, and Nutrient Simulation of the Bitterroot Watershed using SWAT
 Streamflow, Sediment, and Nutrient Simulation of the Bitterroot Watershed using SWAT by Dr. Michael Van Liew Montana Department of Environmental Quality Helena, Montana, USA Site Map of SWAT Watersheds
Assessing bias in satellite rainfall products and their impact in water balance closure at the Zambezi headwaters
 Assessing bias in satellite rainfall products and their impact in water balance closure at the Zambezi headwaters Omondi C.K. 1 Rientjes T.H.M. 1, Haile T.A. 2, Gumindoga W. 1,3 (1) Faculty ITC, University
A Review of the 2007 Water Year in Colorado
 A Review of the 2007 Water Year in Colorado Nolan Doesken Colorado Climate Center, CSU Mike Gillespie Snow Survey Division, USDA, NRCS Presented at the 28 th Annual AGU Hydrology Days, March 26, 2008,
Modeling of peak inflow dates for a snowmelt dominated basin Evan Heisman. CVEN 6833: Advanced Data Analysis Fall 2012 Prof. Balaji Rajagopalan
 Modeling of peak inflow dates for a snowmelt dominated basin Evan Heisman CVEN 6833: Advanced Data Analysis Fall 2012 Prof. Balaji Rajagopalan The Dworshak reservoir, a project operated by the Army Corps