David R. Vallee Hydrologist-in-Charge NOAA/NWS Northeast River Forecast Center
|
|
|
- Erick McLaughlin
- 5 years ago
- Views:
Transcription

1 Flooding along the Housatonic River following Tropical Storm Lee, Sept 8, Photo: A. Driscoll, Connecticut Post David R. Vallee Hydrologist-in-Charge NOAA/NWS Northeast River Forecast Center
2 Examining some of our extreme events of the past 10 years Big Rainstorms & High Impact Floods Flash Drought Episodes How may a changing climate be impacting flood behavior Accumulation of Ingredients not one single source The importance of Land Trusts and Land Preservation as a means for reducing impacts


3 NOAA/NWS s Northeast River Forecast Center Our Mission: To provide our nation with river, flood and water resource forecasts for the protection of life and property and the enhancement of the national economy


4 A Look At Current & Future Water Prediction Services: Moving from Point Specific to Street Level Hydrologic Forecasting New National Water Model Building a Weather-Ready Nation


 Hydro-Blind")


5 National Water Model Based Street Level Hydrologic Prediction Record Setting West Virginia Floods, 6/23/2016 Thousands of homes damaged or destroyed, $111+ million in FEMA aid NWM allows users to drill down from regional to local to street scale Information complements hydrologic guidance at existing forecast locations and provides new insight at millions of hydroblind locations NWM Street-Level Forecast Streamflow (cfs) Hydro-Blind location 500 people trapped at Elkview mall Bridge Collapse NWM 15 hr Regional Streamflow Anomaly Forecast, Valid 20Z 6/23 Experimental NWM Local Inundation Map Building a Weather-Ready Nation Shading indicates flooded areas


6 Record flooding along the Fish and Saint John Rivers northeast Maine, 4/30/2008 St-Jean-sur-Richelieu, Quebec, Canada, 5/6/11 Photo: AP//Canadian Press, R. Remoirz Providence Street West Warwick, RI at 1030 am Wednesday 3/31/10 Damage along Schoharie Creek, Prattsville, NY T.S. Irene, Photo: J. Vielkind / Times Union


7 Several: Slow moving weather systems a blocked up atmosphere Related to loss of artic ice cover Multiple events in close succession or one big slow moving storm Results in saturated antecedent conditions before main event Each fed by a tropical connection Plumes of deep moisture


8 Modest changes in air & sea temperatures = atmosphere can hold more moisture New England is in close proximity to the Gulf & Atlantic moisture streams Affected by dual storm tracks and blocking high pressure over Greenland These ingredients offer us more opportunities to latch onto plumes L L L H L Reduction of Arctic sea ice changes upper level wind flow Arctic Amplification Blocked up pattern induces slower moving storms or back-to-back-to back events
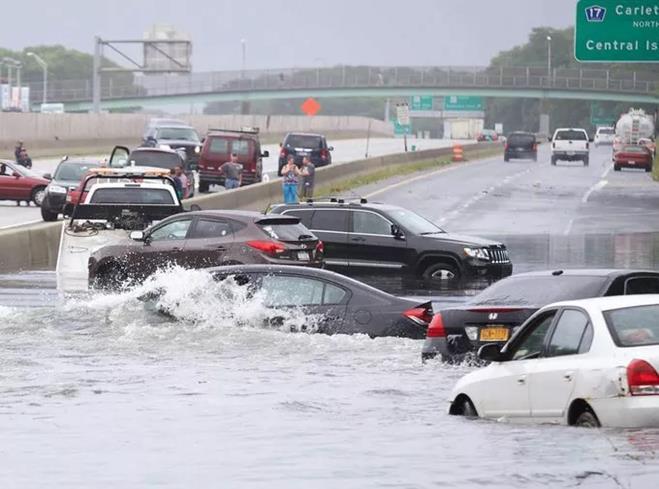
9 Common themes across New England and Connecticut: Increasing annual precipitation Increasing frequency of heavy rains Warming annual temperatures Shift in precipitation frequency Trend toward increased flood magnitude and/or frequency Most pronounced where significant land use change and/or urbanization has occurred More pronounced in smaller river basins Residents are rescued from their homes by boat along flooded Pawcatuck River, Westerly RI, on March 30, Photo: Major flooding along Route 7 from the Housatonic River in New Milford, CT on March 11, Source: Ctcameraeye.com
10 +1 F / 33 yrs

11 +1 inch / 27 yrs


12 NOAA ATLAS Hour 100 year return period rainfall Much of southern NE experienced a 1 to 2 inch upward shift! 7 7 Thick yellow lines represent 24 hr 100 yr values from TP-40,

13 Since the late 60s, signature of less frequent & shorter dry periods and longer, more frequent and intense wet periods


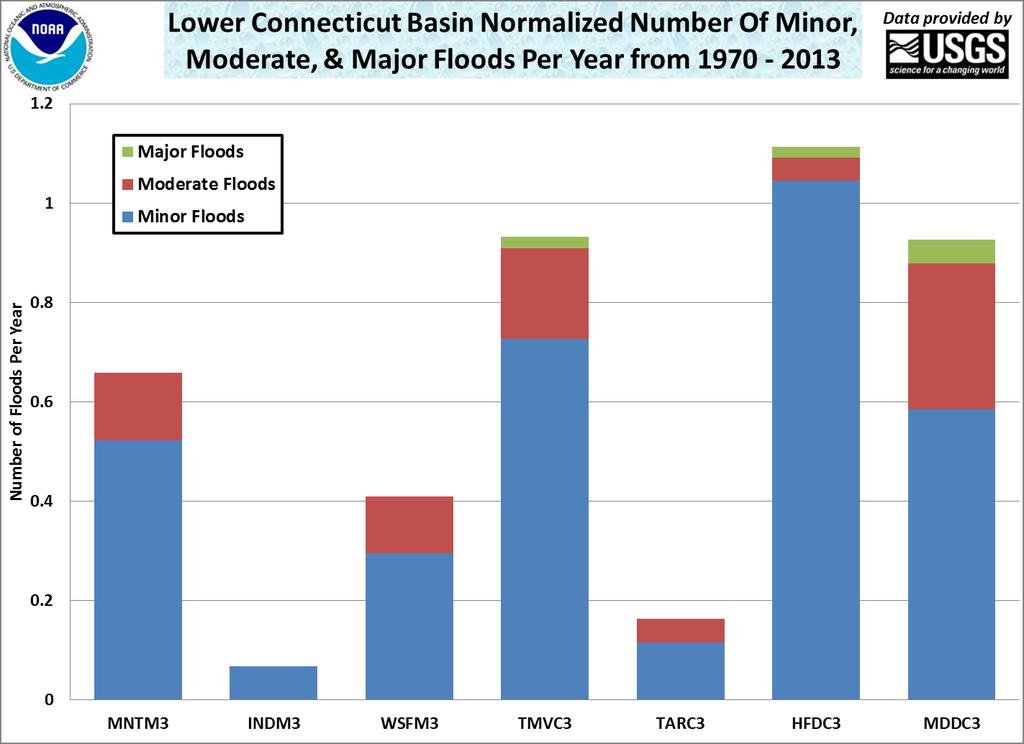
14 Changes in frequency/magnitude Part land use/urbanization Compounded by encroachment in the floodplain Part changing climate Larger basins & those with flood control haven t seen as noticeable a shift Greater capacity to handle more rain Greater capacity to control releases Northern and western parts of the state are seeing the most dramatic increase in flooding Same area where 100 year rainfall has shifted dramatically Flooding along the Housatonic River following Lee, Sept 8, Photo: A. Driscoll, CT Post Moderate flooding along Connecticut River, April 1 st, Photo: NBC Connecticut
15 Number of Floods Per Year Southern New England River Basin Normalized Number of Minor, Moderate, and Major Floods Prior to 1970 Data provided by 2.4 Major Floods 2 Moderate Floods Minor Floods Location
16 Number of Floods Per Year Southern New England River Basin Normalized Number of Minor, Moderate, and Major Floods from Data provided by 2.4 Major Floods 2 Moderate Floods Minor Floods Location
17 Number of Floods Per Year Lower Connecticut Basin Normalized Number Of Minor, Moderate, & Major Floods Per Year Prior to 1970 Data provided by Major Floods Moderate Floods Minor Floods MNTM3 INDM3 WSFM3 TMVC3 TARC3 HFDC3 MDDC3
18

19 Common themes across New England and Connecticut: Increasing annual precipitation Increasing frequency of heavy rains Warming annual temperatures Shift in precipitation frequency Trend toward increased flood magnitude and/or frequency Most pronounced where significant land use change and/or urbanization has occurred More pronounced in smaller river basins Residents are rescued from their homes by boat along flooded Pawcatuck River, Westerly RI, on March 30, Photo: Major flooding along Route 7 from the Housatonic River in New Milford, CT on March 11, Source: Ctcameraeye.com

20 Floodplain, land use, infrastructure, dam spillway requirements, drainage requirements, storm water management, non-point source runoff, bridge clearances, hardening of critical facilities in the floodplain, property values etc Flood Insurance work to increase participation How much risk are we willing to insure and accept? Graphic courtesy of Cameron Wake University of New Hampshire


21 Land Trusts can help to: Preserve the land Retain and restore grounds to their natural state Increase rainfall/runoff storage capacity of a given parcel of land Improve water quality through restoration of lands and vegetation to a more natural state Reduce storm water runoff Neponset Basin Wetland Restoration. Photo: MA Exec. Office Env. Affairs
22 Flooding along the Housatonic River following Tropical Storm Lee, Sept 8, Photo: A. Driscoll, Connecticut Post David R. Vallee Hydrologist-in-Charge NOAA/NWS Northeast River Forecast Center
23

24 WFO Caribou, ME Northeast Maine counties WFO Gray, ME Southwest Maine and all of New Hampshire WFO Burlington, VT Northern 2/3 rds of VT WFO Albany, NY Srn 1/3 of VT, Berkshire, MA, Litchfield, CT WFO Taunton, MA Rest of MA, all of RI, and the northern 2/3 rds of CT WFO Upton, NY All coastal CT Counties WFO Binghamton, NY Finger Lakes region WFO Buffalo, NY Buffalo Creeks, Genesee and Black


25 Requirements: Observed precipitation & temperatures Observed streamflows (USGS) Forecast temperatures and precipitation Drainage area 100 sq mi Our models help us forecast: The volume of water in the river & that s converted to stage/elevation Time of the peak elevation & duration Soil moisture & Snow melt Unit hydrograph theory Reservoir Operations Hydraulics (HES-RAS) for complex river systems Tidal reaches Lake Champlain, Farmington River Combines tidal/storm surge with fresh water runoff on 5 tidal rivers
, the temperature below which buildings need to be")
26 The number of degrees that a day's average temperature is below 65 o Fahrenheit (18 o Celsius), the temperature below which buildings need to be heated

27 The number of degrees that a day's average temperature is above 65 o Fahrenheit and people start to use air conditioning to cool their buildings
. Source: http://www.globalchange.")
28 Change in Precipitation Patterns Intense precipitation events (the heaviest 1%) in the continental U.S. increased by 20% over the past century while total precipitation increased by 7% ( ). Source: 29


29 >11
30 The Northeast U.S. has become a hot spot for record floods & heavy rainfall in the past 20 years Noticeable trends include increased yearly rainfall and increased annual temperatures Smaller watersheds & those with significant urbanization and/or land use change are most vulnerable to increased river & stream flooding Continued sea level rise combined with intense coastal storms has renewed the coastal flood threat A weaker category of storm is now capable of producing inundation once limited to the more intense hurricanes and coastal storms


31 Droughts of yesteryear: Prolonged record lows Not as record as today s low minimum flows But far longer in duration with little significant recharge Short/intense drought episodes: Record daily flows Exceeding minimums during the 1960s drought! But very short duration with long periods of significant recharge if not flood volumes


32 2009 study of 28 watersheds with minimal human influences Results indicate basins have experienced increased peak annual flows Strongest statistical trends noted by the large blue triangles 2011 study of 23 watersheds with minimal human influences Examined peaks over defined thresholds per water year More frequent flooding at 22 of 23 locations Increasing flood magnitude at 17 of 23 locations Spatial distribution of trend directions & magnitudes for based with minimal human influences. Reference: M. Collins, Journal of The American Water Resources Association (JAWRA) April Spatial Distribution of Flood Frequency as measured by peaks over threshold per water year. Reference: W. Armstrong, M. Collins, and N. Snyder Journal of The American Water Resources Association (JAWRA) April 2011.
David R. Vallee Hydrologist-in-Charge NOAA/NWS Northeast River Forecast Center
 David R. Vallee Hydrologist-in-Charge NOAA/NWS Northeast River Forecast Center Record flooding along the Shawsheen River during the 2006 Mother s Day Floods Calibrate and implement a variety of hydrologic
David R. Vallee Hydrologist-in-Charge NOAA/NWS Northeast River Forecast Center
 David R. Vallee Hydrologist-in-Charge NOAA/NWS Northeast River Forecast Center From a Practitioner s Perspective Touch upon some of our major flood events of the past 10 years Part I: Big Rainstorms &
Southeast New York Stormwater Conference David R. Vallee Hydrologist-in-Charge NOAA/NWS Northeast River Forecast Center
 Southeast New York Stormwater Conference David R. Vallee Hydrologist-in-Charge NOAA/NWS Northeast River Forecast Center Record flooding along the Mohawk River in Rotterdam, NY, August 2011 following Irene.
David R. Vallee Hydrologist-in-Charge NOAA/NWS Northeast River Forecast Center. Providence Street West Warwick, RI at 1030 am Wednesday 3/31/10
 David R. Vallee Hydrologist-in-Charge NOAA/NWS Northeast River Forecast Center Providence Street West Warwick, RI at 1030 am Wednesday 3/31/10 An overview of our changing climate Rainfall/Temperature trends
David R. Vallee Hydrologist in Charge NWS/Northeast River Forecast Center
 David R. Vallee Hydrologist in Charge NWS/Northeast River Forecast Center http://weather.gov/nerfc Providence Street West Warwick, RI at 1030 am Wednesday 3/31/10 A bit about the Northeast River Forecast
Overview of a Changing Climate in Rhode Island
 Overview of a Changing Climate in Rhode Island David Vallee, Hydrologist in Charge, National Weather Service Northeast River Forecast Center, NOAA Lenny Giuliano, Air Quality Specialist, Rhode Island Department
Building a Weather-Ready Nation
 June 15, 2018 Precipitation and Temperature Trends River Flood Behavior National Weather Service Northeast River Forecast Center Edward J Capone Service Coordination Hydrologist NWS Boston/Norton Providence
Speakers: NWS Buffalo Dan Kelly and Sarah Jamison, NERFC Jeane Wallace. NWS Flood Services for the Black River Basin
 Speakers: NWS Buffalo Dan Kelly and Sarah Jamison, NERFC Jeane Wallace NWS Flood Services for the Black River Basin National Weather Service Who We Are The National Oceanic and Atmospheric Administration
CLIMATE READY BOSTON. Climate Projections Consensus ADAPTED FROM THE BOSTON RESEARCH ADVISORY GROUP REPORT MAY 2016
 CLIMATE READY BOSTON Sasaki Steering Committee Meeting, March 28 nd, 2016 Climate Projections Consensus ADAPTED FROM THE BOSTON RESEARCH ADVISORY GROUP REPORT MAY 2016 WHAT S IN STORE FOR BOSTON S CLIMATE?
IWT Scenario 1 Integrated Warning Team Workshop National Weather Service Albany, NY October 31, 2014
 Integrated Warning Team Workshop National Weather Service Albany, NY October 31, 2014 23 24 25 26 27 Scenario 1 Timeline November 23-27 Sun Mon Tue Wed Thu Thanksgiving Day Sunday, Nov. 23 @ 430 pm NWS
Flooding in Western North Carolina: Some Spatial, Hydrologic, and Seasonal Characteristics CAUTION!! Outline. Basic Flood Facts.
 Flooding in Western North Carolina: Some Spatial, Hydrologic, and Seasonal Characteristics J. Greg Dobson CAUTION!! National Environmental Modeling and Analysis Center RENCI at UNC-Asheville Engagement
Northeast River Forecast Center (NERFC)
") Northeast River Forecast Center (NERFC) DOC-NOAA-NWS NWS Boston/Norton New Facility March 20 th 2018 NWS Boston/Norton 46 Commerce Way Norton, MA. 508-622-3300 Major Watersheds -Saint John -Penobscot -Androscoggin
Northeast River Forecast Center (NERFC) DOC-NOAA-NWS NWS Boston/Norton New Facility March 20 th 2018 NWS Boston/Norton 46 Commerce Way Norton, MA. 508-622-3300 Major Watersheds -Saint John -Penobscot -Androscoggin
Weather Briefing. Coastal Storm Monday-Wednesday Dec 8-10, National Weather Service. Prepared 12/8/14 6:30 AM
 Weather Briefing Coastal Storm Monday-Wednesday Dec 8-10, 2014 National Weather Service http://www.weather.gov/nyc Prepared 12/8/14 6:30 AM Overview of Potential Hazards A strong low pressure system will
March 2010 floods in New London County, Conn., and Washington County, R.I.:
 March 2010 floods in New London County, Conn., and Washington County, R.I.: Impacts and Implications NRE 2215 / project / Benson, Judy / April 19, 2011 1 On March 30 and 31, 2010, southeastern New England
The Documentation of Extreme Hydrometeorlogical Events: Two Case Studies in Utah, Water Year 2005
 The Documentation of Extreme Hydrometeorlogical Events: Two Case Studies in Utah, Water Year 2005 Tim Bardsley1*, Mark Losleben2, Randy Julander1 1. USDA, NRCS, Snow Survey Program, Salt Lake City, Utah.
IWT Scenario 2 Integrated Warning Team Workshop National Weather Service Albany, NY October 31, 2014
 IWT Scenario 2 Integrated Warning Team Workshop National Weather Service Albany, NY October 31, 2014 09 10 11 12 13 Scenario 2 Timeline December 9-13 Tue Wed Thu Fri Sat Tue, Dec. 9 @ 5 am 2014 2014 2014
Extreme Weather and Climate Change: the big picture Alan K. Betts Atmospheric Research Pittsford, VT NESC, Saratoga, NY
 Extreme Weather and Climate Change: the big picture Alan K. Betts Atmospheric Research Pittsford, VT http://alanbetts.com NESC, Saratoga, NY March 10, 2018 Increases in Extreme Weather Last decade: lack
HURRICANE IRENE. CONFERENCE CALL BRIEFING SLIDES Saturday August 27, :30 AM
 HURRICANE IRENE CONFERENCE CALL BRIEFING SLIDES Saturday August 27, 2011 8:30 AM NHC TRACK AND CONE HURRICANE IRENE WATCHES/WARNINGS Hurricane Warning along south coast including all of Cape Cod and Islands
NIDIS Intermountain West Drought Early Warning System April 18, 2017
 1 of 11 4/18/2017 3:42 PM Precipitation NIDIS Intermountain West Drought Early Warning System April 18, 2017 The images above use daily precipitation statistics from NWS COOP, CoCoRaHS, and CoAgMet stations.
April snowmelt and record rainfall resulted in flooding across portions of Vermont
 Vermont State Climate Office Climate Impacts Summary April 2011 Dr. Lesley-Ann Dupigny-Giroux Stephen Hogan April snowmelt and record rainfall resulted in flooding across portions of Vermont During the
THE FLOODS OF HURRICANE CONNIE AND DIANE
 THE FLOODS OF HURRICANE CONNIE AND DIANE AUGUST 1955 Winsted, Connecticut after the flood In little over a week, two hurricanes passed by Southern New England in August 1955 producing major flooding over
Hydroclimatic flood trends in the northeastern United States. Matt Collins, P.H. NOAA Restoration Center
 Hydroclimatic flood trends in the northeastern United States and implications for planning and design Matt Collins, P.H. NOAA Restoration Center Gloucester, MA Lake Champlain, VT, April - May, 2011 Credit:
An Overview of Operations at the West Gulf River Forecast Center Gregory Waller Service Coordination Hydrologist NWS - West Gulf River Forecast Center
 National Weather Service West Gulf River Forecast Center An Overview of Operations at the West Gulf River Forecast Center Gregory Waller Service Coordination Hydrologist NWS - West Gulf River Forecast
Mid-West Heavy rains 18 April 2013
 Abstract: Mid-West Heavy rains 18 April 2013 By Richard H. Grumm and Charles Ross National Weather Service State College, PA The relatively wet conditions during the first 16 days of April 2013 set the
Heavy Rainfall Event of June 2013
 Heavy Rainfall Event of 10-11 June 2013 By Richard H. Grumm National Weather Service State College, PA 1. Overview A 500 hpa short-wave moved over the eastern United States (Fig. 1) brought a surge of
New Hampshire State Climate Office Dr. Mary D. Stampone, State Climatologist
 New Hampshire State Climate Office Dr. Mary D. Stampone, State Climatologist University of New Hampshire c/o Department of Geography 73 Main Street Durham, NH 03824 Phone: 603-862-3136 Fax: 603-862-4362
Dr. Amanda Schroeder. NWS Weather Forecast Office Fort Worth, TX. Sustainable Urban Water Workshop University of Texas-Arlington June 4-5, 2015
 Dr. Amanda Schroeder NWS Weather Forecast Office Fort Worth, TX Sustainable Urban Water Workshop University of Texas-Arlington June 4-5, 2015 Outline Communicating the message - official Flood and Flash
Climate Change in the Northeast
 Climate Change in the Northeast Dr. Alan K. Betts Atmospheric Research, Pittsford, VT 05763 akbetts@aol.com http://alanbetts.com NNECAPA Stowe, VT September 11, 2014 Outline Science of climate change Global
Results of Intensity-Duration- Frequency Analysis for Precipitation and Runoff under Changing Climate
 Results of Intensity-Duration- Frequency Analysis for Precipitation and Runoff under Changing Climate Supporting Casco Bay Region Climate Change Adaptation RRAP Eugene Yan, Alissa Jared, Julia Pierce,
NWS FORM E-5 U.S. DEPARTMENT OF COMMERCE I HYDRO SERVICE AREA NOAA, NATIONAL WEATHER SERVICE I Indianapolis, IN MONTHLY REPORT
 NWS FORM E-5 U.S. DEPARTMENT OF COMMERCE I HYDRO SERVICE AREA NOAA, NATIONAL WEATHER SERVICE I Indianapolis, IN. 1-------------------- MONTHLY REPORT OF RIVER AND FLOOD CONDITIONSI REPORT FOR I November
SEPTEMBER 2013 REVIEW
 Monthly Long Range Weather Commentary Issued: October 21, 2013 Steven A. Root, CCM, President/CEO sroot@weatherbank.com SEPTEMBER 2013 REVIEW Climate Highlights The Month in Review The average temperature
NOAA Spring Flood Outlook for Iowa
 NOAA Spring Flood Outlook for Iowa Safeguard Iowa Partnership March 10, 2015 1 Agenda Orientation Maps Current Conditions Weather Outlook Spring Flood Outlook 2 1 Orientation Maps 3 4 2 5 Current Conditions
Robert Shedd Northeast River Forecast Center National Weather Service Taunton, Massachusetts, USA
 Robert Shedd Northeast River Forecast Center National Weather Service Taunton, Massachusetts, USA Outline River Forecast Centers FEWS Implementation Status Forcing Data Ensemble Forecasting The Northeast
Oregon Water Conditions Report May 1, 2017
 Oregon Water Conditions Report May 1, 2017 Mountain snowpack in the higher elevations has continued to increase over the last two weeks. Statewide, most low and mid elevation snow has melted so the basin
2015 Fall Conditions Report
 2015 Fall Conditions Report Prepared by: Hydrologic Forecast Centre Date: December 21 st, 2015 Table of Contents Table of Figures... ii EXECUTIVE SUMMARY... 1 BACKGROUND... 2 SUMMER AND FALL PRECIPITATION...
The Hydrologic Cycle: How Do River Forecast Centers Measure the Parts?
 The Hydrologic Cycle: How Do River Forecast Centers Measure the Parts? Greg Story Meteorologist National Weather Service Fort Worth, TX Overview n Introduction What is the mission of an RFC? n The Hydrologic
ENGINEERING HYDROLOGY
 ENGINEERING HYDROLOGY Prof. Rajesh Bhagat Asst. Professor Civil Engineering Department Yeshwantrao Chavan College Of Engineering Nagpur B. E. (Civil Engg.) M. Tech. (Enviro. Engg.) GCOE, Amravati VNIT,
NIDIS Intermountain West Regional Drought Early Warning System February 7, 2017
 NIDIS Drought and Water Assessment NIDIS Intermountain West Regional Drought Early Warning System February 7, 2017 Precipitation The images above use daily precipitation statistics from NWS COOP, CoCoRaHS,
NOAA National Centers for Environmental Information State Summaries 149-FL. Observed and Projected Temperature Change
 19-FL FLORIDA Key Messages Under a higher emissions pathway, historically unprecedented warming is projected by the end of the 1st century. Rising temperatures will likely increase the intensity of naturally-occurring
Ecological Context - Urban settlements are part of their surrounding ecosystem. Austin
 Ecological Context - Urban settlements are part of their surrounding ecosystem Austin Ecotone Division between West and East Flyway Uplift River Balcones Escarpment Central Texas Climate The principal
Talk Overview. Concepts. Climatology. Monitoring. Applications
 Atmospheric Rivers Talk Overview Concepts Climatology Monitoring Applications Satellite View Where is the storm? Where is the impact? Atmospheric Rivers Plume or fire hose of tropical moisture Heavy precipitation
Comparative Analysis of Hurricane Vulnerability in New Orleans and Baton Rouge. Dr. Marc Levitan LSU Hurricane Center. April 2003
 Comparative Analysis of Hurricane Vulnerability in New Orleans and Baton Rouge Dr. Marc Levitan LSU Hurricane Center April 2003 In order to compare hurricane vulnerability of facilities located in different
NOAA National Centers for Environmental Information State Summaries 149-HI. Observed and Projected Temperature Change
 9-HI HAWAI I Key Messages Average annual temperature has increased by about F since 95, with a leveling off of the rate of warming in the last two decades. Under a higher emissions pathway, historically
A SURVEY OF HYDROCLIMATE, FLOODING, AND RUNOFF IN THE RED RIVER BASIN PRIOR TO 1870
 A SURVEY OF HYDROCLIMATE, FLOODING, AND RUNOFF IN THE RED RIVER BASIN PRIOR TO 1870 W. F. RANNIE (UNIVERSITY OF WINNIPEG) Prepared for the Geological Survey of Canada September, 1998 TABLE OF CONTENTS
Climates of NYS. Definitions. Climate Regions of NYS. Storm Tracks. Climate Controls 10/13/2011. Characteristics of NYS s Climates
 Definitions Climates of NYS Prof. Anthony Grande 2011 Weather and Climate Weather the state of the atmosphere at one point in time. The elements of weather are temperature, air pressure, wind and moisture.
sea levels 100 year/ payments. FIGURE 1
 MIAMI DADE COUNTY CLIMATE INDICATORS RAINFALL SUMMARY Much of Miami Dade County is susceptible to localized flooding, particularly during the rainy season of June through October. The County s flat terrain
Oregon Water Conditions Report April 17, 2017
 Oregon Water Conditions Report April 17, 2017 Mountain snowpack continues to maintain significant levels for mid-april. By late March, statewide snowpack had declined to 118 percent of normal after starting
2016 Fall Conditions Report
 2016 Fall Conditions Report Prepared by: Hydrologic Forecast Centre Date: December 13, 2016 Table of Contents TABLE OF FIGURES... ii EXECUTIVE SUMMARY... 1 BACKGROUND... 5 SUMMER AND FALL PRECIPITATION...
USING GIS TO MODEL AND ANALYZE HISTORICAL FLOODING OF THE GUADALUPE RIVER NEAR NEW BRAUNFELS, TEXAS
 USING GIS TO MODEL AND ANALYZE HISTORICAL FLOODING OF THE GUADALUPE RIVER NEAR NEW BRAUNFELS, TEXAS ASHLEY EVANS While the state of Texas is well-known for flooding, the Guadalupe River Basin is one of
Presentation Overview. Southwestern Climate: Past, present and future. Global Energy Balance. What is climate?
 Southwestern Climate: Past, present and future Mike Crimmins Climate Science Extension Specialist Dept. of Soil, Water, & Env. Science & Arizona Cooperative Extension The University of Arizona Presentation
Page 1. Name:
 Name: 1) As the difference between the dewpoint temperature and the air temperature decreases, the probability of precipitation increases remains the same decreases 2) Which statement best explains why
5.2 IDENTIFICATION OF HAZARDS OF CONCERN
 5.2 IDENTIFICATION OF HAZARDS OF CONCERN 2016 HMP Update Changes The 2011 HMP hazard identification was presented in Section 3. For the 2016 HMP update, the hazard identification is presented in subsection
Ellen L. Mecray NOAA Regional Climate Services Director, Eastern Region Taunton, MA
 Ellen L. Mecray NOAA Regional Climate Services Director, Eastern Region Taunton, MA Regions of the US National Climate Assessment What we Observe: Climate changes and impacts Increasing temperature Increasingly
Delaware River Flood Advisory Committee
 Delaware River Flood Advisory Committee A Partnership to Support Flood Mitigation Alan Tamm Pennsylvania Emergency Management Agency Bureau of Recovery and Mitigation atamm@state.pa.us Peter Gabrielsen
The hydrologic service area (HSA) for this office covers Central Kentucky and South Central Indiana.
 for this office covers Central Kentucky and South Central Indiana.") January 2012 February 13, 2012 An X inside this box indicates that no flooding occurred within this hydrologic service area. January 2012 continued the string of wet months this winter. Rainfall was generally
January 2012 February 13, 2012 An X inside this box indicates that no flooding occurred within this hydrologic service area. January 2012 continued the string of wet months this winter. Rainfall was generally
Foundations of Earth Science, 6e Lutgens, Tarbuck, & Tasa
 Foundations of Earth Science, 6e Lutgens, Tarbuck, & Tasa Weather Patterns and Severe Weather Foundations, 6e - Chapter 14 Stan Hatfield Southwestern Illinois College Air masses Characteristics Large body
Indiana County Flash Flood of 22 June 2017
 Indiana County Flash Flood of 22 June 2017 By Richard H. Grumm National Weather Service State College, PA 1. Overview Slow moving thunderstorms brought 3 to 4 inches of rainfall to Indiana County, PA during
Design Storms for Hydrologic Analysis
 Design Storms for Hydrologic Analysis Course Description This course is designed to fulfill two hours of continuing education credit for Professional Engineers. Its objective is to provide students with
5.2. IDENTIFICATION OF NATURAL HAZARDS OF CONCERN
 5.2. IDENTIFICATION OF NATURAL HAZARDS OF CONCERN To provide a strong foundation for mitigation strategies considered in Sections 6 and 9, County considered a full range of natural hazards that could impact
Adaptation by Design: The Impact of the Changing Climate on Infrastructure
 Adaptation by Design: The Impact of the Changing Climate on Infrastructure Heather Auld, J Klaassen, S Fernandez, S Eng, S Cheng, D MacIver, N Comer Adaptation and Impacts Research Division Environment
Flooding. April 21, Notes 4/20 CONGRATULATIONS!!!!! Activity 2: AZ State Museum due TODAY. Extra Credit 2: Returned at end of class
 April 21, 2011 Flooding 1927 Mississippi Flood Notes 4/20 Activity 2: AZ State Museum due TODAY Extra Credit 2: Returned at end of class CONGRATULATIONS!!!!! Andrew Richard Undergraduate Research Grant
FEMA Hazards Loss Modeling Task Force (MOTF) Situation Report #14. Colorado Spring Flood Risk ***FINAL REPORT***
 Situation Report #14. Colorado Spring Flood Risk ***FINAL REPORT***") FEMA Hazards Loss Modeling Task Force (MOTF) Situation Report #14 Colorado Spring Flood Risk FEMA Modeling Task Force (MOTF) Denver Federal Center, Building 710A Denver, Colorado 80225 Email: FEMA-MOTF@fema.dhs.gov
FEMA Hazards Loss Modeling Task Force (MOTF) Situation Report #14 Colorado Spring Flood Risk FEMA Modeling Task Force (MOTF) Denver Federal Center, Building 710A Denver, Colorado 80225 Email: FEMA-MOTF@fema.dhs.gov
Active Weather Threat Halloween Week Nor easter October 28 th 31 st 2012
 Active Weather Threat Halloween Week Nor easter October 28 th 31 st 2012 Prepared 1130 AM EDT Wednesday, October 24, 2012 Gary Szatkowski NOAA s NJ Forecast Office Weather.gov/phi Purpose of Briefing Briefing
NIDIS Intermountain West Drought Early Warning System May 23, 2017
 NIDIS Drought and Water Assessment NIDIS Intermountain West Drought Early Warning System May 23, 2017 Precipitation The images above use daily precipitation statistics from NWS COOP, CoCoRaHS, and CoAgMet
MODELLING FROST RISK IN APPLE TREE, IRAN. Mohammad Rahimi
 WMO Regional Seminar on strategic Capacity Development of National Meteorological and Hydrological Services in RA II (Opportunity and Challenges in 21th century) Tashkent, Uzbekistan, 3-4 December 2008
Hurricane Matthew Threats and Impacts Briefing for Eastern NC
 Hurricane Matthew Threats and Impacts Briefing for Eastern NC October 6 th, 2016 Date/Time Created: 10/6/2016, Noon EDT National Weather Service Newport/Morehead City, NC Hurricane Matthew Key Points Changes
Ellen L. Mecray NOAA Regional Climate Services Director, Eastern Region Taunton, MA
 Ellen L. Mecray NOAA Regional Climate Services Director, Eastern Region Taunton, MA Regions of the US National Climate Assessment What we Observe: Climate changes and impacts Extreme precipitation and
Monthly Long Range Weather Commentary Issued: SEPTEMBER 19, 2016 Steven A. Root, CCM, Chief Analytics Officer, Sr. VP,
 Monthly Long Range Weather Commentary Issued: SEPTEMBER 19, 2016 Steven A. Root, CCM, Chief Analytics Officer, Sr. VP, sroot@weatherbank.com SEPTEMBER 2016 Climate Highlights The Month in Review The contiguous
Changing Climate. An Engineering challenge for today and the future. Milwaukee School of Engineering December 2, 2015
 Changing Climate An Engineering challenge for today and the future David S. Liebl UW- Madison, EPD; UW-Extension; Wisconsin Initiative on Climate change Impacts Milwaukee School of Engineering December
UK Flooding Feb 2003
 UK Flooding 2000 06 Feb 2003 Britain has taken a battering from floods in the last 5 years, with major events in 1998 and 2000, significant floods in 2001 and minor events in each of the other years. So
Ground Water Protection Council 2017 Annual Forum Boston, Massachusetts. Ben Binder (303)
") Ground Water Protection Council 2017 Annual Forum Boston, Massachusetts Protecting Groundwater Sources from Flood Borne Contamination Ben Binder (303) 860-0600 Digital Design Group, Inc. The Problem Houston
Ground Water Protection Council 2017 Annual Forum Boston, Massachusetts Protecting Groundwater Sources from Flood Borne Contamination Ben Binder (303) 860-0600 Digital Design Group, Inc. The Problem Houston
Areal Reduction Factors for the Colorado Front Range and Analysis of the September 2013 Colorado Storm
 Areal Reduction Factors for the Colorado Front Range and Analysis of the September 2013 Colorado Storm Doug Hultstrand, Bill Kappel, Geoff Muhlestein Applied Weather Associates, LLC - Monument, Colorado
5.2 IDENTIFICATION OF HAZARDS OF CONCERN
 5.2 IDENTIFICATION OF HAZARDS OF CONCERN 2015 HMP Update Changes The 2010 HMP hazard identification was presented in Section 6. For the 2015 HMP update, the hazard identification is presented in subsection
Definitions Weather and Climate Climates of NYS Weather Climate 2012 Characteristics of Climate Regions of NYS NYS s Climates 1.
 Definitions Climates of NYS Prof. Anthony Grande 2012 Weather and Climate Weather the state of the atmosphere at one point in time. The elements of weather are temperature, t air pressure, wind and moisture.
Flood Risk Assessment
 Flood Risk Assessment February 14, 2008 Larry Schick Army Corps of Engineers Seattle District Meteorologist General Assessment As promised, La Nina caused an active winter with above to much above normal
Extreme Rainfall in the Southeast U.S.
 Extreme Rainfall in the Southeast U.S. David F. Zierden Florida State Climatologist Center for Ocean Atmospheric Prediction Studies The Florida State University March 7, 2016 Causes of Extreme Rainfall
Flash Flood Guidance System On-going Enhancements
 Flash Flood Guidance System On-going Enhancements Hydrologic Research Center, USA Technical Developer SAOFFG Steering Committee Meeting 1 10-12 July 2017 Jakarta, INDONESIA Theresa M. Modrick Hansen, PhD
Climate Outlook through 2100 South Florida Ecological Services Office Vero Beach, FL January 13, 2015
 Climate Outlook through 2100 South Florida Ecological Services Office Vero Beach, FL January 13, 2015 Short Term Drought Map: Short-term (
NOAA s National Weather Service Advanced Hydrologic Prediction System (AHPS) and Inclusion of Reservoir Spills
 and Inclusion of Reservoir Spills") NOAA s National Weather Service Advanced Hydrologic Prediction System (AHPS) and Inclusion of Reservoir Spills Peter R. Ahnert Middle Atlantic River Forecast Center, State College PA Topics Covered Mission
NOAA s National Weather Service Advanced Hydrologic Prediction System (AHPS) and Inclusion of Reservoir Spills Peter R. Ahnert Middle Atlantic River Forecast Center, State College PA Topics Covered Mission
How we know the world has warmed
 How we know the world has warmed A comprehensive review of key climate indicators confirms the world is warming and the past decade was the warmest on record. More than 3 scientists from 48 countries analyzed
Alluvial Fan Flooding Workshop. Barry Pierce National Weather Service, Las Vegas
 Alluvial Fan Flooding Workshop Barry Pierce National Weather Service, Las Vegas Death Valley NP, August 15, 2004 Outline National Weather Service Alluvial Fan/Flash Flooding Weather Regimes Conducive For
Goals of Presentation
 Hydrometeorlogical Prediction Center (HPC) Forecast Operations Branch Winter Weather Desk Dan Petersen Dan.Petersen@noaa.gov 301-763-8201 Review HPC winter weather desk forecasts Review winter weather
Folsom Dam Water Control Manual Update
 Folsom Dam Water Control Manual Update Public Workshop April 3, 2014 Location: Sterling Hotel Ballroom 1300 H Street, Sacramento US Army Corps of Engineers BUILDING STRONG WELCOME & INTRODUCTIONS 2 BUILDING
Impacts of the April 2013 Mean trough over central North America
 Impacts of the April 2013 Mean trough over central North America By Richard H. Grumm National Weather Service State College, PA Abstract: The mean 500 hpa flow over North America featured a trough over
Climate of Columbus. Aaron Wilson. Byrd Polar & Climate Research Center State Climate Office of Ohio.
 Climate of Columbus Aaron Wilson Byrd Polar & Climate Research Center http://bpcrc.osu.edu/greenteam Overview Historical Climatology Climate Change & Impacts Projected Changes Summary 2 Historical Climatology
SEVERE WEATHER 101. Flood Basics
 SEVERE WEATHER 101 Flood Basics What is flooding? Flooding is an overflowing of water onto land that is normally dry. Floods can happen during heavy rains, when ocean waves come on shore, when snow melts
GIS Techniques for Floodplain Delineation. Dean Djokic
 GIS Techniques for Floodplain Delineation Dean Djokic (ddjokic@esri.com) Content What is a floodplain? How to get a floodplain? What can GIS do for floodplain modeling? Simple GIS techniques for floodplain
Northeast River Forecast Center s
 Northeast River Forecast Center s Apr 13 th Spring Outlook Brought to you by: Edward Capone Service Coordination Hydrologist Overview to Include: Potential flood outlook convective/synoptic conditions
2 July 2013 Flash Flood Event
 2 July 2013 Flash Flood Event By Richard H. Grumm and Charles Ross National Weather Service State College, PA 1. Overview A retrograding 500 hpa cyclone and anticyclone (Fig. 1) set up deep southerly flow
Spring Water Supply and Weather Outlook How about that near Miracle March?
 Spring Water Supply and Weather Outlook How about that near Miracle March? tim.bardsley@noaa.gov NWS Reno 4.10.18 1 Out the Window March and early April have been Boom not Bust Key Points Up Front Wet
An overview of the applications for early warning and mapping of the flood events in New Brunswick
 Flood Recovery, Innovation and Reponse IV 239 An overview of the applications for early warning and mapping of the flood events in New Brunswick D. Mioc 1, E. McGillivray 2, F. Anton 1, M. Mezouaghi 2,
Operational Hydrologic Ensemble Forecasting. Rob Hartman Hydrologist in Charge NWS / California-Nevada River Forecast Center
 Operational Hydrologic Ensemble Forecasting Rob Hartman Hydrologist in Charge NWS / California-Nevada River Forecast Center Mission of NWS Hydrologic Services Program Provide river and flood forecasts
National Situation Report As of 5:00 a.m. EDT Tuesday, April 4, 2017
 Overview National Situation Report As of 5:00 a.m. EDT Tuesday, April 4, 2017 Table Of Contents Current Operations Monitoring Recovery National Response Coordination Center: Not Activated National Watch
Operational Perspectives on Hydrologic Model Data Assimilation
 Operational Perspectives on Hydrologic Model Data Assimilation Rob Hartman Hydrologist in Charge NOAA / National Weather Service California-Nevada River Forecast Center Sacramento, CA USA Outline Operational
X An X inside this box indicates that no flooding occurred within this Hydrologic Service Area.
 NWS FORM E-5 U.S. DEPARTMENT OF COMMERCE HSA OFFICE: NOAA, NATIONAL WEATHER SERVICE MONTHLY REPORT OF RIVER AND FLOOD CONDITIONS DATE: TO: North Webster, IN REPORT FOR (MONTH &YEAR): January, 2003 February
Current Water Conditions in Massachusetts January 11, 2008
 Current Water Conditions in Massachusetts January 11, 2008 December precipitation was above normal December streamflows were below normal and normal December ground-water levels were below normal and normal
2017 Fall Conditions Report
 2017 Fall Conditions Report Prepared by: Hydrologic Forecast Centre Date: November 15, 2017 Table of Contents TABLE OF FIGURES... ii EXECUTIVE SUMMARY... 1 BACKGROUND... 4 SUMMER AND FALL PRECIPITATION...
Changes to Extreme Precipitation Events: What the Historical Record Shows and What It Means for Engineers
 Changes to Extreme Precipitation Events: What the Historical Record Shows and What It Means for Engineers Geoffrey M Bonnin National Oceanic and Atmospheric Administration National Weather Service Office
THE CANADIAN CENTRE FOR CLIMATE MODELLING AND ANALYSIS
 THE CANADIAN CENTRE FOR CLIMATE MODELLING AND ANALYSIS As Canada s climate changes, and weather patterns shift, Canadian climate models provide guidance in an uncertain future. CANADA S CLIMATE IS CHANGING
Weather and Climate 1. Elements of the weather
 Weather and Climate 1 affect = to have an effect on, influence, change altitude = the height of a place above the sea axis = the line around which an object rotates certain = special consist of = to be