Ecological Context - Urban settlements are part of their surrounding ecosystem. Austin
|
|
|
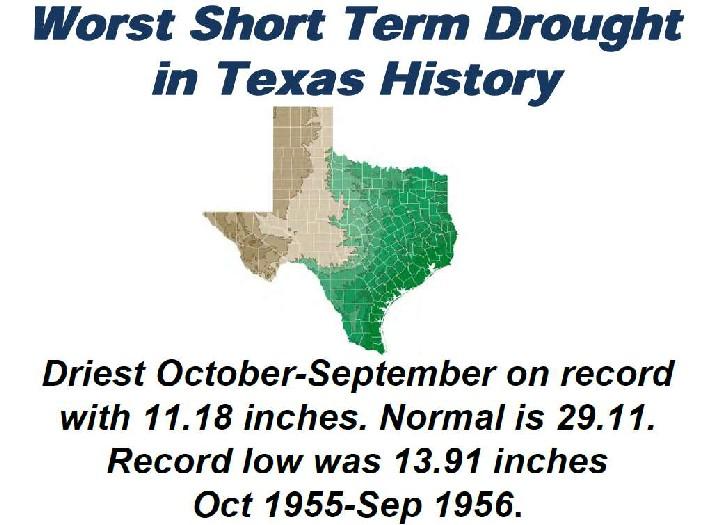
- Cuthbert Collins
- 5 years ago
- Views:
Transcription
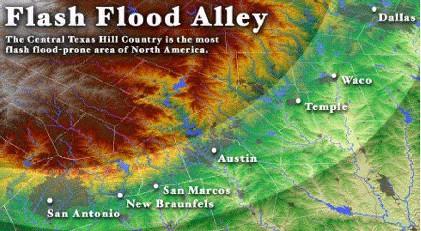
1 Ecological Context - Urban settlements are part of their surrounding ecosystem Austin
2 Ecotone Division between West and East Flyway Uplift River
3 Balcones Escarpment

4 Central Texas Climate The principal sources of moisture for Texas are the Gulf of Mexico and, to a lesser extent, the eastern Pacific Ocean. Moisture from the Gulf of Mexico is carried into the State by low-level southerly and southeasterly winds. Moisture from the eastern Pacific is carried into the State from the southwest by tropical continental air masses. In addition to the oceans, important moisture sources include local and upwind land masses, as well as lakes and reservoirs, from which moisture evaporates to the atmosphere. Typically as a moisture-laden ocean air mass moves inland, it is combined with moisture that has been recycled through the land-vegetation-air interface. Land Recycled Moisture Gulf and Subtropical Moisture
5
6 Thrall Flood 1921 This storm caused the most deadly floods in Texas, with a total of 215 fatalities. On September 9 and 10, 1921, the remnants of a hurricane moved over Williamson County. The center of the storm became stationary over Thrall, dropping a storm total of 39.7 inches of rain in 36 hours. The 24-hour rainfall total ending 7 AM on September 10, 1921 (38.2 inches) at a U.S. Weather Bureau station in Thrall. Eighty-seven people drowned in and near Taylor, and 93 in Williamson County. On July 25, 1979 Tropical Storm Claudette stalled over Alvin and inundated the region with 45 inches in 42 hours. That total included 43 inches in 24 hours, the maximum 24-hour rainfall in US history.

7 Colorado River Flood History

8 Floods - More than 80 flood events have been recorded in the lower Colorado River basin since the 1800s. These events range from isolated floods that affected local areas to basinwide floods spawned by unusually heavy rainfalls. February 1843: In the earliest flood for which there is a written account, floodwaters cause the Colorado River to crest at a stage of 36 feet at Austin. July 1869: In what is considered to be the worst flood on record, the Colorado crests at 51 feet at Austin and produces record crests of 60.3 feet at Bastrop, 56.7 feet at La Grange, 51.6 feet at Columbus, 51.9 feet at Wharton and 56.1 feet at Bay City. Bastrop and La Grange are inundated. Reports describe rainfall as incessant for 64 hours, the river at Austin more than 10 miles wide, and floating buffalo carcasses in the river (indicating that some of the floodwaters originated in the High Plains). Damage is estimated at $3 million.


9 1900: Flood destroyed the Austin Dam. 1913: Flood merged the mouths of the Colorado and adjacent Brazos rivers, forming a lake 65 miles wide. 1915: Floodwaters from storms in April and September severely damage the second Austin Dam, completed in The structure will lie unrepaired for more than two decades until it is rebuilt by LCRA in the late 1930s.


10 June 1935: Floodwaters from heavy Hill Country rains cause the Colorado River in Austin to crest at 50 feet, one foot below the 1869 record. The river overwhelms the Congress Avenue Bridge, cutting Austin in half. The Llano River rises to its highest recorded stage of 41½ feet, streamflow 388,000 cubic feet per second. September 1936: Floodwaters from heavy rains throughout the basin pour through the Colorado River at Austin for a 20-day period, cresting at 31.4 feet. Earlier, floodwaters from a 30-inch rain on the Concho River had washed away nearly 300 buildings in San Angelo. July 1938: Twenty inches of rain over 12 counties pour more than 3 million acre-feet of floodwaters into newly completed Lake Buchanan, forcing LCRA to open 22 of Buchanan Dam s 37 floodgates.
11
12


13 Dangerous flash flood threatens Austin Tropical Storm Hermine drops inches of rain Wednesday, 08 Sep 2010, 5:32 PM CDT AUSTIN (KXAN) - An incredible flash flood developed early Wednesday morning in Central Texas as Tropical Depression Hermine lifted slowly northward from the Hill Country into the Big Country. Some 6- to 15 inches of rain were reported in many locations from San Antonio to Killeen, including most of Hays, Travis and Williamson counties. Numerous water rescues were reported overnight. Many roads were closed, and some evacuations were ordered, particularly in Williamson County. Brushy, Onion and Barton creeks and the Colorado River were all under Flood Warning early Wednesday. Very heavy rain fell directly into Lake Austin, with more than 12 inches recorded at Mansfield Dam. Runoff from Bull Creek also flowed into the lake, forcing the LCRA to open flood gates on Tom Miller Dam. As a result, the level of Lady Bird Lake was rising, causing minor flooding in low lying areas along Cesar Chavez and Austin High School.

14 September 2011
15
 1 1952 - Aug.")

16 The Texas Drought The following table shows the 10 lowest monthly inflows into Highland Lakes on record. Rank Date Inflows (acre-feet) Aug July Aug July Sept June 1, Aug. 1, Sept. 2, Aug. 2, Aug. 2,584

17 Texas Paleoclimatic Record and Landscape Ecology The paleoclimatic record of past droughts is a better guide than what is provided by the instrumental record alone of what we should expect in terms of the magnitude and duration of future droughts. For example, paleoclimatic data suggest that droughts as severe at the 1950s drought have occurred in central North America several times a century over the past years, and thus we should expect (and plan for) similar droughts in the future. The paleoclimatic record also indicates that droughts of a much greater duration than any in 20th century have occurred in parts of North American as recently as 500 years ago. This data indicates that we should be aware of the possibility of such droughts occurring in the future as well. The occurrence of such sustained drought conditions today would be a natural disaster of a magnitude unprecedented in the 20th century. Changing scene. Based on findings from pack rat middens, this artist's conception shows what Hueco Tanks may have looked like some 12,000 to 14,000 years ago (far left), some 9,300 years ago (middle) and as it appears today (right).


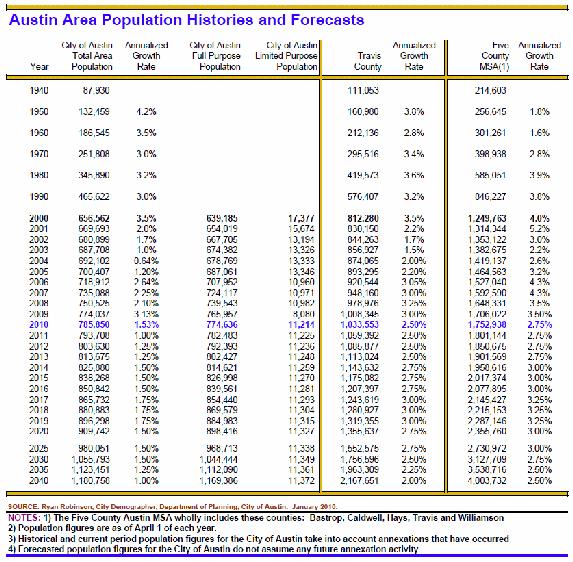
18 Urbanization and Landscape Ecology Austin, Texas Population Austin MSA 1,818,
19

20 The Habitats of Austin
Summer 2007 Flood Report
 Summer 2007 Flood Report LCRA Water Services River Operations Center NEXRAD image of the June 27 storm that triggered the Summer 2007 Flood Executive Summary Flood Facts: The Summer 2007 Flood was unexpected,
LOWER COLORADO RIVER FLOOD GUIDE
 HIGHLAND L AKES AND LOWER COLORADO RIVER FLOOD GUIDE MANAGING THE COLORADO RIVER More than 80 years ago, the Texas Legislature created the Lower Colorado River Authority to help curtail frequent flooding
Drought. Jeffrey Lindner Meteorologist Harris County Flood Control District September 20, 2011
 2010-2011 Drought Jeffrey Lindner Meteorologist Harris County Flood Control District September 20, 2011 Texas Annual Rainfall Texas Annual Rainfall 1895-2010 Texas Annual Temperature 1895-2010 Notice Any
Watershed Detectives:
 Watershed Detectives: Making Science Relevant Jessica Gordon City of Austin Watershed Protection Jessica.Gordon@austintexas.gov Watershed Detectives: Making Science Relevant The Fish Kill Mystery Austin-based,
Tropical Storm Harvey: SE Texas Impacts
 Tropical Storm Harvey: SE Texas Impacts 10 AM CDT UPDATE Thursday, August 24, 2017 Prepared by: Dan Reilly, Brian Kyle PLEASE MUTE YOUR LINES AND DON T PUT ON HOLD! Situation Overview Tropical Storm Harvey
Hydrologic Briefing Tropical Storm Harvey
 Hydrologic Briefing Tropical Storm Harvey 10:30 AM CDT Sunday, August 27, 2017 Prepared by: John Metz NWSCorpus www.weather.gov/corpuschristi Situation Overview Tropical Storm Harvey Harvey to remain a
Tropical Update. 5 PM EDT Sunday, September 10, 2017 Hurricane Irma, Hurricane Jose, Tropical Wave (60%)
") Tropical Update 5 PM EDT Sunday, September 10, 2017 Hurricane Irma, Hurricane Jose, Tropical Wave (60%) This update is intended for government and emergency response officials, and is provided for informational
Tropical Update 5 PM EDT Sunday, September 10, 2017 Hurricane Irma, Hurricane Jose, Tropical Wave (60%) This update is intended for government and emergency response officials, and is provided for informational
Monthly Long Range Weather Commentary Issued: SEPTEMBER 19, 2016 Steven A. Root, CCM, Chief Analytics Officer, Sr. VP,
 Monthly Long Range Weather Commentary Issued: SEPTEMBER 19, 2016 Steven A. Root, CCM, Chief Analytics Officer, Sr. VP, sroot@weatherbank.com SEPTEMBER 2016 Climate Highlights The Month in Review The contiguous
Natural Texas. Regions and Climates
 Natural Texas Regions and Climates Two Kinds: Physical geography Climate, vegetation, rivers, lakes, oceans, plateaus, plains, and mountain ranges Human geography Economic activities How we earn a living
NOAA National Centers for Environmental Information State Summaries 149-TX. Observed and Projected Temperature Change
 19-TX TEXAS Key Messages Mean annual temperature has increased by approximately 1 F since the first half of the th century. Under a higher emissions pathway, historically unprecedented warming is projected
Hurricane Harvey: SE Texas Impacts. 10 AM CDT UPDATE Saturday, August 26, 2017 Prepared by: Dan Reilly, Brian Kyle
 Hurricane Harvey: SE Texas Impacts 10 AM CDT UPDATE Saturday, August 26, 2017 Prepared by: Dan Reilly, Brian Kyle Latest Observations and Radar Hurricane Harvey centered near Victoria and weakening Wind
Monthly Long Range Weather Commentary Issued: APRIL 18, 2017 Steven A. Root, CCM, Chief Analytics Officer, Sr. VP,
 Monthly Long Range Weather Commentary Issued: APRIL 18, 2017 Steven A. Root, CCM, Chief Analytics Officer, Sr. VP, sroot@weatherbank.com MARCH 2017 Climate Highlights The Month in Review The average contiguous
Tropical Update. 5 PM EDT Thursday, September 7, 2017 Hurricane Irma, Hurricane Jose, and Hurricane Katia
 Tropical Update 5 PM EDT Thursday, September 7, 2017 Hurricane Irma, Hurricane Jose, and Hurricane Katia This update is intended for government and emergency response officials, and is provided for informational
Hurricane Harvey: SE Texas Impacts. 10 PM CDT UPDATE Friday, August 25, 2017 Prepared by: Lance Wood
 Hurricane Harvey: SE Texas Impacts 10 PM CDT UPDATE Friday, August 25, 2017 Prepared by: Lance Wood Latest Observations Hurricane Harvey making landfall this evening near Rockport as a category 4 hurricane.
NIDIS Intermountain West Regional Drought Early Warning System February 7, 2017
 NIDIS Drought and Water Assessment NIDIS Intermountain West Regional Drought Early Warning System February 7, 2017 Precipitation The images above use daily precipitation statistics from NWS COOP, CoCoRaHS,
TROPICAL STORM HARVEY BRIEFING
 TROPICAL STORM HARVEY BRIEFING 1 PM CDT Saturday, August 26, 2017 Prepared by: John Metz NWSCorpus www.weather.gov/corpuschristi Overview Life-threatening conditions continue. Storm Surge Warnings remain
TROPICAL DEPRESSION HARVEY BRIEFING
 TROPICAL DEPRESSION HARVEY BRIEFING 10:15 PM CDT Wednesday, August 23, 2017 Prepared by: Lara Beal NWSCorpus www.weather.gov/corpuschristi Situation Overview No changes to Watches. Hurricane Watch remains
Tropical Update. 11 AM EDT Wednesday, October 10, 2018 Hurricane Michael, Hurricane Leslie & Tropical Storm Nadine, Caribbean Low (40%)
") Tropical Update 11 AM EDT Wednesday, October 10, 2018 Hurricane Michael, Hurricane Leslie & Tropical Storm Nadine, Caribbean Low (40%) This update is intended for government and emergency response officials,
Tropical Update 11 AM EDT Wednesday, October 10, 2018 Hurricane Michael, Hurricane Leslie & Tropical Storm Nadine, Caribbean Low (40%) This update is intended for government and emergency response officials,
Hydrologic Briefing Tropical Storm Harvey
 Hydrologic Briefing Tropical Storm Harvey 5:00 PM CDT Sunday, August 27, 2017 Prepared by: Jennifer Dunn/Christina Barron NWSCorpus www.weather.gov/corpuschristi Situation Overview Tropical Storm Harvey
Name Earth Science Pd. Hurricanes. Directions: Read the information, view diagrams and answer the questions in the worksheet.
 Hurricanes Directions: Read the information, view diagrams and answer the questions in the worksheet. Hurricane Basics The ingredients for a hurricane include a pre-existing weather disturbance, warm tropical
Flooding. April 21, Notes 4/20 CONGRATULATIONS!!!!! Activity 2: AZ State Museum due TODAY. Extra Credit 2: Returned at end of class
 April 21, 2011 Flooding 1927 Mississippi Flood Notes 4/20 Activity 2: AZ State Museum due TODAY Extra Credit 2: Returned at end of class CONGRATULATIONS!!!!! Andrew Richard Undergraduate Research Grant
Comparative Analysis of Hurricane Vulnerability in New Orleans and Baton Rouge. Dr. Marc Levitan LSU Hurricane Center. April 2003
 Comparative Analysis of Hurricane Vulnerability in New Orleans and Baton Rouge Dr. Marc Levitan LSU Hurricane Center April 2003 In order to compare hurricane vulnerability of facilities located in different
Extreme Weather and Climate Change Vulnerability Assessment of Central Texas Transportation Infrastructure
 Extreme Weather and Climate Change Vulnerability Assessment of Central Texas Transportation Infrastructure Federal Highway Administration (FHWA) Pilot Project TxDOT Transportation Planning Conference June
Major and Catastropic Storms and Floods in Texas
 Major and Catastropic Storms and Floods in Texas Source: h=ÿp.ÿ!= fl!flop_d.safet_.ÿl=.ÿeÿ_u SG Sd e m o/b a cl
HURRICANES AND TORNADOES
 HURRICANES AND TORNADOES The most severe weather systems are hurricanes and tornadoes. They occur in extremely low pressure systems, or cyclones, when the air spirals rapidly into the center of a low.
SIGNIFICANT EVENTS Severe Storms November 1994 January 1996 August 1998 and May 2000 March 2002 May 2002 Champaign County
 SIGNIFICANT EVENTS Severe Storms November 1994 On Nov. 1, 1994, high winds gusted over 60 mph at times across the northwest third of Ohio. The highest measured wind gust was 63 mph at Columbus Grove (Putnam).
NWS HURRICANES June 3, 2015
 NWS HURRICANES June 3, 2015 Hurricane Season June 1 November 30 2 What s the concern? All tropical systems passing within 125nm of central Maryland since 1950 Mid-Atlantic Hurricanes Greatest Risk: August
Natural Disasters. in Florida. Severe Thunderstorms
 Natural Disasters in Florida SC.6.E.7.7 Investigate how natural disasters have affected human life in Florida. Severe Thunderstorms While the typical afternoon thunderstorm in Florida may not appear to
Severe Weather Potential for Southeast Texas
 Severe Weather Potential for Southeast Texas Dan Reilly, Kent Prochazka, Scott Overpeck National Weather Service Houston/Galveston 10 am Synopsis Storm to likely bring severe weather to Southeast Texas
CLIMATE READY BOSTON. Climate Projections Consensus ADAPTED FROM THE BOSTON RESEARCH ADVISORY GROUP REPORT MAY 2016
 CLIMATE READY BOSTON Sasaki Steering Committee Meeting, March 28 nd, 2016 Climate Projections Consensus ADAPTED FROM THE BOSTON RESEARCH ADVISORY GROUP REPORT MAY 2016 WHAT S IN STORE FOR BOSTON S CLIMATE?
Queensland Floods- Part A
 Queensland Floods- Part A Floods Flooding is when the water level in a creek, river, lake or the sea rises and covers land that is normally dry. The rise in water can be due to numerous causes, although
Rainfall Observations in the Loxahatchee River Watershed
 Rainfall Observations in the Loxahatchee River Watershed Richard C. Dent Loxahatchee River District September 1997 Introduction Rain is a common occurrence in south Florida, yet its presence or absence
Objectives. Understand the different physical & human characteristics of each region
 TEXAS REGIONS Objectives Know the 4 regions of Texas Understand the different physical & human characteristics of each region Understand how physical differences affect human characteristics (way of life)
Unit 4. This unit will enable you to improve coordination and communication with State and local agencies when hazardous weather threatens.
 Unit 4 This unit will enable you to improve coordination and communication with State and local agencies when hazardous weather threatens. In this unit we will discuss the role of Emergency Managers in
Hurricanes. Cause: a low pressure storm system over warm ocean water. Effect: potential massive widespread destruction and flooding.
 Hurricanes Hurricanes Cause: a low pressure storm system over warm ocean water. Effect: potential massive widespread destruction and flooding. Hurricanes also known as: cyclone (Indian Ocean) or typhoon
ERTH 365 Homework #2: Hurricane Harvey. 100 points
 ERTH 365 Homework #2: Hurricane Harvey 100 points Due by 6pm, Tuesday 30 October 2018, ELECTRONIC SUBMISSON BY EMAIL ONLY BY 6PM (send to klevey@sfsu.edu) (acceptable formats: MS Word, Google Doc, plain
The hydrologic service area (HSA) for this office covers Central Kentucky and South Central Indiana.
 for this office covers Central Kentucky and South Central Indiana.") MONTH YEAR January 2011 February 15, 2011 X An X inside this box indicates that no flooding occurred within this hydrologic service area. January 2011 was drier than normal in all locations in the area.
MONTH YEAR January 2011 February 15, 2011 X An X inside this box indicates that no flooding occurred within this hydrologic service area. January 2011 was drier than normal in all locations in the area.
Foundations of Earth Science, 6e Lutgens, Tarbuck, & Tasa
 Foundations of Earth Science, 6e Lutgens, Tarbuck, & Tasa Weather Patterns and Severe Weather Foundations, 6e - Chapter 14 Stan Hatfield Southwestern Illinois College Air masses Characteristics Large body
Changes in Texas Ecoregions Copy the questions and answers
 Changes in Texas Ecoregions Copy the questions and answers 1. What are some kinds of damage that hurricanes cause? Roads and bridges might be washed away. Trees and power lines can be knocked down. Area
Untitled.notebook May 12, Thunderstorms. Moisture is needed to form clouds and precipitation the lifting of air, or uplift, must be very strong
 Thunderstorms Moisture is needed to form clouds and precipitation the lifting of air, or uplift, must be very strong cold air and warm air must mix; creating an active circulation system that has both
DEPARTMENT OF EARTH & CLIMATE SCIENCES Name SAN FRANCISCO STATE UNIVERSITY Nov 29, ERTH 360 Test #2 200 pts
 DEPARTMENT OF EARTH & CLIMATE SCIENCES Name SAN FRANCISCO STATE UNIVERSITY Nov 29, 2018 ERTH 360 Test #2 200 pts Each question is worth 4 points. Indicate your BEST CHOICE for each question on the Scantron
GC Briefing. Weather Sentinel Tropical Storm Michael. Status at 8 AM EDT (12 UTC) Today (NHC) Discussion. October 11, 2018
 Today (NHC) Discussion. October 11, 2018") GC Briefing Weather Sentinel Tropical Storm Michael October 11, 2018 After making landfall as a high-end category-4 hurricane on the Florida Panhandle, Michael weakened to tropical storm status early this
GC Briefing Weather Sentinel Tropical Storm Michael October 11, 2018 After making landfall as a high-end category-4 hurricane on the Florida Panhandle, Michael weakened to tropical storm status early this
Climate Change and Water Supply Research. Drought Response Workshop October 8, 2013
 Climate Change and Water Supply Research Drought Response Workshop October 8, 2013 DWR Photo Oroville Reservoir, 2009 Talk Overview Expectations History Atmospheric Rivers and Water Supply Current Research
The Colorado Drought : 2003: A Growing Concern. Roger Pielke, Sr. Colorado Climate Center.
 The Colorado Drought 2001-2003: 2003: A Growing Concern Roger Pielke, Sr. Colorado Climate Center Prepared by Tara Green and Odie Bliss http://climate.atmos.colostate.edu 2 2002 Drought History in Colorado
Tropical Storm Harvey: SE Texas Impacts. 10 AM CDT UPDATE Sunday August 27, 2017 Prepared by: Lance Wood
 Tropical Storm Harvey: SE Texas Impacts 10 AM CDT UPDATE Sunday August 27, 2017 Prepared by: Lance Wood Situation Overview Catastrophic flooding is ongoing with flash flood emergencies remaining in effect.
TROPICAL STORM HARVEY BRIEFING
 TROPICAL STORM HARVEY BRIEFING 10:00 AM CDT Sunday, August 27, 2017 Prepared by: NWS LIX NWSNewOrleans www.weather.gov/neworleans Situation Overview New Information Tropical Storm Winds 40mph Immediate
Satellite and Radar. 5:55 am Infrared Satellite with Surface Wind Arrows. 6:15 am Ruskin Doppler Radar. Large southerly wind field
 Satellite and Radar 5:55 am Infrared Satellite with Surface Wind Arrows 6:15 am Ruskin Doppler Radar Large southerly wind field Developing showers rotating onshore NHC Forecast Hurricane Warning Big Bend
2011 Year in Review TORNADOES
 2011 Year in Review The year 2011 had weather events that will be remembered for a long time. Two significant tornado outbreaks in April, widespread damage and power outages from Hurricane Irene in August
Monthly Long Range Weather Commentary Issued: NOVEMBER 16, 2015 Steven A. Root, CCM, Chief Analytics Officer, Sr. VP, sales
 Monthly Long Range Weather Commentary Issued: NOVEMBER 16, 2015 Steven A. Root, CCM, Chief Analytics Officer, Sr. VP, sales sroot@weatherbank.com OCTOBER 2015 Climate Highlights The Month in Review The
Hurricane Harvey Flood Emergency Response
 Hot Science - Cool Talk # 114 Hurricane Harvey Flood Emergency Response Dr. David Maidment September 14, 2018 Produced by and for Hot Science - Cool Talks by the Environmental Science Institute. We request
SEVERE WEATHER 101. Flood Basics
 SEVERE WEATHER 101 Flood Basics What is flooding? Flooding is an overflowing of water onto land that is normally dry. Floods can happen during heavy rains, when ocean waves come on shore, when snow melts
The hydrologic service area (HSA) for this office covers Central Kentucky and South Central Indiana.
 for this office covers Central Kentucky and South Central Indiana.") January 2012 February 13, 2012 An X inside this box indicates that no flooding occurred within this hydrologic service area. January 2012 continued the string of wet months this winter. Rainfall was generally
January 2012 February 13, 2012 An X inside this box indicates that no flooding occurred within this hydrologic service area. January 2012 continued the string of wet months this winter. Rainfall was generally
How strong does wind have to be to topple a garbage can?
 How strong does wind have to be to topple a garbage can? Imagine winds powerful enough to pick up a truck and toss it the length of a football field. Winds of this extreme sometimes happen in a tornado.
Extreme Rainfall in the Southeast U.S.
 Extreme Rainfall in the Southeast U.S. David F. Zierden Florida State Climatologist Center for Ocean Atmospheric Prediction Studies The Florida State University March 7, 2016 Causes of Extreme Rainfall
The Weather Wire. Contents: Summer 2018 Outlook. Summer 2018 Outlook Drought Monitor May Summary/Statistics June Preview Rainfall Totals
 The Weather Wire June 2018 Volume 25 Number 6 Contents: Summer 2018 Outlook Drought Monitor May Summary/Statistics June Preview Rainfall Totals Summer 2018 Outlook June 1 st marked the first day of meteorological
Midwest/Great Plains Climate-Drought Outlook September 20, 2018
 Midwest/Great Plains Climate-Drought Outlook September 20, 2018 Brian Fuchs National Drought Mitigation Center University of Nebraska-Lincoln School of Natural Resources September 20, 2018 General Information
NATIONAL WEATHER SERVICE
 January 2016 February 9, 2016 This was a dry month across the HSA despite one large and several smaller snowfalls. Most locations ended up 1-2 inches below normal for the month. The driest locations at
PEAK OVER THRESHOLD ANALYSIS OF HEAVY PRECIPITATION IN TEXAS. Rebecca Paulsen Edwards and Madelyn Akers Southwestern University, Georgetown, Texas
 519 PEAK OVER THRESHOLD ANALYSIS OF HEAVY PRECIPITATION IN TEXAS Rebecca Paulsen Edwards and Madelyn Akers Southwestern University, Georgetown, Texas 1. INTRODUCTION Heavy and extreme precipitation is
Tropical Update. 5 AM EDT Thursday, September 7, 2017 Hurricane Irma, Hurricane Jose, and Hurricane Katia
 Tropical Update 5 AM EDT Thursday, September 7, 2017 Hurricane Irma, Hurricane Jose, and Hurricane Katia This update is intended for government and emergency response officials, and is provided for informational
Hurricane Matthew. Life Threatening Flash Flooding Likely. National Weather Service Wilmington NC. Josh Weiss, Meteorologist
 Hurricane Matthew Life Threatening Flash Flooding Likely Threat Assessment for northeast South Carolina & southeast North Carolina National Weather Service Wilmington NC 630 PM EDT Friday October 7, 2016
NIDIS Intermountain West Drought Early Warning System August 8, 2017
 NIDIS Drought and Water Assessment 8/8/17, 4:43 PM NIDIS Intermountain West Drought Early Warning System August 8, 2017 Precipitation The images above use daily precipitation statistics from NWS COOP,
Climate. Annual Temperature (Last 30 Years) January Temperature. July Temperature. Average Precipitation (Last 30 Years)
 January Temperature. July Temperature. Average Precipitation (Last 30 Years)") Climate Annual Temperature (Last 30 Years) Average Annual High Temp. (F)70, (C)21 Average Annual Low Temp. (F)43, (C)6 January Temperature Average January High Temp. (F)48, (C)9 Average January Low Temp.
Climate Annual Temperature (Last 30 Years) Average Annual High Temp. (F)70, (C)21 Average Annual Low Temp. (F)43, (C)6 January Temperature Average January High Temp. (F)48, (C)9 Average January Low Temp.
Tropical Weather Briefing
 Tropical Weather Briefing August 28, 2012 700 AM CDT National Weather Service Weather Forecast Office Slidell, LA Current Satellite Tropical Storm Isaac Watches/Warnings Tropical Storm Isaac Track Guidance
REDWOOD VALLEY SUBAREA
 Independent Science Review Panel Conceptual Model of Watershed Hydrology, Surface Water and Groundwater Interactions and Stream Ecology for the Russian River Watershed Appendices A-1 APPENDIX A A-2 REDWOOD
Saturday, October 6, :30 a.m. EDT
 Saturday, October 6, 2018 8:30 a.m. EDT Significant Activity Oct 5-6 Significant Events: None Tropical Activity: Atlantic Tropical Storm Leslie; Disturbance 1 (High: 90%) Eastern Pacific Hurricane Sergio
Alluvial Fan Flooding Workshop. Barry Pierce National Weather Service, Las Vegas
 Alluvial Fan Flooding Workshop Barry Pierce National Weather Service, Las Vegas Death Valley NP, August 15, 2004 Outline National Weather Service Alluvial Fan/Flash Flooding Weather Regimes Conducive For
Physical Geography of the United States and Canada Chapter 5 A Land of Contrasts
 Physical Geography of the United States and Canada Chapter 5 A Land of Contrasts Land Area Together the U.S. and Canada cover more than 7 million square miles. In total area, Canada ranks 2 nd and the
Tropical Update. 5 AM EDT Tuesday, September 12, 2017 Post-Tropical Cyclone Irma, Hurricane Jose, & Tropical Wave (10%)
") Tropical Update 5 AM EDT Tuesday, September 12, 2017 Post-Tropical Cyclone Irma, Hurricane Jose, & Tropical Wave (10%) This update is intended for government and emergency response officials, and is provided
Tropical Update 5 AM EDT Tuesday, September 12, 2017 Post-Tropical Cyclone Irma, Hurricane Jose, & Tropical Wave (10%) This update is intended for government and emergency response officials, and is provided
Tropical Update. 12 PM EDT Friday, October 7, 2016 Hurricane Matthew & Tropical Storm Nicole
 Tropical Update 12 PM EDT Friday, October 7, 2016 Hurricane Matthew & Tropical Storm Nicole This update is intended for government and emergency response officials, and is provided for informational and
Claim: Global warming is increasing the magnitude and frequency of droughts and floods. REBUTTAL
 Claim: Global warming is increasing the magnitude and frequency of droughts and floods. REBUTTAL Our use of fossil fuels to power our civilization is not causing droughts or floods. NOAA found there is
September 20, 2012 TFMA 2012 Fall Conference, Rockwall, Texas
 September 20, 2012 TFMA 2012 Fall Conference, Rockwall, Texas Martha Juch, P.E., CFM, D.WRE Project Director, AECOM Served as President of Upper Brushy WCID Board during T.S. Hermine Melinda Luna, P.E.,
NIDIS Intermountain West Drought Early Warning System April 18, 2017
 1 of 11 4/18/2017 3:42 PM Precipitation NIDIS Intermountain West Drought Early Warning System April 18, 2017 The images above use daily precipitation statistics from NWS COOP, CoCoRaHS, and CoAgMet stations.
HURRICANE HARVEY COE Navigation BRIEFING
 HURRICANE HARVEY COE Navigation BRIEFING 10:00 AM CDT Friday, August 25, 2017 NWSNewOrleans www.weather.gov/neworleans Situation Overview New Information Harvey continues to strengthen Max sustained winds
Guided Reading Activity
 Guided Reading Activity Lesson 1 Physical Features Essential Question: How does geography influence the way people live? A Vast Land Directions: Read the lesson and use your text to decide whether each
GUIDED READING CHAPTER 1: THE LAY OF THE LAND (Page 1)
") CHAPTER 1: THE LAY OF THE LAND (Page 1) Section 1 The Tidewater Region Directions: Use the information from pages 6-11 to complete the following statements. 1. In the southern part of the coast, the Tidewater
CHAPTER 1: THE LAY OF THE LAND (Page 1) Section 1 The Tidewater Region Directions: Use the information from pages 6-11 to complete the following statements. 1. In the southern part of the coast, the Tidewater
Tropical Update. 5 AM EDT Monday, October 8, 2018 Tropical Storm Michael, Tropical Storm Leslie, Invest 92L (10%) & African Tropical Wave (50%)
 & African Tropical Wave (50%)") Tropical Update 5 AM EDT Monday, October 8, 2018 Tropical Storm Michael, Tropical Storm Leslie, Invest 92L (10%) & African Tropical Wave (50%) This update is intended for government and emergency response
Tropical Update 5 AM EDT Monday, October 8, 2018 Tropical Storm Michael, Tropical Storm Leslie, Invest 92L (10%) & African Tropical Wave (50%) This update is intended for government and emergency response
Lecture #18 (April 12, 2010, Monday) Tropical Storms & Hurricanes Part 3. Hurricane Floyd September 15, 1999
 Tropical Storms & Hurricanes Part 3. Hurricane Floyd September 15, 1999") Lecture #18 (April 12, 2010, Monday) Tropical Storms & Hurricanes Part 3 Hurricane Floyd September 15, 1999 Tropical Cyclone Names Names are given to distinguish storms and for ease of communication. Names
Lecture #18 (April 12, 2010, Monday) Tropical Storms & Hurricanes Part 3 Hurricane Floyd September 15, 1999 Tropical Cyclone Names Names are given to distinguish storms and for ease of communication. Names
Monthly Long Range Weather Commentary Issued: May 15, 2014 Steven A. Root, CCM, President/CEO
 Monthly Long Range Weather Commentary Issued: May 15, 2014 Steven A. Root, CCM, President/CEO sroot@weatherbank.com APRIL 2014 REVIEW Climate Highlights The Month in Review The average temperature for
Claim: Global warming is increasing the magnitude and frequency of droughts and floods.
 Claim: Global warming is increasing the magnitude and frequency of droughts and floods. REBUTTAL Our use of fossil fuels to power our civilization is not causing droughts or floods. NOAA found there is
What a Hurricane Needs to Develop
 Massive Storms! Hurricanes What a Hurricane Needs to Develop Warm tropical water - at least 80 F High Humidity Light wind Low Pressure Area Form between 5 and 20 latitude Hurricane Ingredients Hurricane
CENTRAL TEXAS HILL COUNTRY FLOOD
 CENTRAL TEXAS HILL COUNTRY FLOOD Term project report DECEMBER 7, 2018 UNIVERSITY OF TEXAS AT AUSTIN CE394K: GIS in Water Resources Engineering RIFAAI Mohamed Talha Table of Contents Introduction... 3 Context...
Managing Floods at Boscastle. Learning Objective: Examine the benefits of managing floods
 Managing Floods at Boscastle Learning Objective: Examine the benefits of managing floods Learning Outcomes: Describe how Boscastle has been affected by flooding Explain strategies to reduce the risk Evaluate
Tropical Update. 11 AM EDT Tuesday, October 9, 2018 Hurricane Michael, Tropical Storm Leslie, Tropical Storm Nadine
 Tropical Update 11 AM EDT Tuesday, October 9, 2018 Hurricane Michael, Tropical Storm Leslie, Tropical Storm Nadine This update is intended for government and emergency response officials, and is provided
NOAA National Centers for Environmental Information State Summaries 149-FL. Observed and Projected Temperature Change
 19-FL FLORIDA Key Messages Under a higher emissions pathway, historically unprecedented warming is projected by the end of the 1st century. Rising temperatures will likely increase the intensity of naturally-occurring
Tropical Update. 5 AM EDT Wednesday, September 6, 2017 Hurricane Irma, Tropical Storm Jose, and Tropical Storm Katia
 Tropical Update 5 AM EDT Wednesday, September 6, 2017 Hurricane Irma, Tropical Storm Jose, and Tropical Storm Katia This update is intended for government and emergency response officials, and is provided
Hurricane Matthew Life Threatening Flash Flooding Likely
 Hurricane Matthew Life Threatening Flash Flooding Likely Threat Assessment for northeast South Carolina & southeast North Carolina National Weather Service Wilmington NC 12 AM EDT Saturday October 8, 2016
Haiti and Dominican Republic Flash Flood Initial Planning Meeting
 Dr Rochelle Graham Climate Scientist Haiti and Dominican Republic Flash Flood Initial Planning Meeting September 7 th to 9 th, 2016 Hydrologic Research Center http://www.hrcwater.org Haiti and Dominican
Hurricane Matthew Threats and Impacts Briefing for Eastern NC
 Hurricane Matthew Threats and Impacts Briefing for Eastern NC October 6 th, 2016 Date/Time Created: 10/6/2016, Noon EDT National Weather Service Newport/Morehead City, NC Hurricane Matthew Key Points Changes
Lecture 14: Floods. Key Questions
 Lecture 14: Floods Key Questions 1. What is an upstream flood? 2. What is a downstream flood? 3. What were the setup conditions that cause floods? 4. What is a 100-year flood? 5. How are 100-year flood
Guided Notes Weather. Part 2: Meteorology Air Masses Fronts Weather Maps Storms Storm Preparation
 Guided Notes Weather Part 2: Meteorology Air Masses Fronts Weather Maps Storms Storm Preparation The map below shows North America and its surrounding bodies of water. Country borders are shown. On the
NIDIS Intermountain West Drought Early Warning System January 15, 2019
 NIDIS Drought and Water Assessment NIDIS Intermountain West Drought Early Warning System January 15, 2019 Precipitation The images above use daily precipitation statistics from NWS COOP, CoCoRaHS, and
1. Which weather map symbol is associated with extremely low air pressure? A) B) C) D) 2. The diagram below represents a weather instrument.
 B) C) D) 2. The diagram below represents a weather instrument.") 1. Which weather map symbol is associated with extremely low air pressure? 2. The diagram below represents a weather instrument. Which weather variable was this instrument designed to measure? A) air pressure
1. Which weather map symbol is associated with extremely low air pressure? 2. The diagram below represents a weather instrument. Which weather variable was this instrument designed to measure? A) air pressure
Hurricanes in the Gulf of Mexico: The History and Future of the Texas Coast
 # 82 Hurricanes in the Gulf of Mexico: The History and Future of the Texas Coast Dr. Kerry Emanuel January 8, 2013 Produced by and for Hot Science - Cool Talks by the Environmental Science Institute. We
What a Hurricane Needs to Develop
 Weather Weather is the current atmospheric conditions, such as air temperature, wind speed, wind direction, cloud cover, precipitation, relative humidity, air pressure, etc. 8.10B: global patterns of atmospheric
NIDIS Intermountain West Drought Early Warning System October 17, 2017
 NIDIS Drought and Water Assessment NIDIS Intermountain West Drought Early Warning System October 17, 2017 Precipitation The images above use daily precipitation statistics from NWS COOP, CoCoRaHS, and
Hurricane Harvey and What is to come. Eric Berger, Space City Weather
 Hurricane Harvey and What is to come Eric Berger, Space City Weather Today s talk A word about Space City Weather Social media-rology A look back at Hurricane Harvey Why does Houston get these storms Rainfall
Daily Operations Briefing. Wednesday, August 23, :30 a.m. EDT
 Daily Operations Briefing Wednesday, August 23, 2017 8:30 a.m. EDT Significant Activity August 22-23 Significant Events: Tropical Weather Threat Gulf Coast Tropical Activity: Atlantic Disturbance 1 High
Tuesday, September 4, :30 a.m. EDT
 Tuesday, September 4, 2018 8:30 a.m. EDT Significant Activity Aug 31- Sep 4 Significant Events: Tropical Storm Gordon Tropical Activity: Atlantic Tropical Storm Florence; Tropical Storm Gordon; Disturbance
Tropical Storm Hermine: Heavy rainfall in western Gulf By Richard H. Grumm National Weather Service Office State College, PA 16803
 Tropical Storm Hermine: Heavy rainfall in western Gulf By Richard H. Grumm National Weather Service Office State College, PA 16803 1. INTRODUCTION Tropical storm Hermine, the eighth named tropical system
Wednesday, June 13, :30 a.m. EDT
 Wednesday, June 13, 2018 8:30 a.m. EDT Significant Activity June 12-13 Significant Events: None Tropical Activity: Atlantic Disturbance 1: Low (20%) Eastern Pacific Tropical Storm Bud; Disturbance 1: Low