Impacts of Transit Rail Lines on Property Values
|
|
|
- Brent Campbell
- 5 years ago
- Views:
Transcription

1 Impacts of Transit Rail Lines on Property Values Rail~Volution 2007

2

3
4 Introduction The Question Research Tools Methodology Examples Results

5 Question Won t transit in my backyard hurt my property value? Especially if I am not near a station?


6 Research Tools Transit Agency Websites MSN Virtual Earth and Mapquest Zillow.com
7 Research Tools Transit Agency Websites System Maps and Operational Information MSN Virtual Earth and Mapquest Zillow.com


8 Research Tools Transit Agency Websites System Maps and Operational Information MSN Virtual Earth and Mapquest Aerials, Illustrations in 3D and Obliques Determine Distances Zillow.com
9 Research Tools Transit Agency Websites System Maps and Operational Information MSN Virtual Earth and Mapquest Aerials, Illustrations in 3D and Obliques Determine Distances Zillow.com Real Estate Data
10 Transit Agency Websites System Maps Example: Sound Transit from Tacoma to Seattle

11 Transit Agency Websites System Maps Operational Information System History Time and days of operation Schedule Example: Sound Transit from Tacoma to Seattle

12 MSN Virtual Earth and Mapquest Aerials Kent Station - SoundTransit
13 MSN Virtual Earth and Mapquest Illustrations in 3D Virtual Earth 3D (Beta) shows 3D buildings and landmarks in many popular cities and areas. View 3D perspective of land and cities using the mouse, keyboard, or an Xbox 360 Controller for Windows.
14 MSN Virtual Earth and Mapquest Illustrations in 3D Example: The Loews Miami Beach

15


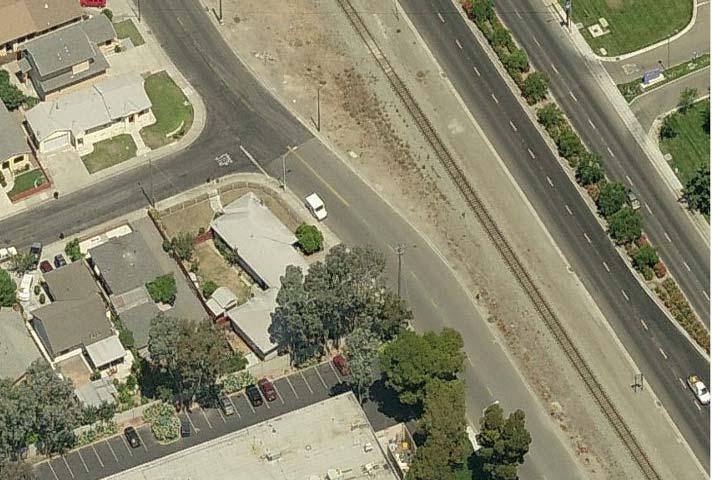
16 MSN Virtual Earth and Mapquest Obliques Example: Home adjacent to the Metrolink in Los Angeles, CA Aerial View Oblique (or Birdseye)

17 MSN Virtual Earth and Mapquest Obliques Aerial View Oblique Rotate
18 MSN Virtual Earth and Mapquest Distances Using the scale on the aerials and maps, determine distances from homes to rail line, and station to homes (for outlier properties and adjacent properties) *Note: Google Earth is another tool to use for measuring and aerial images.
19 Zillow.com Real Estate Data Why Zillow.com? Provides historical trends that other real estate sources do not *Note: Majority of Zillow data NOT based on assessment property values, but based on general trends in local communities researched. However, actual sales are shown and provide a good check for reliability.
20 Zillow.com Definition of Zillow: Zillow comes up with a "Zestimate" for a house, based on a range of publicly available information, including sales of comparable houses in a neighborhood. Zestimate does not take into consideration factors like recent remodeling, quality of school district, or local amenities, although there is an option to update the information for a particular home. The accuracy of the Zestimate varies by location depending on how much information is publicly available, but Zillow allows users to check the accuracy of Zestimates in their own region against actual sales. Definition from Wikipedia

21 Zillow.com How to use Insert address

22 Zillow.com

23 Zillow.com

24 Zillow.com

25 Methodology Four existing commuter rail lines TRE, Dallas/Fort Worth, Texas Metro Link, Los Angeles, California Sound Transit, Tacoma to Everett, Washington State Altamont Commuter Express, San Jose, California

26 Methodology Six existing light rail lines DART, Dallas, Texas RTD Southwest Corridor, Denver, Colorado Metro Transit Hiawatha Line, Minneapolis/St. Paul, Minnesota TRIMET MAX, Portland, Oregon Regional Transit, Sacramento, California Santa Clara Valley Transportation Authority, Santa Clara, California
27 Methodology For each rail line, three representative homes within close proximity to the rail corridor were selected randomly separated by the longest distance between stations possible.
28 Methodology


29 Methodology Two outlier properties at approximately 3 miles perpendicular in each direction to the rail corridor were selected at random to compare results.

30 ~3 Miles ~3 Miles Methodology Rail Station

31 Examples CRT SoundTransit, Tacoma to Seattle, Washington State History: Opened for service September 2000 System Characteristics: 82 mile commuter rail system 9 stations (average spacing 10.3 miles) Went from 22 freight trains per day to 30 total trains (including CRT)
 Adjacent Property #1 (2.")

32 SoundTransit, Tacoma to Seattle, Washington State Properties between Kent Station and Auburn Station (approximately 5 miles apart) Adjacent Property #1 (2.4 miles from Kent Station) 210 ft Source: = Cost Estimate by Zip Code = Cost Estimate by Property = Date rail line opened (September 2000) $ = good check of Zillow.com, reflects actual sales
 Adjacent Property #2")

33 SoundTransit, Tacoma to Seattle, Washington State Properties between Kent Station and Auburn Station (approximately 5 miles apart) Adjacent Property #2 (2.44 miles from Kent Station) 180 ft Source: = Cost Estimate by Zip Code = Cost Estimate by Property = Date rail line opened (September 2000)
 135 ft Source: www.zillow.com = Cost Estimate by Zip Code = Cost Estimate by Property = Date rail line opened (September 2000)")
34 SoundTransit, Tacoma to Seattle, Washington State Properties between Kent Station and Auburn Station (approximately 5 miles apart) Adjacent Property #3 (2.58 miles from Kent Station) 135 ft Source: = Cost Estimate by Zip Code = Cost Estimate by Property = Date rail line opened (September 2000)
 Source: www.zillow.")
35 SoundTransit, Tacoma to Seattle, Washington State Outlying properties from Kent Station Outlier Property #1 (approximately 3 miles west) Source: = Cost Estimate by Zip Code = Cost Estimate by Property = Date rail line opened (September 2000)
36 SoundTransit, Tacoma to Seattle, Washington State Outlying properties from Kent Station Outlier Property #2 (approximately 3 miles east) Source: = Cost Estimate by Zip Code = Cost Estimate by Property = Date rail line opened (September 2000) $ = good check of Zillow.com, reflects actual sales
37 SoundTransit, Tacoma to Seattle, Washington State Comparison of Adjacent & Outlier Property Data vs. Zip Code Property Data Rail Line Average Distance From Station (miles) Average Distance From Rail Line (feet) Property Value Year Span Average Percent Change SoundTransit, Seattle, WA - CRT Adjacent # $95,000 - $227, % increase Adjacent # $104,000 - $268, % increase Adjacent # $90,000 - $244, % increase Outlier #1 3 - $136,000 - $367, % increase Outlier #2 3 - $215,000 - $470, % increase 156% 145%
38 SoundTransit, Tacoma to Seattle, Washington State Comparison of Adjacent & Outlier Property Data vs. Zip Code Property Data Rail Line Average Distance From Station (miles) Average Distance From Rail Line (feet) Property Value Year Span Average Percent Change SoundTransit, Seattle, WA - CRT Adjacent # $95,000 - $227, % increase Adjacent # $104,000 - $268, % increase Adjacent # $90,000 - $244, % increase Outlier #1 3 - $136,000 - $367, % increase Outlier #2 3 - $215,000 - $470, % increase 156% 145% Rail Line Zip Code Property Year Average Percent Value Span Change SoundTransit, Seattle, WA - CRT Adjacent #1 $129,000 - $312, % increase Adjacent #2 $129,000 - $312, % increase Adjacent #3 $129,000 - $312, % increase Outlier #1 $128,000 - $295, % increase Outlier #2 $142,000 - $326, % increase 142% 130%
39 CRT Results CRT Property Value Changes 300% 250% Percent Changes 200% 150% 100% Adjacent Outlier Zip Code 50% 0% TRE Metrolink Sounder ACE (10 years) (10 years) (10 years) (10 years)
40 CRT Results Average increase in property values for all properties examined: Adjacent: 162% 300% 250% CRT Property Value Changes Outlier: 162% Percent Changes 200% 150% 100% Adjacent Outlier Zip Code Zip Code: 165% Average Increase 50% 0% TRE Metrolink Sounder ACE (10 years) (10 years) (10 years) (10 years)

41 Examples LRT Regional Transit, Sacramento, CA History: Original system opened 1987, the extension studied opened June 2004 System Characteristics 36.8 mile light rail system 45 stations (average spacing: 0.8 miles) Went from 2 freight trains per day to 139 total trains (including LRT)
 100 ft Source: www.zillow.")
42 Regional Transit, Sacramento, CA Properties between Mather Field/Mills Station and Zinfandel Station (1.36 miles apart) Adjacent Property #1 (0.64 miles from Mather Field/Mills Station) 100 ft Source: = Cost Estimate by Zip Code = Cost Estimate by Property = Date rail line opened (June 2004) $ = good check of Zillow.com, reflects actual sales
 Adjacent Property #2 (0.")

43 Regional Transit, Sacramento, CA Properties between Mather Field/Mills Station and Zinfandel Station (1.36 miles apart) Adjacent Property #2 (0.66 miles from Mather Field/Mills Station) 120 ft Source: = Cost Estimate by Zip Code = Cost Estimate by Property = Date rail line opened (June 2004)
 Adjacent Property #3 (1 mile from Mather Field/Mills Station) 85 ft Source: www.zillow.")
44 Regional Transit, Sacramento, CA Properties between Mather Field/Mills Station and Zinfandel Station (1.36 miles apart) Adjacent Property #3 (1 mile from Mather Field/Mills Station) 85 ft Source: = Cost Estimate by Zip Code = Cost Estimate by Property = Date rail line opened (June 2004)
45 Regional Transit, Sacramento, CA Outlying properties from Mather Field/Mills Station Outlier Property #1 (approximately 3.6 miles north) Source: = Cost Estimate by Zip Code = Cost Estimate by Property = Date rail line opened (June 2004) $ = good check of Zillow.com, reflects actual sales
 Don t know why this happened Source: www.zillow.")
46 Regional Transit, Sacramento, CA Outlying properties from Mather Field/Mills Station Outlier Property #2 (approximately 4.4 miles south) Don t know why this happened Source: = Cost Estimate by Zip Code = Cost Estimate by Property = Date rail line opened (June 2004)
47 Regional Transit, Sacramento, CA Comparison of Adjacent & Outlier Property Data vs. Zip Code Property Data Rail Line Average Distance From Station (miles) Average Distance From Rail Line (feet) Property Value Year Span Average Percent Change Regional Transit, Sacramento, CA - LRT Adjacent # $107,000 - $337, % increase Adjacent # $123,000 - $382, % increase Adjacent # $93,000 - $271, % increase Outlier #1 3 - $149,000 - $323, % increase Outlier # $169,000 - $470, % increase 206% 148%
48 Regional Transit, Sacramento, CA Comparison of Adjacent & Outlier Property Data vs. Zip Code Property Data Rail Line Average Distance From Station (miles) Average Distance From Rail Line (feet) Property Value Year Span Average Percent Change Regional Transit, Sacramento, CA - LRT Adjacent # $107,000 - $337, % increase Adjacent # $123,000 - $382, % increase Adjacent # $93,000 - $271, % increase Outlier #1 3 - $149,000 - $323, % increase Outlier # $169,000 - $470, % increase 206% 148% Rail Line Zip Code Property Year Average Percent Value Span Change Regional Transit, Sacramento, CA - LRT Adjacent #1 $132,000 - $340, % increase Adjacent #2 $132,000 - $340, % increase Adjacent #3 $132,000 - $340, % increase Outlier #1 $155,000 - $398, % increase Outlier #2 $119,000 - $325, % increase 158% 165%
49 LRT Results LRT Property Value Changes 300% 250% Percent Changes 200% 150% 100% Adjacent Outlier Zip Code 50% 0% DART RTD Metro TRIMET Regional VTA (10 years) (9 years) (5 years) (10 years) (5 years) (10 years)
50 LRT Results Average increase in property values for all properties examined: LRT Property Value Changes Adjacent: 130% 300% 250% Outlier: 96% Percent Changes 200% 150% 100% Adjacent Outlier Zip Code Zip Code: 95% Average Increase 50% 0% DART RTD Metro TRIMET Regional VTA (10 years) (9 years) (5 years) (10 years) (5 years) (10 years)
51 Results Comparing all the CRT & LRT trends showed the properties were more affected by overall local and regional market forces than by new immediately adjacent passenger rail lines.
52 Results Other tools available for more in depth research: Assessors data County records on sales Detailed economic analysis Windshield surveys to find current sale prices Analyze days on the market
53 Impacts of Transit Rail Lines on Property Values Research available upon request Rail~Volution 2007
Online Robustness Appendix to Endogenous Gentrification and Housing Price Dynamics
 Online Robustness Appendix to Endogenous Gentrification and Housing Price Dynamics Robustness Appendix to Endogenous Gentrification and Housing Price Dynamics This robustness appendix provides a variety
Westside Extension Los Angeles, California
 Westside Extension Los Angeles, California Rail~Volution 2010 Portland, Oregon Monica Villalobos AECOM History of Westside Suburban Growth in the Westside (1920 1970 s) LA Centers Concept + Employment
Vibrancy and Property Performance of Major U.S. Employment Centers. Appendix A
 Appendix A DOWNTOWN VIBRANCY SCORES Atlanta 103.3 Minneapolis 152.8 Austin 112.3 Nashville 83.5 Baltimore 151.3 New Orleans 124.3 Birmingham 59.3 New York Midtown 448.6 Charlotte 94.1 Oakland 157.7 Chicago
Powder River Basin Coal Update
 Powder River Basin Coal Update Tom Kraemer Group Vice President Coal Southwest Power Pool Regional State Committee October 24, 2005 - Santa Fe, NM Discussion Topics BNSF coal transportation Historic PRB
Speakers: Jeff Price, Federal Transit Administration Linda Young, Center for Neighborhood Technology Sofia Becker, Center for Neighborhood Technology
 Speakers: Jeff Price, Federal Transit Administration Linda Young, Center for Neighborhood Technology Sofia Becker, Center for Neighborhood Technology Peter Haas, Center for Neighborhood Technology Craig
Analyzing the Market Share of Commuter Rail Stations using LEHD Data
 Analyzing the Market Share of Commuter Rail Stations using LEHD Data Using Census Data for Transportation Applications Conference, Irvine, CA October 26, 2011 1. What is the size of Metrolink s commute
Advancing Urban Models in the 21 st Century. Jeff Tayman Lecturer, Dept. of Economics University of California, San Diego
 Advancing Urban Models in the 21 st Century Jeff Tayman Lecturer, Dept. of Economics University of California, San Diego 1 Regional Decision System Better tools Better data Better access Better Decisions
Madison s Fast Track? The Impacts of a Light Rail Transit System on Property Value in the Madison Area.
 Luke Danzinger, Kristen Dickerson, Mary Collins Geography 565 Madison s Fast Track? The Impacts of a Light Rail Transit System on Property Value in the Madison Area. Introduction: Mass public transportation
The Elusive Connection between Density and Transit Use
 The Elusive Connection between Density and Transit Use Abstract: The connection between density and transportation is heralded by planners, yet results are often elusive. This paper analyzes two regions,
15.0 Operations and Maintenance Cost Calculations
 15.0 Operations and Maintenance Cost Calculations 15.1 Introduction Operations and Maintenance (O&M) costs were calculated for each of the four alternatives being considered in the analysis. No Build Alternative
Hotel Industry Overview. UPDATE: Trends and outlook for Northern California. Vail R. Brown
 Hotel Industry Overview UPDATE: Trends and outlook for Northern California Vail R. Brown Senior Vice President, Global Business Development & Marketing vbrown@str.com @vail_str 2016 STR, Inc. All Rights
OFFICE RENT PREMIUMS WITH RESPECT TO DISTANCE FROM LIGHT RAIL TRANSIT STATIONS IN DALLAS AND DENVER
 1 2 3 4 5 6 7 8 9 10 11 12 13 14 15 16 17 18 19 20 21 22 23 24 25 26 27 28 29 30 31 32 33 34 35 36 37 38 39 40 41 42 43 44 45 46 OFFICE RENT PREMIUMS WITH RESPECT TO DISTANCE FROM LIGHT RAIL TRANSIT STATIONS
Retail Rent with Respect to Distance from Light Rail Transit Stations in Dallas and Denver
 Portland State University PDXScholar Urban Studies and Planning Faculty Publications and Presentations Nohad A. Toulan School of Urban Studies and Planning 2015 Retail Rent with Respect to Distance from
King City URA 6D Concept Plan
 King City URA 6D Concept Plan King City s Evolution Among the fastest growing cities 2000 Census 1,949 2010 Census 3,111 60% increase 2016 Census estimate 3,817 23% increase Average annual rate 4.3% Surpassing
Light-Rail Transit Stations and Property Values: A Bedonie Price Approach
 90 TRANSPORTATION RESEARCH RECORD 1400 Light-Rail Transit Stations and Property Values: A Bedonie Price Approach MusAAD A. AL-MosAIND, KENNETH J. DuEKER, AND }AMES G. STRATHMAN What are the effects of
Guided Reading Activity
 Guided Reading Activity Lesson 1 Physical Features Essential Question: How does geography influence the way people live? A Vast Land Directions: Read the lesson and use your text to decide whether each
FOR SALE +/- 419 ACRES ¼ Mile South of Alliance Airport
 FOR SALE +/- 419 ACRES ¼ Mile South of Alliance Airport Alliance Airport Subject property +/- 419 AC Pat McDowell +1 817 334 8106 pat.mcdowell@am.jll.com JLL 201 Main Street, Suite 1440 Fort Worth, TX
SHADE/SHADOW REPORT. For the Proposed 8777 Washington Project. Culver City, CA. Prepared for:
 SHADE/SHADOW REPORT For the Proposed 8777 Washington Project Culver City, CA Prepared for: VITRUVIAN CULVER CITY LLC (THE APPLICANT) 5822 WEST WASHINGTON BOULEVARD CULVER CITY, CALIFORNIA 90232 Prepared
Internet GIS Sites. 2 OakMapper webgis Application
 Internet GIS Sites # Name URL Description 1 City of Sugar Land http://www.sugarlandtx.gov/index.htm It is a city in Texas with 65,000 Residents. The City of Sugar Land, Texas, provides ArcIMS-based maps
Alternatives Analysis Report
 1.0 PURPOSE AND NEED The Southern California Association of Governments (SCAG), in coordination with the Los Angeles County Metropolitan Transportation Authority (Metro) and the Orange County Transportation
Transit and Wages The Association between Wages and Transit Station Proximity over Time and with Respect to the Great Recession
 Transit and Wages The Association between Wages and Transit Station Proximity over Time and with Respect to the Great Recession Arthur C. Nelson Professor of Planning and Real Estate Development School
CALOTS Upgrade for Performance Monitoring
 CALOTS Upgrade for Performance Monitoring A project of the Southern California Association of Governments supported by the UCLA Lewis Center for Regional Policy Studies Agenda 1. Revisit Project Overview
BROOKINGS May
 Appendix 1. Technical Methodology This study combines detailed data on transit systems, demographics, and employment to determine the accessibility of jobs via transit within and across the country s 100
Density and Walkable Communities
 Density and Walkable Communities Reid Ewing Professor & Chair City and Metropolitan Planning University of Utah ewing@arch.utah.edu Department of City & Metropolitan Planning, University of Utah MRC Research
Regional Growth Strategy Regional TOD Advisory Committee
 Regional Strategy Regional TOD Advisory Committee September 21, 2018 Overview Regional Geographies Transit-Oriented Development Goal Scenarios Next Steps 2 Schedule + Process September 6 Management Policy
FHWA GIS Outreach Activities. Loveland, Colorado April 17, 2012
 FHWA GIS Outreach Activities Loveland, Colorado April 17, 2012 GIS for Improved Decision Making FHWA believes that geographic information systems and other geospatial technologies (remote sensing and GPS)
Providing Public Access to King County GIS Data. Presented by: Michael Jenkins King County GIS Center Seattle, WA
 Providing Public Access to King County GIS Data Presented by: Michael Jenkins King County GIS Center Seattle, WA King County, Washington Microsoft Boeing Amazon.Com Starbucks Port of Seattle Weyerhauser
Keywords: Commuter Rail; Market Analysis; Commuter Rail Planning
 1 2 3 4 5 6 7 8 9 10 11 12 13 14 15 16 17 18 19 20 21 22 23 24 25 26 27 28 29 30 31 32 33 34 35 36 Analysis of the Variation in Apartment and Office Market Rents with Respect to Commuter Rail Transit Station
Forecasts for the Reston/Dulles Rail Corridor and Route 28 Corridor 2010 to 2050
 George Mason University Center for Regional Analysis Forecasts for the Reston/Dulles Rail Corridor and Route 28 Corridor 21 to 25 Prepared for the Fairfax County Department of Planning and Zoning Lisa
CTR Employer Survey Report
 CTR Employer Survey Report Thank you for completing your Commute Trip Reduction survey. This report contains the survey results. Employer Id : E10983 Employer : WA State Dept. of Enterprise Services Worksite
Kathryn Robinson. Grades 3-5. From the Just Turn & Share Centers Series VOLUME 12
 1 2 From the Just Turn & Share Centers Series VOLUME 12 Temperature TM From the Just Turn & Share Centers Series Kathryn Robinson 3 4 M Enterprises WriteMath Enterprises 2303 Marseille Ct. Suite 104 Valrico,
The number of events satisfying the heat wave definition criteria varies widely
 1 III. Discussion of Results A. Event Identification The number of events satisfying the heat wave definition criteria varies widely between stations. For the unfiltered data following the definition requiring
Com munity Advisor y C ommitte e Meeting
 Community Advisor y Committee Meeting J u n e 1 5, 2 0 1 7 Project Scope 14 miles of enhanced service from Downtown Portland to Cleveland Park & Ride 41 Stations with 82 Platforms 1/3 mile approximate
Get Over, and Beyond, the Half-Mile Circle (for Some Transit Options)
") Get Over, and Beyond, the Half-Mile Circle (for Some Transit Options) Arthur C. Nelson, Ph.D., FAICP Associate Dean for Research & Discovery College of Architecture, Planning and Landscape Architecture
Get Over, and Beyond, the Half-Mile Circle (for Some Transit Options) Arthur C. Nelson, Ph.D., FAICP Associate Dean for Research & Discovery College of Architecture, Planning and Landscape Architecture
Opportunities to Strengthen Transit-Oriented Development through the New Starts Process
 Opportunities to Strengthen Transit-Oriented Development through the New Starts Process Congressional Testimony of Shelley Poticha, President Reconnecting America Presented before the Subcommittee on Highways
Investigation 11.3 Weather Maps
 Name: Date: Investigation 11.3 Weather Maps What can you identify weather patterns based on information read on a weather map? There have been some amazing technological advancements in the gathering and
THE TRINITY RIVER VISION/ GATEWAY PARK / PANTHER ISLAND Flood Control Project Update
 Quarterly Project Status Report September 2018 THE TRINITY RIVER VISION/ GATEWAY PARK / PANTHER ISLAND Flood Control Project Update TxDot s contractor has nearly completed the superstructure false work
GIS Analysis of Crenshaw/LAX Line
 PDD 631 Geographic Information Systems for Public Policy, Planning & Development GIS Analysis of Crenshaw/LAX Line Biying Zhao 6679361256 Professor Barry Waite and Bonnie Shrewsbury May 12 th, 2015 Introduction
Effects of Urban Rail Transit Expansions: Evidence from Sixteen Cities,
 NATHANIEL BAUM-SNOW Brown University MATTHEW E. KAHN Tufts University Effects of Urban Rail Transit Expansions: Evidence from Sixteen Cities, 1970 2000 FEDERAL, STATE, AND LOCAL governments have spent
Report #2 in the series Transitway Impacts Research Program
 Report #2 in the series Transitway Impacts Research Program Sponsors: Anoka County Center for Transportation Studies, University of Minnesota Hennepin County The Hiawatha Line: Impacts on Land Use and
3/21/2019. Q: What is this? What is in this area of the country? Q: So what is this? GEOG 3100 Next Week
 Tuesday: Thursday: GEOG 3100 Next Week Discussion of The South region (in this room) GIS Computer Lab Time (ENV Building, Room 340 more on this in class on Tuesday next week) Ahead of this lab time, please
THE ECONOMIC DEVELOPMENT IMPACTS OF LIGHT RAIL TRANSIT: A CASE STUDY OF THE BALTIMORE CENTRAL LIGHT RAIL
 THE ECONOMIC DEVELOPMENT IMPACTS OF LIGHT RAIL TRANSIT: A CASE STUDY OF THE BALTIMORE CENTRAL LIGHT RAIL A Thesis Submitted to the Faculty of the Graduate School of Arts Sciences of Georgetown University
Missed Opportunity: Transit and Jobs in Metropolitan America
 Robert Puentes Brookings Institution Washington, DC May 12, 2011 Missed Opportunity: Transit and Jobs in Metropolitan America We believe we may have a public transit moment before us in the U.S. today.
Estimation of Short Term Shelter Needs FEMA Earthquake HAZUS Model
 July 2017 ESRI International Users Conference Estimation of Short Term Shelter Needs FEMA Earthquake HAZUS Model Techniques & Results Douglas Schenk / Sampa Patra GIS Group / Information Services Division
Kenya Map: Regional Wall Map
 Kenya Map: Regional Wall Map If searched for the book Kenya Map: Regional Wall Map in pdf form, then you have come on to the loyal site. We furnish the complete option of this ebook in txt, PDF, DjVu,
Developing Built Environment Indicators for Urban Oregon. Dan Rubado, MPH EPHT Epidemiologist Oregon Public Health Division
 Developing Built Environment Indicators for Urban Oregon Dan Rubado, MPH EPHT Epidemiologist Oregon Public Health Division What is the built environment? The built environment encompasses spaces and places
Access Across America: Transit 2017
 Access Across America: Transit 2017 Final Report Prepared by: Andrew Owen Brendan Murphy Accessibility Observatory Center for Transportation Studies University of Minnesota CTS 18-12 1. Report No. CTS
Rural Pennsylvania: Where Is It Anyway? A Compendium of the Definitions of Rural and Rationale for Their Use
 Rural Pennsylvania: Where Is It Anyway? A Compendium of the Definitions of Rural and Rationale for Their Use Pennsylvania Office of Rural Health 310 Nursing Sciences Building University Park, PA 16802
Get involved in the City Nature Challenge 2018!
 Get involved in the City Nature Challenge 2018! ANDREA LOREK STRAUSS 1 WHAT IS CITY NATURE CHALLENGE? Cities compete to observe and record biodiversity Quest to: Document species Get people involved with
Effective Use of Geographic Maps
 Effective Use of Geographic Maps Purpose This tool provides guidelines and tips on how to effectively use geographic maps to communicate research findings. Format This tool provides guidance on geographic
Introducing IMS. v) Select the Zoom to Full Extent tool. Did you return to the original view?
 Select the Zoom to Full Extent tool. Did you return to the original view?") Ocean/ENVIR 260, Winter 2006 Lab 1, Get to Know the Puget Sound Watershed Name Introducing IMS 1) Open your web browser and navigate to http://128.208.23.127/website/lab1. (This link can be found on the
Ocean/ENVIR 260, Winter 2006 Lab 1, Get to Know the Puget Sound Watershed Name Introducing IMS 1) Open your web browser and navigate to http://128.208.23.127/website/lab1. (This link can be found on the
3D - Boulder Valley Comprehensive Plan. Lesli Ellis Comprehensive Planning Manager City of Boulder
 3D - Boulder Valley Comprehensive Plan Lesli Ellis Comprehensive Planning Manager City of Boulder Presentation Boulder s use of 3D GIS and other tools in Comprehensive Planning (e.g., story maps, CityEngine,
City of Hermosa Beach Beach Access and Parking Study. Submitted by. 600 Wilshire Blvd., Suite 1050 Los Angeles, CA
 City of Hermosa Beach Beach Access and Parking Study Submitted by 600 Wilshire Blvd., Suite 1050 Los Angeles, CA 90017 213.261.3050 January 2015 TABLE OF CONTENTS Introduction to the Beach Access and Parking
Sacred Lands File & Native American Contacts List Request
 Sacred Lands File & Native American Contacts List Request NATIVE AMERICAN HERITAGE COMMISSION 915 Capitol Mall, RM 364 Sacramento, CA 95814 (916) 653-4082 (916) 657-5390 Fax nahc@pacbell.net Information
Write a report (6-7 pages, double space) on some examples of Internet Applications. You can choose only ONE of the following application areas:
 on some examples of Internet Applications. You can choose only ONE of the following application areas:") UPR 6905 Internet GIS Homework 1 Yong Hong Guo September 9, 2008 Write a report (6-7 pages, double space) on some examples of Internet Applications. You can choose only ONE of the following application
UPR 6905 Internet GIS Homework 1 Yong Hong Guo September 9, 2008 Write a report (6-7 pages, double space) on some examples of Internet Applications. You can choose only ONE of the following application
Topographic Recreational Map Of New Mexico: Detailed Travel Map By GTR Mapping
 Topographic Recreational Map Of New Mexico: Detailed Travel Map By GTR Mapping Biological Assessment for Proposed Reconstruction of New Mexico Forest Highway 12. Cuba and Jemez Recreation Opportunity Spectrum
THE TRINITY RIVER VISION/ GATEWAY PARK / PANTHER ISLAND
 Quarterly Project Status Report May 2018 THE TRINITY RIVER VISION/ GATEWAY PARK / PANTHER ISLAND Flood Control Project Update Construction of North Main Street Bridge by TxDOT s bridge contractor, Texas
11/7/2018. Q: What is this? What is in this area of the country?
 Update on Upcoming Learning Opportunities: GEOG Courses Related to Cities and the Economy Murray Rice Spring 2019: GEOG 4230 (Location Intelligence: Business GIS) Focus on GIS applications in business
John Douglas Hunt. Giovanni Circella* Alan Thomas Brownlee. Kevin Stefan. Michael McCoy. HBA Specto Inc., Calgary (Canada)
") Simplified Model of Local Transit Services Giovanni Circella* University of California, Davis (USA) Kevin Stefan HBA Specto Inc., Calgary (Canada) Michael McCoy University of California, Davis (USA) John
Simplified Model of Local Transit Services Giovanni Circella* University of California, Davis (USA) Kevin Stefan HBA Specto Inc., Calgary (Canada) Michael McCoy University of California, Davis (USA) John
Integrating Origin and Destination (OD) Study into GIS in Support of LIRR Services and Network Improvements
 Study into GIS in Support of LIRR Services and Network Improvements") Integrating Origin and Destination (OD) Study into GIS in Support of LIRR Services and Network Improvements GIS In Transit Conference, Washington, DC Long Island Rail Road Pyung ho Kim Date: September
Integrating Origin and Destination (OD) Study into GIS in Support of LIRR Services and Network Improvements GIS In Transit Conference, Washington, DC Long Island Rail Road Pyung ho Kim Date: September
Using ROI Methodology to Measures the Benefits of King County GIS
 Using ROI Methodology to Measures the Benefits of King County GIS 2012 Washington GIS Conference Tacoma, Washington May 9, 2012 Greg Babinski, MA, GISP Finance & Marketing Manager King County GIS Center
Do Rail Transit Stations Encourage Neighborhood Retail Activity?
 Do Rail Transit Stations Encourage Neighborhood Retail Activity? Jenny Schuetz Price School of Public Policy University of Southern California jschuetz@price.usc.edu Last revised: February 8, 2014 Abstract
Draft exercise for share fair at Bozeman workshop only. This exercise is not ready for distribution. Please send helpful suggestions to
 Draft exercise for share fair at Bozeman workshop only. This exercise is not ready for distribution. Please send helpful suggestions to foleyd@plu.edu Figure list 1. Trailer photograph 2. Location map
BENBROOK ECONOMIC DEVELOPMENT CORPORATION COME GROW WITH US.
 BENBROOK ECONOMIC DEVELOPMENT CORPORATION COME GROW WITH US www.benbrook-tx.gov Introduction: Who Are We Video included 04 Benbrook Demographics Click for larger image of aerial 05 Retail Opportunites
Identifying Megaregions in the US: Implications for Infrastructure Investment
 7. 10. 2 0 08 Identifying Megaregions in the US: Implications for Infrastructure Investment Dr. Myungje Woo Dr. Catherine L. Ross Jason Barringer Harry West Jessica Lynn Harbour Doyle Center for Quality
West Hollywood General Plan
 ITEM 2.RR. EXHIBIT B Providing a safe living environment is a fundamental goal and one of the most important challenges cities face today. Anticipating, planning for, and guarding against threats to public
Lee County, Florida 2015 Forecast Report Population, Housing and Commercial Demand
 Lee County, Florida 2015 Forecast Report Population, Housing and Commercial Demand Thank you for purchasing this report, which contains forecasts of population growth, housing demand and demand for commercial
Urban Revival in America
 Urban Revival in America Victor Couture 1 Jessie Handbury 2 1 University of California, Berkeley 2 University of Pennsylvania and NBER May 2016 1 / 23 Objectives 1. Document the recent revival of America
Summary of Terminal Master s Degree Programs in Philosophy
 Summary of Terminal Master s Degree Programs in Philosophy Faculty and Student Demographics All data collected by the ican Philosophical Association. The data in this publication have been provided by
2/25/2019. Taking the northern and southern hemispheres together, on average the world s population lives 24 degrees from the equator.
 Where is the world s population? Roughly 88 percent of the world s population lives in the Northern Hemisphere, with about half north of 27 degrees north Taking the northern and southern hemispheres together,
Great California Delta Trail Blueprint for Contra Costa and Solano Counties GIS AND MAPPING MEMORANDUM JULY 2010
 Great California Delta Trail Blueprint for Contra Costa and Solano Counties GIS AND MAPPING MEMORANDUM JULY 2010 {DRAFT} July 2010 Introduction Geographic Information Systems (GIS) are computer-based
California Urban Infill Trip Generation Study. Jim Daisa, P.E.
 California Urban Infill Trip Generation Study Jim Daisa, P.E. What We Did in the Study Develop trip generation rates for land uses in urban areas of California Establish a California urban land use trip
Office of Geographic Information Systems
 Winter 2007 Department Spotlight SWCD GIS by Dave Holmen, Dakota County Soil and Water Conservation District The Dakota County Soil and Water Conservation District (SWCD) has collaborated with the Dakota
Access Across America: Transit 2016
 Access Across America: Transit 2016 Final Report Prepared by: Andrew Owen Brendan Murphy Accessibility Observatory Center for Transportation Studies University of Minnesota David Levinson School of Civil
NAWIC. National Association of Women in Construction. Membership Report. August 2009
 NAWIC National Association of Women in Construction Membership Report August 2009 Core Purpose: To enhance the success of women in the construction industry Region 1 67 Gr Washington, DC 9 16 2 3 1 0 0
STILLORGAN QBC LEVEL OF SERVICE ANALYSIS
 4-5th September, STILLORGAN QBC LEVEL OF SERVICE ANALYSIS Mr David O Connor Lecturer Dublin Institute of Technology Mr Philip Kavanagh Graduate Planner Dublin Institute of Technology Abstract Previous
Using the Real Estate Market to Establish Streetcar Catchment Areas Case Study of Multifamily Residential Rental Property in Tucson, Arizona
 1 2 3 4 5 6 7 8 9 10 11 12 13 14 15 16 17 18 19 20 21 22 23 24 25 26 27 28 29 30 31 32 33 34 35 36 Using the Real Estate Market to Establish Streetcar Catchment Areas Case Study of Multifamily Residential
Environmental Analysis, Chapter 4 Consequences, and Mitigation
 Environmental Analysis, Chapter 4 4.17 Environmental Justice This section summarizes the potential impacts described in Chapter 3, Transportation Impacts and Mitigation, and other sections of Chapter 4,
Metro Emergency Security Operations Center (ESOC) 410 Center Street City of Los Angeles
 410 Center Street City of Los Angeles") Metro Emergency Security Operations Center (ESOC) 410 Center Street City of Los Angeles Traffic Study August 31, 2015 AECOM 515 South Flower Street, 4 th Floor Los Angeles, CA 90071 Job Number: 60323255
Metro Emergency Security Operations Center (ESOC) 410 Center Street City of Los Angeles Traffic Study August 31, 2015 AECOM 515 South Flower Street, 4 th Floor Los Angeles, CA 90071 Job Number: 60323255
Committee Meeting November 6, 2018
 Committee Meeting November 6, 2018 Agenda Where we are in the process Land Use Plan Transportation Element Housing & Neighborhoods Elements Next Steps Schedule November 6: Plan Elements December: Plan
Texas Statewide Mesonet Network (TexMesonet) Dr. Kantave Greene 11/15/17
 Dr. Kantave Greene 11/15/17") Texas Statewide Mesonet Network (TexMesonet) Dr. Kantave Greene 11/15/17 1 Observe weather features Why Mesonets? Thunderstorms Squall lines Dry-lines Sea breezes Improve weather & flood forecasts Drought
Texas Statewide Mesonet Network (TexMesonet) Dr. Kantave Greene 11/15/17 1 Observe weather features Why Mesonets? Thunderstorms Squall lines Dry-lines Sea breezes Improve weather & flood forecasts Drought
East Bay BRT. Planning for Bus Rapid Transit
 East Bay BRT Planning for Bus Rapid Transit Regional Vision Draper Prison The Bottleneck is a State-Level issue, Salt Lake County 2050 Population: 1.5M Draper Prison hopefully with some State-Level funding!
Integrated Science I: Locating earthquake epicenters. Name Per Date
 Integrated Science I: Locating earthquake epicenters. Name Per Date Whenever a significant earthquake occurs somewhere in the world, news media present reports about two issues; the size or magnitude of
Grade. Why are maps useful? What do maps tell us?
 ACTIVITY 2.1 Follow That DART Bus! DETAILS TYPE Whole-group TIME 20 minutes plus 20 minutes homework (40 minutes total) PRINTED MATERIALS Handouts (Reading A Map, Follow that DART Bus! map and Follow that
THE FUTURE OF FORECASTING AT METROPOLITAN COUNCIL. CTS Research Conference May 23, 2012
 THE FUTURE OF FORECASTING AT METROPOLITAN COUNCIL CTS Research Conference May 23, 2012 Metropolitan Council forecasts Regional planning agency and MPO for Twin Cities metropolitan area Operates regional
GIS Level 2. MIT GIS Services
 GIS Level 2 MIT GIS Services http://libraries.mit.edu/gis Email: gishelp@mit.edu TOOLS IN THIS WORKSHOP - Definition Queries - Create a new field in the attribute table - Field Calculator - Add XY Data
Land Values Analysis A Pragmatic Approach for Mass Appraisal Of Residential Properties In Los Angeles County
 Land Values Analysis A Pragmatic Approach for Mass Appraisal Of Residential Properties In Los Angeles County Anthony Liu Emilio Solano Guillermo Araujo WHERE IT ALL BEGAN Alta California became a territory
Demographic Change Near Rail Stations
 4/10/2015 Demographic Change Near Rail Stations University of North Carolina at Chapel Hill Department of City and Regional Planning TABLE OF CONTENTS Introduction... 3 1. Literature Review... 3 2. Methodology...
BEFORE THE PUBLIC UTILITIES COMMISSION OF THE STATE OF COLORADO * * * * *
 BEFORE THE PUBLIC UTILITIES COMMISSION OF THE STATE OF COLORADO * * * * * IN THE MATTER OF THE APPLICATION OF PUBLIC SERVICE COMPANY OF COLORADO FOR APPROVAL OF ITS 01 RENEWABLE ENERGY STANDARD COMPLIANCE
Scale Drawings and Maps
 Name Date Class Practice A Use the map to answer the questions. 1. On the map, the distance from Newton to Cambridge is 2 cm. What is the actual distance? 2. On the map, the distance from Arlington to
Regional Performance Measures
 G Performance Measures Regional Performance Measures Introduction This appendix highlights the performance of the MTP/SCS for 2035. The performance of the Revenue Constrained network also is compared to
Regional Performance Measures
 G Performance Measures Regional Performance Measures Introduction This appendix highlights the performance of the MTP/SCS for 2035. The performance of the Revenue Constrained network also is compared to
SOUTH COAST COASTAL RECREATION METHODS
 SOUTH COAST COASTAL RECREATION METHODS A customized, web-based survey instrument, which utilizes Point 97 s Viewpoint survey and mapping technology, was used to collect spatially explicit data on coastal
Austin. What is a Public Market? The original gathering place. Worldwide, ancient phenomenon. Ripe for a Public Market?
 Downtown Austin Alliance September 25, 2013 What is a Public Market? Austin Ripe for a Public Market? Have Public Goals Operate in Public Spaces Serve Locally Owned and Operated Businesses The original
Rank University AMJ AMR ASQ JAP OBHDP OS PPSYCH SMJ SUM 1 University of Pennsylvania (T) Michigan State University
 Michigan State University") Rank University AMJ AMR ASQ JAP OBHDP OS PPSYCH SMJ SUM 1 University of Pennsylvania 4 1 2 0 2 4 0 9 22 2(T) Michigan State University 2 0 0 9 1 0 0 4 16 University of Michigan 3 0 2 5 2 0 0 4 16 4 Harvard
Rank University AMJ AMR ASQ JAP OBHDP OS PPSYCH SMJ SUM 1 University of Pennsylvania 4 1 2 0 2 4 0 9 22 2(T) Michigan State University 2 0 0 9 1 0 0 4 16 University of Michigan 3 0 2 5 2 0 0 4 16 4 Harvard
[Leveraging & Improving Neighborhood Connections] Area E Cedar Creek
![[Leveraging & Improving Neighborhood Connections] Area E Cedar Creek](/thumbs/86/93508963.jpg "[Leveraging & Improving Neighborhood Connections] Area E Cedar Creek") Community Charrette LINC Dallas [Leveraging & Improving Neighborhood Connections] Area E Cedar Creek 06.02.12 LINC Workshop Area E Area E has the unique distinction of at-grade frontage to the Trinity
Community Charrette LINC Dallas [Leveraging & Improving Neighborhood Connections] Area E Cedar Creek 06.02.12 LINC Workshop Area E Area E has the unique distinction of at-grade frontage to the Trinity
COMMENT CARD RESPONSES (SEISMIC)
") COMMENT CARD 1 1. Please explain once and for all why the original route isn t an option while it s safer and cheaper, instead of going under the high school? Response: Please refer to the November Community
COMMENT CARD 1 1. Please explain once and for all why the original route isn t an option while it s safer and cheaper, instead of going under the high school? Response: Please refer to the November Community
C) Discuss two factors that are contributing to the rapid geographical shifts in urbanization on a global scale.
 Discuss two factors that are contributing to the rapid geographical shifts in urbanization on a global scale.") AP Human Geography Unit VII. Cities and Urban Land Use Free Response Questions FRQ 1 Rapid urbanization in Least Developed Countries (LDCs) has many profound impacts for the world. Answer the following
AP Human Geography Unit VII. Cities and Urban Land Use Free Response Questions FRQ 1 Rapid urbanization in Least Developed Countries (LDCs) has many profound impacts for the world. Answer the following
Lee County, Alabama 2015 Forecast Report Population, Housing and Commercial Demand
 Lee County, Alabama 2015 Forecast Report Population, Housing and Commercial Demand Thank you for purchasing this report, which contains forecasts of population growth, housing demand and demand for commercial
DOWNLOAD OR READ : MINNEAPOLIS ST PAUL NEIGHBORHOOD MAP PDF EBOOK EPUB MOBI
 DOWNLOAD OR READ : MINNEAPOLIS ST PAUL NEIGHBORHOOD MAP PDF EBOOK EPUB MOBI Page 1 Page 2 minneapolis st paul neighborhood map minneapolis st paul neighborhood pdf minneapolis st paul neighborhood map