Draft exercise for share fair at Bozeman workshop only. This exercise is not ready for distribution. Please send helpful suggestions to
|
|
|
- Hillary Marsh
- 5 years ago
- Views:
Transcription
1 Draft exercise for share fair at Bozeman workshop only. This exercise is not ready for distribution. Please send helpful suggestions to
2 Figure list 1. Trailer photograph 2. Location map chart chart topographic map location for right angle bends in roads topographic map aerial image topographic map topographic map topographic map 11. Aerial image location map 12. Google earth images 1990, 2005, 2009 and Oblique 1997 aerial photograph indicating houses A and B. 14. House A
.")
3 NAME Cape Shoalwater and Washaway Beach May 18, 2012 Cape Shoalwater is on the Washington Coast south of Ocean Shores. This area is home to the communities of North Cove and Tokeland. This exercise looks at the regional setting and investigates both long- and short-term changes that have taken place (Figure 1). We will use topographic maps, aerial photos and nautical charts for this investigation. Figure 1. Trailer that has fallen off the cliff edge as a result of being undercut, at North Cove. Photograph taken April, Regional context Location of Cape Shoalwater Figure 2 is a regional map of the Washington coast, showing Cape Shoalwater at the north side of Willapa Bay. Three rivers feed Willapa Bay: North River, Willapa River, and the Naselle River. Drainage from all of these Rivers is through the mouth of Willapa Bay.

4 Figure 2, western Washington showing the coast. The study area for this exercise is located along the coast at the north edge of Willapa Bay. Image from (downloaded May 10, 2012) The mouth of Willapa Bay is a geologically complex area, influenced by water and sediment input from the rivers, ocean shore processes, and Columbia River littoral cells. The Columbia River forms the western part of the southern boundary of Washington as shown in Figure 1. Willapa Bay and its watershed are not heavily industrialized. There is logging in the hills that surround the bay and form its drainage basin. There are no major dams on any of the rivers feeding the bay, and there is little heavy industry along its shores. This is a cranberry growing region, and it also supports subsistence, recreational, and commercial fishing. North Cove, which is at the north edge of Willapa Bay, is home to the Shoalwater Indian Reservation and numerous rural homes. The small community of Grayland is just north of this area.
5 Nautical Charts Two nautical charts are provided for this section of the exercise. One is from 1912 (Figure 3), and the other is almost a century later in 2006 (Figure 4). Although nautical charts are intended for navigation purposes on water, we can still learn a lot about shore area processes and changes from them. The numbers in water areas represent depths to the bottom of the water (or top of the substrate, if you prefer). The deepest water represents the main channel of the rivers as they empty into the ocean. 1. Study the 1912 chart (Figure 3). Sketch below the general area of the deepest water in relation to the north shore of the bay. It may help to start your sketch at the tic mark that indicates intersection of 124 degrees west longitude and 46 degrees 42 minutes north latitude. 2. Now look at the 2006 chart (Figure 4). Sketch below the region that has the deepest water, from the right side of the map to the mouth of the bay. Once again, it may help to start your sketch at the tic mark that indicates intersection of 124 degrees west longitude and 46 degrees 42 minutes north latitude. 3. How has the main channel changed between 1912 and 2006? What are geologic processes that could have caused these changes? 4. Sketch below a single simple line that represents the main channel in If this channel were a river above sea level, where along the river would there be zones of erosion and where would there be zones of deposition? How do the hypothesized zones of erosion and deposition compare to the location of current shorelines?

6 5. Compare the 1912 (Figure 3) and 2006 (Figure 4) charts. Use the intersection of 124 o 4 W and 46 o 44 N and calculate how far the coast has eroded in the 94 years represented by the two maps. What is the total amount of erosion? What is the annual rate of retreat? Enter these data on the table in question 26. Topographic Maps Four topographic maps are provided for this section. They are from 1938, 1956, 1995 and One question also refers to the 1944 aerial photograph of the area. On the 1938 map, the upper scale is in miles, the middle scale is in yards (on top) and feet (on bottom). The bottom scale is in kilometers. On the 1938 map, note the right angle bend in Smith and Anderson Road, and the right angle bend in the road by the name T Larken (for reference see the small map below). Also note the intersection where Larken Road joins the main north-south highway. Measure directly south from the road bend for each case discussed below. Figure 5, right angle bends for location purposes on topographic maps (1938 base map). 6. On the 1938 map (Figure 6), how far is the right angle bend in Smith & Anderson Road from the shore? 7. Now compare the 1938 map (Figure 6) with the 1944 aerial photograph (Figure 7). a. Has much change taken place in the depiction of the shore between the time of the map (which was based on mapping and photo interpretation in 1937) and the photograph of the image (which was 1942)? b. What is the amount of overall erosion or deposition that has taken place between the 1938 map and the 1944 aerial image? c. What is the annual rate of erosion or deposition between 1937 and 1942 (the times that the map was surveyed and the aerial photography flown)?

7 Figure topographic map.

8 Figure aerial image.
9 8. Refer to the 1956 map (Figure 8). How far is the right angle bend in Smith Anderson Road from the shore? 9. Based on these data and the map data from question 6 above, what is the annual rate of retreat of this shoreline between 1938 and 1956? 10. Refer to the 1995 map (Figure 9). How far is the right angle bend in Smith Anderson Road from the shore? 11. Based on these data, what is the annual rate of retreat of this shoreline between 1956 and 1995? 12. Now refer to the 2011 map (Figure 10). Where is the right angle bend in Smith Anderson Road? 13. Based on these data, what is the annual rate of retreat of this shoreline between 1995 and 2011? 14. Enter your calculated amounts and rates of erosion in the table in question 26 below. Now let s look at the lighthouse story. 15. Use the 1938 map (figure 6). a. Determine the latitude longitude of the lighthouse at the cape. What is it? b. How far is the lighthouse form the shore? c. What is the highest elevation of land near the lighthouse? Based on the 1938 map, speculate on the types of soils and sediments that might exist at the lighthouse and their potential for erosion. d. Plot the location of the 1938 lighthouse on the 2011 topographic map (Figure 10).

10 Figure topographic map.

11 Figure topographic map.

12 Figure topographic map.
13 16. Now use the 1956 topographic map (Figure 8). a. Determine the latitude-longitude of the light in b. Plot the location of the 1956 lighthouse on the 2011 topographic map (Figure 10). c. What has happened to the lighthouse and light sites between 1938 and 1956? Does this confirm or refute your analysis of erodability in question 15c? 17. Now look at the 1995 map (Figure 9). a. A light is shown on the 1995 map, southwest of the words North Cove. How does the location of the light in 1995 compare with the location of the lights in 1938 and 1956? b. Plot the location of the 1995 light on the 2011 topographic map (Figure 10). 18. What has happened between 1956 and 1995? In addition to looking at the lighthouse, it may help to look at the location of the highway. 19. Now refer to the 2011 map (Figure 10). \ a. What has happened between 1995 and 2011? How does this compare with your earlier pairs of maps? b. What suggestions for locating a light (used by boats and ships to mark the entry channel)do your have for this area.
 is a location map that you can use with the rest of the images.")
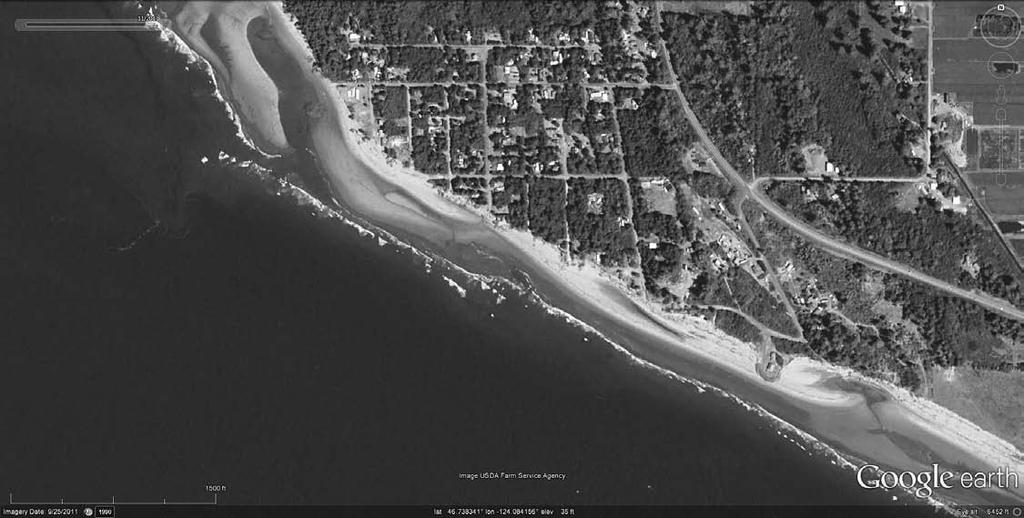
14 Aerial photos and satellite images Four images from Google Earth are used in this part of the coastline analysis. These are from June 20, 1990, July 31, 2005, June 25, 2009 and September 25, There also is an oblique aerial image from The image below (Figure 11) is a location map that you can use with the rest of the images. Point X is the intersection of Spruce and Whipple, and is the point from which erosion measuring should be based. The intersections at points Y and Z are useful fixed points for reference. Figure 11. Location map of North Cove. North is at the top of the map. X is at the intersection of Whipple (the E-W road) and Spruce (the N-S road. 20. Use data from the four figures below (Figures 12a-d) to complete the table below the images. Note that all the images are the same scale, so the scale on the 1990 image can be applied to the other images. North is at the top of all the images.

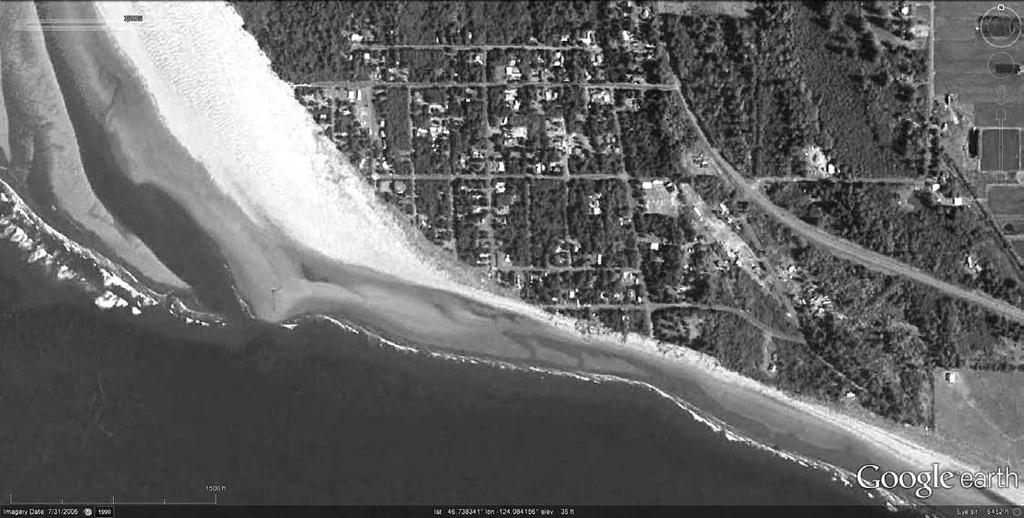
15 Figure 12a, 1990 Figure 12b, 2005

16 Figure 12c, 2009 Figure 12d, 2011
17 Image Distance Point X to shore West along Whipple South along Spruce 21. Based on the data above, fill in the table below to indicate how far the shore retreated for each time span. Years Total retreat Annual rate of retreat E-W (Whipple) N-S (Spruce) E-W (Whipple) N-S (Spruce) Has the annual rate of retreat been the same in E-W and N-S directions? Has the annual rate of retreat remained the same in the 21 years depicted in these images? Explain. 22. About how many houses were lost between 1990 and 2011? 23. About how many roads were lost? 24. The oblique aerial photo below (Figure 13) has two houses indicated on it. Intersection Z is shown for comparison with the earlier images. The image is from downloaded May 18, 2012.

18 Figure 13. Oblique aerial photograph from a. Describe method(s) you can use to make distance estimates on an aerial photo for which no scale is given. Is the scale the same everywhere in the photograph? b. How far from the shore do you estimate House A was in 1997? b. How far from the shore do you estimate House B was in 1997? 25. The home at site A is relatively new construction. How does its location in the 1997 oblique aerial image compare with its location on the 2011 Google Earth image?
19 Synthesis and prognostication 26. What is the range of erosion rates that you have calculated from the different data sets? Complete the table below. Source Years Total erosion Erosion rate (feet per year) Chart Map and photo Topo maps Photos and images Describe the changes in erosion rates through time and different data sources. a. Is the rate of erosion increasing or decreasing through time? b. Compare the erosion data from the different sources. Are the answers from the different data sets similar or different? c. Is there a single data set that is more reliable than the others? Explain. 28. Compare the location of House A with the areas of active retreat from the chart, topographic map, and aerial images. a. Based on your interpretations, do you think that home A is at risk from continued erosion? Explain your analysis. b. House A has been protected by large rocks, known as rip-rap (see Figure 14, photograph of house A from May 2012). These rocks are now serving as a property-specific seawall to protect the house. On a larger scale, however, they might be serving as either a wide groin or perhaps a small rocky headland. How might the protection of this property be influencing erosion or deposition at adjacent properties?

20 Figure 14. House A, looking west southwest from shore, May The owner of house B has been told by an engineer that she is safe from erosion at least until Do you feel, based on your analysis of charts, maps and photos in this lab, that this is correct or not? Explain the basis for your analysis. What additional data would you like to have, if any? 32. Refer to your text or to other resources. Beaches are dynamic zones of moving sand. What do you think are the local sources of sand to these beaches? 33. These beaches are in a zone known as the Columbia River littoral cell. This means that much of the sand along this part of the coast has the Columbia River as its ultimate source. Refer back to the diagram showing all the dams in the Columbia Basin. a. What impacts could the dams be having on sand supply? b. What changes along the coast would you expect as a result of these impacts? 34. After your analysis of the data in this lab: a. What suggestions do you have for local homeowners?
21 b. What suggestions do you have for local, state and national governmental agencies? 35. This exercise has used historical as well as modern maps. Describe the values of using historical images in analysis of geologic hazards.
Introduction to Google Earth
 Introduction to Google Earth Name Goals 1. To become proficient at using the basic features of Google Earth. 2. To recognize differences in coastal features between the east and west coast of North America.
Notes and Summary pages:
 Topographic Mapping 8.9C Interpret topographical maps and satellite views to identify land and erosional features and predict how these shapes may be reshaped by weathering ATL Skills: Communication taking
Geol 117 Lecture 18 Beaches & Coastlines. I. Types of Coastlines A. Definition:
 I. Types of Coastlines A. Definition: 1. Shore = narrow zone where ocean meets land (e.g. beach) 2. Coast is a broad area where both ocean and land processes act a. Includes onshore marshes, dunes, sea
CULTURAL HISTORY Suzzette Fig. 1. Undated Plat Map of Suzzette. Unsigned; probably drawn by J. Lee Chambers.
 CULTURAL HISTORY Suzzette by Neal McLain The map collection at the Brazoria County Historical Museum contains numerous plat maps of property subdivisions. While examining these maps, I ran across two maps
CHAPTER 28. PHYSIOGRAPHY Cook Inlet Drainages
 PEBBLE PROJECT ENVIRONMENTAL BASELINE DOCUMENT 2004 through 2008 CHAPTER 28. PHYSIOGRAPHY Cook Inlet Drainages PREPARED BY: Knight Piésold Ltd. PHYSIOGRAPHY COOK INLET DRAINAGES TABLE OF CONTENTS TABLE
Erosion Information Paper - Barrow, Alaska Current as of September 14, 2007
 U.S. Army Corps of Engineers ALASKA BASELINE EROSION ASSESSMENT Erosion Information Paper - Barrow, Alaska Current as of September 14, 2007 Community Information Barrow (BARE-row, a.k.a. Ukpeagvik), population
NAME DATE TOPOGRAPHIC MAPS. Activity 1: Topographic Map Investigation I: More Than a Road Map
 NAME DATE PARTNER(S) TOPOGRAPHIC MAPS Now you have seen how topographic maps can be generated to present the elevation of a terrain. Let s look at some topographic maps and learn how to interpret them.
Coastal Processes and Shoreline Erosion on the Oregon Coast, Cascade Head to Cape Kiwanda
 State of Oregon Department of Geology and Mineral Industries Vicki S. McConnell, State Geologist Open File Report OFR O-04-11 Coastal Processes and Shoreline Erosion on the Oregon Coast, Cascade Head to
Map 4: Cowal Peninsula: Cluniter to Ardyne Point Map Content Descriptions
 Map 4: Cowal Peninsula: Cluniter to Ardyne Point Map Content Descriptions 1. Built Heritage and Archaeology A total of twenty four sites were recorded in the area covered by Map 4. Of these six were previously
1. Label a few examples of lines of latitude and lines of longitude on the globe above left.
 Oceanography 2 Location, Direction, and Distance on Nautical Charts Please read Appendix III in the textbook for reference. Learning Objectives for the first nautical chart Lab 1. Use the latitude-longitude
The Marine Environment
 The Marine Environment SECTION 16.1 Shoreline Features In your textbook, read about erosional landforms, beaches, estuaries, longshore currents, and rip currents. For each statement below, write true or
Tsunami! Beyond the Book. FOCUS Book
 FOCUS Book Use the engineering design process to design a structure that will protect a coastal town from possible tsunami damage. Brainstorm design ideas for your structure with a group of classmates.
The Marine Environment
 The Marine Environment SECTION 16.1 Shoreline Features In your textbook, read about erosional landforms, beaches, estuaries, longshore currents, and rip currents. For each statement below, write or. 1.
These maps make the idea of elevations and contours more tangible follow any of the brown-line contours; they should form a level path.
 Geology 101 Name(s): Lab 1: Maps and geologic time Note: On all labs, you may work in small groups. You may turn in one lab for all of the group members; make sure that everyone who should get credit is
Surface Processes Focus on Mass Wasting (Chapter 10)
") Surface Processes Focus on Mass Wasting (Chapter 10) 1. What is the distinction between weathering, mass wasting, and erosion? 2. What is the controlling force in mass wasting? What force provides resistance?
Surface Processes Focus on Mass Wasting (Chapter 10) 1. What is the distinction between weathering, mass wasting, and erosion? 2. What is the controlling force in mass wasting? What force provides resistance?
Lab 12 Coastal Geology
 Lab 12 Coastal Geology I. Fluvial Systems Hydrologic Cycle Runoff that flows into rivers = precipitation (rain and snowmelt) [infiltration (loss to groundwater) + evaporation (loss to atmosphere) + transpiration
Erosion Information Paper - South Naknek, Alaska Current as of November 14, 2007
 U.S. Army Corps of Engineers ALASKA BASELINE EROSION ASSESSMENT Erosion Information Paper - South Naknek, Alaska Current as of November 14, 2007 Community Information South Naknek (NACK-neck), originally
Highland Lake Bathymetric Survey
 Highland Lake Bathymetric Survey Final Report, Prepared For: The Town of Highland Lake 612 Lakeshore Drive Oneonta, AL 35121 Prepared By: Tetra Tech 2110 Powers Ferry Road SE Suite 202 Atlanta, GA 30339
Changes to Land 5.7B. landforms: features on the surface of Earth such as mountains, hills, dunes, oceans and rivers
 All the landforms on Earth have changed over time and continue to change. Many of the changes were caused by wind, moving water, and moving ice. Mountains have grown and shrunk. Rivers have cut away land
Think about the landforms where you live. How do you think they have changed over time? How do you think they will change in the future?
 reflect All the landforms on Earth have changed over time and continue to change. Many of the changes were caused by wind, moving water, and moving ice. Mountains have grown and shrunk. Rivers have cut
Create A Watershed Profile
 Name Date Follow the steps below with Chesapeake Bay FieldScope to create a watershed profile for your location. Part 1. Take a trip down your tributaries. Create A Watershed Profile 1. Find your field
APPENDIX A M&T/Llano Seco Long-Term Water Reliability Study These photos are examples of rock spurs in use throughout the United States
 APPENDIX A M&T/Llano Seco Long-Term Water Reliability Study These photos are examples of rock spurs in use throughout the United States Glenn Colusa Irrigation District completed a Sacramento River project
Rising Sea Simulation in Buzzards Bay! Via the Augmented Reality Sandbox
 Rising Sea Simulation in Buzzards Bay! Via the Augmented Reality Sandbox Teacher Copy Concepts: Contour Maps Buzzards Bay Estuary Sea Level change Hurricanes Storm surge/coastal Flooding Human development
COASTAL DYNAMICS VIRTUAL FIELD TRIP, NORTHEAST FLORIDA. Joann Mossa Department of Geography University of Florida
 COASTAL DYNAMICS VIRTUAL FIELD TRIP, NORTHEAST FLORIDA Joann Mossa Department of Geography University of Florida WHERE ARE WE GOING? In NE Florida (Flagler and St. Johns County, south of St. Augustine),
Hiking the Bold Coast, Cutler, Maine
 Maine Geologic Facts and Localities June, 2010 Hiking the Bold Coast, Cutler, Maine 44 o 39 36.34 N, 67 o 12 46.99 W Text by Robert A. Johnston, Department of Agriculture, Conservation & Forestry 1 Map
In 1990, 50% of the U.S. population lived within 75 km of a coast. By 2010, 75% of the U.S. population will live within 75 km of a coast.
 In 1990, 50% of the U.S. population lived within 75 km of a coast. By 2010, 75% of the U.S. population will live within 75 km of a coast. High Tech Methods for Surveying the Deep Sea Floor Fig. 20.18 1
Background Information
 Oceanography LAB #1: Marine Charts and Navigation Background Information Latitude and Longitude A coordinate is an address a means of designating location. Most coordinate systems involve a network of
How to Read These Flood Hazard Maps
 How to Read These Flood Hazard Maps The United States Geological Survey (USGS) has developed the Coastal Storms Modeling System (CoSMoS), which projects coastal flooding and erosion from coastal storms,
Controlling Processes That Change Land
 1 Name Date Controlling Processes That Change Land People try to control some of the processes that change land. To do this, people apply technology- the use of science to solve problems in everyday life.
Developed in Consultation with Florida Educators
 Developed in Consultation with Florida Educators Table of Contents Next Generation Sunshine State Standards Correlation Chart... 7 Benchmarks Chapter 1 The Practice of Science...................... 11
Ch 10 Deposition Practice Questions
 1. Base your answer to the following question on the data table below. Six identical cylinders, A through F, were filled with equal volumes of sorted spherical particles. The data table shows the particle
ICAN Great Lakes Workshop
 Washington Coastal latlas ICAN Great Lakes Workshop September 13 15, 15 2010 Current Washington Coastal Atlas http://www.ecy.wa.gov/programs/sea/sma/atlas_home.html 1 st version of WA Coastal Atlas was
The History of Sea Level Rise in Delaware Bay: SLR has Little Impact on the Morphology of Limulus or its Functional Spawning Habitat
 The History of Sea Level Rise in Delaware Bay: SLR has Little Impact on the Morphology of Limulus or its Functional Spawning Habitat Bob Loveland (Rutgers Univ.) & Mark Botton (Fordham Univ.) There are
Which map shows the stream drainage pattern that most likely formed on the surface of this volcano? A) B)
 B)") 1. When snow cover on the land melts, the water will most likely become surface runoff if the land surface is A) frozen B) porous C) grass covered D) unconsolidated gravel Base your answers to questions
1. When snow cover on the land melts, the water will most likely become surface runoff if the land surface is A) frozen B) porous C) grass covered D) unconsolidated gravel Base your answers to questions
Chapter Review. Things to Know. Objectives. 564 CHAPTER 7 Applications of Trigonometric Functions. Section You should be able to Review Exercises
 564 CHPTER 7 pplications of Trigonometric Functions Chapter Review Things to Know Formulas Law of Sines (p. 5) Law of Cosines (p. 54) sin a = sin b = sin g a b c c = a + b - ab cos g b = a + c - ac cos
Changes in Texas Ecoregions Copy the questions and answers
 Changes in Texas Ecoregions Copy the questions and answers 1. What are some kinds of damage that hurricanes cause? Roads and bridges might be washed away. Trees and power lines can be knocked down. Area
Earth Science Chapter 9. Day 6 - Finish Capillary Action Lab - Quiz over Notes - Review Worksheets over Sections 9.2 and 9.3
 Earth Science Chapter 9 Day 1 Day 2 Day 3 Read Section 9.1 Surface Water Chapter 9 Term Sheet Notes over Section 9.1 Surface Water Section 9.1 Review Worksheets Quiz over Section 9.1 Notes Virtual Lab
6. Mapping the Seafloor
 6. Mapping the Seafloor Centuries ago sailors ventured into unknown oceans to discover new lands. They had no accurate charts or maps to guide them to new places or back to home ports. Imagine how relieved
Erosion and Deposition
 CHAPTER 3 LESSON 2 Erosion and Deposition Landforms Shaped by Water and Wind Key Concepts What are the stages of stream development? How do water erosion and deposition change Earth s surface? How do wind
AS & A2 Geography for OCR. Tailored Courses. Slapton Ley
 AS & A2 Geography for OCR Tailored Courses Slapton Ley Please visit http://www.field-studies-council.org/outdoorclassroom/geography/aqa/ for alternative A-level AQA programmes OVERVIEW Since the assessment
DESIGN ENGINEERING ANALYSIS FOR TERMINAL GROIN LENGTH
 APPENDIX F DESIGN ENGINEERING ANALYSIS FOR TERMINAL GROIN LENGTH (Prepared by Olsen Associates, Inc.) DRAFT Environmental Impact Statement Village of Bald Head Island Shoreline Protection Project Brunswick
Coastal issues: Beaches and Estuaries
 Coastal issues: Beaches and Estuaries Definitions: Coast = broad zone where both marine & terrestrial processes act It includes the beach, lagoons, marshes, bars etc. Coastal processes act to shape the
Geology 109L Lab 3: Modern Sedimentary Environments --Field Trip to Bodega Bay--
 Geology 109L Lab 3: Modern Sedimentary Environments --Field Trip to Bodega Bay-- Goal: The purpose of this lab is to recognize characteristics of modern sedimentary environments, which will aid you in
SHORELINE AND BEACH PROCESSES: PART 2. Implications for Coastal Engineering
 SHORELINE AND BEACH PROCESSES: PART 2 Implications for Coastal Engineering Objectives of the lecture: Part 2 Show examples of coastal engineering Discuss the practical difficulties of ocean engineering
Science 8 - Water Systems Test - Chapters 1-2
 Science 8 - Water Systems Test - Chapters 1-2 Multiple Choice (30 marks) Identify the choice that best completes the statement or answers the question. 1. What percentage represents the amount of fresh
Sediment Deposition LET THE RIVER RUN T E A C H E R. Activity Overview. Activity at a Glance. Time Required. Level of Complexity.
 Activity at a Glance Grade: 6 9 Subject: Science Category: Physical Science, Earth Science Topic: Deposition, River Systems Time Required Two 45-minute periods Level of Complexity Medium Materials* TI-73
Earth processes are dynamic actions that occur both on
 29 Weathering, Erosion, and Deposition R EA D I N G Earth processes are dynamic actions that occur both on the earth s surface and inside the earth. Any process that breaks down earth material, such as
Topographic Maps. More than a Road Map
 Topographic Maps More than a Road Map What is a Topographic Map? Scaled representation of features on the surface of the Earth such as roads, rivers, and plains Provides information about land elevations
Map 2: Cowal Peninsula: Lazaretto Point to Dunoon Harbour North Map Content Descriptions
 Map 2: Cowal Peninsula: Lazaretto Point to Dunoon Harbour North Map Content Descriptions 1. Built Heritage and Archaeology A total of thirteen sites were recorded in the area covered by Map 2. Of these
Cross Boundary Issues
 6 Cross Boundary Issues 6 C R O S S B O U N D A R Y I S S U E S 6.1 Introduction The effects of an activity within the coastal marine area are often felt in adjacent areas, outside of the immediate vicinity
EROSION HAZARD OF MINNESOTA'S LAKE SUPERIOR SHORELINE. Carol A. Johnston Principal Investigator
 EROSION HAZARD OF MINNESOTA'S LAKE SUPERIOR SHORELINE Carol A. Johnston Principal Investigator Maps prepared by: James Salés, John Bonde, Tim Aunan, and Richard Raby Minnesota Sea Grant Research Bulletin
CHAPTER 1. Geo Challenges 1A to 1D. & World Map Activity
 CHAPTER 1 Geo Challenges 1A to 1D & World Map Activity SELECT YOUR CHALLENGE World Map Activity Challenge 1A Challenge 1B Challenge 1C Challenge 1D Challenge 1A WS PG. 2 STEP #1 Label the largest continent
Biosphere. All living things, plants, animals, (even you!) are part of the zone of the earth called the biosphere.
 are part of the zone of the earth called the biosphere.") Unit 1 Study Guide Earth s Spheres Biosphere All living things, plants, animals, (even you!) are part of the zone of the earth called the biosphere. Hydrosphere Water covers ¾ of the earth, made up mostly
Unit 1 Study Guide Earth s Spheres Biosphere All living things, plants, animals, (even you!) are part of the zone of the earth called the biosphere. Hydrosphere Water covers ¾ of the earth, made up mostly
Unit 7.2 W.E.D. & Topography Test
 Name: Score: Unit 7.2 W.E.D. & Topography Test 1. 2. 3. 4. 5. 6. 7. 8. 9. 10. 11. 12. 13. 14. 15. 16. 17. 18. 19. 20. 21. 22. 23. 24. 25. 1. The formation of mountains is due mainly to while the destruction
The Niagara Escarpment extends from western New York, through the GTA all the way up to Manitoulin Island and into Michigan and Wisconsin.
 is southern Ontario s most prominent topographic feature, extending more than 500 kilometres from western New York, through Niagara Falls and the western part of the Greater Toronto Area (GTA), and north
ENGINEERING APPROACHES TO SHORELINE PLACEMENT FROM COAST TO COAST
 ENGINEERING APPROACHES TO SHORELINE PLACEMENT FROM COAST TO COAST 237 237 237 217 217 217 200 200 200 0 0 0 163 163 163 131 132 122 80 119 27 252 174.59 83 36 118 110 135 120 112 92 56 62 102 130 Comparing
The Geology of Sebago Lake State Park
 Maine Geologic Facts and Localities September, 2002 43 55 17.46 N, 70 34 13.07 W Text by Robert Johnston, Department of Agriculture, Conservation & Forestry 1 Map by Robert Johnston Introduction Sebago
Hurricane Harvey: Texas Coastal Erosion Hot Spot Analysis
 Hurricane Harvey: Texas Coastal Erosion Hot Spot Analysis Texas ASBPA Symposium April 24, 2018 Alan Johnson, FEMA Chris Levitz, Compass Agenda Introduction Hurricane Harvey Erosion Hot Spot Analysis Purpose
A BEACH IS A BEACH. Or Is It? Hawaii. St. Croix, US Virgin Islands
 A BEACH IS A BEACH Or Is It? Pt. Reyes, California Western Florida Hawaii AGI What is a beach? Eastern Maine A beach is a strip of shoreline washed by waves and tides. Crane Key, Florida Bay St. Croix,
Supplemental Slides. Shore: Junction of Land & Water. Junction of Land & Water. Sea Level Variations. Shore vs. Coast. Sea Level Variations
 Shore: Junction of Land & Water Supplemental Slides Sediments come off land Most get dumped at the beach Sediment interacts with ocean waves and currents Junction of Land & Water Features: Breaking waves,
Shore: Junction of Land & Water. Sediments come off land Most get dumped at the beach Sediment interacts with ocean waves and currents
 Shore: Junction of Land & Water Supplemental Slides Sediments come off land Most get dumped at the beach Sediment interacts with ocean waves and currents Junction of Land & Water Features: Breaking waves,
Promoting Resilience to Changing Weather
 Promoting Resilience to Changing Weather Harpswell Neck Harpswell Sound Orr s Island Basin Cove Pott s Point Harpswell Conservation Commission March 30, 2017 What Does This Mean for Harpswell? Topography
MAPS AND THEIR CLASSIFICATION
 MAPPING MAPS AND THEIR CLASSIFICATION WHAT IS A MAP? A map is representation of the Earth's surface, showing how things are related to each other by distance, direction, and size. Maps are a way of showing
2 Georgia: Its Heritage and Its Promise
 TERMS region, erosion, fault, elevation, Fall Line, aquifer, marsh, climate, weather, precipitation, drought, tornado, hurricane, wetland, estuary, barrier island, swamp PLACES Appalachian Mountains, Appalachian
Developing a Legally Defensible Setback Ordinance for Bayfield County, Wisconsin June 15, Introduction
 Developing a Legally Defensible Setback Ordinance for Bayfield County, Wisconsin June 15, 2011 Karl Kastrosky 1, Scott Galetka 2, David Mickelson 3, Lisa David 4 Introduction Note: All supporting materials
Geologic Trips San Francisco and the Bay Area
 Excerpt from Geologic Trips San Francisco and the Bay Area by Ted Konigsmark ISBN 0-9661316-4-9 GeoPress All rights reserved. No part of this book may be reproduced without written permission in writing,
Community Erosion Assessment Napakiak, Alaska 15 January 2008
 1. Community: Napakiak, Alaska Community Erosion Assessment Napakiak, Alaska 15 January 2008 Figure 1: Napakiak Location & Vicinity Map 2. Community Profile Summary: Napakiak is a 2 nd class city of 378
Coastal Erosion in Daniel s Harbour
 PT-13: Coastal and Ocean Engineering ENGI.8751 Undergraduate Student Forum Faculty of Engineering and Applied Science, Memorial University, St. john s, NL, Canada March, 2013 Paper Code. (PT-13-Luther)
name and locate the world s seven continents and five oceans
 Subject: Geography Activities National Curriculum Objectives One Progression of Skills Name the 7 continents and 5 oceans 3D Jigsaw task to locate continents and seas name and locate the world s seven
Chapter 3 Erosion and Deposition. The Big Question:
 Chapter 3 Erosion and Deposition The Big Question: 1 Design a way to represent and describe the 4 types of mass movement. You may use pictures, diagrams, list, web, chart, etc 2 Chapter 3: Erosion and
Topographic Maps and Landforms Geology Lab
 Topographic Maps and Landforms Geology Lab Ray Rector: Instructor Today s Lab Activities 1) Discussion of Last Week s Lab 2) Lecture on Topo Maps and Elevation Contours 3) Construct Topographic Maps and
Page 1. Name:
 Name: 1) Which event is the best example of erosion? dissolving of rock particles on a limestone gravestone by acid rain breaking apart of shale as a result of water freezing in a crack rolling of a pebble
Holderness Erosion and Evolution of the Spurn Peninsula
 Holderness Erosion and Evolution of the Spurn Peninsula Prof. Ken Pye and Dr. Simon Blott Kenneth Pye Associates Ltd. Outline of the Presentation Overview of historical erosion trends Effects of coast
Sea-level Rise on Cape Cod: How Vulnerable Are We? Rob Thieler U.S. Geological Survey Woods Hole, MA
 Sea-level Rise on Cape Cod: How Vulnerable Are We? Rob Thieler U.S. Geological Survey Woods Hole, MA Outline Sea-level and coastal processes Past sea-level change Predictions for the future Coastal responses
The Coast: Beaches and Shoreline Processes
 1 2 3 4 5 6 7 8 9 The Coast: es and Shoreline Processes Trujillo & Thurman, Chapter 10 Oceanography 101 Chapter Objectives Recognize the various landforms characteristic of beaches and coastal regions.
Geography Definitions/Sentences
 Geography Definitions/Sentences 1. BEACH 1. The shore of a body of water, especially when sandy or pebbly. 2. The sand or pebbles on a shore. The zone above the water line at a shore of a body of water,
Map 12: Ayrshire Coast: Doonfoot Beach to Dunure Map Content Descriptions
 Map 12: Ayrshire Coast: Doonfoot Beach to Dunure Map Content Descriptions 1. Built Heritage and Archaeology A total of twenty three sites were located in the area covered by Map 12. Of these seventeen
The Coast: Beaches and Shoreline Processes Trujillo & Thurman, Chapter 10
 The Coast: es and Shoreline Processes Trujillo & Thurman, Chapter 10 Oceanography 101 Chapter Objectives Recognize the various landforms characteristic of beaches and coastal regions. Identify seasonal
STAAR Science Tutorial 40 TEK 8.9C: Topographic Maps & Erosional Landforms
 Name: Teacher: Pd. Date: STAAR Science Tutorial 40 TEK 8.9C: Topographic Maps & Erosional Landforms TEK 8.9C: Interpret topographic maps and satellite views to identify land and erosional features and
SECTION G SEDIMENT BUDGET
 SECTION G SEDIMENT BUDGET INTRODUCTION A sediment budget has been constructed for the for the time period 1952-2000. The purpose of the sediment budget is to determine the relative importance of different
ESCI 121 Physical Geology
 Observing Streams & Rivers in Google Earth Dr. Jennifer L. Piatek Dept. of Physics and Earth Sciences Central Connecticut State University 506 Copernicus Hall 1615 Stanley Street New Britain, CT 06050
YEAR 9 (13+) SCHOLARSHIP. February 2014 for entry in September 2014 GENERAL PAPER. Your Name: Your School:
 SCHOLARSHIP. February 2014 for entry in September 2014 GENERAL PAPER. Your Name: Your School:") YEAR 9 (13+) SCHOLARSHIP February 2014 for entry in September 2014 GENERAL PAPER Your Name: Your School: Time allowed: 1 hour 15 minutes (including 5 minutes reading time) Equipment needed: Map and photograph
YEAR 9 (13+) SCHOLARSHIP February 2014 for entry in September 2014 GENERAL PAPER Your Name: Your School: Time allowed: 1 hour 15 minutes (including 5 minutes reading time) Equipment needed: Map and photograph
Report of International Tsunami Expedition to Madagascar August 28 September 12, 2006
 Report of International Tsunami Expedition to Madagascar August 28 September 12, 2006 Participants: Dr. Dallas Abbott- Lamont Doherty Earth Observatory of Columbia University, New York, USA Dr. Edward
Pat Dryer Half Moon Lake: A True Oxbow Lake? Geography 364 April 1 st, 2007
 Pat Dryer Half Moon Lake: A True Oxbow Lake? Geography 364 April 1 st, 2007 Appendix Abstract 2 Introduction 3 Methods 3 Results 3 Discussion 5 Conclusion 11 1 Abstract Half Moon Lake appears to be an
THE TOPOGRAPHY AND GEOLOGY OF THE GRAND PORTAGE^
 THE TOPOGRAPHY AND GEOLOGY OF THE GRAND PORTAGE^ Few areas within the boundaries of Minnesota are of greater historical interest than the region surrounding the Grand Portage, which long before the first
Australian Coastal Councils Conference
 Australian Coastal Councils Conference 11 March 2015 Estimating Future Coastal Inundation and Erosion Hazards Dr Andrew McCowan Dr Christine Lauchlan-Arrowsmith Warwick Bishop Background Victorian Future
CE415L Applied Fluid Mechanics Laboratory
 Applied Fluid Mechanics Laboratory Learning Objective Following completion of this experiment and the analysis of the data, you should be able to 1. generalize results of introducing changes to a natural
MEMORANDUM FOR SWG
 MEMORANDUM FOR SWG-2007-1623 Subject: Jurisdictional Determination (JD) for SWG-2007-1623 on Interdunal Wetlands Adjacent to Traditional Navigable Waters (TNWs) Summary The U.S. Environmental Protection
4. The map below shows a meandering stream. Points A, B, C, and D represent locations along the stream bottom.
 1. Sediment is deposited as a river enters a lake because the A) velocity of the river decreases B) force of gravity decreases C) volume of water increases D) slope of the river increases 2. Which diagram
Module 10: Resources and Virginia Geology Topic 4 Content: Virginia Geology Notes
 Virginia is composed of a very diverse landscape that extends from the beaches and barrier islands all of the way to the highly elevated Appalachian Plateau. Geologists have discovered ancient shallow
Planning for the Future of Humboldt Bay: Sea Level Rise, Sediment Management, Sand Spits and Salt Marshes. Joel Gerwein
 Planning for the Future of Humboldt Bay: Sea Level Rise, Sediment Management, Sand Spits and Salt Marshes Joel Gerwein Introduction to Humboldt Bay Setting Economy, community, and environment Sediment
Importance of Understanding Coastal Landforms
 Importance of Understanding Coastal Landforms Costa Concordia Shipwreck, Isola del Giglio, Italy Depositional Coastal Landforms Can interpret landforms in light of geomorphic processes, both terrestrial
Map 10: Ayrshire Coast: Barassie to Prestwick North Map Content Descriptions
 Map 10: Ayrshire Coast: Barassie to Prestwick North Map Content Descriptions 1. Built Heritage and Archaeology A total of thirteen sites were recorded in the area covered by Map 10. Of these nine were
Monitoring Coastal Change after the Tsunami in Thailand
 IOP Conference Series: Earth and Environmental Science OPEN ACCESS Monitoring Coastal Change after the Tsunami in Thailand To cite this article: W Pantanahiran 2014 IOP Conf. Ser.: Earth Environ. Sci.
A Quantitative Assessment of Human Interventions and Climate Change on the West African sediment budget
 Public Disclosure Authorized Public Disclosure Authorized A Quantitative Assessment of Human Interventions and Climate Change on the West African sediment budget Public Disclosure Authorized The West African
Erosion and Deposition along Rivers and Seashores - Part 1: Modeling in the Classroom
 Erosion and Deposition along Rivers and Seashores - Part 1: Modeling in the Classroom Lesson Focus: Erosion and Deposition Learning Objectives: Students will learn to recognize landforms found on Earth.
Introducing IMS. v) Select the Zoom to Full Extent tool. Did you return to the original view?
 Select the Zoom to Full Extent tool. Did you return to the original view?") Ocean/ENVIR 260, Winter 2006 Lab 1, Get to Know the Puget Sound Watershed Name Introducing IMS 1) Open your web browser and navigate to http://128.208.23.127/website/lab1. (This link can be found on the
Ocean/ENVIR 260, Winter 2006 Lab 1, Get to Know the Puget Sound Watershed Name Introducing IMS 1) Open your web browser and navigate to http://128.208.23.127/website/lab1. (This link can be found on the
KEYWORDS: erosion shoreline change nourishment community issues
 UNC Coastal Studies Institute 1 TITLE: Sand, Soil, Sediment Selection for Beach Nourishment KEYWORDS: erosion shoreline change nourishment community issues ABSTRACT: North Carolina s barrier islands are
GCSE 4242/02 GEOGRAPHY (Specification B) FOUNDATION TIER UNIT 2 SECTION B
 FOUNDATION TIER UNIT 2 SECTION B") Surname Centre Number Candidate Number Other Names 0 GCSE 4242/02 GEOGRAPHY (Specification B) FOUNDATION TIER UNIT 2 SECTION B S15-4242-02 P.M. WEDNESDAY, 3 June 2015 1 hour 30 minutes For s use Part Maximum
Surname Centre Number Candidate Number Other Names 0 GCSE 4242/02 GEOGRAPHY (Specification B) FOUNDATION TIER UNIT 2 SECTION B S15-4242-02 P.M. WEDNESDAY, 3 June 2015 1 hour 30 minutes For s use Part Maximum
Lab Topographic Maps. Name: Partner: Purpose. Background Information
 Lab Topographic Maps Name: Partner: Purpose The purpose of this lab is to familiarize you with graphic representations of the Earth s surface primarily maps. Simple line maps show the spatial relationship