Effective Use of Geographic Maps
|
|
|
- Emily Ford
- 5 years ago
- Views:
Transcription

1 Effective Use of Geographic Maps Purpose This tool provides guidelines and tips on how to effectively use geographic maps to communicate research findings. Format This tool provides guidance on geographic maps and their purposes, and shows examples of preferred practices and practical tips for geographic maps. Audience This tool is designed primarily for researchers from the Model Systems that are funded by the National Institute on Disability, Independent Living, and Rehabilitation Research (NIDILRR). The tool can be adapted by other NIDILRR-funded grantees and the general public. The contents of this tool were developed under a grant from the National Institute on Disability, Independent Living, and Rehabilitation Research (NIDILRR grant number 90DP ). The contents of this fact sheet do not necessarily represent the policy of Department of Health and Human Services, and you should not assume endorsement by the Federal Government. 1
2 Geographic Data Geographic data is interesting and easily-mapped with data visualization software. Geographic maps can reveal important (sometimes hidden) spatial patterns of events or occurrences (such as an unexpectedly high prevalence of birth defects in certain geographic clusters). However, mapped data can often be misleading, especially when the underlying square miles of surface area (such as a county) to be color-coded does not correspond to the number of persons living in such counties (or the number of events occurring in such an area). Just because a data set has geographic elements does not necessarily mean that displaying your data in a map format will be informative or perceptually accurate. Use professional judgment.

3

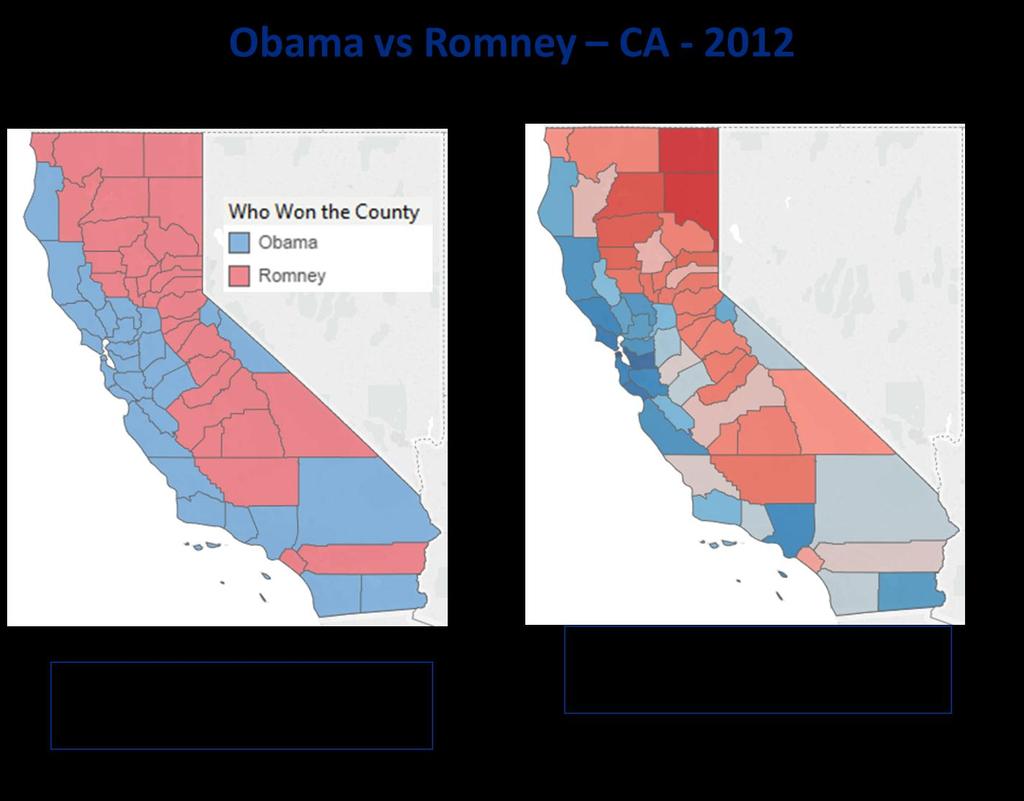
4 Obama vs Romney CA Circles overlying each CA county are color-coded by the relative intensity of votes for Obama vs Romney (percent voting for either Obama or Romney). But, crucially, the size of the circle is proportional to the total votes cast in the county. As such, can see that Obama won substantially in the Los Angeles and San Francisco high-population areas. Romney won many of the smaller population counties (with the exception of San Diego, Orange, Riverside)
5 Geographic Data The frequent disconnect between the geographic area and the population residing therein is often called the Montana effect in which a large geographic area might be home to a relatively small population or conversely the New York City effect in which a very large population resides in a very small geographic area. In either scenario, color-coded nation-wide maps, for example, could easily be misinterpreted. Human perception is drawn to larger areas on a map. As such, viewers almost always notice the color-coding on some of the large geographic counties in AZ and other Western states and often cannot distinguish differences in color-coding the in densely populated Northeast corridor.

6 Geographic Data Note the large Western county effect and the condensed urban corridor effect. Always include a color code for missing or unreliable or unstable data so that a blank county, to use this example, would not be interpreted as having zero suicides. Also decide how and where to place and size AK HI DC PR VI etc. Source: CDC
.")
7 Performance Coding by Geography Can use map-based approaches to display performance results by geography. In this example, each county service agency had an annual minimum expectation that they would provide services to at least 25 persons per 1000 people in their target population (yellow coded). Counties with a service penetration rate of 50 or more per 1000 were coded as exemplary (green). Counties with a service penetration rate below 25 per 1000 (red) were provided technical assistance and improvement plans. Geo-mapping is most effective as interactive data visualizations where users can switch between displaying numeric values vs county names or can click to animate the performance over time, or can drill down and across to other info of interest.

8 Planning by Geography Assessing the best locations for future hospitals in Houston based on projected population growth by ZIP Code and by the presence of existing hospitals.

9 Geography Color Segmenting Adult Smoking Rates 2012 Decide the best approach to color segmentation. Is it most informative to have an equal number of states in each color segment or color segments equally wide or it is more useful to highlight the target outliers and contiguous geographic patterns or are there natural breakpoints for your color segmentation decision or are there thresholds (such as the Healthy People 2020 goals) that you would want to use to color-code state progress. Source: CDC BRFSS
10 Geo-Mapping Ignoring State Size Texas is geographically large in size, Rhode Island is small. Viewers will always notice the color shading for Texas and usually not notice the color shading for Rhode island. If you want all states to be equally noticed, but still want a map-like display, can attempt a map schematic in which each state is represented by an equally-sized square - which can be color-coded and value-labelled. Note that all equal-size state schematics will involve inevitable misalignments of states and their adjacency to one another. But such an approximate display may be useful in certain circumstances. See example map schematic on next slide.

11 Map Schematic With Equal-Sized States Percent Living in Poverty Below 100 FPL All Ages Source: Census - Small Area Income and Poverty Estimates Program
Rural Pennsylvania: Where Is It Anyway? A Compendium of the Definitions of Rural and Rationale for Their Use
 Rural Pennsylvania: Where Is It Anyway? A Compendium of the Definitions of Rural and Rationale for Their Use Pennsylvania Office of Rural Health 310 Nursing Sciences Building University Park, PA 16802
Final Group Project Paper. Where Should I Move: The Big Apple or The Lone Star State
 Final Group Project Paper Where Should I Move: The Big Apple or The Lone Star State By: Nathan Binder, Shannon Scolforo, Kristina Conste, Madison Quinones Main Goal: Determine whether New York or Texas
DRAFT RURAL-URBAN POPULATION CHANGE IN PUERTO RICO, 1990 TO 2000
 DRAFT RURAL-URBAN POPULATION CHANGE IN PUERTO RICO, 1990 TO 2000 Mei-Ling Freeman Geographic Standards and Criteria Branch Geography Division US Census Bureau For presentation at the Western Regional Science
Neighborhood social characteristics and chronic disease outcomes: does the geographic scale of neighborhood matter? Malia Jones
 Neighborhood social characteristics and chronic disease outcomes: does the geographic scale of neighborhood matter? Malia Jones Prepared for consideration for PAA 2013 Short Abstract Empirical research
The Rural Health Workforce. Policy Brief Series. Data and Issues for Policymakers in: Washington Wyoming Alaska Montana Idaho
 The Health Workforce Data and Issues for Policymakers in: Washington Wyoming Alaska Montana Idaho Policy Brief Series ISSUE #1: THE RURAL HEALTH WORKFORCE: CHALLENGES AND OPPORTUNITIES ISSUE #2: THE RURAL
Policy Paper Alabama Primary Care Service Areas
 Aim and Purpose Policy Paper Alabama Primary Care Service Areas Produced by the Office for Family Health Education & Research, UAB School of Medicine To create primary care rational service areas (PCSA)
Tracey Farrigan Research Geographer USDA-Economic Research Service
 Rural Poverty Symposium Federal Reserve Bank of Atlanta December 2-3, 2013 Tracey Farrigan Research Geographer USDA-Economic Research Service Justification Increasing demand for sub-county analysis Policy
Chapter. Organizing and Summarizing Data. Copyright 2013, 2010 and 2007 Pearson Education, Inc.
 Chapter 2 Organizing and Summarizing Data Section 2.1 Organizing Qualitative Data Objectives 1. Organize Qualitative Data in Tables 2. Construct Bar Graphs 3. Construct Pie Charts When data is collected
Environmental Analysis, Chapter 4 Consequences, and Mitigation
 Environmental Analysis, Chapter 4 4.17 Environmental Justice This section summarizes the potential impacts described in Chapter 3, Transportation Impacts and Mitigation, and other sections of Chapter 4,
Finding Common Ground Through GIS
 Finding Common Ground Through GIS Matthew Stone, MPH Special Unit for Technical Assistance Chronic Disease and Injury Control California Department of Public Health ESRI Health GIS Conference Scottsdale,
Intercity Bus Stop Analysis
 by Karalyn Clouser, Research Associate and David Kack, Director of the Small Urban and Rural Livability Center Western Transportation Institute College of Engineering Montana State University Report prepared
GIS and Business Location Analytics
 UNT s course evaluation system (SPOT - Student Perceptions of Teaching) opened on Monday, April 16 and runs through Thursday, May 3. You should have received an email on April 16 providing guidance on
ADDRESSING TITLE VI AND ENVIRONMENTAL JUSTICE IN LONG-RANGE TRANSPORTATION PLANS
 ADDRESSING TITLE VI AND ENVIRONMENTAL JUSTICE IN LONG-RANGE TRANSPORTATION PLANS Activities from the National Capital Region Transportation Planning Board Sergio Ritacco Transportation Planner 2017 Association
GEOGRAPHIC INFORMATION SYSTEMS
 GEOGRAPHIC INFORMATION SYSTEMS 4-H Round-Up Community Transitions Workshop Daniel Hanselka June 14, 2011 Goals of the Workshop Answer the question: What is GIS? Uses of GIS. Some of the Common Terminology
Spatiotemporal Analysis of Commuting Patterns in Southern California Using ACS PUMS, CTPP and LODES
 Spatiotemporal Analysis of Commuting Patterns in Southern California Using ACS PUMS, CTPP and LODES 2017 ACS Data Users Conference May 11-12, 2017 Alexandria, VA Jung Seo, Tom Vo, Frank Wen and Simon Choi
Spatial and Socioeconomic Analysis of Commuting Patterns in Southern California Using LODES, CTPP, and ACS PUMS
 Spatial and Socioeconomic Analysis of Commuting Patterns in Southern California Using LODES, CTPP, and ACS PUMS Census for Transportation Planning Subcommittee meeting TRB 95th Annual Meeting January 11,
APPENDIX V VALLEYWIDE REPORT
 APPENDIX V VALLEYWIDE REPORT Page Intentionally Left Blank 1.2 San Joaquin Valley Profile Geography The San Joaquin Valley is the southern portion of the Great Central Valley of California (Exhibit 1-1).
Regional Performance Measures
 G Performance Measures Regional Performance Measures Introduction This appendix highlights the performance of the MTP/SCS for 2035. The performance of the Revenue Constrained network also is compared to
Spatial Pattern Analysis: Mapping Trends and Clusters
 2013 Esri International User Conference July 8 12, 2013 San Diego, California Technical Workshop Spatial Pattern Analysis: Mapping Trends and Clusters Lauren Rosenshein Bennett Brett Rose Presentation
Hennepin GIS. Tree Planting Priority Areas - Analysis Methodology. GIS Services April 2018 GOAL:
 Hennepin GIS GIS Services April 2018 Tree Planting Priority Areas - Analysis Methodology GOAL: To create a GIS data layer that will aid Hennepin County Environment & Energy staff in determining where to
2/7/2018. Module 4. Spatial Statistics. Point Patterns: Nearest Neighbor. Spatial Statistics. Point Patterns: Nearest Neighbor
 Spatial Statistics Module 4 Geographers are very interested in studying, understanding, and quantifying the patterns we can see on maps Q: What kinds of map patterns can you think of? There are so many
Applying Health Outcome Data to Improve Health Equity
 Applying Health Outcome Data to Improve Health Equity Devon Williford, MPH, Health GIS Specialist Lorraine Dixon-Jones, Policy Analyst CDPHE Health Equity and Environmental Justice Collaborative Mile High
Population Profiles
 U N D E R S T A N D I N G A N D E X P L O R I N G D E M O G R A P H I C C H A N G E MAPPING AMERICA S FUTURES, BRIEF 6 2000 2010 Population Profiles Atlanta, Las Vegas, Washington, DC, and Youngstown Allison
Spatiotemporal Analysis of Commuting Patterns: Using ArcGIS and Big Data
 Spatiotemporal Analysis of Commuting Patterns: Using ArcGIS and Big Data 2017 ESRI User Conference July 13, 2017 San Diego, VA Jung Seo, Tom Vo, Frank Wen and Simon Choi Research & Analysis Southern California
This report details analyses and methodologies used to examine and visualize the spatial and nonspatial
 Analysis Summary: Acute Myocardial Infarction and Social Determinants of Health Acute Myocardial Infarction Study Summary March 2014 Project Summary :: Purpose This report details analyses and methodologies
AFFH-T User Guide September 2017 AFFH-T User Guide U.S. Department of Housing and Urban Development
 AFFH-T User Guide Affirmatively Furthering Fair Housing Data and Mapping Tool v. 4.1 U.S. Department of Housing and Urban Development September 2017 Version 4.1 ❿ September 2017 Page 1 Document History
Regional Performance Measures
 G Performance Measures Regional Performance Measures Introduction This appendix highlights the performance of the MTP/SCS for 2035. The performance of the Revenue Constrained network also is compared to
GIS Spatial Statistics for Public Opinion Survey Response Rates
 GIS Spatial Statistics for Public Opinion Survey Response Rates July 22, 2015 Timothy Michalowski Senior Statistical GIS Analyst Abt SRBI - New York, NY t.michalowski@srbi.com www.srbi.com Introduction
Module 10 Summative Assessment
 Module 10 Summative Assessment Activity In this activity you will use the three dimensions of vulnerability that you learned about in this module exposure, sensitivity, and adaptive capacity to assess
2011 Clendening Summer Fellowship Proposal. Describing the Patient Experience Using Geographic Information Systems
 2011 Clendening Summer Fellowship Proposal Describing the Patient Experience Using Geographic Information Systems Introduction The following proposal outlines my project for a 2011 Clendening Summer Fellowship.
THE ROBERT GRAHAM CENTER
 THE ROBERT GRAHAM CENTER UDS Mapper User Guide October 1, 2012 Page ii Table of Contents Introduction... 1 Who built the UDS Mapper?... 1 Why was the UDS Mapper developed?... 1 How will the UDS Mapper
Encapsulating Urban Traffic Rhythms into Road Networks
 Encapsulating Urban Traffic Rhythms into Road Networks Junjie Wang +, Dong Wei +, Kun He, Hang Gong, Pu Wang * School of Traffic and Transportation Engineering, Central South University, Changsha, Hunan,
ODOR FOOTPRINTS AND THE ODOR FOOTPRINT TOOL
 ODOR FOOTPRINTS AND THE ODOR FOOTPRINT TOOL An Overview Introduction: As animal production has changed and the facilities in which livestock and poultry are raised have grown in size, neighbors of animal
The Church Demographic Specialists
 The Church Demographic Specialists Easy-to-Use Features Map-driven, Web-based Software An Integrated Suite of Information and Query Tools Providing An Insightful Window into the Communities You Serve Key
Spatial Variation in Local Road Pedestrian and Bicycle Crashes
 2015 Esri International User Conference July 20 24, 2015 San Diego, California Spatial Variation in Local Road Pedestrian and Bicycle Crashes Musinguzi, Abram, Graduate Research Assistant Chimba,Deo, PhD.,
Hampshire County Food Access Map
 Hampshire County Food Access Map v. 4/20/17 Hampshire County Food Access Map https://tinyurl.com/gqebkxx Overview The Hampshire County Food Access Map is an online map available at https://tinyurl.com/gqebkxx
Internet GIS Sites. 2 OakMapper webgis Application
 Internet GIS Sites # Name URL Description 1 City of Sugar Land http://www.sugarlandtx.gov/index.htm It is a city in Texas with 65,000 Residents. The City of Sugar Land, Texas, provides ArcIMS-based maps
BROOKINGS May
 Appendix 1. Technical Methodology This study combines detailed data on transit systems, demographics, and employment to determine the accessibility of jobs via transit within and across the country s 100
Using ArcGIS Server to Bring Geospatial Analysis
 Using ArcGIS Server to Bring Geospatial Analysis and Mapping to non-gis Analysts ESRI Health User Conference September 22, 2009 Jim Laramie, Altarum Institute Sam Wang, Altarum Institute Agenda Agenda
User Guide. Affirmatively Furthering Fair Housing Data and Mapping Tool. U.S. Department of Housing and Urban Development
 User Guide Affirmatively Furthering Fair Housing Data and Mapping Tool U.S. Department of Housing and Urban Development December, 2015 1 Table of Contents 1. Getting Started... 5 1.1 Software Version...
CHANGES IN ETHNIC GEOGRAPHY IN WATERBURY AS A RESULT OF NATURAL DISASTERS AND URBAN RENEWAL
 G-1302: GIS and Environmental Modeling Final Project Report December 4, 2012 Student: David Perrier Instructor: Tatiana Serebriakova, Ph.D. CHANGES IN ETHNIC GEOGRAPHY IN WATERBURY AS A RESULT OF NATURAL
Can we map ACS data with confidence?
 ACS User Conference, 2017 Alexandria, VA May 11-12, 2017 Can we map ACS data with confidence? David W Wong & Min Sun George Mason University Research reported in this presentation was partly supported
Local Economic Activity Around Rapid Transit Stations
 Local Economic Activity Around Rapid Transit Stations The Case of Chicago s Orange Line Julie Cooper, MPP 2014 Harris School of Public Policy Transport Chicago June 6, 2014 Motivation Impacts of transit
Advancing Urban Models in the 21 st Century. Jeff Tayman Lecturer, Dept. of Economics University of California, San Diego
 Advancing Urban Models in the 21 st Century Jeff Tayman Lecturer, Dept. of Economics University of California, San Diego 1 Regional Decision System Better tools Better data Better access Better Decisions
Section 2. Indiana Geographic Information Council: Strategic Plan
 Section 2. Indiana Geographic Information Council: Strategic Plan Introduction A geographic information system (GIS) is an automated tool that allows the collection, modification, storage, analysis, and
2009 ESRI User Conference San Diego, CA
 Guillaume Turcotte GIS Laboratory Technician Villanova University Determining Factors in the Siting of Undesirable Land Uses 2009 ESRI User Conference San Diego, CA Introduction and Literature Review Warren
A Comprehensive Method for Identifying Optimal Areas for Supermarket Development. TRF Policy Solutions April 28, 2011
 A Comprehensive Method for Identifying Optimal Areas for Supermarket Development TRF Policy Solutions April 28, 2011 Profile of TRF The Reinvestment Fund builds wealth and opportunity for lowwealth communities
Transferability of Household Travel Data Across Geographic Areas Using NHTS 2001
 Transferability of Household Travel Data Across Geographic Areas Using NHTS 2001 Jane Lin PhD Assistant Professor Department of Civil and Materials Engineering Institute for Environmental Science and Policy
Defining Statistically Significant Spatial Clusters of a Target Population using a Patient-Centered Approach within a GIS
 Defining Statistically Significant Spatial Clusters of a Target Population using a Patient-Centered Approach within a GIS Efforts to Improve Quality of Care Stephen Jones, PhD Bio-statistical Research
SOUTH COAST COASTAL RECREATION METHODS
 SOUTH COAST COASTAL RECREATION METHODS A customized, web-based survey instrument, which utilizes Point 97 s Viewpoint survey and mapping technology, was used to collect spatially explicit data on coastal
CRP 608 Winter 10 Class presentation February 04, Senior Research Associate Kirwan Institute for the Study of Race and Ethnicity
 CRP 608 Winter 10 Class presentation February 04, 2010 SAMIR GAMBHIR SAMIR GAMBHIR Senior Research Associate Kirwan Institute for the Study of Race and Ethnicity Background Kirwan Institute Our work Using
Using the ACS to track the economic performance of U.S. inner cities
 Using the ACS to track the economic performance of U.S. inner cities 2017 ACS Data Users Conference May 11, 2017 Austin Nijhuis, Senior Research Analyst Initiative for a Competitive Inner (ICIC) ICIC ICIC
Life, Physical, and Social Science Occupations in Allegheny County
 Life, Physical, and Social Science Occupations in Allegheny County 2015-2025 1 Life, Physical, and Social Science Occupations Regions Code Description 42003 Allegheny County, PA Timeframe 2015-2025 Datarun
Desktop GIS for Geotechnical Engineering
 Desktop GIS for Geotechnical Engineering Satya Priya Deputy General Manager (Software) RMSI, A-7, Sector 16 NOIDA 201 301, UP, INDIA Tel: +91-120-2511102 Fax: +91-120-2510963 Email: Satya.Priya@rmsi.com
Purpose Study conducted to determine the needs of the health care workforce related to GIS use, incorporation and training.
 GIS and Health Care: Educational Needs Assessment Cindy Gotz, MPH, CHES Janice Frates, Ph.D. Suzanne Wechsler, Ph.D. Departments of Health Care Administration & Geography California State University Long
Trouble-Shooting Coordinate System Problems
 Trouble-Shooting Coordinate System Problems Written by Barbara M. Parmenter, revised 2/25/2014 OVERVIEW OF THE EXERCISE... 1 COPYING THE MAP PROJECTION EXERCISE FOLDER TO YOUR H: DRIVE OR DESKTOP... 2
The econ Planning Suite: CPD Maps and the Con Plan in IDIS for Consortia Grantees Session 1
 The econ Planning Suite: CPD Maps and the Con Plan in IDIS for Consortia Grantees Session 1 1 Training Objectives Use CPD Maps to analyze, assess, and compare levels of need in your community Use IDIS
1Department of Demography and Organization Studies, University of Texas at San Antonio, One UTSA Circle, San Antonio, TX
 Well, it depends on where you're born: A practical application of geographically weighted regression to the study of infant mortality in the U.S. P. Johnelle Sparks and Corey S. Sparks 1 Introduction Infant
Medical GIS: New Uses of Mapping Technology in Public Health. Peter Hayward, PhD Department of Geography SUNY College at Oneonta
 Medical GIS: New Uses of Mapping Technology in Public Health Peter Hayward, PhD Department of Geography SUNY College at Oneonta Invited research seminar presentation at Bassett Healthcare. Cooperstown,
Python Scripting for Regional Land Use Data Management and QC Workflow
 Python Scripting for Regional Land Use Data Management and QC Workflow 2015 ESRI User Conference July 21, 2015 San Diego, CA Jung Seo, Frank Wen, Simon Choi and Tom Vo Research & Analysis Southern California
DATA DISAGGREGATION BY GEOGRAPHIC
 PROGRAM CYCLE ADS 201 Additional Help DATA DISAGGREGATION BY GEOGRAPHIC LOCATION Introduction This document provides supplemental guidance to ADS 201.3.5.7.G Indicator Disaggregation, and discusses concepts
Measuring Geographic Access to Primary Care Physicians
 Measuring Geographic Access to Primary Care Physicians The New Mexico Health Policy Commission and the University of New Mexico s Division of Government Research have been working cooperatively to collect
ES1 Investigating Weather Maps/Station Models Act# 10 Name Block Date
 yay, bonus pt. because oops, no HO, book, heading this date =MP ES1 Investigating Weather Maps/Station Models Act# 10 Name Block Date Weather INTRODUCTION: Weather maps combine meteorological data from
Geospatial Analysis of Job-Housing Mismatch Using ArcGIS and Python
 Geospatial Analysis of Job-Housing Mismatch Using ArcGIS and Python 2016 ESRI User Conference June 29, 2016 San Diego, CA Jung Seo, Frank Wen, Simon Choi and Tom Vo, Research & Analysis Southern California
Online Robustness Appendix to Endogenous Gentrification and Housing Price Dynamics
 Online Robustness Appendix to Endogenous Gentrification and Housing Price Dynamics Robustness Appendix to Endogenous Gentrification and Housing Price Dynamics This robustness appendix provides a variety
An Overview of Solving Spatial Problems Using ArcGIS
 Esri International User Conference San Diego, CA Technical Workshops An Overview of Solving Spatial Problems Using ArcGIS Linda Beale, Jian Lange July 12 th, 2011 Real World Example Using Spatial Analysis
Section III: Poverty Mapping Results
 Section III: Poverty Mapping Results Figure 5: Gewog level rural poverty map 58. The most prominent result from the poverty mapping exercise of Bhutan is the production of a disaggregated poverty headcount
Census Transportation Planning Products (CTPP)
") Census Transportation Planning Products (CTPP) Penelope Weinberger CTPP Program Manager - AASHTO September 15, 2010 1 What is the CTPP Program Today? The CTPP is an umbrella program of data products, custom
Census Transportation Planning Products (CTPP) Penelope Weinberger CTPP Program Manager - AASHTO September 15, 2010 1 What is the CTPP Program Today? The CTPP is an umbrella program of data products, custom
22 cities with at least 10 million people See map for cities with red dots
 22 cities with at least 10 million people See map for cities with red dots Seven of these are in LDC s, more in future Fastest growing, high natural increase rates, loss of farming jobs and resulting migration
EXAMINING THE DEMOGRAPHICS OF THE DOG RIVER WATERSHED
 EXAMINING THE DEMOGRAPHICS OF THE DOG RIVER WATERSHED Phillip B. Whatley, Department of Earth Sciences, University of South Alabama, Mobile, AL, 36688. Email: pbw401@jaguar1.usouthal.edu. Examining the
Massachusetts Institute of Technology Department of Urban Studies and Planning
 Massachusetts Institute of Technology Department of Urban Studies and Planning 11.204: Planning, Communications & Digital Media Fall 2002 Lecture 6: Tools for Transforming Data to Action Lorlene Hoyt October
INDOT Office of Traffic Safety
 Intro to GIS Spatial Analysis INDOT Office of Traffic Safety Intro to GIS Spatial Analysis INDOT Office of Traffic Safety Kevin Knoke Section 130 Program Manager Highway Engineer II Registered Professional
Enrichment. Letter Frequency Letter Frequency Letter Frequency a j s b k t c l u d 11 m v e n 17 w f o x g p y h 9 q z i r 20
 2-1 Linguistic Statistics Linguistics is the study of human speech. The activity on this page shows the type of data collection and analysis that might be done by a linguist who is researching the structure
2/25/2019. Taking the northern and southern hemispheres together, on average the world s population lives 24 degrees from the equator.
 Where is the world s population? Roughly 88 percent of the world s population lives in the Northern Hemisphere, with about half north of 27 degrees north Taking the northern and southern hemispheres together,
2014 Planning Database (PDB)
") 2014 Planning Database (PDB) November 19, 2014 Barbara O Hare, Nancy Bates, Julia Coombs, Travis Pape, Chandra Erdman Office of Survey Analytics 1 Overview Tract and Block Group PDBs Useful for: Identifying
2014 Planning Database (PDB) November 19, 2014 Barbara O Hare, Nancy Bates, Julia Coombs, Travis Pape, Chandra Erdman Office of Survey Analytics 1 Overview Tract and Block Group PDBs Useful for: Identifying
JOINT STRATEGIC NEEDS ASSESSMENT (JSNA) Key findings from the Leicestershire JSNA and Charnwood summary
 Key findings from the Leicestershire JSNA and Charnwood summary") JOINT STRATEGIC NEEDS ASSESSMENT (JSNA) Key findings from the Leicestershire JSNA and Charnwood summary 1 What is a JSNA? Joint Strategic Needs Assessment (JSNA) identifies the big picture in terms of
JOINT STRATEGIC NEEDS ASSESSMENT (JSNA) Key findings from the Leicestershire JSNA and Charnwood summary 1 What is a JSNA? Joint Strategic Needs Assessment (JSNA) identifies the big picture in terms of
The History Behind Census Geography
 The History Behind Census Geography Michael Ratcliffe Geography Division US Census Bureau Kentucky State Data Center Affiliate Meeting August 5, 2016 Today s Presentation A brief look at the history behind
EXPLORATORY SPATIAL DATA ANALYSIS OF BUILDING ENERGY IN URBAN ENVIRONMENTS. Food Machinery and Equipment, Tianjin , China
 EXPLORATORY SPATIAL DATA ANALYSIS OF BUILDING ENERGY IN URBAN ENVIRONMENTS Wei Tian 1,2, Lai Wei 1,2, Pieter de Wilde 3, Song Yang 1,2, QingXin Meng 1 1 College of Mechanical Engineering, Tianjin University
Integrating GIS into Food Access Analysis
 GIS Day at Kansas University Integrating GIS into Food Access Analysis Daoqin Tong School of Geography and Development Outline Introduction Research questions Method Results Discussion Introduction Food
Texas A&M University
 Texas A&M University CVEN 658 Civil Engineering Applications of GIS Hotspot Analysis of Highway Accident Spatial Pattern Based on Network Spatial Weights Instructor: Dr. Francisco Olivera Author: Zachry
GIS for Integrated Pest Management. Christina Hailey. Abstract:
 GIS for Integrated Pest Management Christina Hailey Abstract: At its formation in 1965, Harris County Mosquito Control (Houston, Texas) (HCMC) was primarily involved in the prevention and control of mosquito-borne
APPENDIX PHASE 1 GREEN INFRASTRUCTURE FRAMEWORK
 APPENDIX PHASE 1 GREEN INFRASTRUCTURE FRAMEWORK KANSAS MISSOURI CONTENTS A DATA WISHLIST 4 B PRECEDENTS 7 C WORKSHOP MATERIALS 13 D ANALYSIS PROCESS 124 E ATLAS & PLAYBOOK DETAILS 156 F POLICY ANALYSIS
Geography and Usability of the American Community Survey. Seth Spielman Assistant Professor of Geography University of Colorado
 Geography and Usability of the American Community Survey Seth Spielman Assistant Professor of Geography University of Colorado Goals 1. To convince you that the margins of error from the American Community
Using American Factfinder
 Using American Factfinder What is American Factfinder? American Factfinder is a search engine that provides access to the population, housing and economic data collected by the U.S. Census Bureau. It can
Trouble-Shooting Coordinate System Problems
 Trouble-Shooting Coordinate System Problems Written by Barbara M. Parmenter. Revised on October 2, 2018 OVERVIEW OF THE EXERCISE... 1 COPYING THE MAP PROJECTION EXERCISE FOLDER TO YOUR H: DRIVE OR DESKTOP...
Mapping Data 1: Constructing a Choropleth Map
 Mapping Data 1: Constructing a Choropleth Map OVERVIEW & OBJECTIVES Students will become acquainted with mapping data and understanding the importance of recognizing patterns by constructing a choropleth
GIS Lecture 5: Spatial Data
 GIS Lecture 5: Spatial Data GIS 1 Outline Vector Data Formats Raster Data Formats Map Projections Coordinate Systems US Census geographic files US Census data files GIS Data Sources GIS 2 Vector Data Formats
How Usable are Current GIS Maps?: Communicating Emergency Preparedness to Urban Populations
 How Usable are Current GIS Maps?: Communicating Emergency Preparedness to Urban Populations Christina Zarcadoolas PhD, Jennefer Boyer MPH, Arthi Krishnaswami MA, Andrea Rothenberg, MS, LCSW Mount Sinai
Land cover modeling in the Travis County
 Land cover modeling in the Travis County Contents Introduction.1 Data collection 3 Data pre-processing 6 Land cover modeling 12 Final considerations 13 Prepared for: GIS and Water Resources By Julie C
15.0 Operations and Maintenance Cost Calculations
 15.0 Operations and Maintenance Cost Calculations 15.1 Introduction Operations and Maintenance (O&M) costs were calculated for each of the four alternatives being considered in the analysis. No Build Alternative
The Coastal Change Analysis Program and the Land Cover Atlas. Rebecca Love NOAA Office for Coastal Management
 The Coastal Change Analysis Program and the Land Cover Atlas Rebecca Love NOAA Office for Coastal Management Natural Infrastructure = Greater Resilience NOAA C-CAP Regional Land Cover and Change coast.noaa.gov/digitalcoast/data/ccapregional
Assessing Social Vulnerability to Biophysical Hazards. Dr. Jasmine Waddell
 Assessing Social Vulnerability to Biophysical Hazards Dr. Jasmine Waddell About the Project Built on a need to understand: The pre-disposition of the populations in the SE to adverse impacts from disaster
Map your way to deeper insights
 Map your way to deeper insights Target, forecast and plan by geographic region Highlights Apply your data to pre-installed map templates and customize to meet your needs. Select from included map files
CONSTRUCTING THE POVERTY AND OPPORTUNITIES/PUBLIC SERVICES MAPS INFORMATION MANAGEMENT. Background: Brazil Without Extreme Poverty Plan
 INFORMATION MANAGEMENT CONSTRUCTING THE POVERTY AND OPPORTUNITIES/PUBLIC SERVICES MAPS Background: Brazil Without Extreme Poverty Plan The Brazil Without Extreme Poverty Plan (BSM), designed to overcome
C) Discuss two factors that are contributing to the rapid geographical shifts in urbanization on a global scale.
 Discuss two factors that are contributing to the rapid geographical shifts in urbanization on a global scale.") AP Human Geography Unit VII. Cities and Urban Land Use Free Response Questions FRQ 1 Rapid urbanization in Least Developed Countries (LDCs) has many profound impacts for the world. Answer the following
AP Human Geography Unit VII. Cities and Urban Land Use Free Response Questions FRQ 1 Rapid urbanization in Least Developed Countries (LDCs) has many profound impacts for the world. Answer the following
Exercise - INSTRUCTIONS
 Learning module: Introduction to Qlik GeoAnalytics Exercise - INSTRUCTIONS Using the Example Download instructions on the right, open the IntroQlikGeoAnalytics_Exercise example in Qlik Sense Desktop and
Summary Description Municipality of Anchorage. Anchorage Coastal Resource Atlas Project
 Summary Description Municipality of Anchorage Anchorage Coastal Resource Atlas Project By: Thede Tobish, MOA Planner; and Charlie Barnwell, MOA GIS Manager Introduction Local governments often struggle
Spatial Trends of unpaid caregiving in Ireland
 Spatial Trends of unpaid caregiving in Ireland Stamatis Kalogirou 1,*, Ronan Foley 2 1. NCG Affiliate, Thoukididi 20, Drama, 66100, Greece; Tel: +30 6977 476776; Email: skalogirou@gmail.com; Web: http://www.gisc.gr.
Appendixx C Travel Demand Model Development and Forecasting Lubbock Outer Route Study June 2014
 Appendix C Travel Demand Model Development and Forecasting Lubbock Outer Route Study June 2014 CONTENTS List of Figures-... 3 List of Tables... 4 Introduction... 1 Application of the Lubbock Travel Demand
Environmental Justice Analysis
 Environmental Justice Analysis October 2013 Transportation Department Environmental Justice Analysis Background The U.S. Environmental Protection Agency (EPA) defines environmental justice as the fair